Market Neutral V1 - Opalesque
43
Zenith Sector Review Australian Equity Market Neutral Sector Report January 2012
Transcript of Market Neutral V1 - Opalesque

Zenith Sector Review
Australian Equity Market Neutral Sector Report
January 2012
2
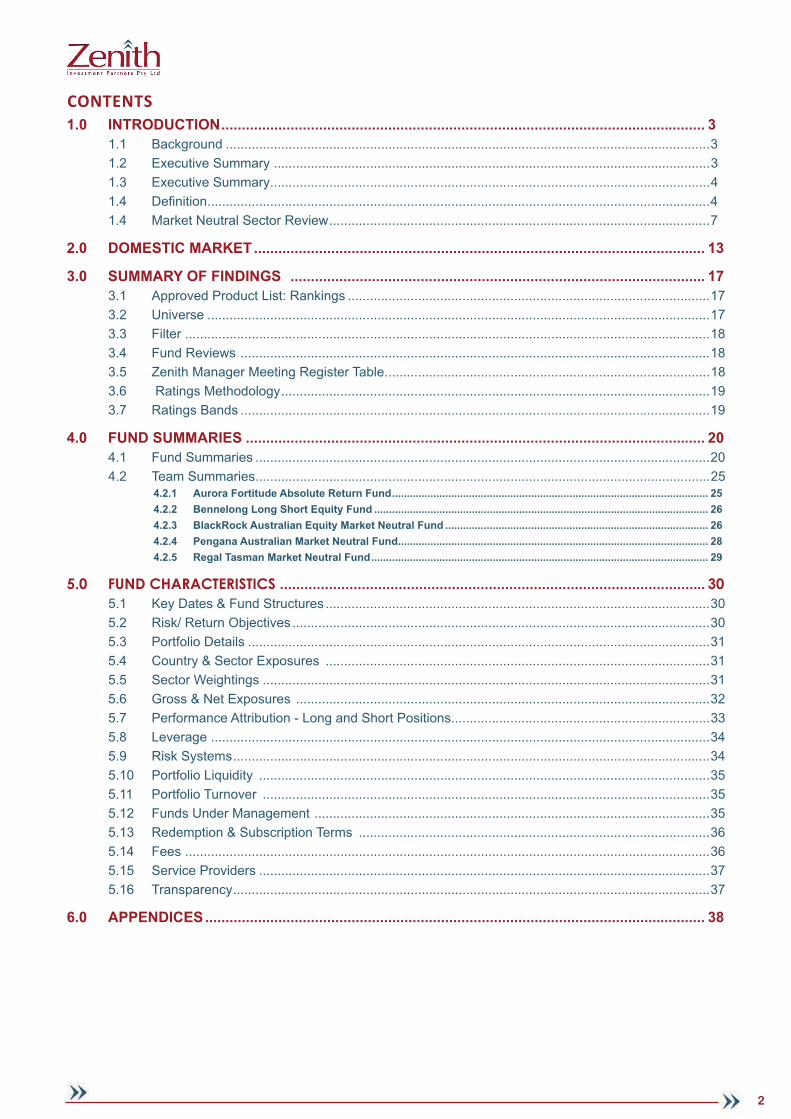
CONTENTS1.0 INTRODUCTION ....................................................................................................................... 3
1.1 Background ...................................................................................................................................31.2 Executive Summary ......................................................................................................................31.3 Executive Summary .......................................................................................................................41.4 Defi nition ........................................................................................................................................41.4 Market Neutral Sector Review .......................................................................................................7
2.0 DOMESTIC MARKET ............................................................................................................... 13
3.0 SUMMARY OF FINDINGS ...................................................................................................... 173.1 Approved Product List: Rankings ..................................................................................................173.2 Universe ........................................................................................................................................173.3 Filter ..............................................................................................................................................183.4 Fund Reviews ...............................................................................................................................183.5 Zenith Manager Meeting Register Table ........................................................................................183.6 Ratings Methodology ....................................................................................................................193.7 Ratings Bands ...............................................................................................................................19
4.0 FUND SUMMARIES ................................................................................................................. 204.1 Fund Summaries ...........................................................................................................................204.2 Team Summaries ...........................................................................................................................25
4.2.1 Aurora Fortitude Absolute Return Fund ........................................................................................................... 254.2.2 Bennelong Long Short Equity Fund ................................................................................................................. 264.2.3 BlackRock Australian Equity Market Neutral Fund ......................................................................................... 264.2.4 Pengana Australian Market Neutral Fund......................................................................................................... 284.2.5 Regal Tasman Market Neutral Fund .................................................................................................................. 29
5.0 FUND CHARACTERISTICS ........................................................................................................ 305.1 Key Dates & Fund Structures ........................................................................................................305.2 Risk/ Return Objectives .................................................................................................................305.3 Portfolio Details .............................................................................................................................315.4 Country & Sector Exposures ........................................................................................................315.5 Sector Weightings .........................................................................................................................315.6 Gross & Net Exposures ................................................................................................................325.7 Performance Attribution - Long and Short Positions ......................................................................335.8 Leverage .......................................................................................................................................345.9 Risk Systems .................................................................................................................................345.10 Portfolio Liquidity ..........................................................................................................................355.11 Portfolio Turnover .........................................................................................................................355.12 Funds Under Management ...........................................................................................................355.13 Redemption & Subscription Terms ...............................................................................................365.14 Fees ..............................................................................................................................................365.15 Service Providers ..........................................................................................................................375.16 Transparency .................................................................................................................................37
6.0 APPENDICES ........................................................................................................................... 38

3
1.0 INTRODUCTION
1.1 BackgroundTo ensure that the Australian market is provided with information on the “best of breed” hedge funds available, Zenith provides in-depth and comprehensive due diligence on the following categories:
• Equity Market Neutral;
• CTA/Global Macro;
• Alternative Fixed Income;
• Fund of Hedge Fund/Multi Strategy;
• Equity Long/Short – Domestic;
• Equity Long/Short – Global; and
• Event Driven.
This report provides the output of Zenith’s 2011 Equity Market Neutral Review. We present our fi ndings on fi ve of the best market neutral funds offered to Australian investors. The report highlights key characteristics of the funds and provides a comprehensive performance review. We also outline the universe screening and qualitative due diligence process that assists in compiling our Approved Product List.
One of the key highlights of market neutral funds is the range of different strategies employed within the sector. Our list of approved products includes quantitative managers, fundamental stock pickers and a relative value strategy. This results in a list of funds which have limited correlation to the broader equity market, but also importantly, limited correlation to each other.
The appendix contains a comprehensive profi le of fund characteristics with summaries of each fund provided. Additionally, it includes tables containing the fund objectives, liquidity, leverage, fees, redemption/subscription terms, funds under management and service providers for easier comparison of fund characteristics.
The alternative research team at Zenith in 2011/12 employs fi ve full time resources. With a large team it allows us to provide in-depth research to our clients. The output of our research is being increasingly used in constructing alternative portfolios for Australian and offshore investors.
1.2 Execu� ve Summary At the completion of reviews, Zenith placed fi ve products on its approved list:
FUND RATING
Aurora Fortitude Absolute Return Fund Highly Recommended
Bennelong Long Short Equity Fund Highly Recommended
BlackRock Australian Equity Market Neutral Fund Highly Recommended
Pengana Australian Market Neutral Fund Approved
Regal Tasman Market Neutral Fund Highly Recommended

4
1.3 Execu� ve SummaryAustralian Market Neutral Funds offer some of the best investment opportunities
“It is not whether you’re right or wrong that’s important, but how much money you make when you are right and how much money you lose when you’re wrong.” George Soros
The Australian investment options are known to most of our readers. But one strategy appears to have been missed. We demonstrate in this report that Australian market neutral funds not only provide capital preservation and more reasonable participation in alpha than the average long only Australian equity fund but also are among best performing strategies we globally. This is not to say that manager selection is not important – it is. But we believe that adopting a top down view allows the identifi cation of investment opportunities. The Zenith ‘Rated’ Market Neutral Funds 2011, as a group, returned a cumulative return of 104.7% in the fi ve years to November 2011 (net of fees). Over the same time the broad Australian market has cost investors 23.3%.
The funds included in this review hunt for returns in mainly the largest end of the Australian equity market, yet outperformance and capital preservation from the market neutral funds demonstrates signifi cant value for investors.
On the issue of fees, while it is true hedge funds charge higher fees and their MER’s are higher but they provide signifi cantly more participation in alpha than benchmark aware managers on the active portion of their portfolios. In fact in this, the second market neutral report we clearly demonstrate that good hedge fund managers are receiving a smaller proportion of alpha than average long only funds.
There is demonstrable portfolio improvement that is available by using market neutral funds in a traditional equity allocation. This fact has not gone unnoticed, with large international pension funds allocating to long short and market neutral funds from their active and passive equity pools. This trend is one that we believe will feature more and more in SMSF and family offi ce portfolios in Australia.
However, we believe many Australian investors will agree with the following quote from Marc Faber and cautiously add alternative investments to their portfolios.
“In the world of investment management, it is far better to fail very badly in a conventional way and lose a great deal of money for your client than to lose a little in an unconventional fashion.’
While we all know that Einstein thought that positive compounding as mankind’s best invention, the long only investment style is still the dominant paradigm. Perhaps one day, before all of the market neutral capacity has all gone to offshore investors domestic advisors and their clients will look to utilise the rich investment talents available locally.
1.4 De� ni� onThe Defi nition of Market Neutral Strategies
A market neutral strategy is one that seeks to profi t from both increasing and decreasing prices in single multiple markets. Market neutral strategies are often attained by taking matching and long and short positions in different stocks. This increases the returns from making good stock selections whilst simultaneously reducing the exposure to broad market movements, otherwise known as beta neutral.
Market neutral strategists may employ a range of tools such as merger arbitrage, pairs trading and shorting sectors. There is no single accepted method for employing a market neutral strategy.
Managers who hold a market neutral position are able to exploit market momentum. Hedge funds commonly take a market-neutral position because they are focused on absolute as opposed to relative returns. A market-neutral position may involve taking a 50/50 long/short positions in a particularly industry or taking the same position in the broader market.
Equity market neutral managers can be divided into two broad categories; fundamental arbitrage and statistical arbitrage. The former trades on a fundamental view whereas the latter uses quantitative models to create long and short portfolios. Pairs trading can be an example of fundamental arbitrage or statistical arbitrage. In fundamental arbitrage, a manager seeks to derive a performance differential between two stocks, usually in the same sector, and normally holds one position long and one corresponding short position. This approach generally seeks to generate consistency of returns by earning small steady profi ts on many positions. The

5
Bennelong Long Short Equity Fund is an example of a pairs trading, fundamental arbitrage and market neutral strategy.
Conversely, statistical arbitrage employs the principal of mean reversion. A trader will fi nd two stocks whose returns are historically highly correlated. A price ratio chart (where one stocks price is divided into the other) is constructed to measure the deviation from the mean, or the average spread between the two stocks, indicating the relative performance. When the price ratio line moves to a pre-determined level of deviation from the mean, for example two standard deviations, the trade is entered. The trader will take a long position in the underperforming stock and a short position in the more strongly performing stock. The idea is that the trader will profi t from both positions as the spreads ultimately revert to the mean.
One of the key distinctions between statistical arbitrage and fundamental arbitrage is the human discretion allowed in the investment process. The former is to a large extent model based, whilst the latter revolves around stock selection.
The Investment Case for Market Neutral Funds
Following the Global Financial Crisis, correlations between different asset classes and strategies changed dynamically, and converged when the crisis reached its peak. This meant that diversifi cation did not help investors when investment markets were at their most critical junction. There is now a growing awareness that true diversifi cation should hold up during volatile markets.
One of the few strategies that were less affected by market forces during 2008 was equity market neutral despite short selling bonds. In an environment where the catch cry is about going back to basics, market neutral strategies and their low levels of correlation to the broader equity index should hold signifi cant investor appeal.
We believe that Australian market neutral funds stand out as a strong potential source of alpha and an excellent diversifi er in an investors’ portfolio.
Furthermore, equity market neutral strategies are generally highly liquid and often do not need to apply leverage to produce strong risk adjusted returns. Many of them do use gearing to compete in an absolute sense with long only equity strategies. They also typically have a low correlation with mainstream equity markets and alternative asset classes as displayed in Table 1.

6
Zenith ‘Non Rated’ Market Neutral Funds 2011 1 0.17 0.47
Zenith ‘Rated’ Market Neutral Funds 2011 0.17 1 0.5
Bank of Bermuda/AsiaHedge - Australian Long Short A$
0.57 0.12 0.57
Australia All Ordinaries Equity Index 0.58 0.15 0.59
HFN Australia Index 0.62 0.45 0.71
HFN Emerging Markets Index 0.56 0.31 0.75
HFN Macro Index 0.47 0.34 0.67
HFN CTA/Managed Futures Index 0.14 0.3 0.38
HFN Convertible Arbitrage Index 0.51 0.34 0.61
HFN Event Driven Index 0.59 0.24 0.74
HFN Fixed Income Arbitrage Index 0.43 0.39 0.54
HFN Long/Short Equity Index 0.59 0.28 0.8
HFN Multi-Strategy Index 0.59 0.33 0.77
HFN Market Neutral Equity Index 0.47 0.5 1
HFN Fund of Funds Aggregate Index 0.57 0.46 0.83
HFN Short Bias Index -0.5 0.05 -0.47
MSCI The World Index - Net - (LCL) 0.49 0.07 0.58
S&P 500 TR 0.49 0.02 0.51
The chart below illustrates the returns of the Equity Market Neutral versus other hedge fund strategies, highlighting strong relative returns but without the high volatility associated with some of the other equity strategies. The risk adjusted performance of Zenith’s ‘Rated’ Market Neutral Funds is excellent, the highest annualised return of 15.33%, with a volatility of 5.50%.
Australian market neutral funds are among the world’s best hedge funds and offer investors a compelling investment opportunity which has often been ignored in favour of their offshore counterparts. More worrying from our perspective is the rush to large hedge funds that have grabbed headlines in the past. Typically those funds have surprised on the downside.
Graph 2: Five year performance and volatility for strategies
Table 1: Correlations - over the period Dec 2006 - November 2011
�10.00%
�5.00%
0.00%
5.00%
10.00%
15.00%
20.00%
25.00%
Annu
alise
d�sin
ce�O
ct�2
006
Five�year�performance�and�volatility
Annualised�Return
Annualised�Std�Deviation

7
Achieving “true” market neutrality
The term market neutral usually refers to the term on a dollar weighted basis with reference to the fund’s current portfolio holdings. The fund’s actual market exposure is however rarely the same as the eventual market beta of the fund’s track record. Managers often talk of how beta can “work its way in portfolios” through stock beta bias, sector bias, market cap bias etc. Perfect neutrality is very sought after but diffi cult to achieve.
Market Neutral – existence of leverage?
While the use of leverage is not a true risk factor, it can enhance volatility. It is estimated that the average market neutral portfolio would carry a gross market exposure of 290%. In market neutral strategies the existence of short positions allows the Manager to achieve leverage, which if successfully applied can enhance returns.
Fund Name Allowable Gross Exposure (min and max)
Allowable Net Exposure (min and max)
Aurora Fortitude Absolute Return Trust 250% short/long NAV -25% to 25%
Bennelong Long Short Equity Fund 500% max +/-5%
BlackRock Australian Equity Market Neutral Fund
95% of NAV 95% of NAV
Pengana Australian Market Neutral Fund 300% +/- 5%
Regal Tasman Market Neutral Fund 0-300% -20% to +20%
1.4 Market Neutral Sector ReviewPerformance
Astute readers will note that not only do investors in market neutral funds receive cheap alpha, but their overall portfolio volatility is reduced, increasing the effect of long term compounding.
One of the main drivers for arriving at the above conclusion is the impact large drawdowns can have on compounding returns over time. We have constructed two indices, one that comprises the funds that we have ‘rated’, Zenith ‘Rated’ Market Neutral Funds 2011 and one that is drawn from funds that Zenith has not rated, Zenith ‘Non-Rated’ Zenith Market Neutral Funds 2011. These indices are then compared to the broader market index, the Australian All Ordinaries Index.
As can be seen from the table below, both the Market Neutral Indices have signifi cantly outperformed the Australian All Ordinaries Equity Index over the 5 year period beginning December 2006 to November 2011, with signifi cantly less volatility.

8
Underwater analysis
A critical perspective for investor of all hues, is capital preservation. The chart below demonstrates the loss from equity highs for the market neutral indices and the All Ordinaries over the last fi ve years. The wealth destruction from long only market investing has been immense. With low expected growth across the developed world combined with austerity measure designed to correct government balance sheets we, the Alternative research team at Zenith, don’t have much faith in equity markets recovering to equity highs any time soon.
Return Zenith ‘Rated’ Market Neutral Funds 2011
Australia All Ordinaries Equity Index
Zenith ‘Non-Rated’ Market Neutral Funds
2011
Compound ROR 15.33% (5.19)% 6.43%
Cumulative Return 104.07% (23.38)% 36.54%
Best Month 4.36% 7.64% 3.52%
Worst Month (3.96)% (14.00)% (2.77)%
% Positive Months 78.33% 51.67% 66.67%
Risk Zenith ‘Rated’ Market Neutral Funds 2011
Australia All Ordinaries Equity Index
Zenith ‘Non-Rated’ Market Neutral Funds
2011Standard Deviation 5.50% 16.77% 3.87%
Sharpe Ratio (5%) 1.75 -0.52 0.37
Sortino Ratio (10%) 1.34 -1.00 -1.02
Downside Deviation (10%) 3.58%3.58% 14.95% 3.26%
Max Drawdown (7.04)% (51.37)% (4.12)%
Months in Maximum Drawdown 4.00 16.00 4.00
Months to Recover 7.00 0.00 0.00
Comparison to Benchmark(s)Australian All Ordinaries Equity Index
Zenith ‘Rated’ Market Neutral Funds 2011
Zenith ‘Non-Rated’ Market Neutral Funds 2011
Alpha 1.22% 1.08%
Annualised Alpha 15.72% 13.81%
Beta 0.05 0.24
Correlatiom 0.15 0.17
R-Squared 0.02 0.03
9
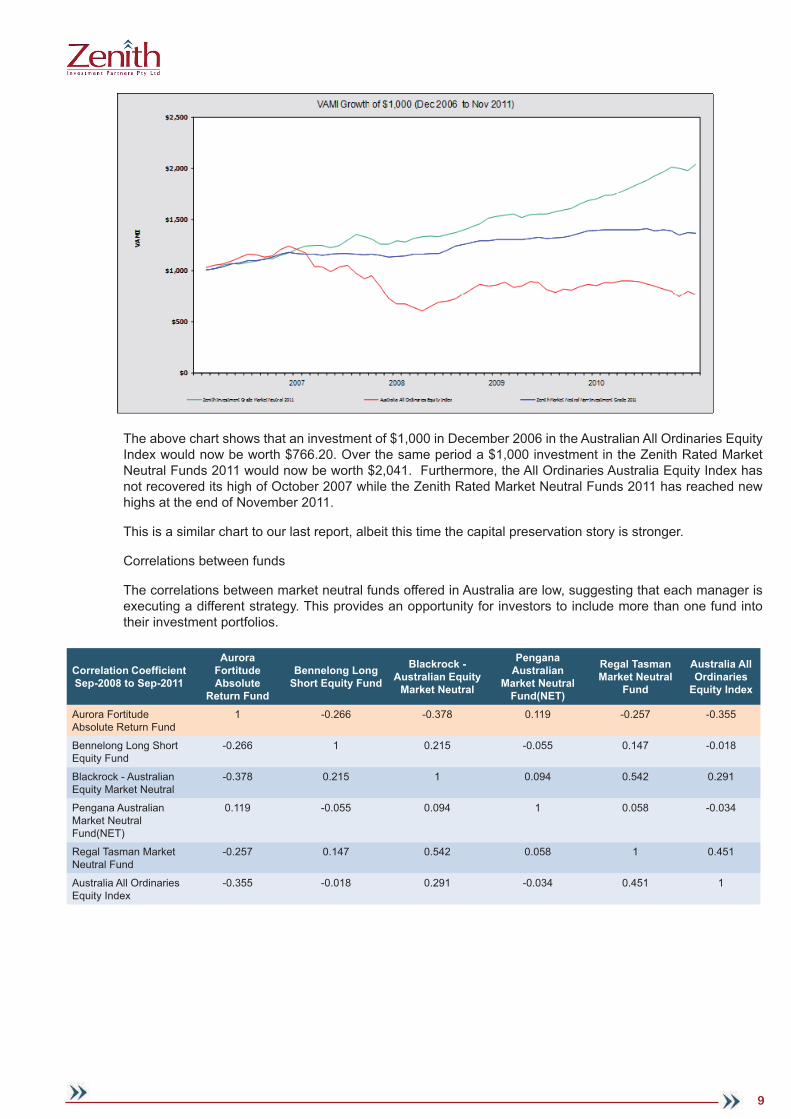
Correlation Coeffi cient Sep-2008 to Sep-2011
AuroraFortitudeAbsolute
Return Fund
Bennelong Long Short Equity Fund
Blackrock - Australian Equity
Market Neutral
PenganaAustralian
Market Neutral Fund(NET)
Regal Tasman Market Neutral
Fund
Australia All Ordinaries
Equity Index
Aurora Fortitude Absolute Return Fund
1 -0.266 -0.378 0.119 -0.257 -0.355
Bennelong Long Short Equity Fund
-0.266 1 0.215 -0.055 0.147 -0.018
Blackrock - Australian Equity Market Neutral
-0.378 0.215 1 0.094 0.542 0.291
Pengana Australian Market Neutral Fund(NET)
0.119 -0.055 0.094 1 0.058 -0.034
Regal Tasman Market Neutral Fund
-0.257 0.147 0.542 0.058 1 0.451
Australia All Ordinaries Equity Index
-0.355 -0.018 0.291 -0.034 0.451 1
The above chart shows that an investment of $1,000 in December 2006 in the Australian All Ordinaries Equity Index would now be worth $766.20. Over the same period a $1,000 investment in the Zenith Rated Market Neutral Funds 2011 would now be worth $2,041. Furthermore, the All Ordinaries Australia Equity Index has not recovered its high of October 2007 while the Zenith Rated Market Neutral Funds 2011 has reached new highs at the end of November 2011.
This is a similar chart to our last report, albeit this time the capital preservation story is stronger.
Correlations between funds
The correlations between market neutral funds offered in Australia are low, suggesting that each manager is executing a different strategy. This provides an opportunity for investors to include more than one fund into their investment portfolios.

10
Use in portfolios
We have clearly demonstrated that equity market neutral funds can add signifi cant downside protection. While the industry is moving to risk and correlation based portfolio construction we recognise most investors continue to build an investment portfolio split along asset class categories. In such an approach it is natural for investors to consider equity market neutral funds as part of their equity allocation. The following graph clearly illustrates the benefi ts of allocating away from the Australian All Ordinaries Equities Index and increasing the allocation to the Zenith Rated Market Neutral Funds 2011. At the bottom right, the effi cient frontier curve is allocated 100% to the All Ordinaries Equities Index. At the top left the allocation is 100% to the Zenith Rated Market Neutral Funds 2011. Clearly each additional allocation to market neutral funds reduces risk and simultaneously increasing returns.
The substantial portfolio improvement has not gone unnoticed, with large international pension funds allocating to long short and market neutral funds from their active and passive equity pools. This trend is one that we believe will feature more and more in SMSF and family offi ce portfolios in Australia.
Table 1 - Correlations
11
Fees
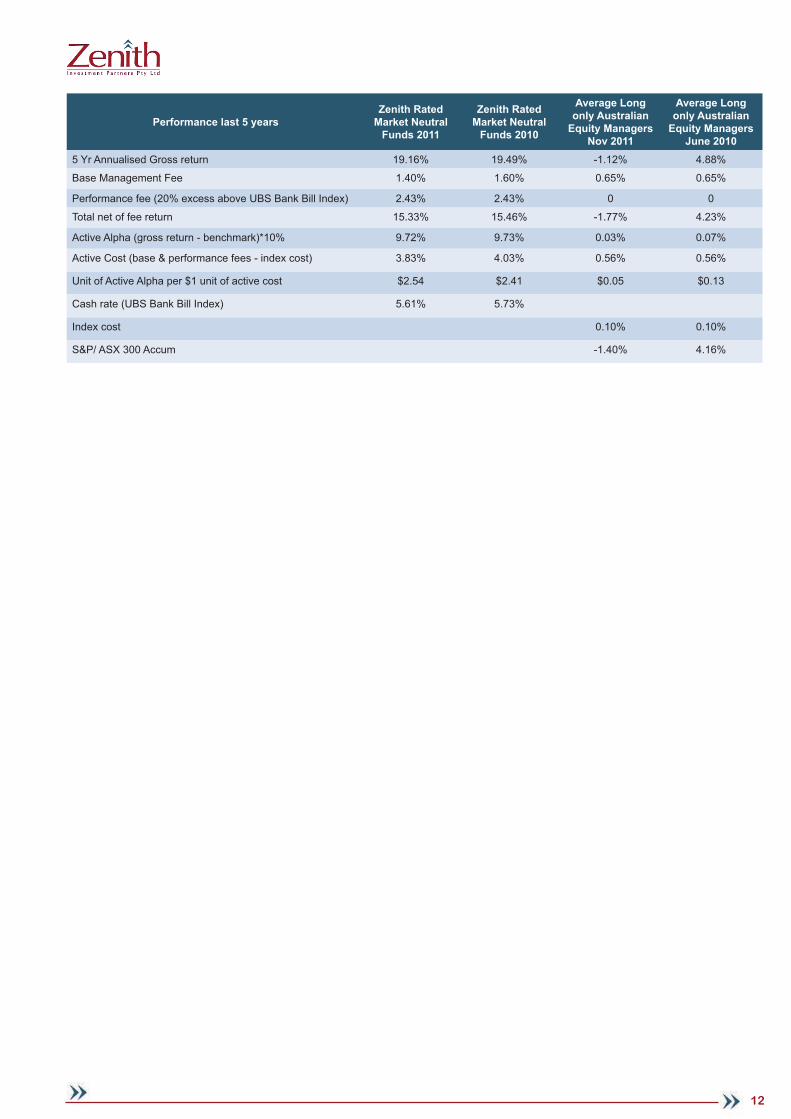
On the issue of fees, while it is true hedge funds charge higher fees and their MER’s are higher, they provide signifi cantly more participation in alpha than benchmark aware managers on the active portion of their portfolios. In fact for the second market neutral report we clearly demonstrate that good hedge fund managers are charging signifi cantly less for alpha than average long only funds.
In our last Market Neutral Sector report we compared the dollar value of alpha received for every dollar paid on active portions of traditional Australian equity funds with that received from market neutral funds. We used a sensible set of assumptions to arrive at our conclusions, including a zero costs for transactions, accounting, audit and legal.
For market neutral funds we believe that a cash return for a market neutral fund is a reasonable benchmark. Simply a random portfolio equally weighted to long and shorts should on average deliver cash returns over the long period – this is the monkey and the dart board portfolio. If the holdings are random, the portfolio will hold cash equal to its capital and the long and shorts will behave in such a way the profi ts and losses will cancel themselves out. This leaves the monkey and dart board portfolio with a holding of cash, earning at least a cash rate. It follows then that any returns above cash can be defi ned as manager skill – or as alpha.
For long only equity funds we assume that the constraints placed on the managers in the form of tracking error to the market reduces their ability to be active. We have allowed the average manager a wide tracking error of up to 10% - in other words for every dollar in an average fund the manager has the ability to be active with 10 cents. In building such a portfolio an active manager can buy all the stocks in the index and slightly change the actual weights in the fund. Or alternatively, and this is how we arrive at our valuation output, the manager can buy an index, up to 90% of the value of the fund and then adjust index weights with actual holdings for the other 10%. In constructing such a portfolio we subtract the cost of the equity index from the management fee to provide a cost of managing the active portion of the portfolio.
In the 2010 sector report we found that investors received $2.41 (in the updated version) for every $1 paid in fees through investing in the Zenith Rated Market Neutral Funds for the previous 5 years. Contrasting this the average long Australian equity fund paid investors $0.13 for every $1 of fees. This year, using the same process and looking back fi ve years the Zenith Rated Market Neutral Funds paid investors $2.54 for every $1 in fees paid. This highlights the consistency of returns from market neutral funds. However, investors received 5 cents for the privilege of handing over $1 to the average long Australian equity manager.
In other words, almost all the alpha generated by an average long equity fund accrues to the manager. While it is true that market neutral managers also enjoy high participation in the alpha generated, the difference is there is signifi cant investor participation too.
The lack of alpha participation for investors in the average long only fund is quite astonishing and if we concentrate our focus on the active portion of the portfolio this also raises another issue – that of the industry expense measure, the MER. Obviously the MER’s for the average long only managers are lower than for market neutral managers but there is no escaping the obvious conclusion that the fees for the average long only are far too high and that investors are reaping signifi cant benefi ts from market neutral managers, even after fees. With such a conclusion we pose the rhetorical what value is the MER?
12
Performance last 5 yearsZenith Rated
Market Neutral Funds 2011
Zenith Rated Market Neutral
Funds 2010
Average Long only Australian
Equity Managers Nov 2011
Average Long only Australian
Equity Managers June 2010
5 Yr Annualised Gross return 19.16% 19.49% -1.12% 4.88%
Base Management Fee 1.40% 1.60% 0.65% 0.65%
Performance fee (20% excess above UBS Bank Bill Index) 2.43% 2.43% 0 0
Total net of fee return 15.33% 15.46% -1.77% 4.23%
Active Alpha (gross return - benchmark)*10% 9.72% 9.73% 0.03% 0.07%
Active Cost (base & performance fees - index cost) 3.83% 4.03% 0.56% 0.56%
Unit of Active Alpha per $1 unit of active cost $2.54 $2.41 $0.05 $0.13
Cash rate (UBS Bank Bill Index) 5.61% 5.73%
Index cost 0.10% 0.10%
S&P/ ASX 300 Accum -1.40% 4.16%

13
2.0 DOMESTIC MARKET
Domestic Hedge Fund Market
History
Most of the early investment in hedge funds came through the domestic institutional market and was focused on offshore manufactured fund of hedge fund (FoHF) products. During the GFC a number of fl aws in this approach emerged.
The main issues identifi ed were:
• Limited redemption opportunities and gates;
• Hedging foreign currency exposures became expensive;
• Drawdowns of FoHF’s were very large;
• Lack of transparency;
• Perceived leverage within the hedge fund market;
• Average performance of the large asset gatherers was below expectations; and
• Fees for investing in FoHF’s for sizeable portfolios can no longer be justifi ed.
In 2008 the domestic hedge fund market mirrored global trends, with investors scrambling for liquidity. This resulted in the repatriation of much of the US & European fund of hedge fund support for domestic hedge fund managers, and domestic investors allocating away from alternatives.
Source: Triple A Partners, Basis Point Consulting
The events of 2008 and the subsequent period created an opportunity to rationally review the benefi ts of alternative investments.
Recent trends include a switch away from fund of hedge funds (60% to 38% over 2008-2009) and increased interest in domestic managers, although US-based and UK/Europe-based managers still dominate with 80% of fl ows.
Going forward we believe that investors will increase their appetite for institutional grade hedge funds and fund of hedge funds. We expect this to be the fastest growing segment of the market over the next few years. The objections raised by many commentators - liquidity, transparency and leverage, are clearly being addressed
14
by the industry. Recognising this, Zenith has increased its attention to quality hedge funds and funds of hedge funds offered to Australian wholesale investors.
Current Environment
Australia’s A$60 billion hedge fund industry continues to grow rapidly, with a fi vefold increase between 2002–2009. It is second largest in the Asia Pacifi c region, in terms of AUM, only marginally behind Hong Kong. The industry can be broken down into the following categories:
• Over A$40 billion managed by Australian hedge fund managers;
• A$14.1 billion managed by Australian fund of hedge fund managers;
• Service providers including incubators, prime brokers, custodians and administrators, third party marketers, independent product distributors, asset consultants, legal and accounting fi rms;
• Australian institutional investors in offshore hedge funds and fund of hedge funds including the country’s sovereign wealth fund, the A$74.62 billion Future Fund (as at March 2011) which is targeting a 15% allocation to alternative assets.
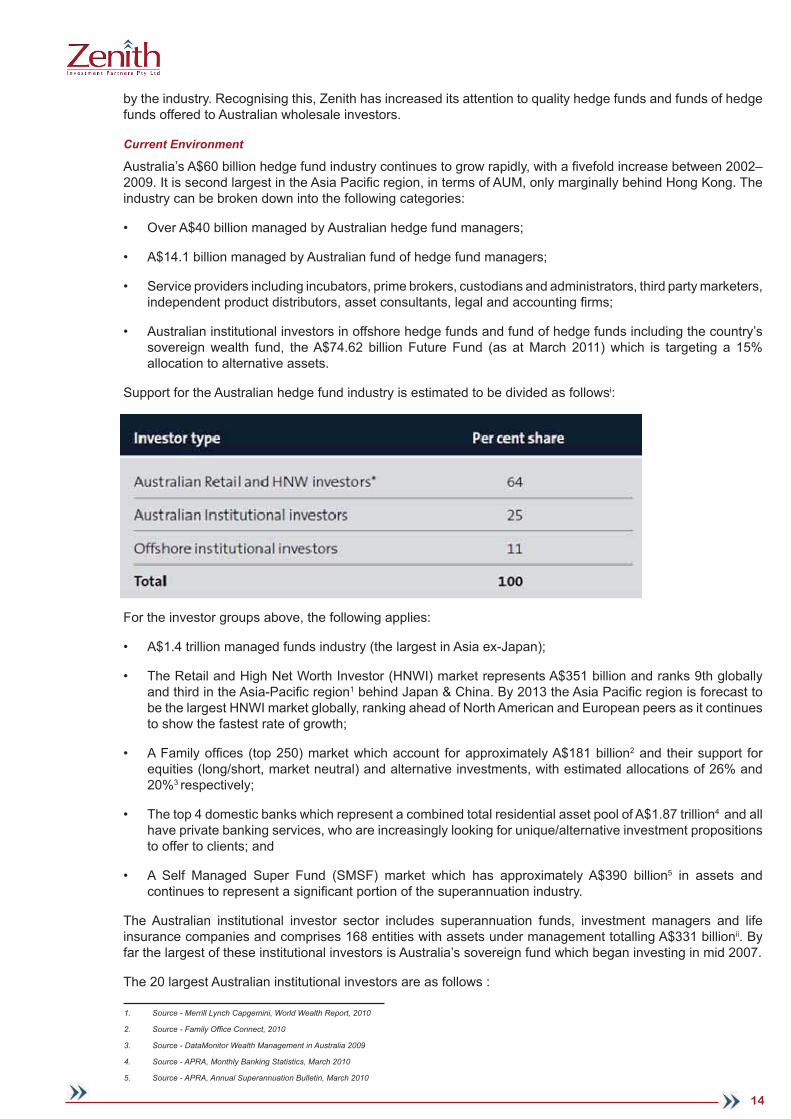
Support for the Australian hedge fund industry is estimated to be divided as followsi:
For the investor groups above, the following applies:
• A$1.4 trillion managed funds industry (the largest in Asia ex-Japan);
• The Retail and High Net Worth Investor (HNWI) market represents A$351 billion and ranks 9th globally and third in the Asia-Pacifi c region1 behind Japan & China. By 2013 the Asia Pacifi c region is forecast to be the largest HNWI market globally, ranking ahead of North American and European peers as it continues to show the fastest rate of growth;
• A Family offi ces (top 250) market which account for approximately A$181 billion2 and their support for equities (long/short, market neutral) and alternative investments, with estimated allocations of 26% and 20%3 respectively;
• The top 4 domestic banks which represent a combined total residential asset pool of A$1.87 trillion4 and all have private banking services, who are increasingly looking for unique/alternative investment propositions to offer to clients; and
• A Self Managed Super Fund (SMSF) market which has approximately A$390 billion5 in assets and continues to represent a signifi cant portion of the superannuation industry.
The Australian institutional investor sector includes superannuation funds, investment managers and life insurance companies and comprises 168 entities with assets under management totalling A$331 billionii. By far the largest of these institutional investors is Australia’s sovereign fund which began investing in mid 2007.
The 20 largest Australian institutional investors are as follows :
1. Source - Merrill Lynch Capgemini, World Wealth Report, 2010
2. Source - Family Offi ce Connect, 2010
3. Source - DataMonitor Wealth Management in Australia 2009
4. Source - APRA, Monthly Banking Statistics, March 2010
5. Source - APRA, Annual Superannuation Bulletin, March 2010

15
The A$1.2 trillion superannuation industry comprises the following fund types:
Australian superannuation funds have allocated on average only 3% to hedge funds and this sector of the market remains an “untapped resource”.
There are more than 60 hedge funds located in Australia offering over 200 fund products. Seventy-seven percent (77%) of Australia’s hedge fund assets are invested in global and regional markets in strategies including equity long/short, global macro, futures and total return strategies – demonstrating Australia’s international funds management expertise.
The largest hedge fund and fund of hedge fund managers are represented on the following two tablesiv.
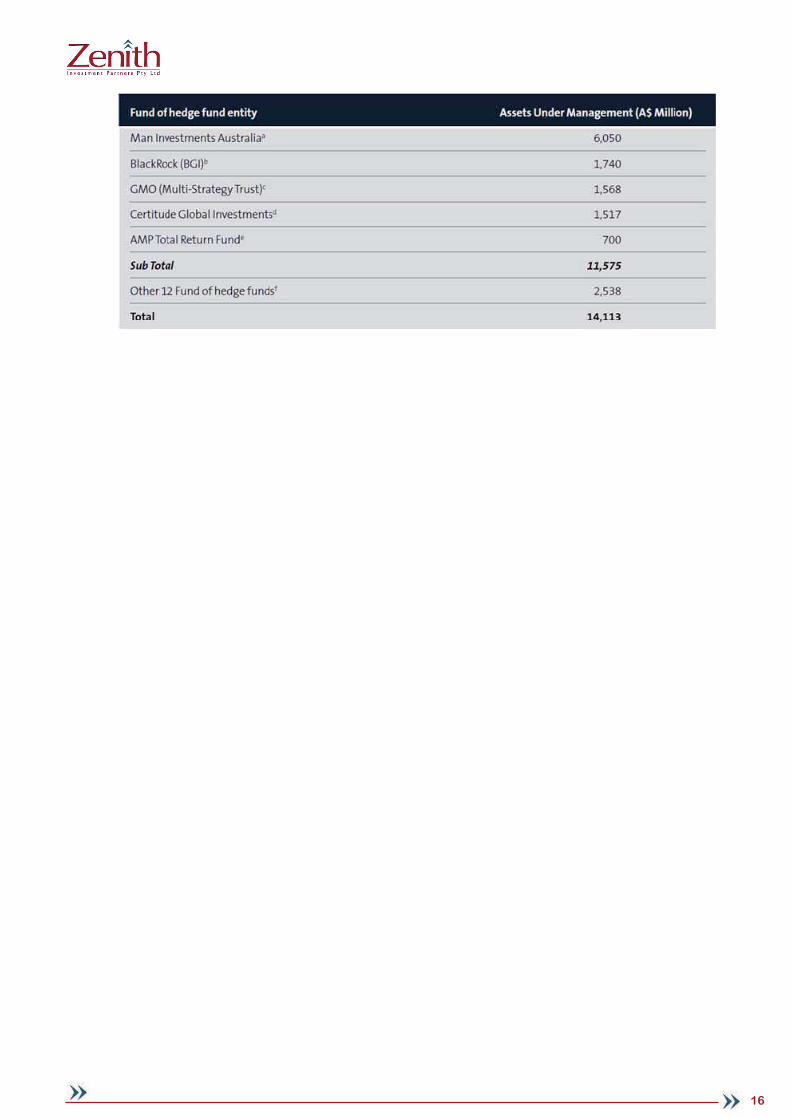
16
17
3.0 SUMMARY OF FINDINGS
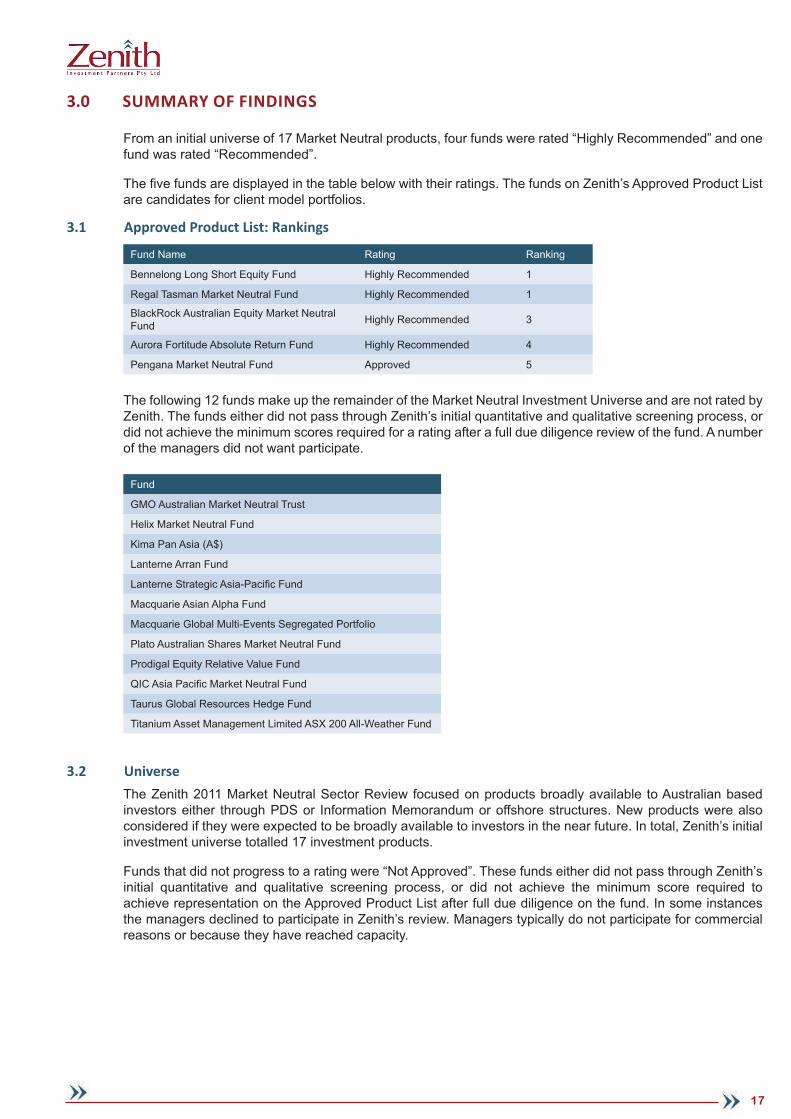
From an initial universe of 17 Market Neutral products, four funds were rated “Highly Recommended” and one fund was rated “Recommended”.
The fi ve funds are displayed in the table below with their ratings. The funds on Zenith’s Approved Product List are candidates for client model portfolios.
3.1 Approved Product List: Rankings
Fund Name Rating Ranking
Bennelong Long Short Equity Fund Highly Recommended 1
Regal Tasman Market Neutral Fund Highly Recommended 1
BlackRock Australian Equity Market Neutral Fund Highly Recommended 3
Aurora Fortitude Absolute Return Fund Highly Recommended 4
Pengana Market Neutral Fund Approved 5
The following 12 funds make up the remainder of the Market Neutral Investment Universe and are not rated by Zenith. The funds either did not pass through Zenith’s initial quantitative and qualitative screening process, or did not achieve the minimum scores required for a rating after a full due diligence review of the fund. A number of the managers did not want participate.
Fund
GMO Australian Market Neutral Trust
Helix Market Neutral Fund
Kima Pan Asia (A$)
Lanterne Arran Fund
Lanterne Strategic Asia-Pacifi c Fund
Macquarie Asian Alpha Fund
Macquarie Global Multi-Events Segregated Portfolio
Plato Australian Shares Market Neutral Fund
Prodigal Equity Relative Value Fund
QIC Asia Pacifi c Market Neutral Fund
Taurus Global Resources Hedge Fund
Titanium Asset Management Limited ASX 200 All-Weather Fund
3.2 UniverseThe Zenith 2011 Market Neutral Sector Review focused on products broadly available to Australian based investors either through PDS or Information Memorandum or offshore structures. New products were also considered if they were expected to be broadly available to investors in the near future. In total, Zenith’s initial investment universe totalled 17 investment products.
Funds that did not progress to a rating were “Not Approved”. These funds either did not pass through Zenith’s initial quantitative and qualitative screening process, or did not achieve the minimum score required to achieve representation on the Approved Product List after full due diligence on the fund. In some instances the managers declined to participate in Zenith’s review. Managers typically do not participate for commercial reasons or because they have reached capacity.

18
3.3 Filter Zenith uses a detailed quantitative and qualitative screening process to narrow down the universe to the most attractive candidates.
The quantitative screens include but are not limited to:
• The assessment of the level of absolute returns, standard deviation (volatility) and consistency of returns;
• The assessment of Sharpe and Sortino ratios, correlation analysis, drawdown analysis and peer group analysis; and
• Attribution analysis to identify each product’s sources of added value.
From a qualitative perspective, we consider factors including:
• The experience, depth and expertise of the investment teams;
• Corporate stability;
• The validity and consistency of the investment process; and
• Assessment of risk management (including potential operational risks).
The initial fi lter enables Zenith to screen out a large proportion of the investable universe and concentrate on the funds that we believe have the highest probability of achieving strong ratings.
3.4 Fund Reviews Following the initial fi lter, Zenith undertakes detailed due diligence on the investment managers. The due diligence process requires an onsite meeting between Zenith and the key investment staff involved in managing the product.
Factors Zenith focus on at this stage of the research process include: the strength of the organisation, the structure of the investment team, information resources, investment philosophy, investment process, portfolio construction and risk management (including both investment and operational risk management).
In addition, Zenith conducts a thorough review of all documentation, including but not limited to the Alternative Investment Management Association (AIMA) investment process questionnaire material, backgrounds of the key investment personnel, service providers agreements and compliance documents.
We also ask for transparency of the portfolios underlying these products and detailed attribution analysis to assess the manager’s risk adjusted performance record.
3.5 Zenith Manager Mee� ng Register TableDue diligence meetings took place with the following investment personnel.
Fund Investment Personnel
Aurora Fortitude Absolute Return Fund
John Corr (CIO)
Sheriden Hure (Senior Portfolio Manager)
Andrew Ward (Senior Portfolio Manager)
Steuart Roe (Managing Director)
Bennelong Long Short Equity Fund Richard Fish (CIO)
Blackrock Australian Equity Market Neutral Fund
Michael McCorry (Head of Scientifi c Active Equity, Australia)
Paddy McCrudden (Portfolio Manager)
Pengana Australian Market Neutral Fund
Russel Pillemer (CIO)
Nick Griffi ths (CIO)
Phillip Boustridge (Portfolio Manager)
Miriam Herold (Portfolio Manager)
Regal Tasman Market Neutral Fund Phillip King (CIO)

19
3.6 Ra� ngs MethodologyZenith’s ratings are based on the output of a proprietary scoring model. The broad factors assessed are outlined below. Please note that there are numerous sub-factors within each category and that sub-factors change for each sector.
�
3.7 Ra� ngs BandsBased on the scores assigned by Zenith, a rating of Highly Recommended, Recommended, Approved or Not Approved is assigned to each fund. As shown in the following diagram the ratings are determined based on the overall score out of 100.
70% - 80%
Recommended Approved Not Approved
55% - 70% Less than 55%
HighlyRecommended
>80%

20
4.0 FUND SUMMARIES
4.1 Fund SummariesAurora Fortitude Absolute Return Fund
The Aurora Fortitude Absolute Return Fund (“the Fund”) is offered through Aurora Funds Limited (ASX code – AFV), which listed on the ASX on the 13th July 2010 following the merger of Aurora Funds Management (an RE and distribution business), Sandringham Capital and Fortitude Capital. Each of the above entities ownership of combined group is approximately 36.1%, 26.4% and 10.0% respectively. John Corr willl be increasing his shareholding to 17%.
The merger of these entities not only creates a more solid capital base, it also provides synergies as a result of increased scale. This manifests itself mostly in non-core investment activities such as; compliance, negotiating with service providers and operational support. While these structural enhancements are beneficial the sharing of front offi ce experience and skills also supplies additional benefi ts.
As an example the Fund now uses MacKenzie Coultas Funds Administration as the funds’ administrator. While this is a new administrator for the Fund, it is one that has been employed successfully for some time at Aurora. The change of service providers is a result of the rationalisation process and does not raise a red fl ag, as it often times would.
Other signifi cant changes since our last review include moving to daily pricing and the ability to access the Fund through a listed structure, the Aurora Absolute Return Fund (ASX Code: ABW). With the distractions of the merger behind him John Corr, the Chief Investment Offi cer, is now free to concentrate on risk and returns. The Australian equity focused Fund has perhaps one of the best risk adjusted returns globally, with a 6 year track record with a Sharpe Ratio of 1.42 (using a risk free rate of 5%). Our concern is not about the Fund, the Manager nor the business; it is with the absence of local investors embracing an excellent Australian equity market neutral fund. In fact searching the global hedge fund databases (9.000 plus funds) reveals there are only a handful of funds with a similar or greater series of risk adjusted returns and length of track record. And out of those only 3 (including this fund) are open to new investors.
While we understand the business models and economics that prevent many institutional consultants from undertaking reviews on managers with less than $1 billion in capacity, the statistics clearly reveal investors are the poorer for it.
As for retail clients, the Fund is now available on an increasing number of platforms. Since our last review the liquidity terms for the Fund have been adapted to provide daily pricing. This change will now allow the Fund to fi t into all administration systems removing most operational hurdles for non-inclusion in an Australian equities portfolio.
The Manager uses very little leverage in this Fund, the maximum used to date is 1.3 times; or to put this into perspective most extension strategies typically gearing is 1.6 times while offering no downside protection.
In all of our dealings with the Manager and John Corr we have been provided with signifi cantly more transparency than many other traditional managers provide without a push.
The Fund is a style neutral, absolute return orientated fund with an equities focus. Its return objective is 5-10% above RBA cash rate with historical volatility having typically ranged between 3% - 4% p.a. Operating a multi strategy approach the Fund comprises exposure to 5 strategies - convertible arbitrage/ yield, event driven, long/short equity, convergence (ADR/CDI arbitrage) and option overlay. Over the long term all strategies have added value with their historical average allocations having ranged from between 6% and 23% of the portfolio. Derivatives are used for hedging but can also as a stock substitute and protect the portfolio from sharp market movements through the use of a “long gamma” stance. The result is a portfolio that provides an option smile, with returns above the cost of theta during volatile periods. For investors this means paying for insurance on the portfolio.
The robust risk management systems provide an insight into the Manager’s mindset. This is matched to a deep range of trading experiences amongst its senior investment team. All trades are reported and entered into the risk systems, and all traders have trading limits in place. Before positions are added to the portfolio the Manger considers the liquidity of the positions, the availability of stock options to act as a hedge and each trader must defi ne a timeline.

21
John Corr, who now occupies the role of Chief Investment Offi cer at Aurora, is regarded as the driving force behind the Fund and his capabilities as a proprietary trader are not in question (8 years at Solomon Smith Barney / Citigroup, Head of Equity Proprietary Trading and quality references). The IPO merger has resulted in some redundancies (Darren Raward, ex Senior Trader, managed the yield strategy and Phil Cornet, ex PM for Equity Income Fund and part-time BDM role), these skill sets are now covered across other individuals within the broader Aurora Funds Limited Group. Corr works “day to day” with his investment team of two (Sheriden Hure, joined 2005 & Andrew Ward, joined 2006) and is now supported by the ex Sandringham team which consists of a further 3 investment professionals.
In Zenith’s opinion the Aurora Fortitude Absolute Return Fund is an undiscovered diamond with its strong risk adjusted track record since March 2005. With a Sharpe and Sortino ratio of 1.42 and 3.31 respectively as at March 2011 (compound annualised return of 9.52% p.a. or nearly 4.2% alpha per annum) and negligible correlation to the Australian equity market it has proven itself through market cycles. Most telling of all was the Fund’s success over 2008 (+12.29%), a year in which many markets fell. Its conservative, capital preservation and yield focus should also be attractive to investors.
Fees are often used as an excuse to avoid alternative managers. But as we showed in our 2010 Australian Equity Market Neutral Sector Report there are not many managers who can provide net of fees alpha of 4.2%. In fact typically investor’s fees are larger than the alpha generated. The Fund clearly returns more to investors than they pay in fees. Consequently the fees of the Fund are more than fair.
The IPO provided an injection of $2 million, from an operating activity perspective all three businesses for the 2010 fi nancial year were in negative cash fl ow. We note that Aurora, with its marketing and distribution capabilities have encouraged many of the packaging changes that should make this fund very attractive to a larger pool of investors. We remain cognisant of the risk of small funds management business but we believe that Aurora the integration is mostly complete leaving a structure and strategic goals that are clear and achievable.
The Fund should be used by investors interested in constraining risks in their Australian equity portion of their portfolios so that they can benefi t from positive compounding and improve their effi cient frontiers.
Overall, Zenith has a high opinion of key personnel, the robustness of the investment process and strong risk management focus as such we rate the Fund Highly Recommended.
Bennelong Long Short Equity Fund
The Bennelong Long Short Equity Fund is a market neutral Australian equities hedge fund that consists of a diversifi ed portfolio of pair trades arrived at through a qualitatively based bottom-up stock selection research process. The Fund is expected to have no equity market exposure and no correlation to the broader Australian equities market. The Fund’s volatility is targeted at 1% per month (i.e. 12% p.a.) and the manager will apply leverage to gear the portfolio up to a maximum of 5 times the Net Asset Value (NAV).
Bennelong Long Short Equity Management Pty Ltd (BLSEM) is a boutique hedge fund manager that is dedicated to the management of market neutral Australian equities funds. Based in Melbourne, Australia BLSEM was founded in 2002 as a joint venture between Richard Fish (Chief Investment Offi cer) and Bennelong Funds Management Pty Ltd (BFM), a wholly owned subsidiary of The Bennelong Group. BLSEM had approximately AUD$240 million in funds under management (FUM) as at 1 December 2011 and Zenith considers BLSEM and BFM to in strong fi nancial positions.
The BLSEM investment team comprises three individuals, Richard Fish (CIO), Sam Taylor (Senior Analyst) and Michael Baker (Analyst). While the team is boutique in size it is experienced and highly regarded by Zenith. Furthermore, Fish has built an excellent track record working under a small team structure since establishing the business in 2002. Fish has over 24 years of investment experience in the Australian equities market and prior to BLSEM worked in portfolio management and dealer roles with National Asset Management Limited. Zenith rates Fish highly and consider him to be a highly accomplished Australian shares investor both on the long and short side.
BLSEM uses a fundamental research process that is focused on identifying relative value opportunities between stock pairs. The primary characteristics the Manager looks for in long positions are companies with strong business franchises and management teams that have strong track records of added value, with short candidates having the opposite characteristics. Stock valuation is also assessed with the Manager particularly focused on identifying relative value ‘outliers’. Pair companies must operate in the comparable industries/sectors to ensure that the portfolio is driven by stock selection rather than sector positions. In Zenith’s view

22
this is crucial as it ensures that the portfolio remains beta neutral and that it is not correlated to the Australian equities market.
The intention is for the Fund to invest in the most liquid Australian companies and therefore it primarily invests in the S&P/ASX 100 universe. The Fund also has the scope to invest in dual listed Australian companies (i.e. ASX and FTSE listed) although the Manager has advised that it does not intend to use this capability as it introduces currency risk.
The Portfolio is highly diversifi ed and typically comprises 60 to 70 stocks with 30 to 35 pair trades. The average portfolio weighting per security is 1.5% and subsequently 3.0% per pair although actual weightings are based on the Manager’s level of conviction in the trade and the pricing at implementation. The Fund has a maximum leverage limit of 5x Net Asset Value (NAV) and the Manager tries to maintain this above 4x NAV in order to maintain its conviction levels and activeness, although it is strongly focused on keeping the Fund’s volatility in line with its target of 1% per month.
It must be noted that the Manager is not overly mechanical in its approach to risk management and it prefers to use its judgement in assessing risk at the security selection and portfolio levels. This is evidenced by the fact that the Manager does not use stop losses. Zenith is comfortable with the Manager’s use of judgement rather than a reliance on quantitative techniques based on Fish’s experience in running the strategy and in managing risk.
BLSEM’s service providers are high quality with UBS AG, Australian Branch acting as the Fund’s Prime Broker and UBS Nominees Pty Ltd as the Custodian. The administrator of the Fund is TMF (formerly known as Kingsway Taitz Fund Administration), the Auditor is Deloitte and legal counsel is provided by DLA Philips Fox.
The Manager employs Compliance & Risk Services as an external consultant to assist with compliance and has detailed and rigorous internal controls in place (discussed in ‘Administration and Operations’ section of the Report).
In Zenith’s view the Fund is an attractive offering that offers investors a truly market neutral fund that should act as an excellent diversifi er within a broader portfolio. Zenith rates the Fund “Highly Recommended”.
BlackRock Australian Equity Market Neutral Fund
The BlackRock Australian Equity Market Neutral Fund (the Fund) is a market neutral, long short strategy that employs active stock selection. With a very solid track record over the life of the Fund, notwithstanding changes in senior investment team that occurred after the merger of Barclays Global Investors (BGI) and BlackRock, we have a positive view on the Fund, it process and the Manager. We are confident that its past returns are a good reflection of what investors can expect.
BlackRock manage over US$3 trillion for clients globally. In addition BlackRock, through BlackRock Solutions, provides risk management and enterprise investment services for over US$10 trillion in assets. Within Australia, BlackRock Asset Management Australia Limited (BA) manages a range of products and services including equities, fixed income and cash. Locally BA manages client sourced funds totalling A$38.8 billion.
The Manager believes that security returns are driven by pervasive influences in the market and that these factors account for both return and risk. Through extensive research the Fund attempts to capture various factors, both long and short term in nature.
As an organisation, the scientific strategies group maintains a single global investment philosophy that has not changed since the merger of BGI and BlackRock. The Manager believes that optimal investment outcome is the result of the understanding, measuring, forecasting and managing the three dimensions of investment performance: return, risk and cost. The Manager believes that these three dimensions are best controlled and exploited through leveraging the skills of experienced, knowledgeable people with extensive use of technology.
While people are very important to the process, it is the union of people and consistently capturing and implementing a human designed process that is the edge of the Manager. We believe that an organisation with the size and quality of BlackRock will attract appropriate talent which greatly mitigates any departure of senior team members.
Since inception, the Fund has delivered solid returns. However the Fund did not fare terribly well during the global fi nancial crisis of 2008 and its performance was further impacted by redemptions following the merger with BGI. We accept the proposition that the market conditions of 2008 coupled with the short selling
23
restrictions enforced in September 2008 impacted on the Fund’s ability to invest in the manner for which it was designed.
The compounded return of the Fund since inception is vastly superior to a long only investment in the All Ordinaries Index and to a holding in cash, 146.16% versus 26.14% and 67.38%. Whilst there are no guarantees, we believe that the Fund’s investment process should allow it to continue to deliver strong returns in the future.
For many years we have been unable to provide access to the Fund, as it was capacity constrained. We believe that astute investors will benefit from accessing the capacity that has become available as a result of the previous redemptions. The Manager has confirmed its commitment to the Fund and further personnel additions are testament to that message.
The events of 2008 highlighted the importance of capital preservation and liquidity. For individual and institutional investors the ability to time markets is impossible and when an investor requires liquidity it is often at the same time when capital preservation is also necessary. The Fund delivered both liquidity and a good degree of capital preservation during the GFC.
Zenith believes that this Fund should appeal to investors who are looking to diversify and enhance returns in an Australian equity portfolio. As with all investments, an allocation to the Fund should be made in the context of the investors’ overall portfolio and investment objectives.
Based on our degree of confi dence in the team, the investment process and the Manager, Zenith rates the Fund Highly Recommended.
Pengana Market Neutral Fund
Pengana Capital is an Australian privately owned Funds management fi rm founded in 2003 based in Sydney. The business is diversifi ed with ten different funds across various strategies and asset classes. The headquarters of the fi rm is Sydney with other offi ces in Melbourne, Singapore and Chicago. Pengana is 100% owned subsidiary of Pengana Holdings. Pengana is licensed by the Australian Securities and Investment Commission (“ASIC”).
National Australia Bank became a signifi cant shareholder of Pengana Holdings on May 1st 2008. This is another example of an institution providing not only capital but also distribution and other capabilities to a boutique funds management business. Pleasingly the Manager has retained separate premises, culture and management.
The goal of the fi rm is to fi nd, support and nurture fund managers that share the aspiration of generating superior risk adjusted returns. Pengana actively seeks to provide support for experienced fund managers with long track records.
Pengana is another example of how boutique managers can operate under the umbrella of a larger institutional group. The Manager – Pengana is able to draw on a range of functions that are independent of the investment managers, providing not only economies of scale but also reduces risk associated with smaller teams.
The Pengana Australian Market Neutral Fund (the “Fund”) is a fundamentally based quantitative fund that invests into stocks in the Australian S&P/ASX 300 Index on a market neutral basis.
The Fund has continued to produce consistent returns since inception in September 2008 with a total return of 30.91% at an annualised rate of 10.91% net of fees as at March 31, 2011.
The Fund has produced positive returns every calendar year since launch through a wide range of economic and fi nancial market conditions including the GFC and associated equity market downturn.
While the Fund’s volatility is lower than expected, the returns of more than 6% over cash rates is meeting its return objectives. It is expected that the Fund will continue to provide positive returns. If for any reason the returns start to get closer to cash over an 8–12 month period we would recommend investors review their positions.
We believe the strength of this Fund comes from the strong robust internally built models. Our conclusion is that the Manager clearly adds stock specifi c returns that it wants to capture, avoiding market risk in an attempt to reduce volatility and capture only stock specifi c price changes.
In our view the largest risk for the strategy is the ability of the Manager to continue its research effort uncovering

24
new and independent factors that infl uence price and market behaviour.
While this Fund invests in Australian equities it must be noted that it does so within a framework that seeks maximum alpha within a controlled environment. Therefore it should not be compared with long short equity. Rather we believe that the Fund should be compared to other market neutral strategies in the Australian market place.
The Fund is expected to provide a strong diversifi cation benefi t and improve the risk/return profi le of an investor's Australian equity portfolio.
Zenith encourages investors to adopt a medium to longer term investment timeframe of 5+ years when investing in this Fund.
Overall, we are optimistic about the Fund and we have a strong opinion of key personnel, the robustness of the current investment process and the strong risk management focus as such we rate the Fund Approved.
Regal Tasman Market Neutral Fund
The Regal Tasman Market Neutral Fund is an Australian long short fund that aims to deliver attractive returns with low correlation to equity markets. Rather than relying on the strength of a rising stock market to generate returns, Tasman’s returns are generated by exploiting market ineffi ciencies and superior stock selection.
Regal Funds Management is a long short equity hedge fund manager that employs both fundamental and quantitative based investment strategies. Based in Sydney and Singapore, Regal was founded in January 2004 by Andrew King. His brother Philip King returned from London after working as a fund manager at de Putron Management and joined Regal in September 2005. Philip has a solid track record in fundamental long short investing and his consistently impressive stock picking abilities are highlighted in the Fund’s strong performance record. In January 2011, Andrew King established Regal Funds Management Asia, opening an offi ce in Singapore. Andrew owns 100% of RFM Asia.
In July 2010 the Manager sold 30% of its equity to Ascalon Capital Managers Ltd (Ascalon). Ascalon is 100% owned by Westpac Bank Corporation and invests in boutique funds management fi rms whilst providing operational capital to its partners. Ascalon is part of the BT Financial Group, and sits alongside Advance Asset Management and BT Investment Management as the fi rm’s investment management manufacturing businesses. Zenith believes the backing from Ascalon is a major strength. As at July 2011, Regal manage US$939 million across eight funds.
The Fund aims to maximise returns with only moderate risk and little correlation to equity markets. The Manager aims to limit the volatility of returns to less than 15% per annum and preserves a beta neutral exposure.
Most of the investments are listed on the Australian Stock Exchange, but the Manager may opportunistically invest in securities listed in other countries. The Manager applies a high conviction approach in stock selection and portfolio construction, resulting in a portfolio that contains only the best ideas on the long and short side. A bottom up research approach is used. Market experience is used to decide the chance of a catalyst affecting the market price of the security and the timing of such an event.
The Manager sizes positions based on daily market volume and its convictions, continuously checking the portfolio for breaches and profi tability. Furthermore, Regal has built a class leading risk management platform that provides timely and relevant information to the portfolio managers and to the risk managers.
Since Zenith’s last review, Hong Kong and Shanghai Banking Corporation Ltd (HSBC) has been appointed as a full time Fund Administrator. This means all administration is outsourced which is Zenith’s preferred model. HSBC provides general administration of the Fund which includes maintaining a register of unitholders, arranging for the issue and redemptions of units and calculations of the asset valuations and fees.
The risk management of the Fund and the skill of the investment professionals, combined with well formed operations and business management functions, provide us with a high level of conviction in both the Manager and the Fund. Given the partnership with Ascalon, we believe that Tasman is a very desirable holding. With a volatility target closely matching equity markets, the Fund can be used to diversify and improve returns in a traditional equities portfolio. Furthermore the Fund should have limited correlation to other equity funds.
The high conviction nature of both long and short positions is viewed positively as the Manager clearly displays the ability to achieve returns from investing on both sides of the ledger. Although regulatory changes to short

25
selling rules remain a risk in volatile markets, the Manager preserved its positions over the last shorting ban through rebalancing and the use of derivatives.
Zenith rates the Fund Highly Recommended.
4.2 Team Summaries
4.2.1 Aurora Fortitude Absolute Return Fund
Investment Team
Name Qualifi cations Position (Title) Responsibilites LocationDate
JoinedCompany
Years with
Company
InvestmentManagementExperience
Steuart Roe BSc MAppFin CEO Chairman & Managing Director Melbourne 1/01/2005 6 21
John Corr B. Comm CIO Managing Director Sydney 1/01/2005 6 24
Sheriden Hure B. Fin F. Fin Snr Portfolio Manager Portfolio Management Sydney 1/01/2005 6 6
Andrew Ward C.A. (S.A.) Snr Portfolio Manager Portfolio Management Sydney 1/01/2006 5 5
Binh Le BSc(Hons) MSc (Finance) Snr Portfolio Manager Portfolio Management Melbourne 1/09/2008 2 15
Peter Wilson B Comm BSc Portfolio Manager Portfolio Management Melbourne 1/10/2009 2 3
Additions to Investment Team - last 3 years
Name Qualifi cations Position (Title) Responsibilites LocationDate
JoinedCompany
Years with
Company
InvestmentManagementExperience
Departures to Investment Team - last 3 years
Name Qualifi cations Position (Title) Responsibilites LocationDate
JoinedCompany
Years with
Company
InvestmentManagementExperience
Total Number of Staff as at 31/09/2011: Total Number of Staff as at 31/09/2010: Total Number of Staff as at 31/09/2009:
Firm Wide: 14 Firm Wide: 13 Firm Wide: 13
Investment Staff 6 Investment Staff 6 Investment Staff 6

26
4.2.2 Bennelong Long Short Equity Fund
Investment Team
Name Qualifi cations Position (Title) Responsibilites LocationDate
JoinedCompany
Years with
Company
InvestmentManagementExperience
Richard Fish B.Bus, ASIA, M.App.Fin. Director Portfolio Mangement Melbourne 1/01/2002 9 26
Sam Taylor B.Bus (Banking & Finance) Senior Analyst Research Melbourne 17/3/2008 4 12
Michael Baker B.Bus (Banking & Finance) Investment Analyst Research Melbourne 2/07/2011 1 13
Additions to Investment Team - last 3 years
Name Qualifi cations Position (Title) Responsibilites LocationDate
JoinedCompany
Years with
Company
InvestmentManagementExperience
Michael Baker B.Bus (Banking & Finance) Investment Analyst Research Melbourne 2/07/2011 1 13
Departures to Investment Team - last 3 years
Name Qualifi cations Position (Title) Responsibilites LocationDate
JoinedCompany
Years with
Company
InvestmentManagementExperience
Nil
Total Number of Staff as at 31/07/2010: Total Number of Staff as at 31/07/2009: Total Number of Staff as at 31/07/2007:
Firm Wide: 3 Firm Wide: 2 Firm Wide: 2
Investment Staff 3 Investment Staff 2 Investment Staff 2
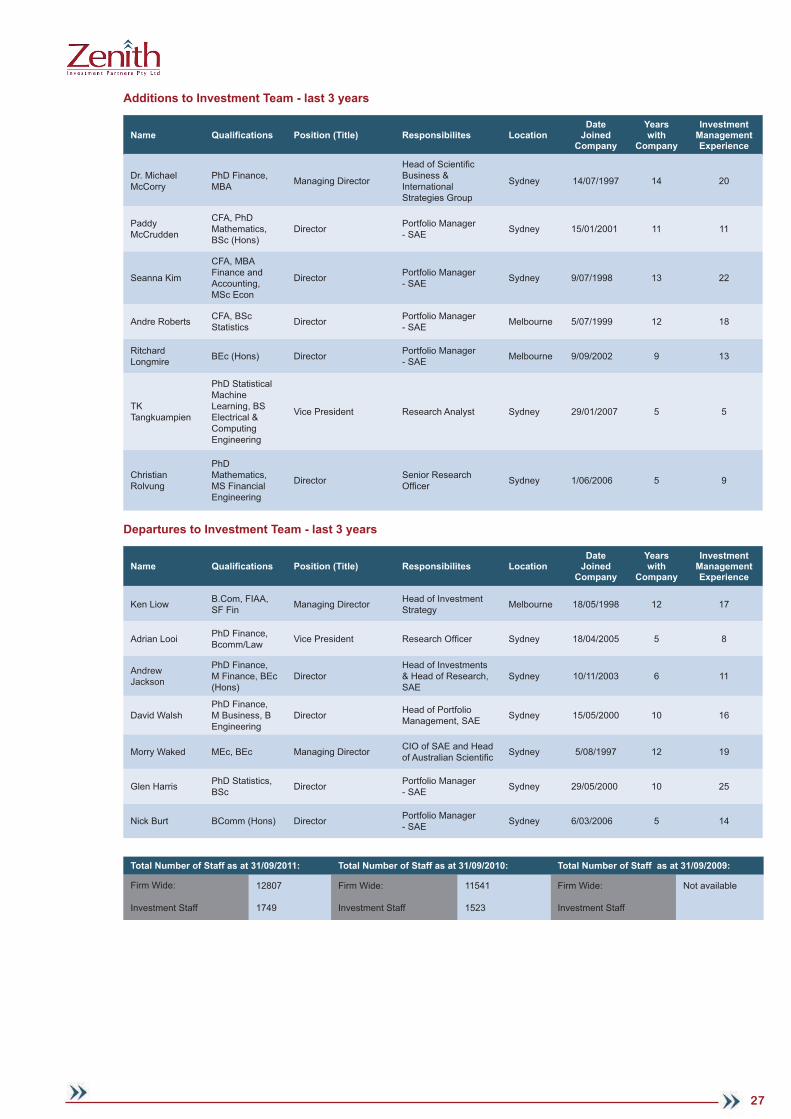
4.2.3 BlackRock Australian Equity Market Neutral Fund
Investment Team
Name Qualifi cations Position (Title) Responsibilites LocationDate
JoinedCompany
Years with
Company
InvestmentManagementExperience
Dr. Michael McCorry
PhD Finance, MBA Managing Director
Head of Scientifi c Business & Intnl Strategies Group
Sydney 14/07/1997 14 20
PaddyMcCrudden
CFA, PhD Mathematics,BSc (Hons)
Director Portfolio Manager - SAE Sydney 15/01/2001 11 11
Andre Roberts CFA, BSc Statistics Director Portfolio Manager
- SAE Melbourne 5/07/1999 12 18
RitchardLongmire BEc (Hons) Director Portfolio Manager
- SAE Melbourne 9/09/2002 9 13
ChristianRolvung
PhDMathematics,MS Financial Engineering
Director Senior Research Offi cer Sydney 1/06/2006 5 9
TKTangkuampien
PhD Statistical MachineLearning, BS Electrical & ComputingEngineering
Vice President Research Analyst Sydney 29/01/2007 5 5
Joanna Nash
PhDEconometrics,BEc (Hons), LLB
Associate Research Analyst Sydney 10/03/2008 4 5
27
Additions to Investment Team - last 3 years
Name Qualifi cations Position (Title) Responsibilites LocationDate
JoinedCompany
Years with
Company
InvestmentManagementExperience
Dr. Michael McCorry
PhD Finance, MBA Managing Director
Head of Scientifi c Business & InternationalStrategies Group
Sydney 14/07/1997 14 20
PaddyMcCrudden
CFA, PhD Mathematics,BSc (Hons)
Director Portfolio Manager - SAE Sydney 15/01/2001 11 11
Seanna Kim
CFA, MBA Finance and Accounting,MSc Econ
Director Portfolio Manager - SAE Sydney 9/07/1998 13 22
Andre Roberts CFA, BSc Statistics Director Portfolio Manager
- SAE Melbourne 5/07/1999 12 18
RitchardLongmire BEc (Hons) Director Portfolio Manager
- SAE Melbourne 9/09/2002 9 13
TKTangkuampien
PhD Statistical MachineLearning, BS Electrical & ComputingEngineering
Vice President Research Analyst Sydney 29/01/2007 5 5
ChristianRolvung
PhDMathematics,MS Financial Engineering
Director Senior Research Offi cer Sydney 1/06/2006 5 9
Departures to Investment Team - last 3 years
Name Qualifi cations Position (Title) Responsibilites LocationDate
JoinedCompany
Years with
Company
InvestmentManagementExperience
Ken Liow B.Com, FIAA, SF Fin Managing Director Head of Investment
Strategy Melbourne 18/05/1998 12 17
Adrian Looi PhD Finance, Bcomm/Law Vice President Research Offi cer Sydney 18/04/2005 5 8
AndrewAndrewJacksonJackson
PhD Finance, M Finance, BEc (Hons)
DirectorHead of Investments & Head of Research, SAE
Sydney 10/11/2003 6 11
David WalshPhD Finance, M Business, B Engineering
Director Head of Portfolio Management, SAE Sydney 15/05/2000 10 16
Morry Waked MEc, BEc Managing Director CIO of SAE and Head of Australian Scientifi c Sydney 5/08/1997 12 19
Glen Harris PhD Statistics, BSc Director Portfolio Manager
- SAE Sydney 29/05/2000 10 25
Nick Burt BComm (Hons) Director Portfolio Manager - SAE Sydney 6/03/2006 5 14
Total Number of Staff as at 31/09/2011: Total Number of Staff as at 31/09/2010: Total Number of Staff as at 31/09/2009:
Firm Wide: 12807 Firm Wide: 11541 Firm Wide: Not available
Investment Staff 1749 Investment Staff 1523 Investment Staff

28
4.2.4 Pengana Australian Market Neutral Fund
Investment Team
Name Qualifi cations Position (Title) Responsibilites LocationDate
JoinedCompany
Years with
Company
InvestmentManagementExperience
PhillipBoustridge
Masters in Finance (Hons) Portfolio Manager Pengana Market
Neutral Fund Sydney 5/11/2007 4 18
Paul Ramsay Systems Engineer Pengana Market Neutral Fund Sydney 9/12/2008 2
2 years IM; 20 systems engineering
Miriam Herold B.Economics,CFA Portfolio Manager Pengana Market
Neutral Fund Sydney 1/05/2010 1 11 years
Martin Young
Dr of Philosophy in Finance, Master of Arts in Economics, First ClassHons, Bachelor of Arts, Major in Economics
Research Sydney 14/11/2011 0 29 years
Bernard LoB. Commerce (Finance) & B. Law
Research & Systems Analyst
Pengana Market Neutral Fund Sydney 30/11/2009 2 5 years
Additions to Investment Team - last 3 years
Name Qualifi cations Position (Title) Responsibilites LocationDate
JoinedCompany
Years with
Company
InvestmentManagementExperience
Paul Ramsay Systems Engineer Pengana Market Neutral Fund Sydney 9/12/2008 2
2 years IM; 20 systems engineering
Miriam Herold B.Economics,CFA Portfolio Manager Pengana Market
Neutral Fund Sydney 1/05/2010 1 11 years
Martin Young
Dr of Philosophy in Finance, Master of Arts in Economics, First ClassHons, Bachelor of Arts, Major in Economics
Research Pengana Market Neutral Fund Sydney 14/11/2011 0 29 years
Bernard LoB. Commerce (Finance) & B. Law
Research & Systems Analyst
Pengana Market Neutral Fund Sydney 30/11/2009 2 5 years
Departures to Investment Team - last 3 years
Name Qualifi cations Position (Title) Responsibilites LocationDate
JoinedCompany
Years with
Company
InvestmentManagementExperience
Nil
Total Number of Staff as at 30/09/2011: Total Number of Staff as at 30/09/2010: Total Number of Staff as at 30/09/2009:
Firm Wide: 45 Firm Wide: 50 Firm Wide: 50
Investment Staff 25 Investment Staff 35 Investment Staff 35

29
4.2.5 Regal Tasman Market Neutral Fund
Investment Team
Name Qualifi cations Position (Title) Responsibilites LocationDate
JoinedCompany
Years with
Company
InvestmentManagementExperience
Philip King
B.Com,GraduateDiploma in Finance and Investment,CFA Charter holder
CIO Portfolio Manager Sydney 1/01/2006 5 17
Julian Babarczy
B.Bus,GraduateDiploma in Applied Finance and Investment, CFA Charter holder
AnalystEnergy, Mining, Telecomms, Health, Technology
Sydney 1/05/2006 5 8
Andrew West B.Com, PhD in Finance Analyst
Basic Materials (except mining), Industrials, Mining Services
Sydney 1/03/2008 3.5 10
Joseph Koh B.Bus, CFA Charter holder Analyst
Financials,Consumers,Infrastructure, Utilities
Sydney 1/05/2008 3 14
Additions to Investment Team - last 3 years
Name Qualifi cations Position (Title) Responsibilites LocationDate
JoinedCompany
Years with
Company
InvestmentManagementExperience
Kah-Wing TangM.Bus,M.Engineering,B.Arts
Research Analyst Asia Singapore 17/03/2011 <1 5
Tim Campbell
B.Com,GraduateDiploma in Finance and Investment
Portfolio Manager, Asia
Asia, Europe, North America Sydney 1/01/2010 3 12
Mike Byrne B Comm, BSc Mining Research Analyst Resources Sydney 27/04/2011 <1 16
Jonathan Margo B.Com/Law Dealer Sydney 18/04/2011 <1 3
Departures to Investment Team - last 3 years
Name Qualifi cations Position (Title) Responsibilites LocationDate
JoinedCompany
Years with
Company
InvestmentManagementExperience
Nil
Total Number of Staff as at 31/09/2011: Total Number of Staff as at 31/07/2010: Total Number of Staff as at 31/09/2009:
Firm Wide: 22 Firm Wide: 14 Firm Wide: 11
Investment Staff 13 (includes Quant) Investment Staff 8 Investment Staff 7

30
5.0 FUND CHARACTERISTICS
5.1 Key Dates & Fund StructuresThe below table outlines the managers’ inception dates, fund launch dates, minimum investment amounts and the structure of the investment vehicles.
Fund Name Manager Inception Date Fund Min. Investment Fund Structure
Aurora Fortitude Absolute Return Trust 2004 March 2005 A$100,000 IM
Bennelong Long Short Equity Fund 2002 March 2008 A$500,000 IM
BlackRock Australian Equity Market Neutral Fund 1996 August 2001 A$500,000 IM
Pengana Australian Market Neutral Fund 2003 September 2007 A$5,000 IM
Regal Tasman Market Neutral Fund 2004 May 2007 A$250,000 IM
5.2 Risk/ Return Objec� vesRisk/return objectives vary within the sector; there is little correlation between the investment strategies or approaches used by the respective managers.
Fund Name Risk Objective Return Objective
Aurora Fortitude Absolute Return Trust 2-6% p.a. standard deviation 5-10% above RBA cash rate
Bennelong Long Short Equity Fund Sharpe ratio of 1 12% p.a.
BlackRock Australian Equity MN Fund 5% p.a. RBA Cash Rate plus 8% p.a.
Pengana Australian Market Neutral Fund 8-10% standard deviation 5-10% p.a. net fees above RBA Cash Rate
Regal Tasman Market Neutral Fund To limit volatility of returns to <15%
To provide attractive returns uncorrelated to the market

31
5.3 Por� olio Details
Fund NameAverage number of
securities held since inception
Expected Range
Aurora Fortitude Absolute Return Trust 85 25-125
Bennelong Long Short Equity Fund 31 long33 short
60-70(30-35 pairs)
BlackRock Australian Equity Market Neutral Fund Within expected range 70-100 long70-90 short
Pengana Australian Market Neutral Fund 150 100-175
Regal Tasman Market Neutral Fund 150 70-130
5.4 Country & Sector Exposures
Fund Name Australia or global mandate? Largest Regional Holdings Largest Sector Exposure (net)
Aurora Fortitude Absolute Return Trust Australia Australia Consumer Staples, IT, Energy
Bennelong Long Short Equity Fund Australia Australia Energy, Healthcare
BlackRock Australian Equity Market Neutral Fund Australia Australia Financials. Materials
Pengana Australian Market Neutral Fund Australia Australia Gold, Materials
Regal Tasman Market Neutral Fund Australia & others Australia Energy, Industrials, Utilities
5.5 Sector Weigh� ngsThe graph illustrates that sector weightings may vary signifi cantly between funds, and also highlights that returns from each fund should have low correlations to each other. This also results from investment mandates which do not have restrictions to sector exposures. Of note is a strong net exposure to energy stocks across a number of funds.

32
5.6 Gross & Net Exposures The graphs below show the average gross and net exposures of Zenith’s Approved Product List funds over the past four years. The right hand axis shows 12 month rolling returns for the S&P/ASX 300 Accumulation Index over the same period. It is interesting to note that the funds have tended to reduce and increase their gross and net market exposures slightly ahead of major market movements in most cases.

33
5.7 Performance A� ribu� on - Long and Short Posi� onsWe were unable to source attribution data for every fund manager over the displayed timeframe. However the chart illustrates the success of the aggregated universe of rated funds in delivering alpha. Unsurprisingly the universe’s short positions led performance during the height of the credit crisis, whilst long positions have rebounded strongly following the market low reached in March 2009. However, the rebound in long positions has reversed during 2011.

34
5.8 Leverage Maximum and minimum gross and net exposures are shown below. Gross exposure is an important measure for investors to understand as it indicates the real degree of leverage in a portfolio. Gross leverage amplifi es the losses if a manager is not able to deliver value from its long and short components. For Zenith to qualify funds as “market neutral” we require a manger to limit net exposure to +/-30%. In most cases Zenith expects the funds listed below to have minimal market exposure over time.
Fund Name Min Gross Exposure Max Gross Exposure Min Net Exposure Max Net
Exposure
Aurora Fortitude Absolute Return Fund 0 500% -25% 25%
Bennelong Long Short Equity Fund - 500% -5% 5%
BlackRock Australian Equity Market Neutral Fund
long & short posiitons are approximately equal and opposite
in value and are each around
95% of the Fund's NAV
Pengana Australian Market Neutral Fund - 300% -5% 5%
Regal Tasman Market Neutral Fund 0% 300%
5.9 Risk SystemsBelow is a table outlining the risk systems employed by the fund managers. In all cases Zenith is satisfi ed that the managers have rigorous systems in place.
Fund Risk Systems Used: Soft Dollar Arrangement (Y/N)
Aurora Foritude Absolute Return FundRisk101
IressBloomberg
Y
Bennelong Long Short Equity Fund Bloomberg Y
BlackRock Australian Equity Market Neutral Fund
BARRARiskMetrics
FactSetGreenPackage
SWORD
N
Pengana Australian Market Neutral Fund InternalFactSet N
Regal Tasman Market Neutral Fund APTInternal N

35
5.10 Por� olio Liquidity The table below lists how many trading days would be required to sell the respective percentages of the portfolio with no impact on the portfolio. While liquidity is a common criticism of hedge funds the below table illustrates that our approved products are highly liquid.
Fund Name 50% of Portfolio 75% of Portfolio 100% of Portfolio
This information has been provided by the Fund managers As at June 30, 2011
Aurora Fortitude Absolute Return Trust 1 1-3 2-5
Bennelong Long Short Equity Fund 1-2 wks 3-4 wks ~4 wks
BlackRock Australian Equity Market Neutral Fund 1 1 6
Pengana Australian Market Neutral Fund 3 4 5
Regal Tasman Market Neutral Fund 2 5 10
5.11 Por� olio Turnover Whilst Zenith does not consider portfolio turnover levels when assessing the quality of funds, we are interested in the divergence of trading activity between the funds. A number of managers have very high trading strategies in line with their respective approaches, whilst other more fundamentally driven strategies have lower turnover.
Fund Name Expected Annual Turnover
01/07/2010 - 31/06/2011
01/07/2009 - 31/06/2010
01/07/2008 - 31/06/2009
Aurora Fortitude Absolute Return Fund 240% 240% 240% 240%
Bennelong Long Short Equity Fund 70% 60% 64% 74%
BlackRock Australian Equity Market Neutral Fund 250% 285% 241% 273%
Pengana Australian Market Neutral Fund 700% 1024% 929% 673%
Regal Tasman Market Neutral Fund N/A N/A N/A N/A
5.12 Funds Under Management
Fund Name FUM in Wholesale Fund
FUM in Strategy (Firm Wide) Expected Capacity
$A
Aurora Fortitude Absolute Return Fund $47m $457m $1bn
Bennelong Long Short Equity Fund $206m $250m Soft Close
BlackRock Australian Equity Market Neutral Fund $180m $310m Not stated
Pengana Australian Market Neutral Fund $2m $2m $750m
Regal Tasman Market Neutral Fund $71m $815m $1bn

36
5.13 Redemp� on & Subscrip� on Terms The majority of the funds rated offer daily liquidity which is one of the most attractive aspects of the long/short equities sector relative to other hedge fund sectors. Other hedge managers argue that money fl owing in and out of the funds affects performance for long term investors. Liquidity issues are an aspect of hedge fund investing that Zenith believes is crucial for investors to understand.
Fund Name RedemptionFrequency
RedemptionNotice
RedemptionFee
RedemptionGate Lock-Up Subscription
FrequencySubscriptionNotice
Aurora Fortitude Absolute Return Fund Daily Daily Nil Nil Nil Daily Daily
Bennelong Long Short Equity Fund Monthly 28 days Nil Discretionary 180 days Monthly Daily
BlackRock Australian Equity Market Neutral Fund
Daily T+1 Nil Nil Nil Daily T+1
Pengana Australian Market Neutral Fund Monthly 30 days Nil Discretionary Nil Monthly
3 business days prior to month end
Regal Tasman Market Neutral Fund Monthly 20 days Nil Nil Nil Monthly 3 days
5.14 Fees The fee structures applied to each of the funds on the Approved List are outlined below. Whilst we acknowledge that hedge fund fees are higher than mainstream offerings we believe that each fund on the list is generating alpha commensurate with the fees charged.
Fund Name Base Fee (p.a.): Performance Fee (%):
Perf. Fee Benchmark:
High Water Mark (Y/N):
Aurora Foritude Absolute Return Fund 1.50% 20.0% RBA Cash Rate Yes
Bennelong Long Short Equity Fund 1.50% 20.0% Nil Yes
BlackRock Australian Equity Market Neutral Fund 1.00% 20.0% Nil Yes
Pengana Australian Market Neutral Fund 1.00% 20.0% RBA Cash Rate No
Regal Tasman Market Neutral Fund 2.00% 20.0% Nil YesYes

37
5.15 Service Providers
Fund Name Prime Broker Custodian Administrator Auditor Legal ComplianceAdvisor
Aurora Fortitude Absolute Return Fund UBS UBS MacKenzie
Coultas PWC Baker & Mackenzie
Bennelong Long Short Equity Fund UBS AG UBS Nominees Kingsway Taitz Deloitte DLA Philips
FoxCompliance Risk Services
BlackRock Australian Equity Market Neutral Fund
JP Morgan JP MorganBlackRock Asset Management,Aus
PWC MinterEllison N/A
Pengana Australian Market Neutral Fund UBS AG UBS Nominees BNP Paribas PWC DLA Philips
Fox Internal
Regal Tasman Market Neutral Fund
UBS AGMorgan Stanley
UBS NomineesMorgan Stanley HSBC KPMG Henry Davis
York Lazorne Group
In the period leading up to the credit crisis, many prime broking agreements were written in favour of the investment banks providing that service. One of the terms consistent across prime brokers was that all hedge funds assets, regardless of whether or not they were being used as collateral were immediately moved from a client account to the investment bank’s accounts. This provides additional liquidity for the investment bank and allows the prime broker to lend client assets as a collateral for its own borrowing. However the action leaves hedge funds exposed as an unsecured creditor to the bank. Such situations make it diffi cult for the hedge fund to extract its securities once the prime broker fails.
The Lehman Brothers collapse dramatically highlighted this fact, with many large hedge funds losing considerable assets.
Post crisis, prime brokers are offering a variety of solutions to this considerable problem. We will increase our confi dence in the hedge fund industry further when these solutions are widely implemented. The most important of these changes, we opine, is the segregation of assets. Assets should only be transferred to the prime broker when required to provide collateral. Such an approach is costly, to both the hedge fund and the investment bank but we maintain this is the most prudent approach.
5.16 TransparencyTo address the common criticism of transparency Zenith has asked the Approved List managers to provided full portfolio holdings and weights. Below is a record of those managers that have complied with our request.
Fund Name Yes/No
Aurora Fortitude Absolute Return Fund Yes
Bennelong Long Short Equity Fund Yes
BlackRock Australian Equity Market Neutral Fund Yes
Pengana Australian Market Neutral Fund Yes
Regal Tasman Market Neutral Fund Yes

38
From: To:Benchmark 1 Australia All Ordinaries Equity IndexBenchmark 2 RBA Cash Rate
Annual Returns Fund OrdinariesBA Cash Ra2.35% (16.03)% 3.62%4.33% (0.73)% 4.44%5.91% 33.43% 3.32%12.35% (43.01)% 6.85%9.54% 13.76% 6.59%16.75% 19.87% 5.97%Fund OrdinariesBA Cash Ra0.11% (6.86)% 0.40%1.82% (12.66)% 1.19%6.54% (12.22)% 4.83%4.17% (7.33)% 4.49%5.47% (4.21)% 4.24%7.17% (4.46)% 5.28%Fund OrdinariesBA Cash Ra
(2.09)% (51.37)% 0.00%(2.06)% (5.13)%(0.87)% (4.80)%(0.58)% (3.92)%(0.50)% (2.43)%
Year Jan Feb Mar Apr May Jun Jul Aug Sep Oct Nov Dec Year2011 0.31% 0.90% 0.16% 1.25% (1.46)% (0.61)% 0.51% 1.19% 0.11% 2.35%2010 0.44% (0.13)% (0.73)% 0.43% 0.91% (0.49)% (1.60)% 0.86% 0.58% 1.61% 1.37% 1.05% 4.33%2009 0.21% 0.01% 0.28% 0.26% 1.20% 1.55% 0.55% 0.67% (0.58)% 0.82% (0.02)% 0.82% 5.91%2008 1.34% 0.17% 0.27% 1.21% 0.63% 0.18% 0.45% 1.14% 2.61% 3.13% 0.21% 0.37% 12.35%2007 1.14% 0.52% 0.32% 1.40% 0.21% 0.36% 0.63% 3.06% (0.30)% 0.71% 1.32% (0.23)% 9.54%2006 1.71% 1.82% 1.38% 1.82% 3.63% 0.57% 1.55% 0.27% 1.32% 0.61% 0.14% 0.80% 16.75%2005 1.02% 0.96% 1.50% 1.58% 0.92% 0.18% 0.52% 1.34% 0.28% (0.50)% 8.06%
Return Fund OrdinariesBA Cash Ra8.93% (0.32)% 5.39%75.59% (2.08)% 41.26%
3.63% 7.64% 0.60%
Aurora Fortitude Absolute Return FundMarch 2005 September 2011
2009
2007
Best Month
Compound RORCumulative Return
Cumulative returns
Distribution of Returns
3
2008
2011
Latest Returns
2010
2006
Drawdown Analysis
Monthly Performance (%) Net of Fees
45
12
Last Year
Last MonthLast Quarter
2-Year3-Year5-Year
35
40
45
-2%
-1%
0%
1%
2%
3%
4%
-40%
-20%
0%
20%
40%
60%
80%
100%
Monthly R
eturn
Cum
ulat
ive
Ret
urn
Monthly Return Aurora Fortitude Absolute Return Fund Australia All Ordinaries Equity Index RBA Cash Rate
(1.60)% (14.00)% 0.25%86.08% 56.96% 100.00%
Risk Fund OrdinariesBA Cash Rate3.09% 15.30% 0.35%1.21 -0.26 1.05-0.45 -0.74 -3.332.18% 13.37% 1.29%
(2.09)% (51.37)% 0.00%2.00 16.003.00 0.00
Comparison to Benchmark(s) Australia All OrdinariesBA Cash Rate0.72% (0.19)%9.02% (2.25)%-0.04 2.07-0.22 0.240.05 0.06
Underwater Analysis
BetaCorrelationR-Squared
Months in Maximum DrawdownMonths to Recover
Annualised Sharpe
AlphaAnnualised Alpha
Downside Deviation (10%)
Sharpe Ratio (5%)Sortino Ratio (10%)
Max Drawdown
Worst Month% Positive Months
Standard Deviation
0
5
10
15
20
25
30
35
40
< -1
0%
-10
to -9
-9 to
-8
-8 to
-7
-7 to
-6
-6 to
-5
-5 to
-4
-4 to
-3
-3 to
-2
-2 to
-1
-1 to
0
0 to
1
1 to
2
2 to
3
3 to
4
4 to
5
5 to
6
6 to
7
7 to
8
8 to
9
9 to
10
> 10
%
Mon
thly
Per
iods
Return Range (%)
-60%
-50%
-40%
-30%
-20%
-10%
0%
Dra
wdo
wn
Aurora Fortitude Absolute Return Fund RBA Cash Rate Australia All Ordinaries Equity Index
-9.0
-8.0
-7.0
-6.0
-5.0
-4.0
-3.0
-2.0
-1.0
0.0
1.0
2.0
1 Year 3 Year 5 Year 7 Year 10 Year
An
nu
alis
ed S
har
pe
Aurora Fortitude Absolute Return Fund Australia All Ordinaries Equity Index RBA Cash Rate
6.0 APPENDICES
Appendix 1: Performance: Aurora Fortitude Absolute Return Fund

39
From: To:Benchmark 1 Australia All Ordinaries Equity IndexBenchmark 2 RBA Cash Rate
Annual Returns Fund BM1 BM219.32% (16.03)% 3.62%12.71% (0.73)% 4.44%23.64% 33.43% 3.32%11.95% (43.01)% 6.85%22.51% 13.76% 6.59%49.91% 19.87% 5.97%Fund BM1 BM2
(1.25)% (6.86)% 0.40%2.77% (12.66)% 1.19%28.79% (12.22)% 4.83%20.59% (7.33)% 4.49%22.41% (4.21)% 4.24%19.93% (4.46)% 5.28%
(12.22)% (51.37)% 0.00%(8.31)% (18.38)%(7.05)% (5.13)%(6.16)% (4.80)%(5.98)% (3.92)%
Year Jan Feb Mar Apr May Jun Jul Aug Sep Oct Nov Dec Year2011 (0.59)% 4.39% 1.85% 2.34% 3.09% 4.12% 2.12% 1.91% (1.25)% 19.32%2010 0.25% (6.16)% 4.77% (1.10)% 3.24% 2.83% 2.90% (0.96)% (0.98)% 1.23% 2.87% 3.65% 12.71%2009 5.69% 7.88% (1.72)% 4.26% (1.24)% (7.16)% 2.24% 5.61% (1.14)% 2.65% 1.71% 3.57% 23.64%2008 (2.10)% (2.82)% 3.40% 1.06% 7.07% 7.36% 1.16% (3.57)% (8.98)% 3.78% 5.78% 0.49% 11.95%2007 0.55% 5.42% 3.62% (3.12)% 0.92% (2.90)% 1.70% (3.72)% 5.63% (0.22)% 4.41% 9.04% 22.51%2006 1.24% 4.76% 10.16% 2.90% 2.59% 0.95% 5.57% 7.67% (2.62)% 5.22% 2.01% 1.35% 49.91%2005 6.29% 7.29% 5.01% (0.49)% (0.27)% 1.81% (2.87)% (1.51)% 4.10% (2.33)% 2.88% 8.73% 31.64%2002 (3.31)% 3.12% (1.05)% (0.31)% (0.92)% 1.17% 2.64% (3.45)% (2.61)% 3.86% 4.59% 3.35%
Return Fund OrdinariesBA Cash Ra20.75% 1.84% 5.27%518.92% 19.24% 64.31%
10.16% 7.64% 0.60%
12
Last Year
Last MonthLast Quarter
2-Year
Cumulative returns
Distribution of Returns
3
2008
2011
Latest Returns
2010
2006
Drawdown Analysis
Monthly Performance (%) Net of Fees
45
3-Year5-Year
2009
2007
Best Month
Compound RORCumulative Return
February 2002 September 2011Bennelong Long Short Equity Fund
12
14
16
-10%
-5%
0%
5%
10%
15%
-100%
0%
100%
200%
300%
400%
500%
600%
Monthly R
eturn
Cum
ulat
ive
Ret
urn
Monthly Return Bennelong Long Short Equity Fund Australia All Ordinaries Equity Index RBA Cash Rate
(8.98)% (14.00)% 0.25%68.10% 60.34% 100.00%
Risk11.79% 13.58% 0.30%
1.25 -0.16 0.871.36 -0.66 -3.37
6.94% 11.78% 1.31%(12.22)% (51.37)% 0.00%
2.00 16.004.00 0.00
1.64% 0.76%21.52% 9.52%
0.01 2.050.02 0.050.00 0.00
Underwater Analysis
Worst Month% Positive Months
Standard Deviation
Downside Deviation (10%)
Sharpe Ratio (5%)Sortino Ratio (10%)
Max Drawdown
AlphaAnnualised Alpha
Months in Maximum Drawdown
Comparison to Benchmark(s)Months to Recover
Annualised Sharpe
BetaCorrelationR-Squared
0
2
4
6
8
10
12
14
< -1
0%
-10
to -9
-9 to
-8
-8 to
-7
-7 to
-6
-6 to
-5
-5 to
-4
-4 to
-3
-3 to
-2
-2 to
-1
-1 to
0
0 to
1
1 to
2
2 to
3
3 to
4
4 to
5
5 to
6
6 to
7
7 to
8
8 to
9
9 to
10
> 10
%
Mon
thly
Per
iods
Return Range (%)
-60%
-50%
-40%
-30%
-20%
-10%
0%
Dra
wdo
wn
Bennelong Long Short Equity Fund RBA Cash Rate Australia All Ordinaries Equity Index
-10.0
-8.0
-6.0
-4.0
-2.0
0.0
2.0
4.0
6.0
1 Year 3 Year 5 Year 7 Year 10 Year
An
nu
alis
ed S
har
pe
Bennelong Long Short Equity Fund Australia All Ordinaries Equity Index RBA Cash Rate
Appendix 2: Performance: Bennelong Long Short Equity Fund
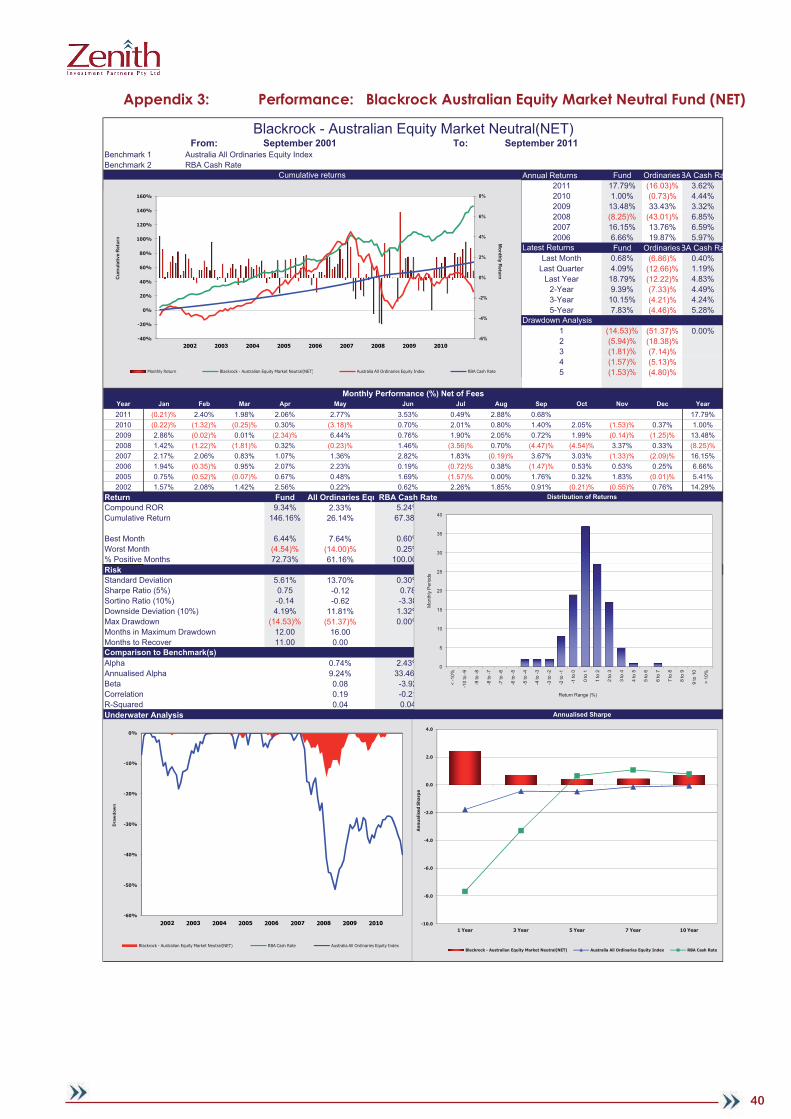
40
Appendix 3: Performance: Blackrock Australian Equity Market Neutral Fund (NET)
From: To:Benchmark 1 Australia All Ordinaries Equity IndexBenchmark 2 RBA Cash Rate
Annual Returns Fund Ordinaries BA Cash Ra17.79% (16.03)% 3.62%1.00% (0.73)% 4.44%
13.48% 33.43% 3.32%(8.25)% (43.01)% 6.85%16.15% 13.76% 6.59%6.66% 19.87% 5.97%Fund Ordinaries BA Cash Ra
0.68% (6.86)% 0.40%4.09% (12.66)% 1.19%
18.79% (12.22)% 4.83%9.39% (7.33)% 4.49%
10.15% (4.21)% 4.24%7.83% (4.46)% 5.28%
(14.53)% (51.37)% 0.00%(5.94)% (18.38)%(1.81)% (7.14)%(1.57)% (5.13)%(1.53)% (4.80)%
Year Jan Feb Mar Apr May Jun Jul Aug Sep Oct Nov Dec Year2011 (0.21)% 2.40% 1.98% 2.06% 2.77% 3.53% 0.49% 2.88% 0.68% 17.79%2010 (0.22)% (1.32)% (0.25)% 0.30% (3.18)% 0.70% 2.01% 0.80% 1.40% 2.05% (1.53)% 0.37% 1.00%2009 2.86% (0.02)% 0.01% (2.34)% 6.44% 0.76% 1.90% 2.05% 0.72% 1.99% (0.14)% (1.25)% 13.48%2008 1.42% (1.22)% (1.81)% 0.32% (0.23)% 1.46% (3.56)% 0.70% (4.47)% (4.54)% 3.37% 0.33% (8.25)%2007 2.17% 2.06% 0.83% 1.07% 1.36% 2.82% 1.83% (0.19)% 3.67% 3.03% (1.33)% (2.09)% 16.15%2006 1.94% (0.35)% 0.95% 2.07% 2.23% 0.19% (0.72)% 0.38% (1.47)% 0.53% 0.53% 0.25% 6.66%2005 0.75% (0.52)% (0.07)% 0.67% 0.48% 1.69% (1.57)% 0.00% 1.76% 0.32% 1.83% (0.01)% 5.41%2002 1.57% 2.08% 1.42% 2.56% 0.22% 0.62% 2.26% 1.85% 0.91% (0.21)% (0.55)% 0.76% 14.29%
Return Fund All Ordinaries Equ RBA Cash Rate9.34% 2.33% 5.24%
146.16% 26.14% 67.38%
6.44% 7.64% 0.60%(4.54)% (14.00)% 0.25%72.73% 61.16% 100.00%
Risk
Cumulative returns
Distribution of Returns
3
2008
2011
Latest Returns
12
Last Year
Last MonthLast Quarter
2-Year
2010
2006
Drawdown Analysis
Monthly Performance (%) Net of Fees
45
3-Year5-Year
2009
2007
Best Month
Compound RORCumulative Return
Worst Month% Positive Months
September 2001 September 2011Blackrock - Australian Equity Market Neutral(NET)
25
30
35
40
erio
ds
-6%
-4%
-2%
0%
2%
4%
6%
8%
-40%
-20%
0%
20%
40%
60%
80%
100%
120%
140%
160%
Monthly R
eturnCum
ulat
ive
Ret
urn
Monthly Return Blackrock - Australian Equity Market Neutral(NET) Australia All Ordinaries Equity Index RBA Cash Rate
5.61% 13.70% 0.30%0.75 -0.12 0.78-0.14 -0.62 -3.384.19% 11.81% 1.32%
(14.53)% (51.37)% 0.00%12.00 16.0011.00 0.00
0.74% 2.43%9.24% 33.46%0.08 -3.920.19 -0.210.04 0.04
Underwater Analysis
Standard Deviation
Comparison to Benchmark(s)Months to Recover
Downside Deviation (10%)
Sharpe Ratio (5%)Sortino Ratio (10%)
Max Drawdown
Annualised Sharpe
BetaCorrelationR-Squared
AlphaAnnualised Alpha
Months in Maximum Drawdown
0
5
10
15
20
25
< -1
0%
-10
to -9
-9 to
-8
-8 to
-7
-7 to
-6
-6 to
-5
-5 to
-4
-4 to
-3
-3 to
-2
-2 to
-1
-1 to
0
0 to
1
1 to
2
2 to
3
3 to
4
4 to
5
5 to
6
6 to
7
7 to
8
8 to
9
9 to
10
> 10
%
Mon
thly
Per
iods
Return Range (%)
-60%
-50%
-40%
-30%
-20%
-10%
0%
Dra
wdo
wn
Blackrock - Australian Equity Market Neutral(NET) RBA Cash Rate Australia All Ordinaries Equity Index
-10.0
-8.0
-6.0
-4.0
-2.0
0.0
2.0
4.0
1 Year 3 Year 5 Year 7 Year 10 Year
An
nu
alis
ed S
har
pe
Blackrock - Australian Equity Market Neutral(NET) Australia All Ordinaries Equity Index RBA Cash Rate
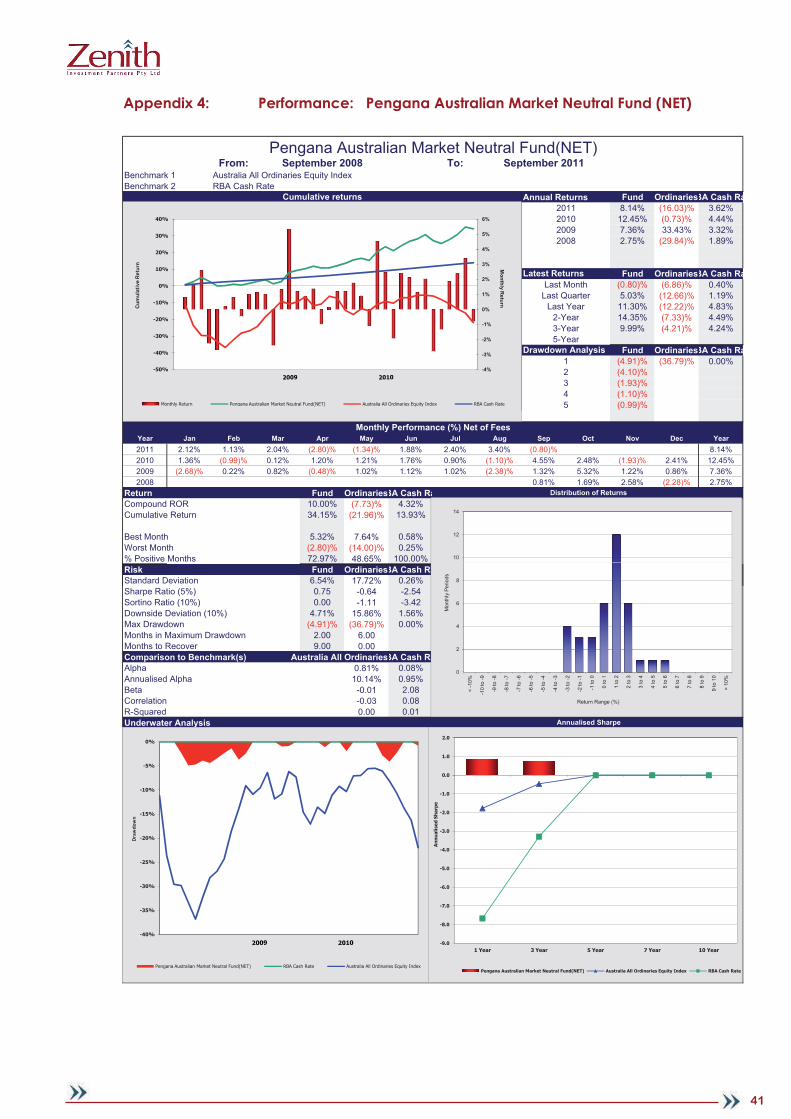
41
Appendix 4: Performance: Pengana Australian Market Neutral Fund (NET)
From: To:Benchmark 1 Australia All Ordinaries Equity IndexBenchmark 2 RBA Cash Rate
Annual Returns Fund Ordinaries BA Cash Ra8.14% (16.03)% 3.62%12.45% (0.73)% 4.44%7.36% 33.43% 3.32%2.75% (29.84)% 1.89%
Fund Ordinaries BA Cash Ra(0.80)% (6.86)% 0.40%5.03% (12.66)% 1.19%11.30% (12.22)% 4.83%14.35% (7.33)% 4.49%9.99% (4.21)% 4.24%
Fund Ordinaries BA Cash Ra(4.91)% (36.79)% 0.00%(4.10)%(1.93)%(1.10)%(0.99)%
Year Jan Feb Mar Apr May Jun Jul Aug Sep Oct Nov Dec Year2011 2.12% 1.13% 2.04% (2.80)% (1.34)% 1.88% 2.40% 3.40% (0.80)% 8.14%2010 1.36% (0.99)% 0.12% 1.20% 1.21% 1.76% 0.90% (1.10)% 4.55% 2.48% (1.93)% 2.41% 12.45%2009 (2.68)% 0.22% 0.82% (0.48)% 1.02% 1.12% 1.02% (2.38)% 1.32% 5.32% 1.22% 0.86% 7.36%2008 0.81% 1.69% 2.58% (2.28)% 2.75%
Return Fund Ordinaries BA Cash Ra10.00% (7.73)% 4.32%34.15% (21.96)% 13.93%
5.32% 7.64% 0.58%(2.80)% (14.00)% 0.25%72.97% 48.65% 100.00%
Risk Fund Ordinaries BA Cash Rate
Pengana Australian Market Neutral Fund(NET)September 2008 September 2011
Worst Month% Positive Months
2009
Best Month
Compound RORCumulative Return
Cumulative returns
Distribution of Returns
3
2008
2011
Latest Returns
2010
Drawdown Analysis
Monthly Performance (%) Net of Fees
45
12
Last Year
Last MonthLast Quarter
2-Year3-Year5-Year
8
10
12
14
erio
ds
-4%
-3%
-2%
-1%
0%
1%
2%
3%
4%
5%
6%
-50%
-40%
-30%
-20%
-10%
0%
10%
20%
30%
40%
Monthly R
eturn
Cum
ulat
ive
Ret
urn
Monthly Return Pengana Australian Market Neutral Fund(NET) Australia All Ordinaries Equity Index RBA Cash Rate
6.54% 17.72% 0.26%0.75 -0.64 -2.540.00 -1.11 -3.42
4.71% 15.86% 1.56%(4.91)% (36.79)% 0.00%
2.00 6.009.00 0.00
Comparison to Benchmark(s) Australia All Ordinaries BA Cash Rate0.81% 0.08%10.14% 0.95%-0.01 2.08-0.03 0.080.00 0.01
Underwater Analysis
BetaCorrelationR-Squared
Months in Maximum DrawdownMonths to Recover
Annualised Sharpe
AlphaAnnualised Alpha
Downside Deviation (10%)
Sharpe Ratio (5%)Sortino Ratio (10%)
Max Drawdown
Standard Deviation
0
2
4
6
8
< -1
0%
-10
to -9
-9 to
-8
-8 to
-7
-7 to
-6
-6 to
-5
-5 to
-4
-4 to
-3
-3 to
-2
-2 to
-1
-1 to
0
0 to
1
1 to
2
2 to
3
3 to
4
4 to
5
5 to
6
6 to
7
7 to
8
8 to
9
9 to
10
> 10
%
Mon
thly
Per
iods
Return Range (%)
-40%
-35%
-30%
-25%
-20%
-15%
-10%
-5%
0%
Dra
wdo
wn
Pengana Australian Market Neutral Fund(NET) RBA Cash Rate Australia All Ordinaries Equity Index
-9.0
-8.0
-7.0
-6.0
-5.0
-4.0
-3.0
-2.0
-1.0
0.0
1.0
2.0
1 Year 3 Year 5 Year 7 Year 10 Year
Ann
ualis
ed S
harp
e
Pengana Australian Market Neutral Fund(NET) Australia All Ordinaries Equity Index RBA Cash Rate

42
Appendix 6: Performance: Regal Tasman Market Neutral Fund
From: To:Benchmark 1 Australia All Ordinaries Equity IndexBenchmark 2 RBA Cash Rate
Annual Returns Fund Ordinaries BA Cash Ra24.48% (16.03)% 3.62%33.23% (0.73)% 4.44%50.65% 33.43% 3.32%(9.80)% (43.01)% 6.85%29.50% 4.27% 4.39%
Fund Ordinaries BA Cash Ra(2.23)% (6.86)% 0.40%3.45% (12.66)% 1.19%38.38% (12.22)% 4.83%35.03% (7.33)% 4.49%32.91% (4.21)% 4.24%
Fund Ordinaries BA Cash Ra(23.10)% (51.37)% 0.00%(9.55)% (2.43)%(2.58)%(2.23)%(1.62)%
Year Jan Feb Mar Apr May Jun Jul Aug Sep Oct Nov Dec Year2011 (1.45)% 3.25% 2.50% 7.91% 5.05% 1.77% 5.20% 0.58% (2.23)% 24.48%2010 1.41% (0.81)% 3.88% 2.23% (2.58)% 2.50% 1.50% 4.41% 6.02% 4.20% 4.35% 2.24% 33.23%2009 6.47% (0.62)% 1.07% (2.91)% 2.05% 8.83% 4.00% 4.10% 9.76% 8.44% 2.70% (1.28)% 50.65%2008 1.69% 4.62% (9.55)% 5.32% 7.61% 7.56% (5.03)% (4.22)% (10.04)% (4.15)% 0.97% (2.90)% (9.80)%2007 3.31% 2.74% 4.65% (1.62)% 3.23% 5.51% 6.59% 2.07% 29.50%
Return Fund Ordinaries BA Cash Ra27.44% (8.95)% 5.13%
191.85% (33.91)% 24.73%
9.76% 7.64% 0.60%(10.04)% (14.00)% 0.25%73.58% 47.17% 100.00%
Regal Tasman Market Neutral FundMay 2007 September 2011
Worst Month% Positive Months
2009
2007
Best Month
Compound RORCumulative Return
Cumulative returns
Distribution of Returns
3
2008
2011
Latest Returns
2010
Drawdown Analysis
Monthly Performance (%) Net of Fees
45
12
Last Year
Last MonthLast Quarter
2-Year3-Year5-Year
6
7
8
9
s
-15%
-10%
-5%
0%
5%
10%
15%
-100%
-50%
0%
50%
100%
150%
200%
250%
Monthly R
eturn
Cum
ulat
ive
Ret
urn
Monthly Return Regal Tasman Market Neutral Fund Australia All Ordinaries Equity Index RBA Cash Rate
Risk Fund Ordinaries BA Cash Rate14.73% 17.09% 0.41%
1.40 -0.75 0.311.62 -1.20 -3.31
9.23% 15.74% 1.38%(23.10)% (51.37)% 0.00%
6.00 16.009.00 0.00
Comparison to Benchmark(s) Australia All Ordinaries BA Cash Rate2.33% 5.20%31.89% 83.76%
0.31 -7.350.36 -0.200.13 0.04
Underwater Analysis
BetaCorrelationR-Squared
Months in Maximum DrawdownMonths to Recover
Annualised Sharpe
AlphaAnnualised Alpha
Downside Deviation (10%)
Sharpe Ratio (5%)Sortino Ratio (10%)
Max Drawdown
Standard Deviation
0
1
2
3
4
5
6
< -1
0%
-10
to -9
-9 to
-8
-8 to
-7
-7 to
-6
-6 to
-5
-5 to
-4
-4 to
-3
-3 to
-2
-2 to
-1
-1 to
0
0 to
1
1 to
2
2 to
3
3 to
4
4 to
5
5 to
6
6 to
7
7 to
8
8 to
9
9 to
10
> 10
%
Mon
thly
Per
iods
Return Range (%)
-60%
-50%
-40%
-30%
-20%
-10%
0%
Dra
wdo
wn
Regal Tasman Market Neutral Fund RBA Cash Rate Australia All Ordinaries Equity Index
-10.0
-8.0
-6.0
-4.0
-2.0
0.0
2.0
4.0
1 Year 3 Year 5 Year 7 Year 10 Year
Ann
ualis
ed S
harp
e
Regal Tasman Market Neutral Fund Australia All Ordinaries Equity Index RBA Cash Rate

43
Contributors:
Fund Reports Angela Burmeister Investment AnalystDaniel Liptak Head of AlternativesDavid Smythe Director
Sector ReportAngela Burmeister Investment Analyst
Daniel Liptak Head of Alternatives
(03) 9642 3320 [email protected]
DISCLAIMER:
This report is prepared exclusively for clients of Zenith Investment Partners (Zenith). The report contains recommendations and advice of a general nature and does not have regard to the particular circumstances or needs of any specifi c person who may read it. Each client should assess either personally or with the assistance of a licensed fi nancial adviser whether the Zenith recommendation or advice is appropriate to their situation before making an investment decision. The information contained in the report is believed to be reliable, but its completeness and accuracy is not guaranteed. Opinions expressed may change without notice. Zenith accepts no liability, whetherdirect or indirect arising from the use of information contained in this report. No part of this report is to be construed as a solicitation to buy or sell any investment. The performance of the investment in this report is not a representation as to future performance or likely return. The material contained in this report is subject to copyright and may not be reproduced without the consent of the copyright owner. Zenith usually receives a fee for assessing the fund manager and product(s) described in this document against accepted criteria consideredcomprehensive and objective.
iTriple A Partners Australia, Basis Point Consulting
ii APRA Statistics, Half Yearly General Insurance Bulletin, December 2009
iii Investor Supermarket
iv Eureka Hedge, Asia Hedge, as at 31 December 2009, Triple A Partners Australia, Basis Point Consulting