MARKET INTEREST RATE FLUCTUATIONS: IMPACT ON THE … · 2016-06-15 · It was found that...
90
MARKET INTEREST RATE FLUCTUATIONS: IMPACT ON THE PROFITABILTY OF COMMERCIAL BANKS by EUPHEMIA IFEOMA GODSPOWER-AKPOMIEMIE Thesis submitted in fulfilment of the requirements for the degree of Master of Management in Finance & Investment in the FACULTY OF COMMERCE LAW AND MANAGEMENT WITS BUSINESS SCHOOL at the UNIVERSITY OF THE WITWATERSRAND SUPERVISOR: PROFESSOR KALU OJAH
Transcript of MARKET INTEREST RATE FLUCTUATIONS: IMPACT ON THE … · 2016-06-15 · It was found that...

MARKET INTEREST RATE FLUCTUATIONS: IMPACT ON
THE PROFITABILTY OF COMMERCIAL BANKS
by
EUPHEMIA IFEOMA GODSPOWER-AKPOMIEMIE
Thesis submitted in fulfilment of the requirements for the degree of
Master of Management in Finance & Investment
in the
FACULTY OF COMMERCE LAW AND MANAGEMENT
WITS BUSINESS SCHOOL
at the
UNIVERSITY OF THE WITWATERSRAND
SUPERVISOR: PROFESSOR KALU OJAH

i
DECLARATION
I, Euphemia Ifeoma Godspower-Akpomiemie, declare that the research work reported in this
dissertation is my own, except where otherwise indicated and acknowledged. It is submitted
for the degree of Master of Management in Finance and Investment in the University of the
Witwatersrand, Johannesburg. This thesis has not, either in whole or in part, been submitted
for a degree or diploma to any other universities.
--------------------------------------------------
Euphemia Ifeoma Godspower-Akpomiemie
Signed at---------------------------------------------------------------------------------------------
On the------------------------------------- Day of----------------------------------------------2012

ii
ABSTRACT
There are many functions of the financial system, with the basic function of transferring
loanable funds from lender to borrowers (Rose et al, 1995). This financial transaction can be
carried out directly or semi directly between lenders and borrowers. The shortcomings of
direct and semi direct financing have opened doors for a third method—financial
intermediation, which is done by financial intermediaries.
Commercial bank is the classic example of financial intermediary at work. To achieve the
goal of owners’ wealth maximization, banks should manage their assets, liabilities, and
capital efficiently. In doing this, the bank should be conscious of the gap or spread between
the interest income and the interest expenses paid, which is called net interest income (NII).
Net interest income is a major part of banks’ profit, this is basically why the financial
intermediaries try to offer lowest returns to savers and lend funds to borrowers at the highest
possible interest rates. It is measured as net interest margin (NIM), which is NII divided by
the average earning assets.
This study examines the interest rate sensitivity of commercial banks’ interest profitability
(Net Interest Margin) and net worth at the theoretical level and attempt to measure
empirically the extent to which the interest profitability and net worth of commercial banks
have been affected during the period of changing interest rates between 2001 and 2010. It as
well measures the extent to which the factors that determine interest rate movement affect
interest rate and which of the factors has more effect on interest rate.
The measure of profitability captures the essence of lend-long borrow-short without directly
including other determinants of bank income, such as loan loss and loan volume, which may
be correlated with interest rates. It is also important to note that NIM is not a measure of total
banks’ profits since it does not include non-interest income and expenses.
A software package stata 10.0 was used to conduct the hypothesis testing, trend, and
correlation analysis. The sampled banks are fourteen commercial banks and one investment
bank in South Africa. The sampled banks were later divided into two groups (big and small),
based on their assets size as at the year-end 2010. There are five (5) big banks with asset size
of more than R100 billion and ten (10) small banks with asset size of less than R100 billion

iii
as at the year-end 2010. Analysis was further carried out separately on both the big and small
banks to see the effect of interest rate fluctuations on them. Data required by the model was
obtained from annual financial statements of the sampled banks for the period of ten years.
It was found that fluctuations on interest rate (repo rate) affect the profit of commercial
banks, but this effect is huge on small banks than the big banks. As the repo rate increases,
the profit of commercial banks increases. Such effect of repo rate on profit of commercial
banks was found to be statistically significant. It was also found that interest rate changes as
well affect the net worth of commercial banks. The macroeconomic factors the determine the
interest rates do not have direct effect on the banks’ profit, but have significant effect on the
banks’ net worth, especially that of the small banks. As the rate of inflation, the rate of money
supply, and uncertainty increase, the net worth of the small commercial banks in South Africa
also increase.
It could be advised that to maximize owners’ equity, South African commercial banks (big
and small) should concentrate more on forecasting and controlling the determinants of the
interest rates, rather than the interest rates themselves. It was also found that among the
internal factors affecting profit and net worth of commercial banks, the liquidity ratio is most
significant relative to capital ratio, competition, and non-performing loan.

iv
DEDICATION
This research report is dedicated to
God Almighty,
My husband: Mr Godspower Akpomiemie,
and
My children: Ejiro, and Yoma Godspower-Akpomiemie.

v
ACKNOWLEDGEMENTS
I would like to record my thanks and gratitude to everyone who assisted and encouraged me
during my master’s program and in the completion of this research. All their help and
understanding contributed to the successful completion of this difficult task. Particularly, I
would like to thank the following people
Prof. Kalu Ojah: My supervisor, whose extreme support and constant guidance provided
me with the inspiration to complete the research. His professional and
expert knowledge was critical in making this research possible.
My Family: Thanks to my hubby; GP, and my children; Ejiro and Yoma, for
believing in me and stuck with me throughout the entire program.
Especially my hubby for his sacrifices to ensure the program was a
success. To my parents; for bringing me into this world and giving me
a career path.
My friends: Thanks to all my friends, who helped me in one way or the other;
assistance, advice, encouragement, for the success of this program.

vi
TABLE OF CONTENTS
TITLE PAGE
DECLARATION .................................................................................................. i
ABSTRACT .........................................................................................................ii
DEDICATION .................................................................................................... iv
ACKNOWLEDGEMENTS ............................................................................... v
TABLE OF CONTENTS .................................................................................. vi
LIST OF TABLES .............................................................................................. x
LIST OF FIGURES ........................................................................................... xi
CHAPTER 1 ........................................................................................................ 1
INTRODUCTION ............................................................................................... 1
1.1 CONTEXT OF THE STUDY ............................................................................................ 1
1.2 PROBLEM STATEMENT ................................................................................................ 2
1.3 RESEARCH OBJECTIVES .............................................................................................. 3
1.4 RESEARCH QUESTIONS ............................................................................................... 4
1.5 DEFINITION OF TERMS AND ABBREVIATIONS...................................................... 4
1.6 LIMITATIONS .................................................................................................................. 5
1.7 ASSUMPTIONS ................................................................................................................ 6
1.8 OUTLINE OF THE STUDY ............................................................................................. 7
CHAPTER 2 ........................................................................................................ 8
LITERATURE REVIEW .................................................................................. 8
2.1 INTRODUCTION ............................................................................................................. 8
2.2 COMMERCIAL BANKS .................................................................................................. 8
2.3 COMMERCIAL BANKS’ SERVICES ............................................................................. 9

vii
2.3.1 Individual Banking ............................................................................................. 10
2.3.2 Institutional Banking .......................................................................................... 10
2.3.3 Global Banking .................................................................................................. 10
2.4 COMMERCIAL BANKS’ FUNDING ........................................................................... 11
2.4.1 Deposits.............................................................................................................. 12
2.4.2 Non-deposit Borrowings .................................................................................... 13
2.4.3 Equity Capital or Net Worth .............................................................................. 13
2.5 COMMERCIAL BANKS’ PRODUCTS ......................................................................... 13
2.5.1 Real Estate Loans ............................................................................................... 13
2.5.2 Commercial and Industrial (C&I) Loans ........................................................... 14
2.5.3 Individual (consumer) Loans ............................................................................. 14
2.5.4 Other Loans ........................................................................................................ 14
2.5.5 Some Non-debt products................................................................................... 14
2.6 SOUTH AFRICAN BANKING SECTOR ...................................................................... 16
2.7 MARKET INTEREST RATE ......................................................................................... 17
2.8 NET INTEREST INCOME (NII) AND NET INTEREST MARGIN (NIM) ................. 18
2.9 INTEREST RATE RISK ................................................................................................. 19
2.9.1 Repricing (Funding Gap) Model ........................................................................ 20
2.9.2 Maturity Model .................................................................................................. 20
2.9.3 Duration Model .................................................................................................. 20
2.9.4 Convexity ........................................................................................................... 20
2.10 EFFECT OF INTEREST RATE RISK ON BANKS’ PROFITABILITY ...................... 21
2.11 EFFECT OF INTEREST RATE RISK ON NET WORTH ............................................ 22
2.12 FACTORS THAT DETERMINE THE LEVEL OF INTEREST RATE ........................ 23
2.12.1 Demand and Supply of Loanable Funds ............................................................ 23
2.12.2 Inflation .............................................................................................................. 23
2.12.3 Monetary Policy ................................................................................................. 24

viii
2.12.4 Investors’ Expectation ....................................................................................... 26
2.12.5 Competition........................................................................................................ 26
2.12.6 Uncertainty ......................................................................................................... 26
2.13 HEDGING THE INTEREST RATE RISK ..................................................................... 27
2.14 FORECASTING THE INTEREST RATE ...................................................................... 28
2.15 CONCLUSION OF LITERATURE REVIEW ............................................................... 29
CHAPTER 3 ...................................................................................................... 30
RESEARCH METHODOLOGY .................................................................... 30
3.1 RESEARCH DESIGN ..................................................................................................... 30
3.2 POPULATION AND SAMPLE ...................................................................................... 32
3.2.1 Population .......................................................................................................... 32
3.2.2 Sample Size and Selection ................................................................................. 32
3.3 DATA COLLECTION .................................................................................................... 34
3.4 THE RESEARCH INSTRUMENT ................................................................................. 36
3.5 DATA ANALYSIS .......................................................................................................... 37
3.5.1 Hypothesis Testing............................................................................................. 37
3.5.2 Trend Analysis ................................................................................................... 38
3.5.3 Correlation Analysis .......................................................................................... 38
CHAPTER 4 ...................................................................................................... 39
PRESENTATION AND DISCUSSION OF RESULT .................................. 39
4.1 PRESENTATION OF RESULT...................................................................................... 39
4.1.1 Descriptive Analysis .......................................................................................... 40
4.1.2 Result of Hypothesis Testing ............................................................................. 48
4.1.3 Summary of the Result ....................................................................................... 49
4.1.4 Changes in Repo Rate with Macroeconomic Factors ........................................ 52
4.1.5 Banks’ Profit Variations with Repo Rate........................................................... 53
4.1.6 Banks’ Net Worth Variations with Repo Rate ................................................... 54

ix
4.1.7 Banks’ Profit Variations with the Dominant Determinants of Repo Rate ......... 56
4.1.8 Banks’ Net Worth Variations with the Dominant Determinants of Repo Rate. 58
4.2 DISCUSSION OF RESULT ............................................................................................ 60
4.2.1 Changes in Repo Rate with Macroeconomic Factors ........................................ 60
4.2.2 Repo Rate Variations with Banks’ Profit........................................................... 61
4.2.3 Repo Rate Variations with Banks’ Net Worth ................................................... 62
4.2.4 Banks’ Profit with the Dominant Determinants of Repo Rate .......................... 62
4.2.5 Banks’ Net Worth with the Dominant Determinants of Repo Rate ................... 64
4.2.6 Banks’ Profit and Net Worth with the Banks Specific Internal Factors ............ 64
CHAPTER 5 ...................................................................................................... 65
CONCLUSION AND RECOMMENDATIONS ............................................ 65
5.1 SUMMARY OF FINDINGS ........................................................................................... 65
5.2 CONCLUSION OF THE STUDY .................................................................................. 66
5.3 RECOMMENDATIONS FOR FURTHER RESEARCH ............................................... 67
REFERENCES .................................................................................................. 68
APPENDICES ................................................................................................... 72
APPENDIX A FINANCIAL DATA FROM BANKS’ ANNUAL REPORT ........................ 72
APPENDIX B FINANCIAL DATA FROM SOUTH AFRICAN RESERVE BANK .......... 77
APPENDIX C DEFENCE PANEL STATUS (APPROVAL OF TITLE) ............................. 78

x
LIST OF TABLES
Table 3.1 Sampled banks, specialization, total asset, percentage of total asset to the
banking industry’s total asset, and country ranks as at 2010……………...…33
Table 3.2 Bank names, identification numbers, and years of financial data extracted....35
Table 4.1 Correlations among the test variables...............................................................41
Table 4.2 Correlations between profit and other variables……...................................…42
Table 4.3 Correlations between net worth and other variables……………...………….42
Table 4.4 The mean profit for big and small banks by year…………....……………….43
Table 4.5 The mean logged net worth for big and small banks by year……….…..……44
Table 4.6 Summary results of hypothesis testing…………...…………………......…....50
Table 4.7 Summary results of hypothesis testing for 15 sampled banks………......……51
Table 4.8 Summary results of hypothesis testing for the big banks……….…....………52
Table 4.9 Summary results of hypothesis testing for small banks....................................53

xi
LIST OF FIGURES
Figure 4.1 Mean percentage profit of sampled banks........................................................45
Figure 4.2 The mean logged net worth of sampled banks.................................................46
Figure 4.3 Comparison of repo rate with mean profit of big and small banks..................47
Figure 4.4 Comparison of repo rate with net worth of big and small banks…………….48
Figure 4.5 Trend of Repo rate, CPI, Money supply and Uncertainty………….………..48
Figure 4.6 Comparison of prime rate, repo rate and deposit rate......................................49

Chapter one - Introduction
1
CHAPTER 1 INTRODUCTION
1.1 CONTEXT OF THE STUDY
The financial system is composed of a network of financial markets, institutions, businesses,
households, and governments. There are many functions of the financial system, with the
basic function of transferring loanable funds (credits) from lenders (savings surplus units) to
borrowers (savings deficit units) (Rose et al, 1995). Lenders being those whose current
income receipts exceed their current expenditure, giving them extra funds to lend to
borrowers. This financial transaction can be carried out directly between lenders and
borrowers or semi-directly, where a third party is involved. The shortcomings of direct and
semi-direct financing have opened doors for a third method—financial intermediation, which
is done by financial intermediaries.
Commercial bank is a classic example of financial intermediary at work; meeting the ultimate
needs of both borrowers and lenders. Early banks lent mainly to two classes of borrowers:
merchants and governments (Kohn, 2004). Lending to merchants usually took the form of
discounting commercial bills. It was a standard IOU used by merchants. Governments on the
other hand were always in need of credits. They borrow from early merchants in exchange of
trading rights.
The menu of banks’ assets has grown steadily over the years. The list of borrowers has
expanded from merchants and governments to include landowners, other banks, industrial
firms, and consumers. Banks have faced demand for credits from these new classes of
borrowers. Satisfying their demands has led to higher yields but typically increased risk and
reduced liquidity, especially mortgage lending, because of its long term maturity.
By almost any measure, the commercial bank is the most important financial intermediary
serving the public today. They offer more services than the majority of other financial
institutions, which include expanding the money supply by granting credits (loans) to
borrowers. They accept deposits from saving surplus units (lenders), and grant it as credits

Chapter one - Introduction
2
(loans) to saving deficit units (borrowers). Loans and deposits are the major components of
the bank’s balance sheet—Assets and Liabilities.
1.2 PROBLEM STATEMENT
To achieve the goal of owners’ wealth maximization, banks should manage their assets,
liabilities, and capital efficiently. In doing this, the bank should be conscious of the gap or
spread between the interest income earned on their assets and the interest expenses paid on
their liabilities, which is called net interest income (NII). Net interest income is a major part
of banks’ profit, this is basically why the financial intermediaries try to offer lowest returns to
savers and lend funds to borrowers at the highest possible interest rates. It is measured as net
interest margin (NIM), which is NII divided by the average earning asset. Lopez-Espinosa et
al (2011) revealed that the volatility in interest rate in the 2000s explains much of the net
interest margin (NIM) differences across countries, as well as NIM reduction in developed
countries.
As many other studies on interest rate have shown (Delis et al, 2011; Kasman et al, 2011;
Hanweck and Kilcollin, 1984), maturity mismatch of banks assets and liabilities (while
performing asset transformation function), and unexpected change in interest rate, potentially
expose the banks to interest rate risk. This exposure will result to refinancing or reinvestment
risk, depending on the direction and level of interest rate change (Saunders and Cornett,
2003).
The net interest income (NII) of the bank is highly exposed to this interest rate risk, as it is
based on the “GAP” between Rate Sensitive Assets (RSA) and Rate Sensitive Liabilities
(RSL). Basically, change in the net interest income is the function of change in interest rate
and the GAP. It is a major concern for banks that hold a large proportion of their portfolio in
long-term fixed-rate loans (Hanweck and Kilcollin, 1984).
Interest rate risk among other risks (credit, liquidity, insolvency, market etc.) is a major
concern for financial institutions. It can cause harm, if not failure, to a financial institution, by
interacting with other risks. For instance, as interest rate rises, credit risk increases
(corporations and consumers will likely default in repayment), which can lead to liquidity
risk (as banks may depend on loan repayment for liquidity management purposes), this leads
to solvency risk, thereby affecting the profit and equity or capital positions of financial
services firms.

Chapter one - Introduction
3
The commercial banks face market value risk in addition to refinancing and reinvestment risk
that occur when interest rates change, whereby the market value of the banks’ assets is
reduced due to rising interest rates. The interest rate shock that results in losses in the market
value of assets directly affect the net worth (owners’ equity) because debt holders are senior
claimants on a firm’s assets, while equity holders are junior claimants (Saunders and Cornett,
2003). Moreover, many factors determine the changes or movement of interest rates, which
include, demand and supply of loanable funds, Central Bank’s monetary policy
implementation, inflation, investors’ expectations, competition among financial institutions,
etc.
This study is aimed at assessing the effect of interest rate sensitivity on the profitability (the
net interest margin) and net worth of commercial banks in South Africa. It will as well assess
which of the determinants of interest rate has more effect on interest rate and thus on profits
and net worth of commercial banks. I believe that upon the completion of this study, policy
makers such as, the Reserve Bank and commercial bank managers will find it useful when
making macroeconomic and managerial decisions; while investors, non-financial firms, and
even consumers will find it useful as a guide towards opportunities as to when to invest or
save.
1.3 RESEARCH OBJECTIVES
The main objective of this study is to investigate the impact of market interest rates
fluctuations on both the profitability and net worth of commercial banks. The research carried
out on this study should contribute to a better understanding of market interest rates; the
determinants of market interest rate; and which of the determinants has more effect on
interest rate changes. It will as well make an empirical contribution to the discussion of
banks’ profitability, overall wealth performances, and eventual contributions to the economic
development.
If banks, non-bank businesses, and individuals should have improved understanding,
assessment, and evaluation of market interest rates, they would be better equipped to make
investment decisions that will be beneficial to them and to the economy in general. Such
understanding, assessment, and evaluation, will enable:

Chapter one - Introduction
4
• Individuals to decide either to save (make deposits) in banks, or to focus on other
types of non-depository investments.
• Non-bank businesses to decide on the ratio of debt to equity to employ in financing
their businesses.
• Banks to decide when to facilitate greater lending activity for profit maximization.
• May provide another “granular” avenue for hedging/managing/forecasting interest
rate risk.
The decision taken by the above three groups, based on the understanding, assessment, and
evaluation of interest rate, boils down to commercial banks’ profitability. Therefore,
hopefully this study will bring some important conclusions about the effect of interest rates
on banks’ profits, and how such effects affect their net worth.
1.4 RESEARCH QUESTIONS
• What is the impact of market interest rates fluctuations on commercial banks’ profit
and / net worth in South Africa?
• Which of the determinants of interest rate has a more impacting effect on interest rate
and profits/ net worth of commercial banks in South Africa?
• What interest rate risk management lesson derives from the preceding two
relationships, if any?
1.5 DEFINITION OF TERMS AND ABBREVIATIONS
For better understanding of this research, definitions of terms and abbreviations that are
extensively used in this study are provided as follows.
• GAP: The difference between rate sensitive assets and rate sensitive liabilities.
• Rate sensitive Assets: An asset that is repriced at or near current market interest rates.

Chapter one - Introduction
5
• Rate sensitive Liabilities: A liability that is repriced at or near current market interest
rates.
• NII: Net Interest Income
• NIM: Net Interest Margin
• Fixed-rate: The rate of interest set at the beginning of the contract period, which
remains in force over the contract period no matter what happens to market rates.
• Floating-rate: The rate of interest periodically adjusted to some underlying index, also
called Adjustable Rate of Mortgage (ARM).
• CPI: Consumer Price Index, measured as the percentage change in inflation rate.
• MPC: Monetary Policy Committee.
• CD: Certificate of Deposit.
1.6 LIMITATIONS
The aim of this study is to analyze the impact of market interest rate fluctuations on
commercial banks’ profitability and net worth in South Africa. Depending on availability of
data, fifteen banks are selected for the research. The result derived from the analysis of these
banks will be considered indicative of impact of market interest rate fluctuation on
profitability of commercial banks. It is important to note that:
• The measure of profitability captures the essence of lend-long borrow-short without
directly including other determinants of bank income, such as loan loss and loan
volume, which may be correlated with interest rates.
• The net interest margin (NIM) is not a measure of total banks’ profits since it does not
include non-interest income and expenses.

Chapter one - Introduction
6
• Other determinants of banks profit such as, ownership structure, taxation and
regulations, financial structure, legal and institutional indices were also not included.
• Reduction in net interest margin can be as a result of high loan default.
• The variation on net interest margin may reflect differences in the net interest income
(numerator) or differences in the average earning assets (denominator).
• There are many possible short term interest rates to be used for this study, but to avoid
multicollinearity only the repurchase (repo) rate is used to represent the market
interest rate. Multicollinearity is a statistical problem where the explanatory variables
are highly correlated with one another. If it occurs, the regression model has difficulty
telling which explanatory variable is influencing the dependent variable. (Wooldridge,
2006).
1.7 ASSUMPTIONS
• The financial data downloaded for this research is accurate and reliable.
• All banks prepare financial statements in accordance with International Financial
Reporting Standard (IFRS), and understand IFRS in the same way, thus the data is
comparable.
• Given that sampled fifteen banks account for more than ninety per cent (90%) of
South African banking industry’s assets, its representative of the national banking
industry.
• This study uses panel data and assumes that the effect of interest rate changes varies
across the observations and over time.

Chapter one - Introduction
7
1.8 OUTLINE OF THE STUDY
The remainder of this study is structured as follows: Section two contains the literature
review of my study, detailing the roles and functions of commercial banks, factors that affect
their profitability, with special attention on market interest rate. It also details the factors that
determine and cause changes in interest rates, how interest rates can be forecasted and
hedged.
Section three presents the methodology used in this study. The data is analyzed using
regression analysis. It also contains the time series analysis where the relationship between
market interest rate and banks’ profits over time are identified. Section four addresses the
questions proposed for the study, and how the interpreted results address and answer the
proposed questions. Finally, section five draws conclusions about the study in relation with
the research questions.

Chapter two – Literature Review
8
CHAPTER 2 LITERATURE REVIEW
2.1 INTRODUCTION
Financial institutions have become essential to modern living. Credit cards, checking
accounts, life, auto, and home insurance policies are all basic services supplied by the current
multitude of world-wide financial institutions.
A financial institution is a business firm whose principal assets are financial assets or claims,
such as stocks, bonds, and loans; instead of real assets, such as buildings, equipment, and raw
materials (Rose et al, 1995). Financial institutions make loans to customers or purchase
investment securities in the financial marketplace. They also offer a wide variety of other
financial services, ranging from insurance protection and sale of retirement plans, to
safekeeping of valuable and provision of mechanisms for making payments, transferring
funds, and storing financial information. Financial institutions are divided into two groups;
financial intermediaries and other financial institutions.
Financial intermediaries acquire the IOUs issued by borrowers (primary securities), and at the
same time sell their own IOUs (secondary securities) to savers. Financial intermediaries are
further divided into two; depository and non-depository institutions. Depository institutions
are financial intermediaries whose significant proportion of their funds comes from customer
deposits (Saunders and Cornett, 2003). They include; commercial banks, savings associations
and banks, and credit unions. For the purpose of this study, our focus is in commercial banks
and how interest rate risk affects their profitability and net worth.
2.2 COMMERCIAL BANKS
Commercial banks comprise the largest group of depository institutions in size. They perform
functions similar to those of savings institutions and credit unions, that is, they accept
deposits (liabilities) and make loans (Saunders and Cornett, 2003). But they differ in their
composition of assets and liabilities. Commercial banks liabilities usually include non-deposit

Chapter two – Literature Review
9
sources of funds, while their loans are broader in range, including consumer, commercial, and
real estate loans.
Commercial banks are among the most regulated firms in the economy. They can be
chartered either by the state (state-chartered banks) or by the federal government (national
banks). All the national banks must be members of Federal Reserve System and must be
insured by the Bank Insurance Fund (BIF), which is administered by the Federal Deposit
Insurance Corporation (FDIC) (Fabozzi and Modigliani, 2003). Because of the inherent
special nature of banking and banking contracts, regulators have imposed numerous
restrictions on their product and geographic activities (Saunders and Cornett, 2003).
Within the banking industry, banks’ activities, the structure and composition of assets and
liabilities vary significantly across banks of different sizes. The smaller or community banks
tend to specialize in retail or consumer banking, such as providing residential mortgages and
consumer loans and accessing the local deposit base. Recently this group of banks is
decreasing in both number and importance. The next are the regional and super-regional
banks. They engage in more complete array of commercial banking activities, such as
consumer and residential lending as well as commercial and industrial lending, both
regionally and nationally. The majority of banks fall into this group. The third group is the
interbank or federal funds market. The banks in this group engage in interbank market for
short-term borrowing and lending of bank reserves. Some of the very biggest banks belong to
the fourth group called money center banks. They rely heavily on non-deposit or borrowed
sources of funds.
2.3 COMMERCIAL BANKS’ SERVICES
Commercial banks now offer more services than the majority of other financial institutions,
such services ranging from regular checking accounts, through consumer and mortgage
lending, to underwriting of new securities issues by corporations and governments (Rose et
al, 1995). The services can be broadly classified into three; individual banking, institutional
banking, and global banking (Fabozzi and Modigliani, 2003). Different banks generate more
activities in certain areas than others. For example, money center banks are more active in
global banking.

Chapter two – Literature Review
10
2.3.1 Individual Banking
This encompasses consumer lending, residential mortgage lending, consumer installment
loans, credit card financing, automobile financing, brokerage services, student loans, and
individual-oriented financial investment services such as personal trust. Mortgage lending
and credit card financing generate both interest and fee income, while brokerage and financial
investment services generate fee income. Bank loans are one of the most important sources of
credit in the economy, providing financial resources so that consumers, businesses, and
governments can acquire goods and services even when their income and savings are
inadequate (Rose et al, 1995).
2.3.2 Institutional Banking
This category is made up of loans to nonfinancial corporations, financial corporations (such
as life insurance companies), and government entities (states, local, and foreign
governments). Also included are commercial real estate financing, leasing activities, and
factoring1. Loans and leasing generate interest income; while other services banks offer
institutional customers generate fee income (Fabozzi and Modigliani, 2003).These services
include assets management services, custodial services, and cash management services such
as account maintenance, check clearing, and electronic transfers.
2.3.3 Global Banking
In this category, banks compete head-to head with another type of financial institution—
investment banking firms. Global banking activities involve corporate financing, capital
market and foreign exchange products and services. Corporate financing involves procuring
funds for customer beyond traditional bank loan but through underwriting of securities
(though there is a limit in this area). It also involves advice to corporate customers in such
areas of strategies for obtaining funds, corporate restructuring, diversifications, and
acquisitions. Most global banking activities generate fee income rather than interest income.
Capital market and foreign exchange products and services involve transactions where the
1 Banks purchase of account receivables.

Chapter two – Literature Review
11
banks may act as brokers or dealers in a service. These services generate both interest and fee
income for the banks.
Moreover, the financial products developed by banks to manage risk also yield income. The
products include interest rate swap, interest rate agreements, interest rate options, currency
swaps, and forward contracts. Banks generate either commission income or spread income
from selling such products (Fabozzi and Modigliani, 2003).
Finally, the most important service by the commercial banks is expanding the money supply
(transmission of monetary policy), through the making of loans and investments. They attract
funds (deposits) from savings-surplus units by issuing attractive financial assets (secondary
securities) and lend these funds to borrowers or savings-deficit units, accepting IOUs
(primary securities) in return (Rose et al, 1995). Because the liabilities (deposits) of
depository institutions are significant component of the money supply (M1, M2, and M3)2
that impacts the rate of inflation, they play a key role in the transformation of monetary
policy from central bank to the rest of the economy (Saunders and Cornett, 2003). That is,
commercial banks are one of the conduits through which monetary policy actions3 impact the
rest of the financial sector and the economy in general.
2.4 COMMERCIAL BANKS’ FUNDING
Commercial banks are highly leveraged organizations, relying mainly on debt (principal
deposits) to support their assets. There are three main sources of funds for commercial banks;
(1) deposits, (2) non-deposit borrowing, and (3) equity capital or net worth (stocks and
retained earnings (Fabozzi and Modigliani, 2003).
2 M1: currency under circulation, plus demand deposits at all commercial banks (less cash items in the process of collection, plus other checkable deposits. M2: M1, plus savings accounts and small time deposits (CDs, T. Bills less than $100,000), plus other non-deposit obligations of depository institutions. M3: M2, plus large time deposits (Negotiable CDs 3 Monetary policy actions include open market operations (the purchase and sale of securities in the securities market), setting the discount rate (the rate charged on “lender of last resort” borrowing from the Federal Reserve), and setting reserve requirements (the minimum amount of reserve assets depository institutions must hold to back deposits held as liabilities on their balance sheet).

Chapter two – Literature Review
12
2.4.1 Deposits
Historically, most of the funds raised by banks come from deposits. Several types of deposit
accounts are available in commercial banks, which include demand deposits and other
transaction accounts (time deposits, and savings deposits).
Demand deposits is payable on demand to the deposit holder or to someone designated by the
holder on presentation of a signed draft to the bank. The best-known demand deposit is the
regular checking account, which does not bear interest but permits the customer to write any
number of checks desired (subject to some type of service charge) (Rose et al, 1995).
However, there are other transaction accounts similar to regular checking accounts but pay
interest; examples are the Negotiable Order of Withdrawal (NOW), which carries a fixed rate
of interest and is accessible by writing a check and the Money Market Deposit Account
(MMDAs), which permit limited check writing but generally pay a higher and more flexible
rate of interest than NOWs. Its interest payment is based on short-term interest rates.
Time deposits also called certificates of deposit set a fixed maturity date and pay either a
fixed or floating interest rate. Some certificates of deposits can be sold in the open market
prior to their maturity while others cannot be sold. If a depositor elects to withdraw the funds
prior to maturity, the bank imposes early withdrawal penalty (Fabozzi and Modigliani, 2003).
Savings deposits pay interest (typically below market interest rate), but do not have specific
maturity and usually can be withdrawn on demand. The savings and time deposits are usually
referred to as nontransactions deposits.
The composition of bank’s deposit is of considerable importance to its growth and earnings.
The greater the proportion of demand deposits relative to time and savings deposits at an
individual bank, the larger that bank’s liquidity needs tend to be and the more concern it is
about cash withdrawals and unexpected demand for loans. While the greater proportion of
time deposits to demand and savings deposits exposes the bank to highest interest rates
payments, which has the effect of driving up bank costs and placing a downward pressure on
bank’s earning (Rose et al, 1995). Therefore commercial banks should be conscious of a
trade-off between liquidity needs and high interest expenses.

Chapter two – Literature Review
13
2.4.2 Non-deposit Borrowings
Usually banks supplement deposits with non-deposit borrowings to actively manage their
assets. Such non-deposits sources of funds include short-term borrowings of reserves in the
federal funds, borrowing through the use of security repurchase agreements, or through credit
obtained from discount windows of the Federal Reserve banks. Banks also use long-term
borrowing of funds, including mortgages and subordinated notes, and debentures. In recent
years, supplements of banks deposits and other borrowings have been sales of bank loans and
securitization4 of assets.
2.4.3 Equity Capital or Net Worth
Like any corporation, banks also draw upon their owners (the stockholders) for funds. Equity
capital is relatively small proportion of total assets in the commercial banks’ balance sheet, as
banks are highly leveraged, relying mainly on debt. Owner’s equity capital provides less than
10 percent of all the funds needed to run the modern bank, while more than 90 percent of
bank’s assets are supported by borrowings. The principal components of equity capital are
retained earnings, capital reserves, par value of common and preferred stock, and surplus5
(Rose et al, 1995).
2.5 COMMERCIAL BANKS’ PRODUCTS
Loans represent three-fifth of the assets of all US insured banks (Rose et al, 1995). Banks
make a bewildering array of loans for thousands of different purposes. There are three main
categories of loans made by commercial banks.
2.5.1 Real Estate Loans
These are the largest component of loans made by commercial banks. They represent
extension of credit to buy or build on real property (land), and loans to support the
construction or purchase of homes, factories, apartments, shopping centers, warehouses etc.
4 Securitization is the packaging and selling of loans and other assets backed by securities. 5 The excess value of any stock issued above the stock’s par value.

Chapter two – Literature Review
14
Real estate loans are very long-term loans with an average maturity of approximately 28
years (Rose et al, 1995).
2.5.2 Commercial and Industrial (C&I) Loans
These are commonly referred to as business loans, that help fund purchase of equipment, new
venture start-up costs, and inventories for privately owns firms. C&I loans can be made for
periods as short as a few weeks to as long as eight years or more.
2.5.3 Individual (consumer) Loans
These represent personal and auto loans made by banks to individual consumers. It can be
inform of revolving loans such as credit card debt or inform of non-revolving loans such as
new and used automobile loans, mobile home loans, and fixed term consumer loans (24
months personal loans) (Saunders and Cornett, 2003).
Both real estate and commercial and industrial loans can be made at either fixed rates of
interest or floating rate. A fixed-rate loan has the rate of interest set at the beginning of the
contract period. The rate remains in force over the loan contract period no matter what
happens to market rates. A floating rate loan (also called Adjustable Rate Mortgage) has the
rate of interest periodically adjusted to some underlying index. In low interest period,
borrowers prefer fixed-rate to floating rate.
2.5.4 Other Loans
These represent loans to farmers, other banks, nonbank financial institutions, brokers and
dealers, state and local governments, foreign banks, and sovereign governments.
2.5.5 Some Non-debt products
Apart from loans, banks engage in some non-debt products and services, which can be on or
off the balance sheet of the banks. Off balance sheet activities are becoming increasingly
important, in terms of the amount involved and income they generate for banks, especially as

Chapter two – Literature Review
15
the ability of the banks to attract high quality loan applicants and depositors becomes ever
more difficult. An item or activity is off balance sheet if, when a contingent event occurs,
such item or activity moves onto the asset or liability side of the balance sheet (Saunders and
Cornett, 2003). Some of the non-debt products and services are as follows.
Securitization: This is the process of packaging and selling loans and other assets backed by
securities. Along with derivatives instruments (futures, forwards, swaps, and options),
financial institutions use securitization to hedge interest rate risk. It also makes financial
institutions’ assets more liquid, by increasing the availability of fund to the mortgage market
and reducing interest cost of borrower. In effect the efficiency of the borrowing and lending
process has been improved (Livingston, 1993). Securitization is also an important source of
fee income, with financial institutions acting as servicing agents for the assets sold. It also
helps reduce the effect of regulatory taxes, such as capital requirements, reserve
requirements, and deposit insurance premiums (Saunders and Cornett, 2003).
Derivatives: Financial products developed by banks such as futures, forwards, swaps, and
options can be used either for hedging interest rate risk and other purposes or become dealers
of those products and act as counterparties in trades with customers. Banks generate both fees
income and commission income from these products.
Letters of credit: They are contingent guarantees sold by financial institutions to underwrite
the trade or commercial performance of the buyer of the guarantee (such as corporation)
(Saunders and Cornett, 2003). They are widely used in both domestic and international trade.
Banks engage in selling both Commercial and standby letters of credits. Standby letters of
credit cover mostly contingencies that are potentially severe, less predictable, or frequent, and
not necessarily trade related.
Loan commitments: This is a contractual commitment made by a bank to make a loan up to a
stated amount at a given interest rate in future. Apart from the interest income generated from
this contract, the bank also charges up-front fee for making fund available throughout the
agreed period, and back-end fee for any unused component of a loan commitment (Saunders
and Cornett, 2003).
Investment in interest earning assets: (treasury bills, treasury bonds, sovereign bonds).
Commercial banks hold treasury securities as secondary reserves that can readily be turned
into cash as the need arises (Livingston, 1993). The Government uses this avenue for

Chapter two – Literature Review
16
monetary policy implementation, through the open market operation, thereby the banks
serving as Government agents.
Credit allocation: Banks are major and sometimes the only source of finance for particular
sectors of the economy pre identified as being in special need of finance. Government has
identified residential real estate and farming sectors as the sectors in need of special
subsidies, as they are especially important sectors of the economy in terms of the overall
social welfare of the population. The government has directly encouraged financial
institutions to specialize in financing these areas through the creation of mortgage banks,
agricultural banks etc.
Intergenerational Wealth transfer: Commercial banks help savers to transfer wealth
between youth and old age across generations. This they do by engaging in trust funds and
life insurance policies,
Trust services: The trust departments of commercial banks hold and manage assets for
individuals or corporations. These trusts include estate assets and assets delegated to bank
trust departments by less sophisticated investors. Pension funds are also being managed by
trust departments. The banks manage the pension funds; act as trustees for any bond held by
the pension funds, and act as transfer and disbursement agents for the pension funds.
Correspondent banking: This is the provision of banking services to other banks that do not
have the staff resources to perform the services themselves. Such services include check
clearing and collection, foreign exchange trading, hedging services, and participation in large
loan and security issuance (Saunders and Cornett, 2003). Payment for the services is
generally in the form of non-interest bearing deposits held at the bank offering the
corresponding services.
2.6 SOUTH AFRICAN BANKING SECTOR
Falkena et al (2004) asserts that the South African banking industry is oligopoly in nature,
being dominated by four large commercial banks controlling the majority of the market
shares. According to country ratings as at the year 2010, the four banks are Standard Bank,
ABSA, NEDBank, and FirstRand Bank.

Chapter two – Literature Review
17
Many studies on South African banks, Hawkins (2002), Basson and Ojah (2007) assert that
South African banking industry is not realizing the objective that banks should when acting
as efficient financial intermediary. Demand for loanable funds for small businesses are often
pushed into fringe and are left with no avenue for funding besides other micro lending
institutions, which charge exorbitant rates for funds. Basson and Ojah (2007) pointed that
despite the fact that all banks in South Africa are privately owned, the ownership of banking
institutions remains highly concentrated. The top South African banks have significant
common shareholders as well as material interest in each other’s’ banking operations. Note
too that the four listed are the only ones with widely spread accessible branch network.
According to South African Reserve Bank (2010), as at the end of 2009, the market share of
the top four banks was 84.58%, and no significant changes were recorded during the past few
years. As at the end of Dec 2010, average net interest margin for the top four banks was
2.78%, average return on assets was 0.895, and return on equity was 15.07 compared to that
of 2009 of 2.96%, 0.94, and 15.84 respectively.
2.7 MARKET INTEREST RATE
Interest rates measure the price paid by a borrower or debtor to a lender or creditor for the use
of resources during some time intervals (Fabozzi and Modigliani, 2003). Goedhuys (1982),
defined interest rate as the general level in financial assets and claims of all types whether
call loans or debentures, company shares or government bonds, bank overdraft or bill of
exchange. There are nominal and real interest rates. Nominal interest rate is the rate not
corrected for inflation. Nominal interest rate on loan relates the amount of interest on the loan
to the amount of money lent, while real interest rate is that which incorporates the effect of
inflation. It is measured in terms of purchasing power. The two rates are connected by a
simple relation called Fisher Effect, which says that real interest rate is measured as nominal
interest rate minus expected inflation rate, because an expectation about future inflations
definitely affects market interest rate (Kaufman, 1986).
The market interest rate is the interest rate offered most commonly on deposits in banks,
other interest bearing accounts, as well as loan, it is determined by the supply and demand for
credit (Farlex, 2009). Market interest rate largely depends on the supply and demand for
credit, competition in the loanable market, and other economic factors, such as inflation rate,

Chapter two – Literature Review
18
expectation of investors, monetary policy of the government etc. The question of practical
importance is whether the rate may be expected to move above or below today’s level, how
far it may go, and how long the movement may take. There are many different market interest
rates in a given currency.
Treasury rate: The rate an investor earns on the instruments (Treasury bills and Treasury
bonds) used by the Government to borrow from its own currency.
Interbank borrowing and lending rate (SABOR for South Africa, LIBOR for London): The
rate at which banks lend and borrow from each other.
Mortgage rate: The rate charge on mortgages, it can be fixed or floating rate.
Deposit rate: The rate at which depositors are compensated for saving money with the bank.
It is also called funding rate.
Prime rate: The rate at which banks lend to their customers. It is also called the lending rate.
Federal fund rate: The rate on reserves traded among commercial banks for overnight use.
Repo rate: This is the discount rate at which central bank repurchase government securities
from the commercial banks. The central bank uses it to maintain the level of money supply it
wants in the country’s monetary system. It is a benchmark for variable deposits and lending
rates in South Africa. The deposit and lending rates fluctuate along with changes in the
repurchase rate; lending rate at a margin above, and the deposit rate at a margin below the
repurchase rate, depending on maturity, risk, liquidity, and prevailing economic conditions
(SARB monetary policy review 2009).
2.8 NET INTEREST INCOME (NII) AND NET INTEREST MARGIN (NIM)
Net Interest Income (NII) is the different (GAP) between the interest received from loans and
investments and the interest paid on deposits and other liabilities, as Allen (1988) assumed in
his theoretical model that there is interdependence between loans and deposits in banks. In
other words, net interest income (NII) is the different between interest income and interest
expense. While, the net interest margin (NIM) is the net interest income measured as a
percentage of earning assets. Total net interest income is obviously not comparable between

Chapter two – Literature Review
19
institutions of substantially different sizes, but the net interest margin (expressed as a
percentage) may be meaningfully compared among institutions. Angbazo (1997) stipulated
that factors such as credit risk and interest rate risk, as well as the interaction between these
two types of risks are among the variables that affect net interest margin.
The management of financial institutions manages assets and liabilities so as to control the
size of the net interest margin. This control may be defensive or aggressive. The defensive
asset/liability management prevents the interest rate changes from decreasing or increasing
the net interest margin. In contrast, aggressive asset/liability management focuses on
increasing the net interest margin by altering the portfolio of the institution. The success and
failure of both strategies depends on the movement of interest rates (Rose et al, 1995).
In some countries where banks are the main sources of funds, the level of net interest margin
is one of the important policy variables to measure how efficient is the bank in performing its
function as an intermediary institution, to collect deposits and distribute loanable funds
(Sidabalok and , Viverita, 2011).
2.9 INTEREST RATE RISK
Management of financial institutions faces different types of risk when managing loan
portfolios or individual securities. The risk encompasses credit or default risk, liquidity risk,
repayment risk, and interest rate risk (Rose et al, 1995).The major concern throughout the
financial system is the interest rate risk.
Interest rate risk refers to the effect of interest rate volatility on rate earning assets and rate
paying liabilities. For a given change (1%), interest rate risk also includes the effect of shift in
volume and composition of assets and liabilities (Saha et al, 2009). As many other studies on
interest rate have shown (Delis et al, 2011; Kasman et al, 2011; Hanweck and Kilcollin,
1984), maturity mismatch of banks assets and liabilities (while performing asset
transformation function), and unexpected change in interest rate, potentially expose the banks
to interest rate risk. This exposure will result to refinancing or reinvestment risk, depending
on the direction and level of interest rate change (Saunders and Cornett, 2003).
In periods of high interest rates, institutions having heavy commitments to long term
securities face a large risk of depreciation in the value of their portfolios (Hanweck and

Chapter two – Literature Review
20
Kilcollin, 1984). Therefore the cost of rolling over or borrowing funds could be more than the
return earned on such investment (refinancing risk). On the other hand, if institutions rely
heavily on short term assets than liabilities, in the event of low interest rate, excess borrowed
fund will be reinvested at low interest rate (reinvestment risk) (Saunders and Cornett, 2003).
Since banks have been increasing their securities holding relative to loan in recent years,
interest rate risk has been increasing in the banking industry. It reduces the liquidity of the
banks and increases the risk of insolvency (Rose et al, 1995). Interest rate risk is a more
serious threat to intermediaries than default risk (Kohn, 2004). There are different ways
(models) a financial institution can measure the exposure it faces in running a mismatched
maturity book (gap between rate sensitive asset and rate sensitive liability). They include
repricing model, maturity model, duration model, convexity, the term structure of interest
rate.
2.9.1 Repricing (Funding Gap) Model
This approach analyses the gap (repricing gap) between the interest revenue earned on assets
and interest expense paid on liabilities. It calculates the rate sensitivity of each asset and each
liability. Rate sensitivity means that the assets or liability is repriced at or near current market
interest rate within a certain time horizon (Saunders and Cornett, 2003).
2.9.2 Maturity Model
This model analyses the gap just like repricing model, but uses market value accounting
instead of book value as done in repricing model. The market value accounting reflects
economic reality or the true values of assets and liabilities.
2.9.3 Duration Model
Like the maturity model, this approach considers the market value of the assets and liabilities,
but it takes into account the time of payment of all cash flows as well as the asset’s or
liability’s maturity. The duration model through duration gap (the measure of overall interest
rate exposure for a financial institution), also measures the change in the net worth due to the
changes in interest rate (Saunders and Cornett, 2003).
2.9.4 Convexity
While the duration model measures the effect of changes in interest rates, convexity gives
more accurate result for a larger change in the interest rate (Hull, 2003).

Chapter two – Literature Review
21
2.10 EFFECT OF INTEREST RATE RISK ON BANKS’ PROFITABILITY
Interest rate movement is a major concern to all financial institutions and markets. It affects
decision making, performance, and growth of any particular financial institution, (Madura,
1989). Changes in interest rate and interest rates expectations affect the income and
expenditure of financial institutions. Under normal circumstances, the intermediary’s average
yield on asset (loan) will exceed the rate it pays to savers in order to attract funds. In fact, a
positive net interest margin must exist over a long term for a financial institution to remain in
the business of borrowing and lending money. But the maintenance of a positive net interest
margin over time has been a special problem for a number of financial institutions in the
recent years, due to volatile interest rates as well as other factors like restrictive regulations,
reckless management etc.
According to Hanweck and Kilcollin, (1984), four factors determine the effect of a change in
the general level of interest rate on banks’ net interest margin (NIM). First, there is
proportion of assets and liabilities. The higher the liability proportion relative to assets, the
lower the NIM will be if interest rate increases. Second, there is a response of new asset and
liability rates to changing general level of interest rate. Interest rate spreads between assets
and liabilities may widen or narrow as interest rate rise, thereby increasing or decreasing
NIM. Third, asset and liability portfolios may shift with changes in interest rate. For example,
deposits and loans made at low interest rates may be renegotiated at current rate. Fourth, the
size of a bank’s portfolio may change with changing interest rates, and so may affect NIM.
The total effect of interest rate changes on profitability (Net Interest Income) can be
summarized by its “gap”. GAP is the difference between the interest rate-sensitive assets
(loans) and interest rate sensitive liabilities (deposits) (Rose et al, 1995). Under aggressive
management strategy, if interest rates are expected to rise, financial institutions with positive
gap will experience rise in interest margin. Net income will increase because revenue from
interest rate-sensitive assets will increase more than their cost. Financial institution with
negative gap has to adjust its portfolio if it expects interest rate to rise, example, shortening
the maturity of its assets, by selling long term securities and purchasing short term securities.
Expectations of falling interest rate will produce the opposite adjustment of portfolio.

Chapter two – Literature Review
22
Management will want to shift to negative gap position to benefit from falling interest rate
(Rose et al, 1995).
Falling interest rate may be accompanied by recession which can cause slower growth in
loans and increase in loan losses. For all banks, profitability tends to be reduced (Hanweck
and Kilcollin, 1984).
2.11 EFFECT OF INTEREST RATE RISK ON NET WORTH
The commercial banks face market value risk in addition to refinancing and reinvestment risk
that occur when interest rates change, whereby the market value of the banks’ assets is
reduced due to rising interest rates. The interest rate shock that results in losses in the market
value of assets directly affect the net worth (owners’ equity), because debt holders are senior
claimants on a firm’s assets, while equity holders are junior claimants (Saunders and Cornett,
2003). Molyneux and Thorton (1992) examined the determinants of banks profitability in
several countries; the result indicated a positive association between return on equity and the
level of interest rates.
When interest rates rise, the market value of both assets and liabilities fall. If the maturity of
the assets is longer than the maturity of the liabilities, for any given change in interest rate,
the market value of assets (A) falls more than the market value of liabilities (L). This
definitely affects the net worth [equity (E)], as the balance sheet identity is E = A – L
(Saunders and Cornett, 2003). Saha et al, (2009) confirmed this, that danger lurks in the
banking books because interest rate hike reduces the present value of asset much more than
that of liabilities, thereby depleting a bank’s net worth. This takes us to Pillar 2 of Basel II,
which states that interest rate risk in the banking book should also attract capital charges, if
the loses in the Economic Value of Equity (EVE) is severe enough. EVE equals present value
of assets minus present value of liabilities.

Chapter two – Literature Review
23
2.12 FACTORS THAT DETERMINE THE LEVEL OF INTEREST RATE
Changes in interest rate are determined by many factors which include the supply and
demand for credit, competition in the loanable market, and other economic factors, such as
inflation rate, expectation of investors, monetary policy of the government etc.
2.12.1 Demand and Supply of Loanable Funds
In a free-market, system like the economy of the United states , interest rate is determined in
the market place by the interaction of borrowers and lenders (demand and supply of funds)
(Shetty et al, 1995). Such interaction results in an equilibrium interest rate, when preference
of borrowers and lenders are successfully matched. An equilibrium interest rate is acceptable
to both parties to the transaction, and it is the rate at which the loan transaction is completed
(Rose et al 1995).
The supply of funds depends on the preference of society for current versus future
consumption, the lower the preference for current consumption, the stronger the incentive to
accumulate funds. The demand for fund depends on the opportunities available for using
borrowed funds efficiently and profitably, the more profitable the usage of funds the greater
the demand for funds. If demand for funds increases/or the supply of funds declines, the price
of funds (interest rate) will rise vise verse.
2.12.2 Inflation
Inflation affects interest rate because it affects the value of money promised in future, (Kohn,
2004). The rate of interest quoted in the financial market is sometimes contrasted with the
real rate of interest, which is the observed market rate, corrected for price changes (inflation),
(Goedhuys, 1982). According to Fisher effect, expectations of high inflation causes savers to
require higher nominal (market) interest rate, as it is the only way they can maintain the
existing real rate of interest. Real interest rate is measured as nominal interest rate minus
expected inflation rate, because an expectation about future inflations definitely affects
market interest rate (Kaufman, 1986).

Chapter two – Literature Review
24
Many studies have provided research on the relationship between expected inflation and
interest rate; Booth and Ciner, (2001), and Laatsch and Klein (2003) stipulated that there is
one-for one relationship between expected inflation and nominal interest rate in the long run.
Laatsch and Klein (2003) went further to clarify that nominal interest rate adjust one-for-one
with the change in expected inflation supporting Fisher’s hypothesis, but changes in nominal
interest rate does not lead or lag changes in expected inflation.
Lenders may certainly anticipate inflation just as borrowers may do, expectations of inflation
then should tend to drive up interest rate as;
a. Borrowers seek to obtain funds to purchase goods before their prices rise.
b. Lenders seek to protect the purchasing power of their funds.
c. Federal Reserve tightens credit in an effort to retard inflationary pressure.
If banks’ management were able to fully anticipate inflation rate, it implies that banks can
appropriately adjust interest rates in order to increase their revenues faster than their costs,
and thus acquire higher profits. On the contrary, unanticipated inflation can lead to improper
adjustment of interest rate, and hence to the possibility that costs will increase faster than
revenues. (Anthanasoghou et al, 2006).
2.12.3 Monetary Policy
One of the purposes of the Federal Reserve of the Central Bank of every country is to control
the supply of money and credit in the country through the monetary policy. The implication
of monetary policy is when money supply is targeted, the resultant interest rate has to be
accepted, or vice versa. The increase in money supply by the Central Bank leads to decrease
in interest rate, this decrease in interest rate thereby increases demand for money (Blanchard,
2007). On the other hand, if monetary policy is used to fight inflation, the Federal Reserve
sells securities (open market operations), raise reserve requirement of banks, and raises the
discount rate. These actions reduce the supply of money, reduce banks’ excess reserve, and
increase the cost of credit (interest rates) (Mayo, 1989). Also if the central bank wants to
restrict banks’ lending to the private sector because of one reason or the other, it increases the
bank rate [discount rate (what it charges to banks)], this induces an increase in the rate of
interest charge on bank loans (Page, 1993).

Chapter two – Literature Review
25
In pursuing the objective of protecting the value of Rand, the South African Reserve Bank
(SARB) conducts monetary policy under the inflation targeting framework. This framework
is characterized by an announcement of numerical target point or range for inflation rate that
is intended to be achieved over a period of time. When setting monetary policy the reserve
bank decides on the level of short-term interest rate necessary to meet inflation target. The
Monetary Policy Committee (MPC) decisions influence the overall lending policies of the
banks and also the demand for money and credit in the economy (South African Reserve
bank, July 2007).
The MPC of South Africa adopted an easier monetary policy stance in 2010, thereby
supporting the recovery in the domestic economic activity. The repurchase rate was
subsequently reduced three times during the year by a cumulative one-and half percentage (1
½ %) point to 5.5 % in November 2010. On 20 January 2011, the MPC decided to keep the
repurchase unchanged, against the backdrop of the improving growth outlook (South African
Reserve bank, March 2011).
The South African Reserve Bank plays an important role in determining the level of short-
term interest rates as these rates are closely related to the rate (Repo Rate) at which the
central bank lends money to the private sector banks. The Reserve Bank’s repo rate
influences the interest rates charged by banks, the general level of interest rates in the
economy and, consequently, the economic aggregates such as money supply, bank credit
extension and, ultimately, the rate of inflation. The MPC implementation frame work of the
reserve bank can be simplified as follows:
Money-market interest rates are determined by a combination of market forces and the repo
rate. But it is important to note that market interest rates may not always change by exactly
the same margin as a change in the repo rate, depending on factors such as the extent to
Cash reserve requirement Other open market operations
Liquidity requirement (shortage) in money market
The reserve bank provided liquidity at the repo rate
Banks adjust the interest rates according to changes in repo rate

Chapter two – Literature Review
26
which change in repo rate has been anticipated and priced in (South African Reserve bank,
March 2011). For this reason, uncertainty is one of the determinants of interest rate
movements.
2.12.4 Investors’ Expectation
The expectation theory argues that interest rates are functions of investors’ expectations
(Rose et al, 1995). If the investors’ expectation is that the money supply will be increased by
the Federal Reserve over the next period, the level of interest rate will increase. This is
because the increase in money supply has not actually been implemented, while investors
already reacted towards it.
2.12.5 Competition
Competition in the loanable market also affects the interest rate. Lowering the cost of deposit
and raising the interest on loan by commercial banks will increase profit. But the ability to do
so depend on how much competition faced in the industry. Even if there are few commercial
banks to compete with, the non-bank substitute may be a problem, this leads to
disintermediation. (Rose et al, 1995)
2.12.6 Uncertainty
Uncertainty about the future also plays a predominant part in the process of interest rate
determination. Among more predominant types of uncertainty include
a. The term period over which funds are made available. The longer the term of the loan,
the greater the uncertainty that circumstances may change, therefore the higher
compensation demanded by the lenders of funds. Thus the longer the term of the loan
the higher the interest rate charged.
b. The lender of funds will also be concerned about the ability of the borrower of funds
to repay the loan. The higher the risk of default by the user or lower his/her credit
rating, the higher the interest rate charged by the supplier of finds.

Chapter two – Literature Review
27
c. During the period of low economic growth (measured by the GDP), banks narrow the
spread between the deposit rate and repo rate, probably an attempt to attract deposits.
This occurred between 2006 and 2008 when there was decelerating real economic
growth (SARB monetary policy review 2009).
2.13 HEDGING THE INTEREST RATE RISK
The effective management of risks determines the success or failure of a modern financial
institution (Saunders and Cornett, 2003). Interest rate risk is more difficult to manage
compared to other risks facing the financial institutions. One complication is that there are
many different interest rates in a given currency. Another complication is that to describe
interest rate, more than a single number is needed. A function describing the variation of the
rate with maturity in needed. This is called term structure of interest rate or yield curve (Hull,
2003)
Interest rate risk used to be an inhibiting and constraining element in the financing process.
Rising interest rates would increase the cost of financial intermediaries, since they would pay
more to acquire fund, but their fixed-rate fixed assets would be yielding old interest rate
agreed upon. Consequently, rising interest rates no longer impede the institutional lender
from increasing asset size and potential profit opportunities. This is due to the introduction of
“variable interest rate financing” (Kaufman, 1986).Variable rate which is called Adjustable
Rate Mortgage (ARM) or floating rate reduces the interest rate risk of the lender. When
interest rates go up, and deposits from savers are to be paid for, the interest rate to be charged
on outstanding loan can also be raised. By doing this, the net interest income remains roughly
the same. Of cause, the interest rate risk had not disappeared, but has been shifted from
lender to borrower (Kohn, 2004). The following interest rate derivatives can also be used to
hedge interest rate risk.
Interest Rate Futures
This can be used to hedge against adverse interest rate movements by locking in either a price
or an interest rate. When an interest rate futures contract is purchased, the investor is locking
in a set interest rate regardless of which direction interest rates will move in the future. A

Chapter two – Literature Review
28
thrift or commercial bank can hedge its cost of funds by locking in a rate using CD futures
contract.
Interest Rate Options
Interest rate options can be written on cash instruments or futures. It can be used to hedge
against adverse interest rate movement by setting a floor or ceiling to the rate. An investor
can buy a call option if expects interest rate to fall, or alternatively sell or write a put option.
While an investor who expects interest rate to rise will buy a put option or sell a call option.
Suppose a thrift or commercial bank wants to make sure that its cost of fund does not exceed
certain level. It can do so by buying a put option on CD futures (Fabozzi and Modigliani,
2003).
Forward Rate Agreement (FRA)
This is an agreement between two parties (one of whom is a dealer firm – a commercial bank
or investment firm) who agreed at a specified future date to exchange an amount of money
based on a reference interest rate and a notional principal amount (Fabozzi and Modigliani,
2003).
Interest Rate Swaps
This is an agreement whereby two parties agree to exchange periodic interest payments. The
amount of interest exchanged is based on the notional amount.
2.14 FORECASTING THE INTEREST RATE
Interest rate forecast is essential to financial institutions and other firms. This they do in an
attempt to capitalize on interest rate expectations. While the focus of defensive asset/liability
management is to insulate the portfolio from interest rate changes, the success of aggressive
asset/liability management depends on ability to forecast future interest rates (Rose et al,
1995). A variety of approaches are used in forecasting interest rate movements.
One of the most widely used approaches makes use of the flow of funds concept with
loanable funds framework. With this concept, financial analysts project the supply and
demand for loanable funds. While the supply of loanable funds includes funds provide by

Chapter two – Literature Review
29
major financial institutions as well as by other sources (excluding individuals), the demand
for loanable includes credit demand from businesses, consumers, and government. It is
important to note that the quantity of loanable funds supplied is presumed to increase with
rise in the interest rate (Rose et al, 1995).
Expected future equilibrium interest rate can also be revealed in the prices and yields attached
to contracts calling for future deliveries of interest bearing financial assets in the financial
future markets (Rose et al, 1995). However, the record of professional forecasters has been so
bad in anticipating interest rate changes. So it has been said that “the most important role for
a forecaster is to forecast often with as much ambiguity as possible (Rose et al, 1995).
More so, interest rate may be forecasted indirectly by forecasting the future rate of inflation,
provided the analyst has confidence in the Fisher effects. So since there is a sizeable error
rate in inflation forecast by the market in general, better forecast of inflation rate, which is
indirectly forecast of interest rate, can be profitable to the financial institutions (Rose et al,
1995).
2.15 CONCLUSION OF LITERATURE REVIEW
This section introduces the commercial banks and their services of intermediation between
the savings surplus units and saving deficit units. Due to the intermediation role of
commercial banks, the major part of their profit depends on the gap or spread between the
interest income earned on their assets(loans to savings deficit unit) and the interest expenses
paid on their liabilities(deposits from savings surplus unit), which is called net interest
income (NII). Net interest income is a major part of banks’ profit, this is basically why the
financial intermediaries try to offer lowest returns to savers and lend funds to borrowers at
the highest possible interest rates.
The literature infers that the interest rate risk affects the profit as well as the net worth of
commercial banks, because net interest income is a major part of commercial banks’ profit.
This argument is tested in the research methodology and the results of this research report.

Chapter three – Research Methodology
30
CHAPTER 3 RESEARCH METHODOLOGY
This section deals with the design, population and sampling methods used in the study. The
method of data collection used for the study is detailed, followed by the tools and methods
used in analysing the data.
3.1 RESEARCH DESIGN
This study is quantitative in nature, and involves mathematical modelling in order to
determine the effect of changes in interest rates on profit and net worth of the sampled banks.
This study uses panel data and assumes that the effect of interest rate changes vary across the
observations and over time, therefore the use of stochastic econometric (panel regression
analysis) process is appropriate.
Regression analysis is a statistical tool used for investigating the relationship between
variables, it is an important tool for financial researchers (Koop, 2006), as has been used by
many other researchers like Delis et al (2011), Kasman et al (2011), Hanweck and Kilcollin
(1984), Demirguc-Kunt and Harry (1999), Saha et al (2009) on related studies. The
deployment of regression technique is usually preceded by the formation of a mathematical
model, which indicates a priori relations between the variables. For the purpose of this study,
the variables of interest include profit (net interest margin) and net worth of commercial
banks, market interest rates (for this study repo rate is used), factors that determine the
interest rate movements, and some banks-specific factors. For the purpose of this study, there
are five (5) models to be interpreted individually.
1. The determinant(s) of interest rate movement that affects interest rate the most.
2. The effect of interest rate fluctuations on commercial banks’ profit.
3. The effect of interest rate fluctuations on commercial banks’ net worth.
4. How such dominant(s) from model one determinants affect commercial banks’ profit.

Chapter three – Research Methodology
31
5. How such dominant(s) from model one determinants affect commercial banks net worth.
The models, which are designed to sum the theoretical (empirical) relationship between the
study variables, are as follows:
1. MIίt = α + β1CPIt + β2Mst + β3Unctyt + ԑt (3.1)
2. Pίt = α + β1MIίt + β2LqtyRίt + β3CapR ίt + β4Comp ίt + β5Npl ίt + ԑt (3.2)
3. NWίt = α + βMIίt + β2LqtyRίt + β3CapR ίt + β4Comp ίt + β5Npl ίt + ԑt (3.3)
4. Pίt = α + β1DomD + ԑt (3.4)
5. NWίt = α + β1DomD + ԑt (3.5)
MIίt is the market interest rate at time t; for the purpose of the study the South African repo
rate is used, measured as the average repo rate. This is used because it is the
benchmark for variable deposits and lending rates in South Africa.
CPIt is the percentage changes in consumer price index of South Africa used to measure
the inflation rate.
Mst is the money supply rate. For the purpose of the study M3 is used to measure the
money supply rate in the country (South Africa).
Unctyt is uncertainty in the economy. It is measured as the standard deviation of gross
domestic product (GDP) for the current year and two previous years.
Pίt is the profit (net interest margin) of bank ί at time t. It is measured as
= − ÷ .
LqtyRίt is the liquidity ratio of bank i at time t.
CapRίt is the capital ratio of bank i at time t.

Chapter three – Research Methodology
32
Compίt is the level of completion among banks; it is measured as the average total asset of
three big banks (in terms of asset size as at the year 2010) divided by the assets bank i at time t.
Nplίt is the non-performing loan of bank I at time t; it is measured as the loan loss provision
divided by the total loan.
NWit is the net worth of bank ί at time t.
DomD is the determinant of interest rate movement that affects interest rate the most. It is the
dominant determinant which will emerge available after regressing equation 3.1.
α and βί (ί = 1,2…..N) are the coefficients; α is the intercept while β is the slope, which
measures the influence of MI, CPI, M3, and Repo(the explanatory or independent variables)
on P, MI, NW (the dependent variable) as the case may be (Koop, 2006). The liquidity ratio
(LqtyR), capital ratio (CapR), completion (Comp), and non-performing loan (Npl) are
considered as a set of bank specific factors that affect profit and/or net worth.
3.2 POPULATION AND SAMPLE
3.2.1 Population
The research population is all operational commercial banks in South Africa.
3.2.2 Sample Size and Selection
From the practical point of view, this study needed to balance the need for representative data
sample with availability of data. As such, the data sample used for the study is fourteen
commercial banks and one investment bank (total of fifteen banks) in South Africa for the
period of ten years (from 2001 to 2010). The reason for including an investment bank is due
to its deals with customers’ deposits, loans, and advances (i.e. its significant commercial
banking activity), which definitely are affected by interest rate fluctuations.
The sampled banks are of two sets, the big and the small banks, based on their total assets as
at the year-end 2010. The big banks are the banks with assets size of over R100 billion, they
include Standard bank, ABSA, Nedbank, and FirstRand bank, while the remaining ten banks
are ranked as small with assets size of below R100 billion. Table 3.1 below lists the sampled

Chapter three – Research Methodology
33
banks, their specialization, their asset size, percentage of their asset size to the banking
industry’s total assets, and the their country ranks as at the year 2010.
Table 3.1: Sampled banks, specialization, total asset, percentage of total asset to the
banking industry’s total asset, and country ranks as at 2010.
Bank Name Specialization Total Asset as
at 2010
% of Total
Asset
Country
Rank
STANDARD BANK Commercial Bank 824 600.00 26.40 1
ABSA “ 680 923.00 21.80 2
NEDBANK “ 576 490.00 18.46 3
FIRSTRAND BANK “ 576 386.00 18.45 4
INVESTEC BANK Investment Bank 197 879.00 6.34 5
IMPERIAL BANK Commercial Bank 55 660.00 1.78 6
AFRCAN BANK “ 34 435.00 1.10 8
PSG GROUP “ 14 686.00 0.47 9
MERCANTILE BANK “ 6 236.00 0.20 10
ALBRAKA BANK “ 2 825.00 0.09 15
GRINDROD BANK “ 2 440.00 0.08 19
SASFIN BANK “ 1538.00 0.05 20
S A BANK OF ATHENS “ 1 245.00 0.04 24
HABIB OVERSEA BANK “ 798.00 0.03 25
GSB MUTUAL BANK “ 776.00 0.02 26

Chapter three – Research Methodology
34
NOTE: The total asset is reported in millions of rand. The total asset of South African
banking industry is R3 123 349 million as at year-end, December 2010, and there were 38
operational banks in South Africa as at the year 2010 (source, Bank Scope data base).
3.3 DATA COLLECTION
The data for the study largely come from the income statement and balance sheet of the
sampled banks from Bank Scope database. A ten-year data from financial year-end 2001 to
financial year-end 2010 was collected from the banks’ annual reports. The interest rates
(prime, repo, and deposit), consumer price index, rate of money supply, and gross domestic
product were obtained from the South African Reserve Bank (SARB) database.
The following pieces of financial information required for the study, obtained from both the
annual reports of the sampled banks and the SARB database are as follows:
• Net interest margin (NIM) of the sample banks on yearly basis from 2001 to 2010.
• The net worth or owners’ equity of the sampled banks from 2001 to 2010.
• The provision for loan loss of the sampled banks from 2001 to 2010.
• The total capital ratios of the sampled banks from 2001 to 2010.
• The liquidity ratios of the sampled banks from 2001 to 2010.
• The total assets of the sampled banks from 2001 to 2010.
• The gross loan of the sampled banks from 2001 to 2010.
• The Gross Domestic Product (GDP) from 1999 to 2010.
• The Consumer Price Index (CPI) from 2001 to 2010.
• The repurchase rate (repo rate) from 2001 to 2010.
• The money supply rate (M3) from 2001 to 2010.
• The prime lending rate from 2001 to 2010.
• The deposit rate from 2001 to 2010.
A dataset was created in excel for the sampled banks and the variables for the study, and a
panel data became available. The dataset include five big banks with total assets of over R100
billion each, while the other ten banks have below R100 billion worth of total assets each (see
table 3.1). All financial data were downloaded, and there are ten years’ data available for all
the sampled banks. Any bank with incomplete ten years consecutive financial report was
excluded from the study.

Chapter three – Research Methodology
35
The data set was checked for completeness and accuracy before fitting it to the model. For
the purpose of modelling, all bank names were replaced with a bank identification number,
but are used interchangeably with the bank names. Table 3.2 below lists each bank’s
identification number, and number of years of financial information obtained.
Table 3.2: Bank names, identification numbers, and number of years of financial data
extracted.
Bank Name Bank Number Number of Years
STANDARD BANK 1 10
ABSA 2 10
FIRSTRAND BANK 3 10
NEDBANK 4 10
INVESTEC BANK 5 10
IMPERIAL BANK 6 10
AFRCAN BANK 7 10
PSG GROUP 8 10
MERCANTILE BANK 9 10
ALBRAKA BANK 10 10
GRINDROD BANK 11 10
SASFIN BANK 12 10
S A BANK OF ATHENS 13 10
HABIB OVERSEA BANK 14 10
GSB MUTUAL BANK 15 10

Chapter three – Research Methodology
36
3.4 THE RESEARCH INSTRUMENT
Being an important tool for financial researchers (Koop, 2006), and having been used by
many international researchers like Delis et al (2011), Kasman et al (2011), Hanweck and
Kilcollin (1984), Demirguc-Kunt and Harry (1999), Saha et al (2009) on related studies,
regression analysis is applied in this study by using simple panel data method to estimate
equations 3.1 to 3.5. The dataset formed was transferred to stata 10.0 to assess the effect of
interest rate fluctuations on commercial banks’ profitability, as well as on net worth. The
factors that determine interest rate movements were assessed, to determine which of the
factors has more impact on interest rate. The number of samples (fifteen banks) and time
period (ten years) are well defined.
The following preliminary tests were carried out to ensure the validity and accuracy of the
results from the analysis.
Stationarity Test
All the variables were tested for stationarity, using unit root test by Hadri (2000).
Nonstationarity was corrected using differencing order before the data is fitted to the model.
Autocorrelation Test
Because serial correlation (autocorrelation) in linear panel-data models biases the standard
errors and causes the results to be less efficient, a new test discussed by Wooldridge (2002) is
very attractive because it can be applied under general conditions and is easy to implement
(Drukker, 2003). For this study, autocorrelation was tested in all the models using
Wooldridge test, all the autocorrelation problems noticed in the models were corrected using
Prais-Winsten AR (1) model.
Hausman Test
Ordinary least square (OLS) model is not appropriate for linear panel-data (Wooldridge,
2006). The opportunity to use either fixed effect model or random effect model has been
tested using Hausman test. This test helps one to evaluate if a statistical model corresponds to
the data.

Chapter three – Research Methodology
37
3.5 DATA ANALYSIS
Hypothesis testing, trend, and correlation analyses are conducted using stata 10.0 to
determine the effects of the explanatory variables on the dependent variables, and the
relationships that exist among them.
3.5.1 Hypothesis Testing
Hypothesis testing is carried out on equations 3.1 to 3.5, with the hypothesis formally stated
as follows:
Hypothesis 1
H0: Fluctuations in macroeconomic factors (consumer price, percentage in money supply,
and uncertainty) do not determine fluctuation in the interest rates.
H1: Fluctuations in macroeconomic factors (consumer price, percentage in money supply,
and uncertainty) determine fluctuations in the interest rates.
Hypothesis 2
H0: Changes in interest rates (repo) do not affect commercial banks’ profit.
H1: Changes in interest rates (repo) affect commercial banks’ profit.
Hypothesis 3
H0: Changes in interest rates (repo) do not affect commercial banks’ net worth.
H1: Changes in interest rates (repo) affect commercial banks’ net worth.
Hypothesis 4
H0: Dominant determinants of interest rates (repo) do not affect commercial banks’ profits.
H1: Dominant determinants of interest rates (repo) affect commercial banks’ profits.

Chapter three – Research Methodology
38
Hypothesis 5
H0: Dominant determinants of interest rates do not affect commercial banks’ net worth.
H1: Dominant determinants of interest rates (repo) affect commercial banks’ net worth.
3.5.2 Trend Analysis
A graph plotted using time series data can be used to examine trend behavior. In this study,
the following graphs are plotted.
The market interest rate (repo rate) and the profit of the sampled banks are plotted over
time to determine the possible relationship between them. The plot was divided into big
banks (with total assets of over R100 billion), and small banks (with total assets of less
than R100 billion). The mean profit is used in this plot.
Repo rate verse net worth of the big and small banks: The logged mean net worth is
used, due to high values of net worth relative to the repo rates. This is done to see the
effect of repo rate changes on big and small banks’ profit during the observed period.
The repo rate and its determinants sampled in the study: This is to see the trend of repo
rate, inflation (consumer price index), money supply, and uncertainty during the period of
observation.
The prime, the repo, and deposit rates: These rates were plotted over time to determine
their trend behavior, to see the effect of repo rate in pricing the prime rate and deposit rate
by the commercial banks.
3.5.3 Correlation Analysis
Regression is the most appropriate tool for use if the analysis contains more than two
variables. Yet it is also not unusual when working with several variables to calculate the
correlation between each pair. Therefore a pair wise correlation analysis is conducted on the
test variables. This particular test is useful in flagging any potential multicollinearity problem
that might crop up in the regression tests.

Chapter four – Presentation and Discussion of Results
39
CHAPTER 4 PRESENTATION AND DISCUSSION OF RESULT
4.1 PRESENTATION OF RESULT
The empirical analysis and results are based on financial data from the sampled banks and the
South African Reserve Bank (SARB) for the period of ten consecutive years (2001 to 2010).
The banks have different financial year-ends, but with 12 months complete data for each
year-end. The financial data extracted from the annual reports of the sampled banks and
SARB are as tabulated in Appendix A and B, respectively.
ABSA and Mercantile banks changed their financial year-end from March 31 to
December 31 in 2003 and 2006, respectively, while Grindrod changed its own from
June 30 to December 31 in 2007.
PSG group has its financial year end of February (28 or 29) throughout the period.
Investec bank and GSB mutual bank have their financial year-end in March 31, and
have been consistent during the observed period.
FirstRand and Sasfin banks have their financial year end in June 30, consistent during
the observed period.
African bank has its own in September 30 during the observed period.
Finally, Standard bank, NedBank, Imperial bank, Habib oversea bank and South
African bank of Athens use the calendar year end of December 31 as their financial
year-end.
The financial data was corrected of nonstationarity, autocorrelation, and multicollinearity
before fitting it to the model. In descriptive analysis, the net worth was logged due to its
higher values compared to other variables.

Chapter four – Presentation and Discussion of Results
40
4.1.1 Descriptive Analysis
Table 4.1 shows the correlation between the test variables. The repo, prime, and deposit rates
are highly correlated with one another, mainly because repo rate is the benchmark with which
prime and deposit rates are determined. This makes it difficult for the regression model to
actually tell which of the independent variables is influencing the dependent variable
(multicollinearity problem). Therefore, the repo rate is chosen among the three rates for the
regression.
Table 4.1: Correlations among the test variables.
Repo Prime Depo CPI Mnys Uncert
------- -----------------------------------------------------------------------------------------------------------
Repo 1.0000
Prime 0.9864 1.0000
Depo 0.9712 0.9686 1.0000
CPI 0.4824 0.4957 0.5312 1.0000
Mnys 0.2017 0.1694 0.1207 0.0429 1.0000
Uncert -0.5275 -0.5120 -0.3929 -0.1659 -0.8500 1.0000
Table 4.2 below shows the correlation between the banks’ profits (net interest margin) and
the repo rate along with the bank-specific variables (internal factors). It reveals that both the
internal factors and the repo rate are positively correlated with profit, but the internal factors
have stronger positive correlation with profit than repo rate (an external factor). It also shows
that the bank-specific variables are negatively correlated with the repo rate, with the
exception of the non-performing loan, which may be due to the fact that repo rate is used as
the benchmark for loan pricing by financial institutions. Among the internal factors, only
non-performing loan displayed a stronger positive correlation (with liquidity ratio), but has an
inverse relationship (negative correlation) with competition.

Chapter four – Presentation and Discussion of Results
41
Table 4.2: Correlations among profit, repo rate, liquidity ratio, capital ratio, completion,
and non-performing loans.
Pft Repo Lqdty CapR Comp Npl
---------------------------------------------------------------------------------------------------------------------
Pft 1.0000
Repo 0.0025 1.0000
Lqdty 0.5761 -0.1063 1.0000
CapR 0.6255 -0.0905 0.4914 1.0000
Comp 0.0156 -0.0521 0.0253 0.0502 1.0000
Npl 0.7033 0.0237 0.6220 0.3516 -0.2079 1.0000
Table 4.3 shows the correlations among the banks’ net worth, repo rate, and the bank-specific
factors. Both the repo rate and the internal factors have negative correlation with the banks’
net worth, with the exception of the non-performing loan.
Table 4.3: Correlations among net worth, repo rate, liquidity ratio, capital ratio, completion, and non-performing loans.
Netw Repo Lqdty CapR Comp Npl
-----------------------------------------------------------------------------------------------------------------------
Netw 1.0000
Repo -0.1176 1.0000
Lqdty -0.1791 -0.1063 1.0000
CapR -0.2769 -0.0905 0.4914 1.0000
Comp -0.5085 -0.0521 0.0253 0.0502 1.0000
Npl 0.0184 0.0237 0.6220 0.3516 -0.2079 1.0000

Chapter four – Presentation and Discussion of Results
42
Table 4.4 lists the mean profits of both big and small banks. It reveals that the small banks
have higher profit (net interest margin) than the big banks. The small banks have the highest
mean net interest margin of 9.068 in 2006 and the lowest of 6.271 in 2010. The big banks
have the highest profit figure of 3.406 in 2001 and lowest of 2.674 in 2004. This shows that
small banks make more net interest margin, but with higher standard deviation than the big
banks of South Africa. This means that the profits of the small banks spread over a large
range of values, especially in the year 2006 and 2007.
Table 4.4: The mean profit for big and small banks by year.
Profit 5 Big Banks 10 Small Banks
Year Mean Standard Dev. Mean Standard Dev.
2001
2002
2003
2004
2005
2006
2007
2008
2009
2010
3.406
3.116
2.848
2.674
2.774
2.848
3.010
2.830
2.906
2.678
1.110531
0.8849181
0.8459137
0.8450326
0.5854742
0.5510173
0.5857901
0.4440158
0.6593027
0.4846854
6.833
7.454
8.262
8.658
7.266
9.068
9.011
7.627
7.281
6.271
5.301857
5.235386
6.928262
9.237866
9.24514
10.26932
10.4357
6.695183
5.399816
4.327153

Chapter four – Presentation and Discussion of Results
43
Table 4.5 lists the mean logged net worth of the banks (big and small). It shows that the net
worth of the banks increases by year, with low standard deviation, which entails low variation
or dispersion of the actual values from the average (mean) values.
Table 4.5: The mean logged net worth for big and small banks by year.
Net
Worth(Log)
5 Big Banks 10 Small Banks
Year Mean Standard Dev. Mean Standard Dev.
2001
2002
2003
2004
2005
2006
2007
2008
2009
2010
9.091466
9.205576
9.34199
9.553506
9.731119
9.925853
10.12193
10.3149
10.39465
10.47737
0.2835458
0.2194793
0.3932556
0.3806042
0.4320756
0.4955337
0.523865
0.4970133
0.4874655
0.4579093
4.925833
4.842237
5.063939
5.219495
5.386761
5.534618
5.837977
6.103205
6.229705
6.404803
1.666067
1.810445
1.6446
1.433272
1.408148
1.558076
1.658672
1.639281
1.650765
1.805841

Chapter
Figure 4
observe
banks. A
net inte
has 3.5
asset of
1.98%.
1
10
100
Mea
n pr
ofit
(%)
Figur
r four – Pre
4.1 below s
ed period. I
African ban
erest margin
8%, which
f R197 879
1.00
0.00
0.00
3.06
re 4.1 Mean
esentation a
hows the m
It is shown
nk with tota
n of 25.76%
is the high
9) is the lea
3.582.98
n percentage
and Discuss
mean profit (
that small
al asset of R
%. The big b
est among
ast profitab
2.95
1.98
4
e profit of sa
sion of Resu
(net interest
banks have
R34 435 mil
banks have
the big ban
ble among
4.23
25.76
7.
ampled bank
ults
t margin) fo
e higher ne
llion (a sma
relatively lo
nks. Investe
the whole
.016.17
4.4
ks during the
or all sample
et interest m
all bank) ha
ow net inter
ec bank (a b
sampled ba
48
2.70
7.75
e period 200
ed banks du
margin than
as the highe
rest margin
big bank w
anks with m
5
5.40
10.3
01 - 2010
44
uring the
n the big
est mean
n, ABSA
with total
mean of
1
3.94
Bank

Chapter
Figure
observe
and Sta
the big
recorde
banks e
(mainly
0
2
4
6
8
10
12
Log
Mea
n N
et w
orth
Figur
r four – Pre
4.2 graphic
ed period (2
andard bank
g banks hav
ed low leve
enjoy high
y via service
.00
.00
.00
.00
.00
.00
.00
10.06
re 4.2 The m
esentation a
cally plots
2001 to 2010
ks with 10.0
ve more ne
el of profita
net worth
e fees).
10.06 10.089
mean logged
and Discuss
the mean l
0). NedBan
06 each. Hab
et worth co
ability (net
due to thei
9.739.15
7
net worth o
sion of Resu
logged net
nk has the h
bib bank ha
ompared to
interest ma
ir access to
7.227.79
7.
of sampled b
ults
worth of t
ighest value
as the least
the small
argin), one
o significant
54
6.20
4.7
banks during
the sampled
e of 10.08,
value of 3.3
banks. Giv
can infer/s
t pool of n
765.12 5.29
g the period 2
d banks du
followed by
33. This sho
ven that bi
summarise
non-interest
9
4.20
3.33
2001 - 2010
45
uring the
y ABSA
ows that
g banks
that big
earning
3
4.08
Bank

Chapter four – Presentation and Discussion of Results
46
Figure 4.3 graphically indicates the trend of interest rate (repo) fluctuations and its cursory
effect on profits of both big and small banks. It appears that the effect of repo rate is more on
the profitability of small banks than those of the big banks. In addition, one can deduce from
the plot that interest rate fluctuations are more beneficial to small banks which may
contribute to their higher net interest margin relative to big banks. This confirms Hanweck
and Kilcollin’s (1984) finding that small commercial banks as a group have experienced
increase in profitability (net interest margin) both absolutely and relatively than large banks
during periods of rising interest rates.
Figure 4.4 below, plots the trend of interest rate, and net worth of the sampled big and small
banks. It shows that interest rate fluctuations appear not have affected the banks’ net worth
during the observed period (2001 to 2010). There is a slight decrease in net worth of the small
banks in 2002, as interest rate (repo) increased, which partially reflects the finding in figure
4.3, where small banks’ profitability appear to be strongly associated with interest rates.
1
3
5
7
9
11
13
15
2001 2002 2003 2004 2005 2006 2007 2008 2009 2010 Year
Big banks mean profit Small banks mean profit Repo rate
Figure 4.3 Comparison of repo rate with mean profit of big and small banks respectively

Chapter four – Presentation and Discussion of Results
47
Figure 4.5 plots the trend of the repo rate and theoretical determinants of interest rates. It
shows that repo rate and consumer price index move in the same direction, while uncertainty
measured as standard deviation of GDP, and money supply appear less correlated with repo
rate.
4
8
12
16
2001 2002 2003 2004 2005 2006 2007 2008 2009 2010 Year
Big banks net worth Small banks net worth Repo rate
Figure 4.4 Comparison of repo rate with net worth of big and small banks respectively
0
5
10
15
20
25
Year
Repo rate CPI Money supply Uncertainty
Figure 4.5 Trend of Repo rate, CPI, Money supply and Uncertainty

Chapter four – Presentation and Discussion of Results
48
Figure 4.6 plots the trend of prime, repo, and deposit rates (all of which are proxies of interest
rate). The deposit rate trend shows that depositors received a relatively smaller interest
benefit during the monetary policy tightening phases of 2002, and from 2006 to early 2009,
but received a relatively larger interest benefit during monetary policy easing cycles in 2003
and 2009. A much narrower spread between banks’ deposit rates and repo rate was
maintained between 2006 and 2008 as banks probably attempted to attract deposits during the
period of decelerating economic growth (see uncertainty trend in figure 4.5).
The prime (lending) rate, which generally uses repo rate as a benchmark, was found to
fluctuate at around 240 basis points above the repo rate from 2001 to 2010 (South African
Reserve bank, November 2009). Some little narrowing occurred during 2002 and from 2006
to 2008 during the tightening phases of monetary policy. Similarly the gap between prime
rate and repo rate widened when policy eased in 2003 and 2009.
4.1.2 Result of Hypothesis Testing
The hypothesis for the study is limited to the South African economy and commercial banks.
The hypothesis tests are summarized in Table 4.6 below.
4
8
12
16
2001 2002 2003 2004 2005 2006 2007 2008 2009 2010 Year
Prime rate Repo rate Deposit rate
Figure 4. 6 Comparison of prime rate, repo rate and deposit rate 2001 - 2010

Chapter four – Presentation and Discussion of Results
49
Table 4.6 Summary of hypothesis testing
Null hypothesis Alternative hypothesis
Hypothesis 1 Fluctuations in macroeconomic
factors do not determine the
fluctuations in interest rate (repo
rate) in South Africa during the
observed period (2001 to 2010).
Fluctuations in macroeconomic factors
determine the fluctuation in interest
rate (repo rate) in South Africa during
the observed period.
Hypothesis 2 Changes in interest rates (repo rate)
do not affect commercial banks’
profit (net interest margin) during the
observed period.
Changes in interest rates (repo) affect
commercial banks’ profit (net interest
margin) during the observed period.
Hypothesis 3 Changes in interest rates (repo rate)
do not affect commercial banks’ net
worth.
Changes in interest rates (repo rate)
affect commercial banks’ net worth.
Hypothesis 4 The dominant determinants of
interest rates (repo), among the
macroeconomic factors, do not affect
commercial banks’ profits (net
interest margin).
The dominant determinants of interest
rates (repo), among the
macroeconomic factors, affect
commercial banks’ profits (net interest
margin).
Hypothesis 5 . The dominant determinants of
interest rates (repo), among the
macroeconomic factors, do not affect
commercial banks’ net worth.
The dominant determinants of interest
rates (repo), among the
macroeconomic factors, affect
commercial banks’ net worth.
4.1.3 Summary of the Result
The models used for the study perform reasonably well with most variables staying stable
across the various regressions tested. The explanatory powers of the models are reasonably
high, while the F-statistics for all models are significant at the 5% level. The Hausman fixed

Chapter four – Presentation and Discussion of Results
50
random test was used to determine which model is appropriate for each hypothesis. The
classification of banks as big and small is based on the asset size as at the year 2010. The big
banks have asset size of over R100 billion, while the small banks are banks with asset size of
below R100 billion.
Table 4.7 Summary of the results of hypothesis testing for 15 sampled banks
Hypothesis Model p-
value Coefficient Decision Findings
Hypothesis 1
CPI
Money supply
Uncertainty
Random effects
0.000
0.008
0.000
0.1878659
-0.1070841
-1.3030630
Accept H1
There is significant evidence that fluctuations in macroeconomic factors such as CPI, money supply, and uncertainty of the economy determine the changes in interest rates (repo rate).
Hypothesis 2 Random effects
0.012 0.3638664 Accept H1
The changes caused by interest rate fluctuations in profits of commercial banks are statistically significant.
Hypothesis 3 Prais-Winsten
0.007 163.9697 Accept H1
Net worth of commercial banks is significantly affected by interest rate fluctuations.
Hypothesis 4
CPI
Money supply
Uncertainty
Fixed effects
0.135
0.354
0.206
-0.1427175
-0.0681456
-0.6479516
Accept H0
The effect of macroeconomic factors (most predictors of repo rate) on commercial banks’ profit is not statistically significant.
Hypothesis 5
CPI
Money supply
Uncertainty
Prais-Winsten
0.326
0.560
0.813
36.062
-18.56356
-66.5477
Accept H0
The effect of macroeconomic factors (most predictors of repo rate) on commercial banks’ net worth is not statistically significant.

Chapter four – Presentation and Discussion of Results
51
Table 4.8 Summary of the results of hypothesis testing for the 5 big sampled banks
Hypothesis Model p-
value Coefficient Decision Findings
Hypothesis test 2
Random effects
0.283 0.0371527 Accept H0
The changes caused by interest rate fluctuations in profits of big banks in South Africa are not statistically significant.
Hypothesis test 3
Prais-Winsten
0.756 -94.13676 Accept H0
The net worth of the big commercial banks is not significantly affected by interest rate fluctuations.
Hypothesis test 4
CPI
Money supply
Uncertainty
Fixed effects
0.729
0.617
0.952
0.0081384
-0.0091081
0.0077185
Accept H0
The effect of macroeconomic factors (most predictors of repo rate) on big commercial banks’ profit is not statistically significant.
Hypothesis test 5
CPI
Money supply
Uncertainty
Prais-Winsten
0.147
0.316
0.926
243.4403
-169.9121
74.7295
Accept H0
The effect of economic factors (most predictors of repo rate) on big commercial banks’ net worth is not statistically significant.

Chapter four – Presentation and Discussion of Results
52
Table 4.9 Summary of the results of hypothesis testing for 10 small sampled banks
Hypothesis Model p-
value Coefficient Decision Findings
Hypothesis test 2
Random effects
0.040 0.480819
Accept H1
There is significant evidence that fluctuations in interest rate affect profit of small commercial banks during the observed period.
Hypothesis test 3
Fixed effects 0.305 -34.78151
Accept H0
No significant evidence that net worth of small commercial banks is affected by interest rate fluctuations
Hypothesis test 4
CPI
Money supply
Uncertainty
Fixed effects 0.173
0.392
0.267
-0.2083123
-0.0996299
-0.8991706
Accept H0
The effect of macroeconomic factors (most predictors of repo rate) on small commercial banks’ profit is not statistically significant.
Hypothesis test 5
CPI
Money supply
Uncertainty
Fixed effects 0.009
0.213
0.048
68.35641
24.16229
269.2799
Accept H1
The effect of macroeconomic factors on small commercial banks’ net worth is statistically significant.
4.1.4 Changes in Repo Rate with Macroeconomic Factors
In the random effect regression model of repo rate against the investigated macroeconomic
factors (CPI, money supply and uncertainty), the coefficient of each variable represented the
estimated change in repo rate predicted by a percentage change in each factor, holding all
other variables constant.

Chapter four – Presentation and Discussion of Results
53
Repo rate and CPI
Increase in CPI led to an increase in repo rate (coeff. = 0.188; [CI = 0.087 – 0.289]; p <
0.001). This means that every percentage increase in CPI would result in a 0.19% increase in
repo rate, and this is statistically significant as the two tail p-value of the estimate is less than
the cut-off of 0.05 within 95% confidence interval.
Repo rate and Money supply
Money supply affected repo rate in the opposite direction. A percentage increase in money
supply would cause a 0.11% decrease in repo rate (coeff. = - 0.107; [CI -0.187 to – 0.027]; p
= 0.008). This estimate was statistically significant with a p-value of 0.008 at 95% confidence
interval.
Repo rate and uncertainty
Increase in uncertainty resulted in a decrease in repo rate (coeff. = -1.303; [CI –1.856 to -
0.750]; p < 0.001). This means repo rate decreases by 1.30% for every unit change in
uncertainty. This effect of uncertainty on repo rate is statistically significant.
4.1.5 Banks’ Profit Variations with Repo Rate
Using the random effect model (from Hausman test), profit of the banks was estimated with
changes in repo rate over the 10 year observed period. The regression was controlled with
other bank-specific variables (liquidity ratio, capital ratio, competition, and non-performing
loan).
On all sampled banks
Running regression using the fifteen sampled banks, increase in repo rate led to an increase in
profit (coeff. = 0.364; [CI = 0.080 to 0.648]; p = 0.012). This means that for every percentage
change in repo rate, profit increases by 0.36%. This effect is statistically significant with p-
value (0.012) less than 0.05 at 95% confidence interval. Among the controlling variables,
capital ratio, competition, and non- performing loan all have positive coefficients of 0.287,
0.002, 1.019 respectively, but only capital ratio and non-performing loan are statistically

Chapter four – Presentation and Discussion of Results
54
significant (P<0.001) at 5% confidence level, while liquidity ratio has a negative coefficient
of -0.005, and is not statistically significant (p-value = 0.513, greater than 0.05).
On Big banks
For a percentage change in repo rate, the profit of the five big banks increases by 0.037%, but
this is not statistically significant with a p-value of 0.283 at 95% confidence interval (coeff. =
0.037; [CI = -0.031 to 0.105]; p = 0.283). Liquidity and capital ratios have negative
coefficients of -0.035 and -0.089, meaning that a percentage change in liquidity and capital
ratios decreases profit of big banks by 0.035% and 0.090%, respectively. This effect is
statistically significant with p-values of 0.006 and 0.022 at 5% confidence level, respectively.
Competition and nonperforming loan have positive coefficients of 0.006 and 0.010 with p-
values of 0.956 and 0.940 at 95% confidence interval respectively, which shows that they are
not statistically significant.
On small banks
Running regression using only the small banks, increase in repo rate led to an increase in
profit (coeff. = 0.481; [CI = 0.021 to 0.940]; p = 0.040). That means for every percentage
change in repo rate, profit of small banks increases by 0.481%. This effect is statistically
significant with a p-value of 0.040 which is less than 0.05 at 95% confidence interval. This
confirms the plot in figure 4.3, that the effect of interest rate fluctuations is more on small
banks’ profit than on big banks’ profit. The control variables: capital ratio, competition, and
non- performing loan have positive coefficients of 0.298, 0.01, and 2.195, respectively. This
means that any percentage change in the above mentioned variables will lead to an increase
in profit, but only capital ratio and non-performing loan are statistically significant (P<0.001)
at 95% confidence level, while liquidity ratio has a negative coefficient of -0.002, and is not
statistically significant (p-value = 0.828, greater than 0.05).
4.1.6 Banks’ Net Worth Variations with Repo Rate
As was regressed in profit variations, the sampled banks’ net worth were estimated with
changes in repo rate during the observed period (2001 to 2010), while controlling for the
regression of banks’ net worth with the same banks- specific variables (liquidity ratio, capital
ratio, competition and non-performing loan).

Chapter four – Presentation and Discussion of Results
55
On all sampled banks
Using the Prais-Winsten AR (1) model to correct the serial correlation problem in this model,
(coeff = 163.97; [CI = 46.642 to 281.297]; p = 0.007). This means that a percentage change
in repo rate increases the net worth by R163.97, this is statistically significant with a p-value
(P= 0.007) less than 0.05 at 95% confidence interval. The control variables: liquidity ratio,
capital ratio and competition also have positive influence on net worth with coefficient of
8.209, 20.814, and 0.644 respectively, but only liquidity has a statistical significant effect
with a p-value of 0.018 which is less than 0.05 at 95% confidence interval. The non-
performing loan has a negative effect on net worth with coefficient of -100.042, but not
statistically significant as with a p-value of 0.373.
On big banks
Using the same Prais-Winsten AR (1) model, a percentage change in repo rate reduces the net
worth of the five big banks by R94.137, but this is not statistically significant with a p-value
of 0.756 at 95% confidence interval (coeff. = -94.127; [CI = -700.211 to 511.938]; p =
0.756). Liquidity and competition have negative coefficients, meaning that a percentage
change in liquidity ratio and competition decreases net worth of big banks by R7.481 and
R2509.051, respectively. This effect is not statistically significant with p values of 0.952 and
0.366 at 95% confidence level respectively. Capital ratio and nonperforming loan have
positive coefficients of 587.544 and 1667.509 with p-values of 0.169 and 0.247 at 95%
confidence interval respectively, which indicate that they are not statistically significant.
On small banks
Using the fixed effect model as recommended by Hausman test, a percentage change in repo
rate leads to a decrease in net worth of the small banks by R34.782, (coeff. = -34.782; [CI = -
101.959 to 32.395]; p = 0.305). This effect is not statistically significant, with a p-value
(0.305) greater than 0.05 at 95% confidence interval. The control variables: liquidity ratio and
competition have positive coefficients of 12.803 and 0.118, respectively. It means that any
percentage change in the mentioned variable will lead to an increase in net worth, but only
liquidity ratio is statistically significant (P<0.001) at 5% level, while competition has a p-
value of 0.847. Capital ratio and non-performing loan have negative coefficients of -10.906,
and -81.394 and p-values of 0.476 and 0.34, respectively greater than 0.05 at 95% confidence
level, which show that they are not statistically significant.

Chapter four – Presentation and Discussion of Results
56
4.1.7 Banks’ Profit Variations with the Dominant Determinants of Repo Rate
From the regression of repo rate against its determinants (CPI, money supply, and
uncertainty), it was discovered that all of them are significant determinants of repo rate, but
uncertainty is the most influential of repo rate. Uncertainty has coefficient of -1.303, meaning
its 1% increase will decrease repo rate by 1.30%, while a percentage change in CPI and
money supply will only affect repo rate by 0.19% and -0.11%, respectively. Using the fixed
effect model as considered appropriate by Hausman test, banks’ profit ( for all sampled
banks, big, and small banks) was regressed against the macroeconomic factors (CPI, money
supply, and uncertainty), to determine their individual effects on profit, controlling the
regression with the bank-specific variables: (liquidity ratio, capital ratio, competition, and
non-performing loan).
On all sampled banks
CPI (coeff. = -0.143; [CI = -0.3307 to 0.0453]; p = 0.135)
Money supply (coeff. = -0.068; [CI = -0.2134 to 0.0771]; p = 0.354).
Uncertainty (coeff. = -0.648; [CI = -1.658 to 0.362]; p = 0.206).
This means that for any percentage change in CPI (inflation rate), money supply, and
uncertainty would lead to a decrease in profit by 0.143%, 0.068%, and 0.648% respectively.
All these effects are not statistically significant as the p-values of 0.135, 0.354, and 0.652,
respectively are greater than 0.05 at 95% confidence interval.
For the internal factors, liquidity ratio and competition have negative coefficients of -0.020
and -0.006. Meaning that a percentage change in liquidity ratio and competition decreases
profit by 0.020% and 0.006%, with p-values of 0.002 and 0.048, respectively, which show
that both effects are statistically significant at 95% confidence interval. Capital ratio and
non-performing loan have positive coefficients of 0.036 and 0.383, but are not statistically
significant with p-values of 0.585 and 0.291, respectively.

Chapter four – Presentation and Discussion of Results
57
On Big banks
A percentage increase in CPI and uncertainty would lead to an increase in profit of the big
banks by 0.008% each. While a percentage change in money supply leads to a decrease in
profit by 0.009%. The effects of the above mentioned macroeconomic factors are not
statistically significant with p-values of 0.729, 0.617, and 0.952, respectively at 95%
confidence interval, as shown below.
CPI (coeff. = 0.008; [CI = -0.0393 to 0.0556]; p = 0.729).
Money supply (coeff. = -0.009 [CI = -0.0458 to 0.0276]; p = 0.617)
Uncertainty (coeff. = 0.0077; [CI = -0.2526 to 0.2680]; p =0.952).
For the bank-specific factors, liquidity ratio, capital ratio and non-performing loan at any
percentage change, decreases profits of big banks by 0.022%, 0.102%, and 0.144%,
respectively. The effects of liquidity ratio and non-performing loan are not statistically
significant with p-values of 0.098, and 0.405 at 95% confidence interval, respectively, while
the effect of capital ratio is statistically significant with a p-value of 0.011. Competition has a
positive coefficient of 0.052 with a p-value of 0.867, which is not statistically significant at
95% confidence interval.
On small banks
Running regression using the small banks alone, a percentage change in CPI, money supply,
and uncertainty decreases the profit by 0.208%, 0.100%, and 0.899%, respectively. These
effects are not statistically significant with p-values of 0.173, 0.392, and 0.267, respectively
at 95% confidence interval. The summary is as follows:
CPI (coeff. = -0.208; [CI = -0.5107 to 0.0941]; p = 0.173).
Money supply (coeff. = -0.0996; [CI = -0.3304 to 0.1312]; p = 0.392).
Uncertainty (coeff. = -0.899; [CI = -2.5024 to 0.7041]; p = 0.267).
The control variables: liquidity ratio and competition have inverse relationships with profits
of small banks, with coefficients of -0.020 and -0.006, respectively. It means that any
percentage change in the mentioned variables will lead to a decrease in profit, but only the

Chapter four – Presentation and Discussion of Results
58
effect of liquidity ratio is statistically significant (P=0.014) at 95% confidence interval, while
the effect of competition is not, with a p-value of 0.097, which is greater than 0.05. Capital
ratio and non-performing loan have positive relationships with profit with coefficients of
0.044 and 0.448 but are not statistically significant with p-values of 0.614 and 0.364,
respectively.
4.1.8 Banks’ Net Worth Variations with the Dominant Determinants of Repo Rate.
The banks’ net worth (for all sampled banks, big, and small banks) were also regressed
against the macroeconomic factors that are statistical determinants of repo rate. The
regression was as well controlled with the bank-specific variables (liquidity ratio, capital
ratio, competition and non-performing loan).
On all sampled banks
Serial correlation problem was corrected using the Prais-Winsten AR (1) model, as net worth
of the sampled banks is regressed against the dominant determinants of repo rate (CPI,
money supply, and uncertainty).
CPI (coeff. = 36.062; [CI = -36.290 to 108.415]; p = 0.326).
Money supply (coeff. = -18.564; [CI = -81.428 to 44.301]; p = 0.560).
Uncertainty (coeff. = -66.548; [CI = -622.510 to 489.415]; p = 0.813).
This means that a percentage change in CPI increases banks’ net worth by R36.062, with a p-
value of 0.326. While any percentage change in money supply and uncertainty would lead to
decrease in net worth by R18.564 and R66.548, with p-values of 0.561 and 0.813,
respectively. These effects are not statistically significant at 95% confidence level as their p-
values are greater than 0.05.
The control variables: liquidity ratio, capital ratio and competition also have positive
influence on net worth with coefficients of 7.670, 8.799, and 0.616, respectively, but only
liquidity ratio has a statistical significant effect with a p-value of 0.031, which is less than
0.05 at 95% confidence interval. The non-performing loan has a negative effect on net worth
with coefficient of -74.196, but not statistically significant with a p-value of 0.524.

Chapter four – Presentation and Discussion of Results
59
On big banks
Using the same Prais-Winsten AR (1) model on only big banks, any percentage change in
CPI and uncertainty increases the banks’ net worth by R243.440 and R74.730, with p-values
of 0.147 and 0.926, respectively. Whereas, a percentage change in money supply would
reduce the net worth by R169.912, with a p-value of 0.316. None of the effects is statistically
significant, as the p-values are greater than 0.05 at 95% confidence level. The result is
summarized as follows:
CPI (coeff. = 243.440; [CI = -89.586 to 576.467]; p = 0.147).
Money supply (coeff. = -169.912; [CI = -508.866 to 169.06]; p = 0.316).
Uncertainty (coeff. = 74.730; [CI = -1151.563 to 1701.022]; p = 0.926).
For the control variables: liquidity ratio, capital ratio, and non-performing loan have positive
coefficients. Which show that a percentage change in liquidity ratio, capital ratio and non-
performing loan increases the net worth of the big banks by R49.439, R471.040, and
R226.875, with p-values of 0.739, 0.380, and 0.917 at 95% confidence interval, respectively,
which indicate that they are not statistically significant. While competition has a negative
coefficient, showing that a percentage change in competition decreases the net worth of big
banks by R2480.254, with a p-value of 0.427. The effects are not statistically significant as p-
values are greater than 0.05 at 95% confidence interval.
On small banks
The fixed effect model as stipulated by Hausman test is used to run the same regression on
the small banks.
CPI (coeff. = 68.356; [CI = 18.033 to 118.680]; p = 0.009).
Money supply (coeff. = 24.162; [CI = -14.258 to 62.583]; p = 0.213).
Uncertainty (coeff. = 269.280; [CI = 2.458 to 536.102]; p = 0.048).
This means that a percentage in CPI, money supply, and uncertainty increases the net worth
of the small banks by R68.356, R24.162, and R269.280, with p-values of 0.009, 0.213, and
0.048, respectively. The effects of CPI and uncertainty are statistically significant as the p-

Chapter four – Presentation and Discussion of Results
60
values are less than 0.05 at 95% confidence interval, while the effect of money supply is not
statistically significant.
For the internal factors, liquidity ratio and competition have positive coefficients of 13.007
and 0.566, respectively. It means that any percentage change in the mentioned variables
would lead to an increase in net worth, but only liquidity ratio is statistically significant
(P<0.001) at 95% confidence interval, while competition has a p-value of 0.348, which is not
statistically significant at 95% confidence interval. Capital ratio and non-performing loan
have negative coefficients of -1.569, and -88.711, with p-values of 0.914 and 0.281
respectively, showing that they are not statistically significant at 95% confidence interval.
4.2 DISCUSSION OF RESULT
The findings on the variations of profit and net worth of commercial banks in South Africa
from 2001 to 2010 due to fluctuations in interest rate (repo rate) are discussed. From the data
analysis and presentation of result, the macroeconomic factors that influence the changes in
repo rate were first estimated to determine which influences repo rate most.
4.2.1 Changes in Repo Rate with Macroeconomic Factors
The result of this study indicates that changes in inflation rate (CPI), money supply, and
uncertainty, are strong determinants of changes in repo rate. A 1% change in CPI increases
the repo rate by 0.19%, while a percentage change in money supply and uncertainty decreases
the repo rate by 0.11% and 1.30%, respectively. The coefficients of these economic factors
are statistically significant, which confirms the trend of these economic factors with repo rate
(as reflected figure 4.5). This means that if inflation rate increases, the Reserve Bank
increases the rate at which government securities are repurchased from the commercial
banks. This finding is consistent with the results of Booth and Ciner (2001), and Laatsch and
Klein (2003), that there is a one for one relationship between expected inflation and nominal
interest rate. But to avoid hyperinflation, the Federal Reserve does not consistently follow the
inflation rate to measure the repo rate, but has the right to use repo rate to tighten credit in
order to retard inflationary pressure (South African Reserve bank, March 2011).

Chapter four – Presentation and Discussion of Results
61
The result shows that money supply and uncertainty have inverse relationships with the repo
rate. The implication of monetary policy is that when money supply is targeted, the resultant
interest rate is adopted. If the Federal Reserve adopts expansionary monetary policy (increase
in money supply), this reduces the interest rate (repo rate, as confirmed by the result), which
in turn reduces the prime lending rate of commercial banks, thereby increasing demand for
credit (Blanchard, 2007). The Reserve Bank uses this action to influence the overall lending
policies of commercial banks, and demand for money and credit in the economy (South
African Reserve bank, July 2007). The result also shows that uncertainty is the most
influential of the repo rate with a negative coefficient of 1.30. This means that if there is high
uncertainty in the economy, the government takes care of it through the Reserve Bank by
reducing the interest rate by way of expansionary monetary policy. This occurred between
2004 and 2006 (as shown, figure 4.5).
4.2.2 Repo Rate Variations with Banks’ Profit
Changes in interest rate (repo rate) affect the profit of commercial banks in South Africa, as
revealed in the result of the analysis. A percentage change in repo rate increases the
commercial banks’ profit by 0.36%, this effect is statistically significant. This result is
consistent with Demirguc-Kunt and Harry (1999), who found that interest rates are associated
with higher interest margins and profitability, especially in developing countries.
This could mean that South African commercial banks, while carrying out asset
transformation and intermediation functions, are conscious of maturity mismatch of their
assets and liabilities and unexpected changes in interest rates (Delis et al, 2011; Kasman et al,
2011; Hanweck and Kilcollin, 1984), and/or they are using interest rate derivatives to hedge
the interest rate risk. It can also be said that the banks’ managers practice aggressive
asset/liability management by forecasting the future interest rates and adjusting their portfolio
depending on the direction and level of interest rate changes in favor of their profit (net
interest margin) (Rose et al., 1995).
For further clarification, regression was separately carried out on big and small banks, to see
if the effect is of the same level in two group sizes. It was revealed that the effect of interest
rate changes is high in small banks relative to big banks. A percentage change in the repo rate
increases the profit of the big banks by 0.037%, and this effect is not statistically significant.

Chapter four – Presentation and Discussion of Results
62
While the same percentage change in repo rate significantly increases the profit of the small
banks by 0.481%. This confirms the plot in figure 4.3 which shows the trend effect of repo
rate and profit of small banks relative to that of big banks. This result is consistent with the
findings of Hanweck and Kilcollin, (1984) that small commercial banks as a group have
actually experienced increase in profitability (net interest margin) relative to large banks in
periods of rising interest rates (since 1976).
4.2.3 Repo Rate Variations with Banks’ Net Worth
The result shows that the net worth of the commercial banks is significantly affected by
interest rate fluctuations. A percentage change in repo rate increases the net worth by
R163.97. This is in agreement with Molyneux and Thorton (1992) findings, that there is a
positive association between return on equity and the level of interest rates. It can be said that
the banks manage the maturity of their assets and liabilities effectively to absorb the shock of
interest rate risk on net worth. As stipulated by Saha et al. (2009), if there is maturity
mismatch, interest rate hike reduces the present value of assets much more than that of
liabilities, thereby depleting the bank’s net worth.
But this result contradicts the regression separately carried out on big and small banks. It
reveals that a percentage change in repo rate reduces the net worth of big and small banks by
R94.14 and R34.78 respectively, although the effects are not statistically significant. This
insignificant effect can also be confirmed from figure 4.4, which shows the unrelated trend of
repo rate with the net worth of big and small banks. But in 2002, there was a little decrease in
small banks’ net worth as repo rate increased. However this contradiction between the results
from all sampled banks and that of big/small banks may be attributed to the reduction in the
number of sampled banks and number of observation in the analysis.
4.2.4 Banks’ Profit with the Dominant Determinants of Repo Rate
All the macroeconomic variables (CPI, money supply, and uncertainty) used in the analysis
are dominant determinants of repo rate, as they all have significant effect on repo rate.
However, uncertainty was found to have the highest influence on repo rate from hypothesis
one, as a percentage of it reduces the repo rate by 1.31%. Whereas a percentage change in

Chapter four – Presentation and Discussion of Results
63
CPI and money supply increases the repo rate by 0.19% and reduces it by 0.11%,
respectively. Estimating the effect of these external factors on the banks’ profit, the results
show that a percentage change in CPI, money supply, and uncertainty decreases the profit of
all sampled banks by 0.143%, 0.068%, and 0.648%, respectively. These effects are not
statistically significant.
CPI and uncertainty have contrary effects on big banks’ profit, compared to their effects on
all the sampled banks. They increase the big banks’ profit by 0.008% each, at any percentage
change. Meanwhile their effects on small banks’ profit are in accordance with the effects they
have on all the sampled banks. For the small banks, a percentage change on CPI and
uncertainty decreases the profit by 0.208% and 0.899%, respectively. Whereas money supply
still have reduction effect on both big and small banks by 0.009% and 0.10%, respectively. It
could be said that the big banks must have absorbed the shock of CPI and uncertainty with
the advantages they have over the small banks, which include, asset size, loan volume,
deposit volume, branch networks, strategic locations etc.
However all these effects, both positive and negative are not statistically significant. This is
in agreement with Sidabalok and Viverita (2011), who found that macroeconomic factors
have no direct effect on net interest margin in Indonesia, but contrary to the findings of
Saunders and Schumacher (2000), that the macroeconomic variables significantly influence
the determination of the margin by banks.
Also, as this study revealed that inflation (CPI) increases the profit of the big banks by only
0.008%, it is in partial agreement with the Demirguc-Kunt and Harry’s (1999) findings,
which revealed that inflation is associated with higher realised interest margins and higher
profitability. They went further to say that inflation entails higher cost, more transactions, and
generally more expensive branch network, but the positive relationship between inflation and
bank profitability implies that bank income increases more with inflation than bank cost.
Probably, these contradictions may be due to differences in periods of studies and different
economic conditions of different countries at the time of study. According to this study, there
is no significant effect of macroeconomic factor (uncertainty) on South African commercial
banks’ profit (net interest margin) from 2001 to 2010.

Chapter four – Presentation and Discussion of Results
64
4.2.5 Banks’ Net Worth with the Dominant Determinants of Repo Rate
The result revealed that CPI at any percentage change increases the net worth of all sampled
banks, big, and small banks by R36.062, R243.44, and R68.36, respectively. The effect on
the small banks is highly significant, but effects on all sampled banks and big banks are not.
A percentage change in money supply reduces the net worth of the sampled banks and that of
big banks by R18.56 and R169.91, respectively, but has a contrary effect on the small bank’s
net worth with an increase of R24.162, all these effects are not statistically significant. While
a change in uncertainty reduces the net worth of the sampled banks by R66.55, but increases
that of big and small banks by R74.730 and R269.28, respectively, only the effect on small
banks is statistically significant.
From the results, one can infer that commercial banks net worth benefit from changes in
macroeconomic factors that determine the repo rate than changes in repo rate itself, as the
results revealed that changes in repo rate reduce the net worth of both big and small banks.
Whereas, changes in the macroeconomic factors increase the banks’ net worth, except money
supply which reduces only the big banks’ net worth.
4.2.6 Banks’ Profit and Net Worth with the Banks Specific Internal Factors
The analysis revealed that among the internal factors affecting profit and net worth of
commercial banks, the liquidity ratio is the most significant factor relative to capital ratio,
competition, and non-performing loan. The results show that high liquidity reduces the profit
of commercial banks in South Africa, and the effect is statistically significant. This is in
agreement with the findings of Sidabalok and Viverita (2011), Doliente (2003), Angbazo
(1997), Wong (1997), that bank-specific factors also significantly affect the net interest
margin of the banking sector. On the other hand, high liquidity increases the net worth of
commercial banks. It was also found that this liquidity effect is highly significant with small
banks’ but not statistically significant with big banks’ net worth.

Chapter five – Conclusions and Recommendations
65
CHAPTER 5 CONCLUSION AND RECOMMENDATIONS
5.1 SUMMARY OF FINDINGS
Banks have become increasingly aware of interest rate risk in the financial industry. Among
other risks, it is a major concern for financial institutions, as it can cause harm, if not failure,
to a financial institution, by interacting with other risks. The net interest income (NII) of
banks is highly exposed to interest rate risk, as it is based on the “GAP” between rate
sensitive assets and rate sensitive liabilities. This is a major concern to banks that hold a large
proportion of their portfolio in long-term fixed-rate loans.
Therefore, the general objective of this study is to investigate the impact of interest rate risk
on both the profitability and net worth of commercial banks in South Africa over a period of
ten years. The research also is extended to investigate the extent to which the interest rate risk
affect the profit and net worth of big and small banks separately (big and small measured in
terms of asset size of the banks as at the year-end 2010).
The research is quantitative in nature and involves mathematical modelling, stochastic
econometric approach (time series regression analysis) was applied, using panel data, which
assumes that the effect of interest rate changes vary across the observations and over time.
Hausman fixed random test was used to determine which model (between fixed effect and
random effect) is appropriate for each hypothesis.
From the interest rate model, it was found that all the macroeconomic factors used in the
study are important predictors of interest rate (repo rate) changes. But uncertainty, which was
measured as the standard deviation of gross domestic product for the current year and two
previous years, has the highest influence on interest rate during the observed period 2001 to
2010).
The estimated results from the profit models show that profit of South Africa’s commercial
banks are significantly increased by the changes in repo rate, this effect is more on small
banks relative to big banks. Whereas the macroeconomic factors (inflation, money supply and

Chapter five – Conclusions and Recommendations
66
uncertainty), which are the important predictors of repo rate, do not have any direct
significant effect on the banks’ profits, it was found that contrary to repo rate effect on profit,
these macroeconomic factors reduce profits of the commercial banks, but the effect is not
statistically significant.
From the net worth model, the estimated results show that repo rate significantly affects
(increases) the net worth of commercial banks in South Africa during the observed period.
But a non-significant reduction effect was noticed when estimation was carried out separately
on big and small banks. Interestingly, it was found that inflation (CPI) and uncertainty, which
are determinants of repo rate, have significant increase effect on the net worth of the small
banks, contrary to the non-significant reduction effect by the repo rate. An increase in repo
rate insignificantly reduces the big and small banks’ net worth by R94.14and R34.78,
respectively. But increase in inflation and uncertainty (macroeconomic factors) increases the
big banks’ net worth by R243.44 and R74.73, respectively, as well as increases the small
banks’ net worth by R68.36 and R269.28, respectively.
It could be advised that to maximize owners’ equity, South African commercial banks (big
and small) should concentrate more on forecasting and controlling the determinants of the
interest rates, rather than the interest rate itself. It was also found that among the internal
factors affecting profit and net worth of commercial banks, the liquidity ratio is most
significant relative to capital ratio, competition, and non-performing loan.
5.2 CONCLUSION OF THE STUDY
The result from the analysis of the data-set would lead us to conclude that: Firstly,
macroeconomic factors determine the changes in repo rate, but uncertainties in the economy,
at a particular point in time has the highest influence in predicting the changes in repo rate.
Secondly, interest rate (repo rate) changes have a positive effect on the profit (net interest
margin) of commercial banks in South Africa during the period of 2001 to 2010. Thirdly,
small commercial banks actually experience increase in profitability (net interest margin)
both absolutely and relative to big banks in periods of rising interest rates. This indicates that
there is a positive relationship between interest rate and NIM as small banks indicate
increasing profitability with rising interest rate.

Chapter five – Conclusions and Recommendations
67
Fourthly, interest rate fluctuations significantly increase the net worth of commercial banks in
South Africa, but this effect was contrary and no more significant when estimation was
carried out separately on big and small banks. However, macroeconomic factors (inflation,
money supply, and uncertainty) individually handled do not significantly affect the profit of
commercial banks. But inflation and uncertainty significantly increase the net worth of the
small commercial banks in South Africa. This means that South African banks (especially the
small ones) could focus on forecasting and hedging the macroeconomic factors that
determine interest rates rather than the focusing on interest rates themselves. Finally, liquidity
ratio has the highest effect on banks’ net interest margin and net worth relative to the other
bank-specific (internal) factors used in this study.
5.3 RECOMMENDATIONS FOR FURTHER RESEARCH
A number of issues were identified during this research which could be explored further in
the future. These issues were highlighted as follows:
• Include other developing countries and compare the level of the effect of interest rate
fluctuations on profit and net worth’s of commercial banks across countries.
• Include major developed countries and compare the deciding factor of interest rate
fluctuations between developed and developing countries.
• Include non-financial factors, such as ownership structure, number of customers,
physical locations etc, and determine their relationship to banks’ profit and net worth.
Finally, this research has fulfilled its purpose of using econometric methods to investigate the
impact of interest rate fluctuations on profit and net worth of commercial banks in South
Africa, and to identify the macroeconomic factor that most affects interest rate (repo rate)
changes over a period of time. The later objective is meant to inform banks of alternative
macroeconomic factors that could be targeted for hedging interest rate risk.

References
68
REFERENCES
Allen, L. (1988): Determinants of bank interest margins: a note. Journal of Financial and
Quantitative Analysis, 23, pp. 231-235.
Angbazo, L. (1997): Commercial bank net interest margin, default risk, interest rate risk, and
off balance sheet banking. Journal of Banking and Finance, 21, pp. 55-87.
Anthanasoghou, P.P., Delis, M.D., and Staikouras, C. K. (2006): “Determinants of Banks
Profitability in the South Eastern European Region”. Working Paper, MPRA. pp. 1-31.
Basson, N. B. and Ojah, K. (2007): “The Macroeconomic Determinants of Banking
Efficiency: An Empirical Analysis of South Africa against the Rest of the World” Working
Paper, SSRN pp. 1-44
Baum, C. F. (2001): “Stata: The Language of choice for time series analysis?” Stata Journal,
1, pp. 1-18.
Blanchard, O. (2011): Macroeconomics, 5th Edition, Updated Edition, Published by Pearson
Education Inc., New York. pp. 68-70.
Booth, G.G. and Ciner, C. (2001): “The relationship between Nominal Interest Rate and
Expected Inflation: International evidence”. Journal of International Management, 11, pp.
269-280.
Delis, M.D. and Kouretas, G.P. (2011): “Interest Rates and Bank Risk-taking”. Journal of
banking and Finance 35, pp. 840-855.
Demirguc-Kunt, A. and Huizinga, H. (1999): Determinants of Commercial bank Interest
Margins and profitability: Some International Evidence. World Bank Economic Review, 3,
pp. 379-408.
Doliente, J. S. (2003): “The determinants of Bank net interest margin of Southeast Asia”.
Working paper, College of Business Administration, University of Philippines___ Diliman,
pp. 1-43.

References
69
Drukker, David M. (2003): “Testing for serial correlation in linear panel-data models” Stata
Journal 3, pp. 168-177.
Fabozzi, F.J. and Modigliani, F. (2003): Capital Markets; “Institutions and Instruments”, 3rd
Edition, published by Prentice Hall, pp. 35-38.
Falkena, H., Davel, G., Hawkins, P., Llewellyn, D., Luus, C., Masilela, E., et al. (2004).
Competition in South African banking. Task Group Report for the National Treasury and
South African Reserve Bank.
Farlex Financial Dictionary, (2009): Retrieved 13 June 2011. http://financial-
dictionary.thefreedictionary.com/www
Gary, K. (2006): Analysis of Financial Data, Published by John Wiley & Sons Ltd, England.
pp. 49-54.
Goedhuys, D.W. (1982): Money and Banking. Published by McGraw-Hill Book Company
Johannesburg. pp.84-107.
Groot, G.J. (1990): The value of an Interest rate Target for Monetary policy. Research Report
submitted to Faculty of Commerce, Law and management; University of Witwatersrand. pp.
14-16.
Hanweck, G.A. and Kilcollin, T.E. (1984): “Bank Profitability and Interest Rate Risk”.
Journal of Economics and Business 36, pp. 77-84.
Hawkins, P. (2002): Banks and small business; The South African Journal of Economics 70,
pp 241-250.
Hull, J. C. (2003): Risk Management and Financial Institutions; 3rd Edition, published by
Prentice hall pp. 79-90.
Investors’ Guide, Inflation, Interest rate, and the Fed, Retrieved 22 June 2011,
http://www.investorguide.com
Kasman, S., Vardar, G., Tunç, G. (2011): “The impact of interest rate and exchange rate
volatility on banks’ stock returns and volatility” Economic Modelling 28, pp. 1328-1334.

References
70
Kaufman, H. (1986): Interest Rates, the market, and the new financial world, Published by
I.B Tauris & Co. LTD, London, pp.19-144.
Kohn, M. (2004): Financial Institutions and markets, 2nd Edition, Published by oxford
University Press, New York. pp. 28-194.
Laatsch, F. and Klein, D. P. (2003): “Nominal Rates, Real Rates, and Expected Inflation”.
The Quarterly Review of Economics and Finance 43, pp. 405-417.
Livingston, M. (1993): Money and Capital markets, 2nd Edition, Published by Kolb
publishing company, Florida. pp. 27-
Lopez-Espinosa, G., Moreno, F., Perez de Gracia, F. (2011): “Banks’ net interest margin in
the 2000s: A macro-accounting international perspective”. Journal of International Money
and Finance 30, pp. 1214-1233.
Madura, J. (1989): Financial Markets and Institutions. West Publishing Company, New York,
pp. 22-39.
Mayo, H. B. (1989): Finance; An Introduction, The Dryden press, New York. pp. 30-101.
Molyneux, P., Thorton, J. (1992): “Determinants of European Banks Profitability”. Journal
of Banking and Finance, pp. 1173-1175.
Ned Bank (2011), “Guide to the Economy”. June 2011.
Page, S. (1993): Monetary policy in developing countries, Published by Rout ledge, London.
pp. 22-29.
Rose, P.S., and Kolari, J.W. (1995): Financial Institutions; “Understanding and managing
financial services”, 5th Edition, Published by Richard D. Irwin, Chicago. pp. 10-20, 309-419.
Saha, A., Subramarian, V., Basu, J., Mishara, A. K. (2009): “Net worth Exposure to Interest
Rate Risk: An Empirical Analysis of Indian Commercial Banks”. European Journal of
Operational Research 193, pp. 581-590.
Saunders, A., Cornett, M.M. (2003): Financial Institutions Management; “A Risk
Management Approach”. 4th Edition, Published by McGraw-Hill/Irwin, New York. pp. 138-
516.

References
71
Saunders, A., and Schumacher, L., (2000): “The determinants of bank interest rate margins:
An international study. Journal of International Money and Finance, pp. 813-832
Shetty, A.G., Macgrath, F.J., Hammerbacher, I.M. (1995): Finance; “An Integral Global
Approach”. Published by Richard D. Irwin, Inc., New York. pp. 35-40.
Sidabalok, L. R. and, Viverita, C. (2011): “The Determinants of Net Interest Margin in the
Indonesian Banking Sector” Working Paper, SSRN. pp. 1-23.
South African Reserve Bank (2011), Quarterly bulletin, March 2011, pp. 38-71.
South African Reserve Bank (2009), Monetary Policy Review, November 2009, pp. 18-240.
South African Reserve Bank (2007). “Interest Rates and how they work”. The Fact Sheet,
July 2007, pp. 2-4.
South African Reserve Bank (2011). “The South African Reserve Bank System of
Accommodation”. The Fact Sheet, March 2011, pp. 1-4.
Sufian, F., and Habibullah, M.S. (2009): “Determinants of bank profitability in a developing
economy: Empirical evidence from Bangladesh”. Journal of Business Economics and
Management, pp. 207-217.
Wooldridge, J.M. (2006): Introductory Econometrics “A modern Approach, 3rd Edition,
Published by Thomson South-Western, Boulevard. pp. 454-460.
Wong, K.P., (1997): “The determinants of bank Interest margin under credit and Interest Rate
Risk”. Journal of Banking and Finance, pp. 251-271.

Appendices
72
APPENDICES
APPENDIX A FINANCIAL DATA FROM BANKS’ ANNUAL REPORT
Obser- vations Bank year
Profit (%)
Net worth (R mill)
Non-performing
Loan (%) Competition
Liquidity Ratio (%)
Capital Ratio (%)
1 1 2001 3.86 11062.00 1.05 0.95 15.18 10.702 1 2002 4.13 11744.00 0.93 1.01 17.33 11.303 1 2003 3.46 15237.00 0.72 0.92 11.22 12.504 1 2004 2.80 18197.00 0.36 0.86 9.86 13.405 1 2005 2.66 20376.00 0.50 0.82 19.70 12.506 1 2006 2.57 25885.00 0.63 0.86 17.25 12.407 1 2007 3.07 32300.00 1.02 0.86 12.61 12.508 1 2008 2.87 38288.00 2.09 0.82 14.26 12.209 1 2009 2.58 43207.00 2.13 0.83 17.14 14.10
10 1 2010 2.55 47614.00 1.34 0.84 15.74 14.9011 2 2001 4.12 9682.00 0.82 0.99 6.78 10.7012 2 2002 3.76 10616.00 1.68 0.94 7.91 10.2013 2 2003 3.44 12610.00 0.95 1.15 8.43 11.5014 2 2004 3.42 15849.00 0.82 1.16 8.10 12.3015 2 2005 3.52 20622.00 0.47 1.13 6.33 11.7016 2 2006 3.51 28726.00 0.40 1.03 11.39 12.3017 2 2007 3.51 35528.00 0.48 0.97 21.76 12.5018 2 2008 3.21 44994.00 1.04 0.98 16.29 14.0019 2 2009 3.96 47418.00 1.62 1.02 13.17 14.7020 2 2010 3.31 52630.00 1.10 1.02 10.34 14.8021 3 2001 3.38 11796.00 1.04 1.08 11.01 11.6022 3 2002 2.51 12470.00 0.68 1.05 10.70 15.7023 3 2003 2.55 16048.00 0.91 0.96 8.90 12.2024 3 2004 2.30 20127.00 0.67 1.03 10.08 12.5025 3 2005 2.96 24354.00 0.41 1.11 14.35 13.3026 3 2006 3.20 28057.00 0.47 1.16 17.39 11.4027 3 2007 3.47 33132.00 0.58 1.25 9.95 11.7028 3 2008 3.31 38281.00 1.10 1.32 7.25 13.1029 3 2009 3.07 39759.00 1.49 1.25 7.08 15.6030 3 2010 3.05 38400.00 1.40 1.20 6.92 14.86

Appendices
73
Obser- vations Bank year
Profit (%)
Net worth (R mill)
Non-performing
Loan (%) Competition
Liquidity Ratio (%)
Capital Ratio (%)
31 4 2001 4.17 7113.70 0.91 1.20 7.78 9.40
32 4 2002 3.21 7486.00 0.65 1.03 9.42 10.00
33 4 2003 3.30 10321.00 0.73 1.19 10.06 10.30
34 4 2004 3.43 12343.00 0.22 1.28 6.87 13.50
35 4 2005 2.83 16266.00 0.25 1.24 6.93 11.10
36 4 2006 2.87 19466.00 0.52 1.16 25.10 12.00
37 4 2007 2.94 24949.00 0.74 1.25 22.09 11.40
38 4 2008 2.32 29290.00 1.09 1.27 22.36 12.28
39 4 2009 2.24 32258.00 1.91 1.20 18.77 13.11
40 4 2010 2.21 35625.00 1.25 1.20 20.56 14.00
41 5 2001 1.50 6141.00 0.67 3.41 36.70 19.05
42 5 2002 1.97 8390.00 0.45 2.96 30.52 19.60
43 5 2003 1.49 6069.00 1.26 4.02 36.19 19.40
44 5 2004 1.42 7762.00 0.36 4.00 30.53 19.80
45 5 2005 1.90 8120.00 0.24 4.11 30.22 19.50
46 5 2006 2.09 8812.00 -0.02 4.13 32.93 16.12
47 5 2007 2.06 10056.00 0.12 4.02 34.70 14.14
48 5 2008 2.44 12960.00 0.40 4.31 31.67 14.30
49 5 2009 2.68 14195.00 0.58 3.75 27.51 14.19
50 5 2010 2.27 16454.00 0.67 3.51 34.91 15.53
51 6 2001 3.49 358.00 1.19 30.49 3.07 10.86
52 6 2002 4.72 677.70 1.97 22.94 7.60 12.10
53 6 2003 4.96 909.80 1.93 22.68 3.31 12.34
54 6 2004 3.82 1075.00 1.54 19.54 3.93 10.22
55 6 2005 3.90 1013.70 1.51 21.46 3.93 10.20
56 6 2006 4.32 1522.80 0.56 21.33 5.17 10.20
57 6 2007 4.33 1906.70 0.74 18.89 6.74 10.47
58 6 2008 4.52 2695.20 1.13 18.91 6.62 10.56
59 6 2009 4.14 3360.30 1.53 13.93 7.31 11.08
60 6 2010 4.09 3761.00 1.90 12.47 8.13 11.20

Appendices
74
Obser- vations Bank year
Profit (%)
Net worth (R mill)
Non-performing
Loan (%) Competition
Liquidity Ratio (%)
Capital Ratio (%)
61 7 2001 21.10 1213.50 -2.02 34.54 8.89 34.10
62 7 2002 20.23 1874.60 5.19 32.64 57.19 31.43
63 7 2003 24.74 2088.10 4.85 45.87 74.79 40.80
64 7 2004 31.16 1892.00 8.78 45.8 148.91 34.70
65 7 2005 32.93 2076.00 8.48 54.35 86.31 34.30
66 7 2006 36.10 2246.00 7.67 55.63 109.75 31.20
67 7 2007 36.98 2341.00 7.73 49.75 288.99 28.50
68 7 2008 21.61 2463.00 8.63 41.91 122.33 25.50
69 7 2009 17.54 3217.00 9.19 30.03 266.59 30.10
70 7 2010 15.18 8979.00 7.40 20.15 521.46 28.90
71 8 2001 5.11 1714.90 _ 51.76 52.19 50.21
72 8 2002 13.06 2088.70 _ 48.41 34.67 46.65
73 8 2003 16.85 1183.50 _ 113.3 206.70 45.62
74 8 2004 18.68 365.20 _ 138.22 _ 15.32
75 8 2005 2.29 608.20 _ 129.88 _ 21.77
76 8 2006 2.70 1268.00 _ 253.76 379.23 69.17
77 8 2007 3.63 3947.50 _ 104.39 261.61 71.76
78 8 2008 2.11 5069.10 _ 50.89 _ 35.68
79 8 2009 2.73 4619.00 _ 48.09 74.79 32.70
80 8 2010 2.91 5210.40 _ 47.26 498.15 35.48
81 9 2001 4.15 507.50 3.09 47.75 17.04 _
82 9 2002 4.58 19.50 24.25 94.73 21.07 _
83 9 2003 3.54 171.90 -1.33 132.11 42.73 11.80
84 9 2004 3.86 515.60 0.28 120.72 62.75 39.20
85 9 2005 8.21 566.60 -1.34 106.06 53.38 34.50
86 9 2006 7.54 682.80 -0.47 104.18 58.18 30.10
87 9 2007 7.62 853.40 0.19 121.66 44.07 26.80
88 9 2008 8.98 1296.80 0.19 121.90 45.91 27.30
89 9 2009 6.76 1465.20 0.25 116.55 39.84 25.50
90 9 2010 6.45 1566.80 0.09 110.81 43.92 23.80
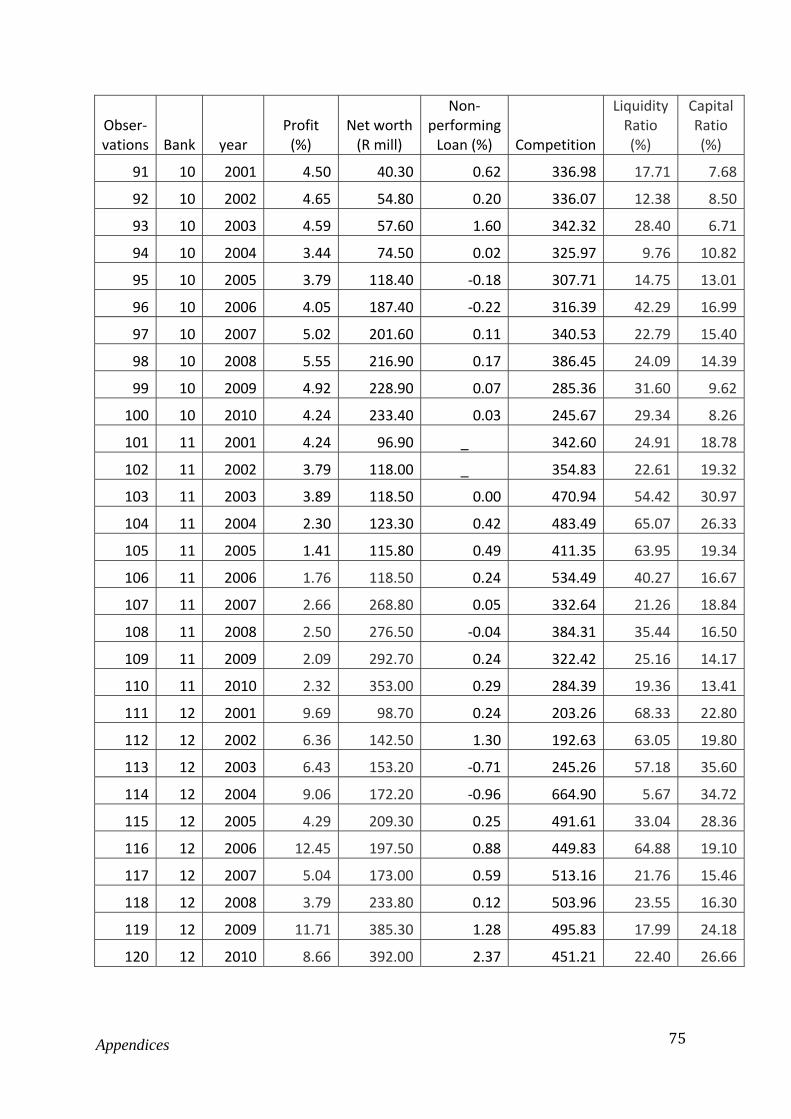
Appendices
75
Obser- vations Bank year
Profit (%)
Net worth (R mill)
Non-performing
Loan (%) Competition
Liquidity Ratio (%)
Capital Ratio (%)
91 10 2001 4.50 40.30 0.62 336.98 17.71 7.68
92 10 2002 4.65 54.80 0.20 336.07 12.38 8.50
93 10 2003 4.59 57.60 1.60 342.32 28.40 6.71
94 10 2004 3.44 74.50 0.02 325.97 9.76 10.82
95 10 2005 3.79 118.40 -0.18 307.71 14.75 13.01
96 10 2006 4.05 187.40 -0.22 316.39 42.29 16.99
97 10 2007 5.02 201.60 0.11 340.53 22.79 15.40
98 10 2008 5.55 216.90 0.17 386.45 24.09 14.39
99 10 2009 4.92 228.90 0.07 285.36 31.60 9.62
100 10 2010 4.24 233.40 0.03 245.67 29.34 8.26
101 11 2001 4.24 96.90 _ 342.60 24.91 18.78
102 11 2002 3.79 118.00 _ 354.83 22.61 19.32
103 11 2003 3.89 118.50 0.00 470.94 54.42 30.97
104 11 2004 2.30 123.30 0.42 483.49 65.07 26.33
105 11 2005 1.41 115.80 0.49 411.35 63.95 19.34
106 11 2006 1.76 118.50 0.24 534.49 40.27 16.67
107 11 2007 2.66 268.80 0.05 332.64 21.26 18.84
108 11 2008 2.50 276.50 -0.04 384.31 35.44 16.50
109 11 2009 2.09 292.70 0.24 322.42 25.16 14.17
110 11 2010 2.32 353.00 0.29 284.39 19.36 13.41
111 12 2001 9.69 98.70 0.24 203.26 68.33 22.80
112 12 2002 6.36 142.50 1.30 192.63 63.05 19.80
113 12 2003 6.43 153.20 -0.71 245.26 57.18 35.60
114 12 2004 9.06 172.20 -0.96 664.90 5.67 34.72
115 12 2005 4.29 209.30 0.25 491.61 33.04 28.36
116 12 2006 12.45 197.50 0.88 449.83 64.88 19.10
117 12 2007 5.04 173.00 0.59 513.16 21.76 15.46
118 12 2008 3.79 233.80 0.12 503.96 23.55 16.30
119 12 2009 11.71 385.30 1.28 495.83 17.99 24.18
120 12 2010 8.66 392.00 2.37 451.21 22.40 26.66

Appendices
76
Obser- vations Bank year
Profit (%)
Net worth (R mill)
Non-performing
Loan (%) Competition
Liquidity Ratio (%)
Capital Ratio (%)
121 13 2001 5.45 30.70 2.88 431.59 32.12 17.00
122 13 2002 6.13 25.80 1.00 462.11 26.08 15.90
123 13 2003 6.38 24.10 1.22 575.18 23.25 11.22
124 13 2004 5.62 46.00 -0.56 539.84 26.86 16.39
125 13 2005 5.04 54.07 0.02 557.38 27.86 16.14
126 13 2006 5.11 65.28 0.29 563.90 31.36 14.32
127 13 2007 5.98 85.72 0.12 503.71 7.95 12.09
128 13 2008 5.48 185.00 0.40 533.13 17.65 16.54
129 13 2009 4.35 180.28 0.42 540.01 9.42 13.20
130 13 2010 4.44 199.21 0.37 557.43 4.02 18.15
131 14 2001 6.06 11.50 0.76 866.57 69.94 _
132 14 2002 7.01 17.30 0.62 830.07 76.29 23.95
133 14 2003 5.81 17.10 3.73 1010.02 74.56 21.32
134 14 2004 4.60 20.30 0.31 962.89 75.22 21.45
135 14 2005 7.20 23.10 0.00 862.71 84.56 19.44
136 14 2006 13.13 29.70 0.00 962.79 78.29 21.01
137 14 2007 15.06 39.20 0.20 1070.52 79.67 24.09
138 14 2008 17.76 51.30 0.06 116.83 82.64 17.56
139 14 2009 14.65 53.80 0.00 904.33 82.10 16.44
140 14 2010 11.82 57.90 0.12 869.90 75.64 16.76
141 15 2001 4.54 48.00 1.47 635.90 25.81 13.90
142 15 2002 4.01 50.30 1.16 734.68 25.99 12.40
143 15 2003 5.43 59.00 1.25 979.40 20.08 13.60
144 15 2004 4.04 82.30 0.25 889.16 19.40 16.70
145 15 2005 3.60 95.40 0.24 835.30 19.14 13.20
146 15 2006 3.52 43.20 0.23 899.84 18.35 8.36
147 15 2007 3.79 47.70 0.41 934.01 20.07 7.76
148 15 2008 3.97 55.20 0.46 1097.33 16.10 8.38
149 15 2009 3.92 62.00 0.50 928.18 14.50 16.20
150 15 2010 2.60 63.70 0.42 894.34 16.57 15.70

Appendices
77
APPENDIX B FINANCIAL DATA FROM SOUTH AFRICAN RESERVE
BANK
year Repo Rate
(%) Prime Rate
(%) Deposit Rate (%) CPI (%)
Money Supply (%)
Uncertainty (%)
2001 10.92 13.35 9.97 6.60 16.44 0.76
2002 12.25 15.60 11.72 9.30 18.07 0.29
2003 11.46 15.16 10.36 6.80 12.88 0.29
2004 7.79 11.31 7.28 4.30 13.13 0.76
2005 7.13 10.64 6.69 3.90 20.45 1.04
2006 7.67 11.14 7.49 4.60 22.54 0.45
2007 9.67 13.08 9.82 6.40 23.59 0.21
2008 11.63 15.12 11.44 13.60 14.79 0.91
2009 8.21 11.80 8.75 2.20 1.78 3.59
2010 6.33 9.91 6.75 10.10 6.92 2.91

Appendices
78
APPENDIX C DEFENCE PANEL STATUS (APPROVAL OF TITLE)