Market concentration and effectiveness of co-creation (2011)
62
Power to the People! Does market concentration play a role in the effectiveness of co-creation?
-
Upload
piotr-bakker -
Category
Marketing
-
view
239 -
download
2
Transcript of Market concentration and effectiveness of co-creation (2011)

Power to the People!Does market concentration play a role in the effectiveness of co-creation?

What’s coming
1.Background 2.Present study 3.Findings 4.Implications
1

1.Background.
2

What makes co-creation effective?
3

What is co-creation?
4

Company-driven NPD
5

Co-creation: user-driven NPD
6

Success stories
Linux Apache Firefox
7

Success stories
8

Success stories
9

Non-participating users
10

Positive effects
Customer orientation
Innovation ability
11

Negative effects
Design complexity
User expertise
12

Market concentration
13

Market concentration
high concentration low concentration
14

Market control
When crypto-monopoly is assumed it no longer follows that any of the old goals of social efficiency are realised.
“ “15
John K. Galbraith, American Capitalism (1952, p.43)

Market control
Prices Innovation
Technical advance Culture
16

Attitude change: positive
17

Attitude change: negative
18

Consumer resistance
19

Consumer resistance
20

Consumer resistance
21

Consumer resistance
22
Research question
Does market concentration play a role in the effectiveness of co-creation?
23

2.Present study.
24

26
high concentration
Effects of market concentration
25co-creation

low concentration
26
Effects of market concentration
26co-creation

Hypotheses
H0: Consumers prefer user-driven value creation strategies to company-driven ones.
H1: Preference for a user-driven value creation strategy is associated with market concentration.
27

Conceptual model
market concentration
value creation strategy
behavioural intentions
28

Methodology
29

Industry
software for video editing30

VS
2 × 2 between subjects design
company-driven user-driven31

2 × 2 between subjects design
high concentration low concentration
VS VS
32

Functionality & Innovativeness
33
6.4
5.7

Functionality & Innovativeness
34
5.7
6.4

Reliability & Usability
35
5.2
5.9

Reliability & Usability
36
5.9
5.2

?
Which option will they choose?
company-driven user-driven37

3.Findings.
38

Participants
600 invitations
162 usable responses
No reward for participation
39
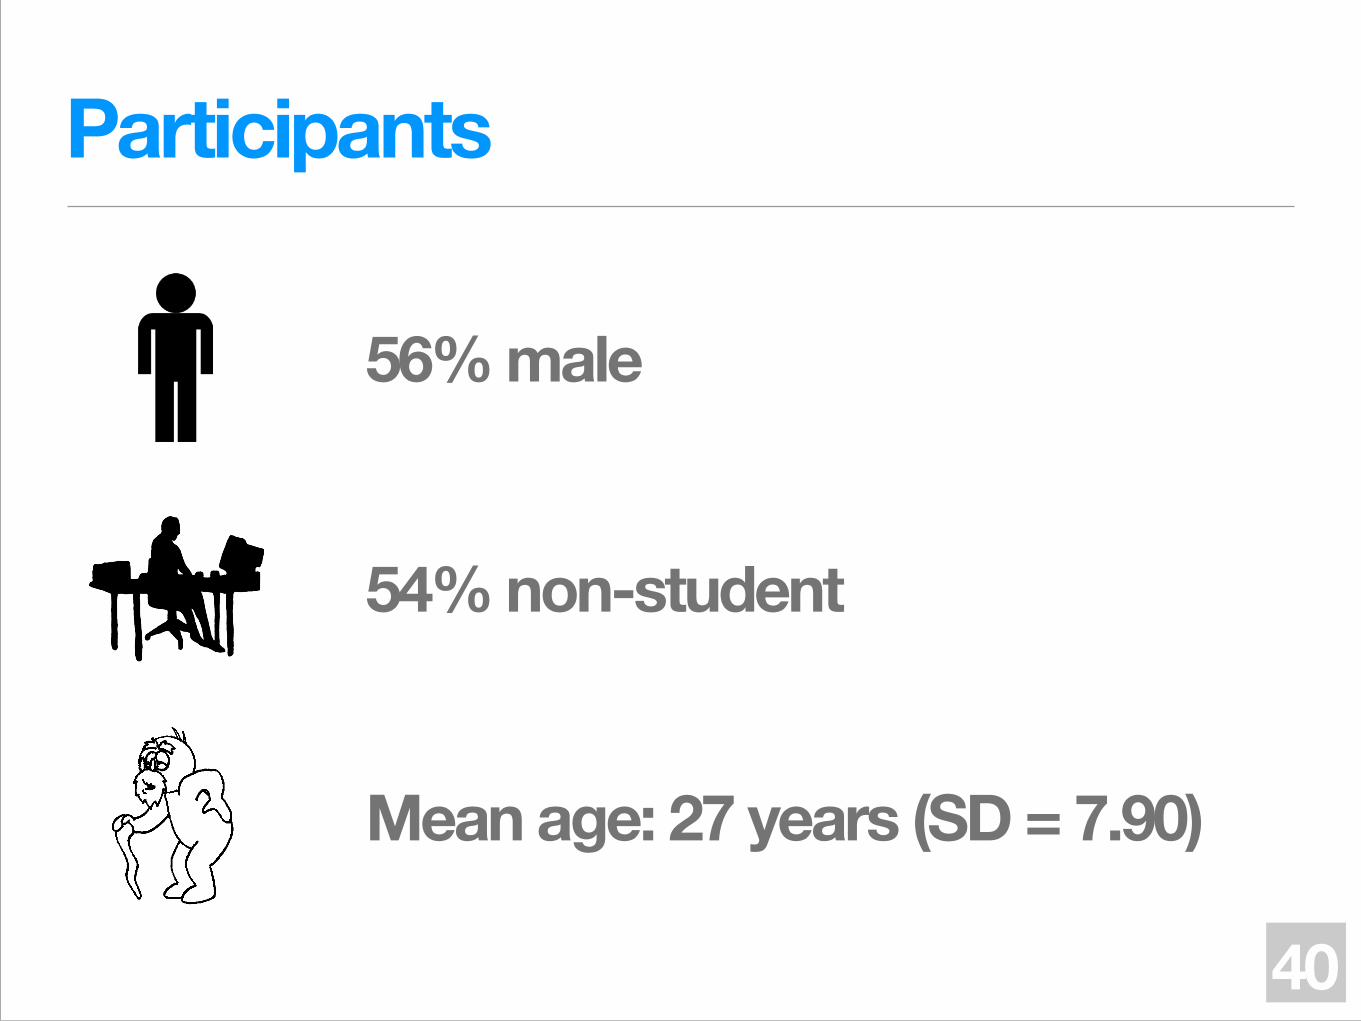
Mean age: 27 years (SD = 7.90)
Participants
56% male
54% non-student
40

Manipulation and control checks
1.Type of value creation strategy 2.Level of market concentration 3.Differences in attribute rating
✔
41
1.Involvement 2.Product knowledge 3.Expertise
✔

So, did market concentration play a role?
42

Choice shares by market concentration
0%
20%
40%
60%
80%
100%
Low concentration High concentration
31,0%28,2%
69,0%71,8%
User-drivenCompany-driven
Market concentration and preference for type of value creation strategy
43Company type choice by market concentration: χ2(1) = 0.49, p = .48

Choice preference
0
1
2
3
4
5
6
7
Low concentration High concentration
4,72 4,83
3,05 3,28
User-drivenCompany-driven
Market concentration and preference for type of value creation strategy
44Company type preference by market concentration: F = 0.40, p = .53; measured on a seven-point
Lykert type scale (1 = Company "A" and 7 = Company "B")

Option “1” adoption likelihood
0
1
2
3
4
5
6
7
Low concentration High concentration
4,11 3,88
5,214,52
User-drivenCompany-driven
Market concentration and preference for type of value creation strategy
45Company type preference by market concentration: F = 3.13, p = .08; measured on a seven-point
Lykert-type scale (1 = Very unlikely and 7 = Very likely)

Option “2” adoption likelihood
0
1
2
3
4
5
6
7
Low concentration High concentration
5,03 4,85
3,87 4,15
User-drivenCompany-driven
Market concentration and preference for type of value creation strategy
46Company type preference by market concentration: F = 0.41, p = .84; measured on a seven-point
Lykert-type scale (1 = Very unlikely and 7 = Very likely)

H1: Preference for a user-driven value creation strategy is associated with market concentration.
47

Value creation strategy and preference
48
Frequency of choice
0%
20%
40%
60%
80%
100%
32,1%
67,9%
User-drivenCompany-driven

Adoption likelihood
0
1
2
3
4
5
6
7
3,544,88
User-drivenCompany-driven
Value creation strategy and preference
49Company type adoption likelihood: t(161) = 3.90, p < .001; measured on a seven-point Lykert-type
scale (1 = Very unlikely and 7 = Very likely)

Value creation strategy and preference
50Relative contribution of company type description and performance attribute ratings: χ2 = 32.10, p < .001.
Contriubtion to choice preference (R-statistic)
Company type description
Functionality & Innovativeness
Reliability & Usability
0,0 0,2 0,4 0,6 0,8 1,0
0,16
0,14
0,30

Frequency of reasoning behind preference
31%
4%4%
39%
23%Customer orientationTarget segmentDiversityNumbersExpertise
Reasons for co-creation preference
51
Perceived expertise
Perceived Innovation ability
Perceived customer orientation

Frequency of reasoning behind preference
31%
4%4%
39%
23%Customer orientationTarget segmentDiversityNumbersExpertise
Reasons for co-creation preference
52
Perceived expertise
Perceived customer orientation
Frequency of reasoning behind preference
31%
4%4%
39%
23%Customer orientationTarget segmentDiversityNumbersExpertise
Perceived Innovation ability

H0: Consumers prefer user-driven value creation strategies to company-driven ones
53

4.Implications.
54

Theory
1.Generalisability 2.Counter mediation 3.Consumer resistance
55

Practice
1.Focus: A.Novice users B.Target segment
2.Avoid: A.Market structure B.Freedom of choice
56

Limitations
Like the physical, the psychical is not necessarily in reality what it appears to us to be.
“ “57
Sigmund Freud, “The Unconscious” in The Freud Reader (1989, p.577)

Limitations
1.Student sample 2.Atypical product descriptions 3.Experimental design 4.Polar opposites
58

Future research
1.Wider demographic 2.More product categories 3.Different levels of empowerment 4.B2B
59

Conclusion
1.First study 2.Inconclusive evidence 3.Unsolved mysteries 4.More research needed
60

Thank you!