FX Weekly Commentary July 17 - July 23 2011 - Elite Global Trading
Upload
branden-evansCategory
view
223download
1
Market Commentary
FX alpha modelling
June 2008
Dr. Jessica JamesManaging Director, Citi

2 Market Commentary2
Overview
Introduction to FX alpha modelling
FX models – an example
– Trend
– The art of model combination
– Trend + Option selling
3 Market Commentary3
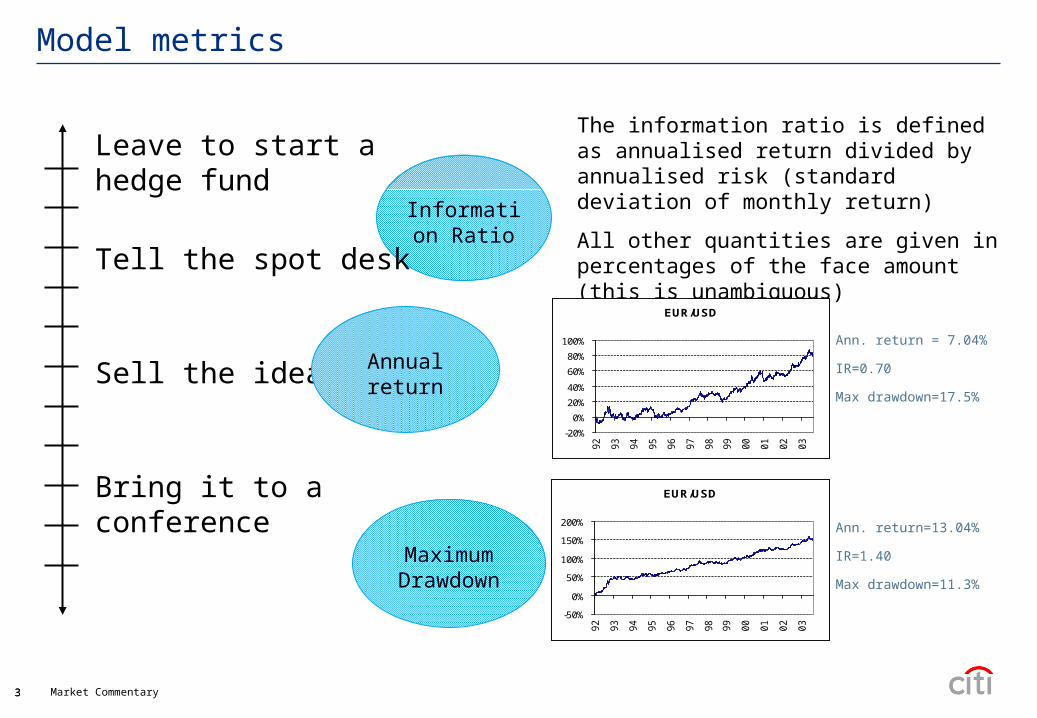
Model metrics
Leave to start a hedge fund
Information Ratio
The information ratio is defined as annualised return divided by annualised risk (standard deviation of monthly return)
All other quantities are given in percentages of the face amount (this is unambiguous)
EUR/USD
-20%
0%
20%
40%
60%
80%
100%
92
93
94
95
96
97
98
99
00
01
02
03
EUR/USD
-50%
0%
50%
100%
150%
200%
92
93
94
95
96
97
98
99
00
01
02
03
Ann. return = 7.04%
IR=0.70
Max drawdown=17.5%
Ann. return=13.04%
IR=1.40
Max drawdown=11.3%
Tell the spot desk
Sell the idea
Bring it to a conference
Annual return
Maximum Drawdown
Market Commentary
Trend-option model
Example of a switch model
5 Market Commentary5
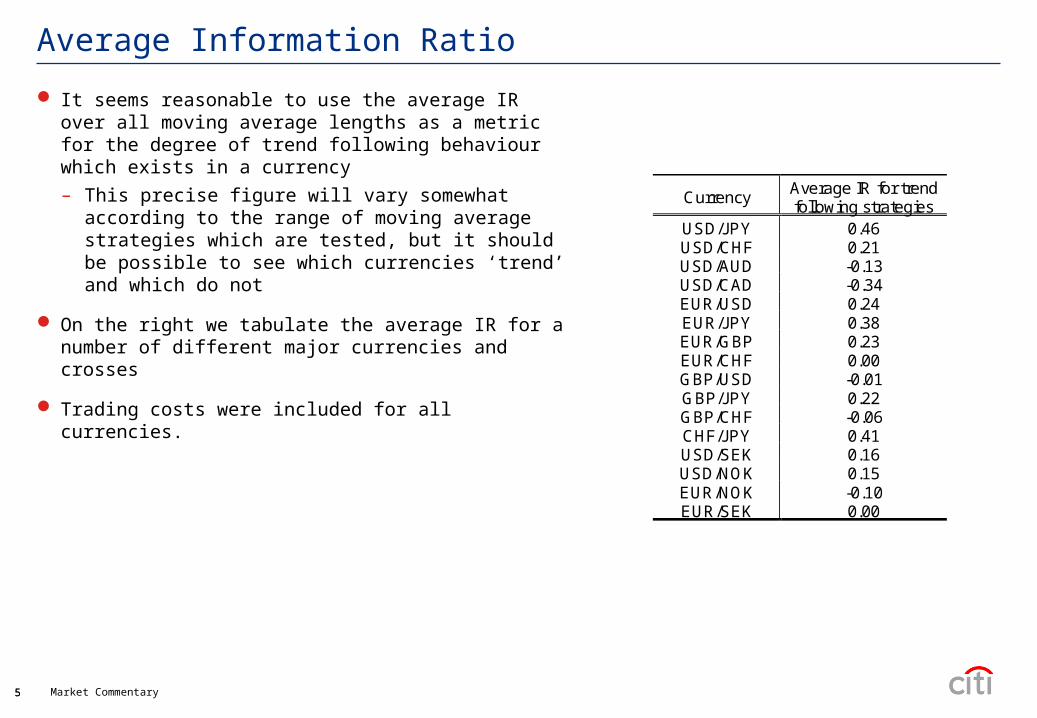
Average Information Ratio
It seems reasonable to use the average IR over all moving average lengths as a metric for the degree of trend following behaviour which exists in a currency
– This precise figure will vary somewhat according to the range of moving average strategies which are tested, but it should be possible to see which currencies ‘trend’ and which do not
On the right we tabulate the average IR for a number of different major currencies and crosses
Trading costs were included for all currencies.
Currency Average IR for trend following strategies
USD/JPY 0.46 USD/CHF 0.21 USD/AUD -0.13 USD/CAD -0.34 EUR/USD 0.24 EUR/JPY 0.38 EUR/GBP 0.23 EUR/CHF 0.00 GBP/USD -0.01 GBP/JPY 0.22 GBP/CHF -0.06 CHF/JPY 0.41 USD/SEK 0.16 USD/NOK 0.15 EUR/NOK -0.10 EUR/SEK 0.00
6 Market Commentary6
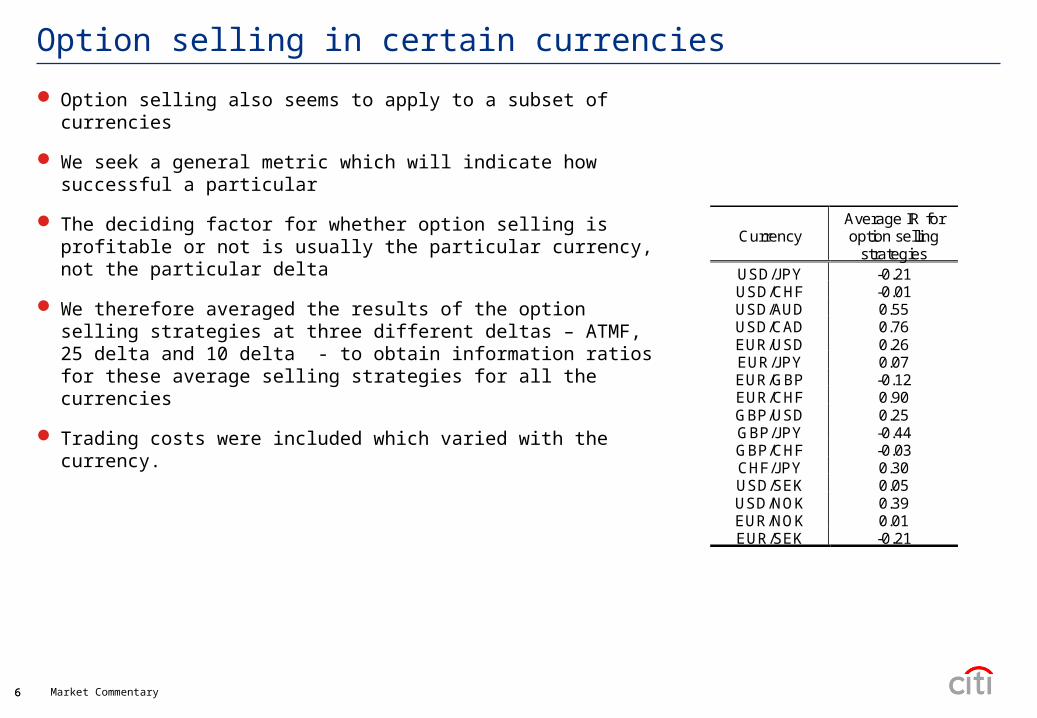
Option selling in certain currencies
Option selling also seems to apply to a subset of currencies
We seek a general metric which will indicate how successful a particular
The deciding factor for whether option selling is profitable or not is usually the particular currency, not the particular delta
We therefore averaged the results of the option selling strategies at three different deltas – ATMF, 25 delta and 10 delta - to obtain information ratios for these average selling strategies for all the currencies
Trading costs were included which varied with the currency.
Currency Average IR for option selling
strategies USD/JPY -0.21 USD/CHF -0.01 USD/AUD 0.55 USD/CAD 0.76 EUR/USD 0.26 EUR/JPY 0.07 EUR/GBP -0.12 EUR/CHF 0.90 GBP/USD 0.25 GBP/JPY -0.44 GBP/CHF -0.03 CHF/JPY 0.30 USD/SEK 0.05 USD/NOK 0.39 EUR/NOK 0.01 EUR/SEK -0.21
7 Market Commentary7
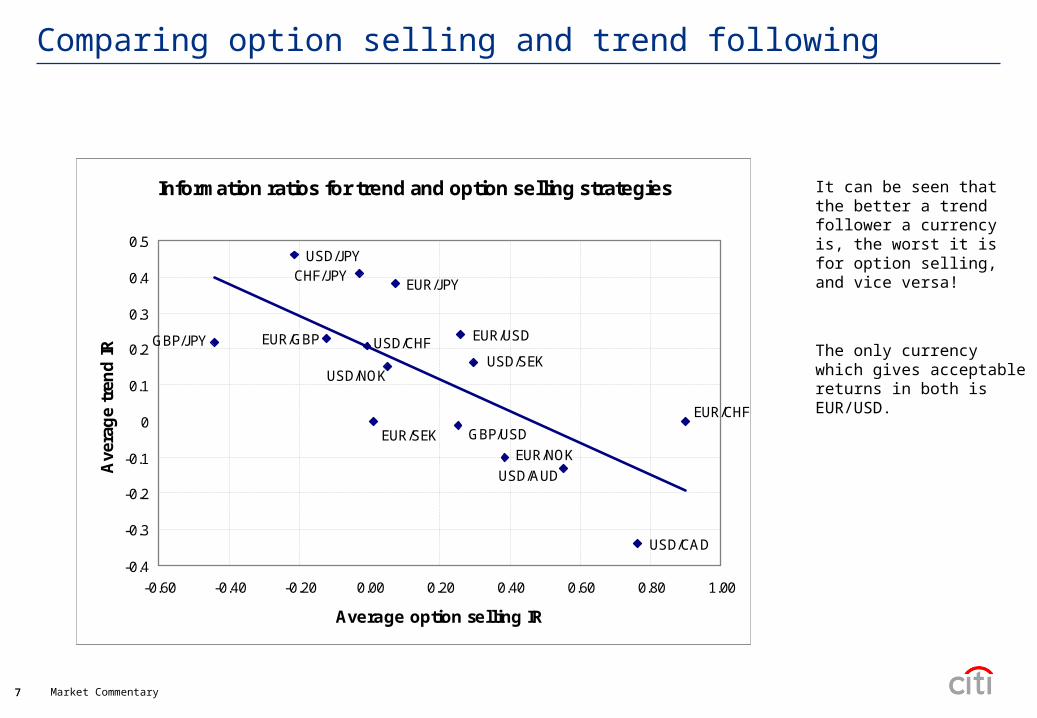
Comparing option selling and trend following
Information ratios for trend and option selling strategies
CHF/JPY
GBP/USD
USD/NOK
USD/CHFEUR/GBPGBP/JPY EUR/USD
EUR/JPY
USD/SEK
USD/JPY
EUR/NOK
EUR/CHF
EUR/SEK
USD/CAD
USD/AUD
-0.4
-0.3
-0.2
-0.1
0
0.1
0.2
0.3
0.4
0.5
-0.60 -0.40 -0.20 0.00 0.20 0.40 0.60 0.80 1.00
Average option selling IR
Ave
rag
e tr
end
IR
It can be seen that the better a trend follower a currency is, the worst it is for option selling, and vice versa!
The only currency which gives acceptable returns in both is EUR/USD.

8 Market Commentary8
The best of trends and options
It seems that these strategy types are mutual opposites
but.... some currencies which are in general non trending have trending ‘periods’
some currencies which don’t do well overall selling vol have profitable option selling periods.
We wish to find a ‘switch’ to go from one strategy type to the other
An obvious one to try is volatility
9 Market Commentary9
Which options? Which vol switch? Which trend?
We do not wish to get hurt by the switch to trend when holding written options
Thus short options are best
Weekly options are those which we have the best data for
Weekly vol however is too date-affected to use as a switch
But we find that all of 1, 2, 3, 6 month vols work well!
Overall, the exact trend strategy has little impact on results.
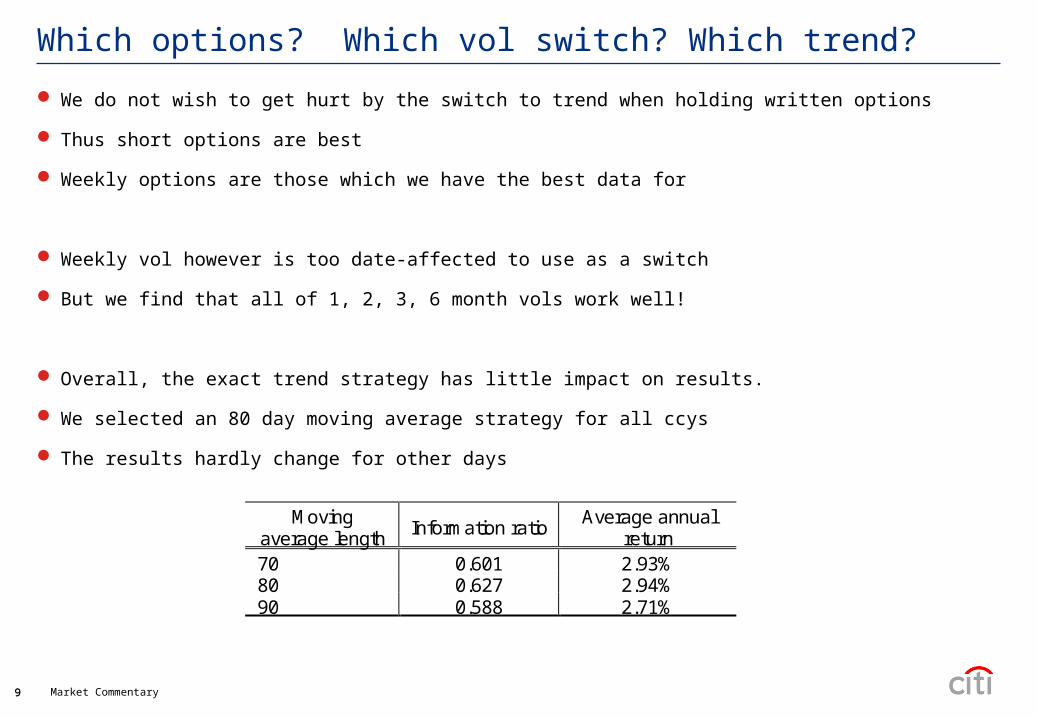
We selected an 80 day moving average strategy for all ccys
The results hardly change for other days
Moving average length
Information ratio Average annual
return 70 0.601 2.93% 80 0.627 2.94% 90 0.588 2.71%
10 Market Commentary10
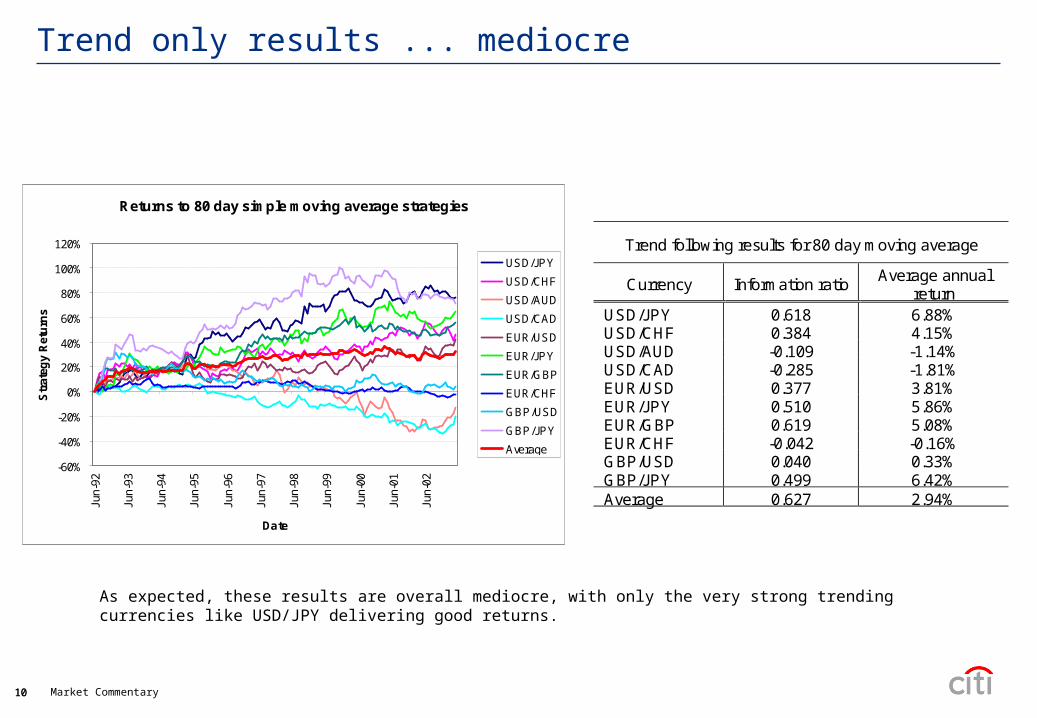
Trend only results ... mediocre
Returns to 80 day simple moving average strategies
-60%
-40%
-20%
0%
20%
40%
60%
80%
100%
120%
Jun-
92
Jun-
93
Jun-
94
Jun-
95
Jun-
96
Jun-
97
Jun-
98
Jun-
99
Jun-
00
Jun-
01
Jun-
02
Date
Str
ateg
y R
etu
rns
USD/JPY
USD/CHF
USD/AUD
USD/CAD
EUR/USD
EUR/JPY
EUR/GBP
EUR/CHF
GBP/USD
GBP/JPY
Average
As expected, these results are overall mediocre, with only the very strong trending currencies like USD/JPY delivering good returns.
Trend following results for 80 day moving average
Currency Information ratio Average annual
return USD/JPY 0.618 6.88% USD/CHF 0.384 4.15% USD/AUD -0.109 -1.14% USD/CAD -0.285 -1.81% EUR/USD 0.377 3.81% EUR/JPY 0.510 5.86% EUR/GBP 0.619 5.08% EUR/CHF -0.042 -0.16% GBP/USD 0.040 0.33% GBP/JPY 0.499 6.42% Average 0.627 2.94%
11 Market Commentary11
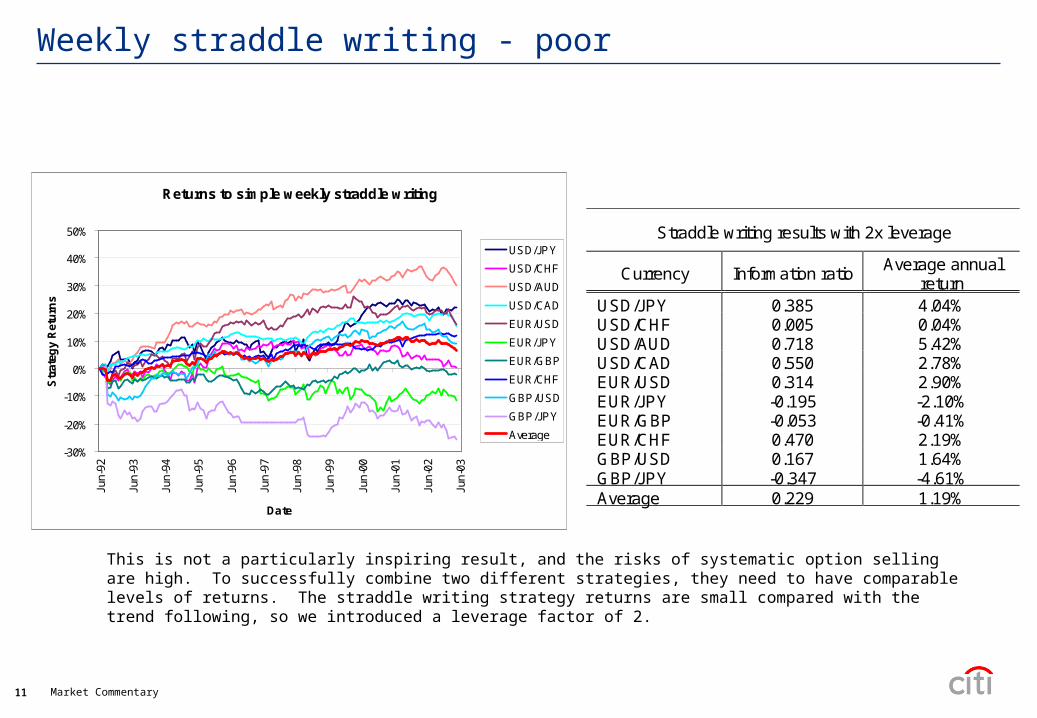
Weekly straddle writing - poor
Returns to simple weekly straddle writing
-30%
-20%
-10%
0%
10%
20%
30%
40%
50%
Jun-
92
Jun-
93
Jun-
94
Jun-
95
Jun-
96
Jun-
97
Jun-
98
Jun-
99
Jun-
00
Jun-
01
Jun-
02
Jun-
03
Date
Str
ateg
y R
etu
rns
USD/JPY
USD/CHF
USD/AUD
USD/CAD
EUR/USD
EUR/JPY
EUR/GBP
EUR/CHF
GBP/USD
GBP/JPY
Average
Straddle writing results with 2x leverage
Currency Information ratio Average annual
return USD/JPY 0.385 4.04% USD/CHF 0.005 0.04% USD/AUD 0.718 5.42% USD/CAD 0.550 2.78% EUR/USD 0.314 2.90% EUR/JPY -0.195 -2.10% EUR/GBP -0.053 -0.41% EUR/CHF 0.470 2.19% GBP/USD 0.167 1.64% GBP/JPY -0.347 -4.61% Average 0.229 1.19%
This is not a particularly inspiring result, and the risks of systematic option selling are high. To successfully combine two different strategies, they need to have comparable levels of returns. The straddle writing strategy returns are small compared with the trend following, so we introduced a leverage factor of 2.
12 Market Commentary12
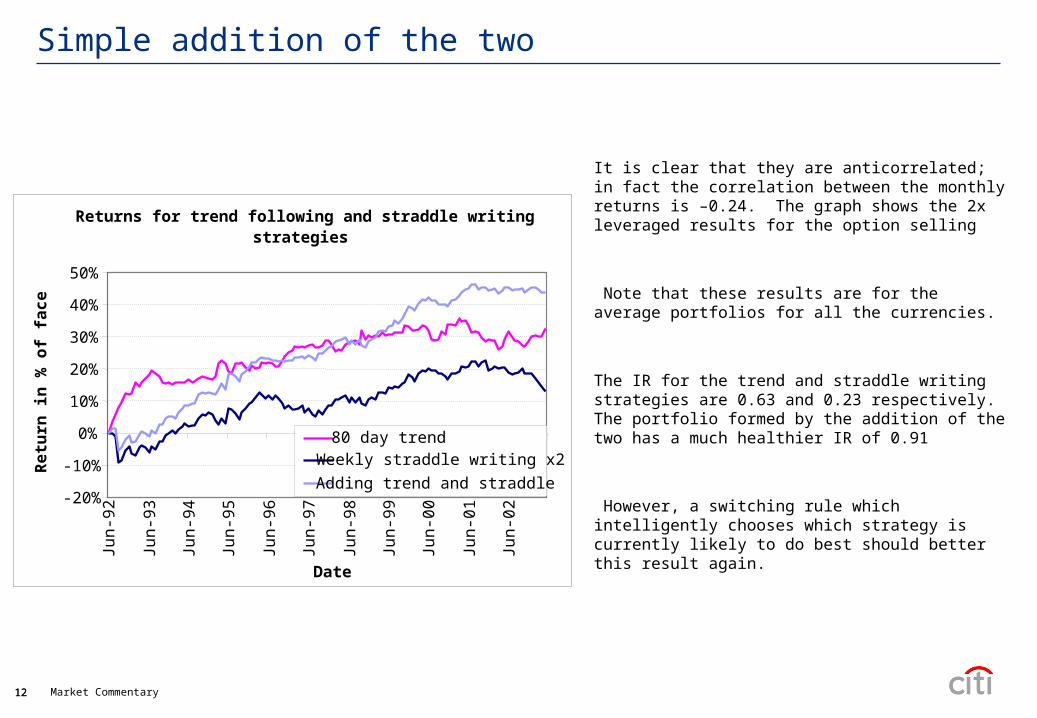
Simple addition of the two
Returns for trend following and straddle writing strategies
-20%
-10%
0%
10%
20%
30%
40%
50%
Jun
-92
Jun
-93
Jun
-94
Jun
-95
Jun
-96
Jun
-97
Jun
-98
Jun
-99
Jun
-00
Jun
-01
Jun
-02
Date
Re
turn
in
% o
f fa
ce
80 day trendWeekly straddle writing x2
Adding trend and straddle
It is clear that they are anticorrelated; in fact the correlation between the monthly returns is –0.24. The graph shows the 2x leveraged results for the option selling
Note that these results are for the average portfolios for all the currencies.
The IR for the trend and straddle writing strategies are 0.63 and 0.23 respectively. The portfolio formed by the addition of the two has a much healthier IR of 0.91
However, a switching rule which intelligently chooses which strategy is currently likely to do best should better this result again.
13 Market Commentary13
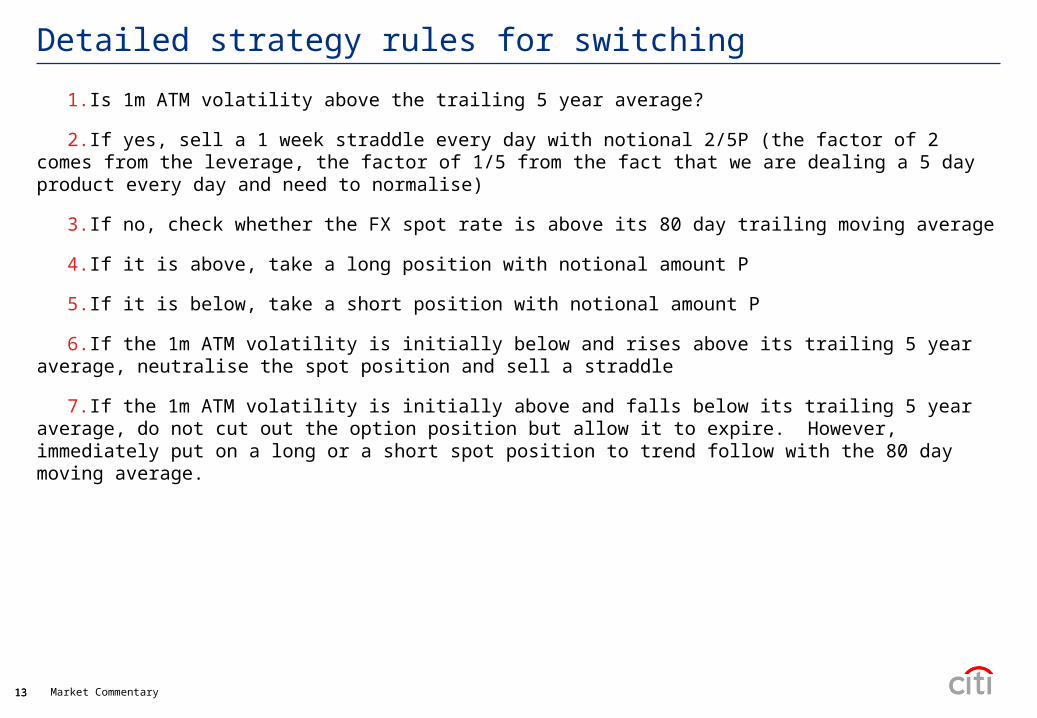
Detailed strategy rules for switching
1.Is 1m ATM volatility above the trailing 5 year average?
2.If yes, sell a 1 week straddle every day with notional 2/5P (the factor of 2 comes from the leverage, the factor of 1/5 from the fact that we are dealing a 5 day product every day and need to normalise)
3.If no, check whether the FX spot rate is above its 80 day trailing moving average
4.If it is above, take a long position with notional amount P
5.If it is below, take a short position with notional amount P
6.If the 1m ATM volatility is initially below and rises above its trailing 5 year average, neutralise the spot position and sell a straddle
7.If the 1m ATM volatility is initially above and falls below its trailing 5 year average, do not cut out the option position but allow it to expire. However, immediately put on a long or a short spot position to trend follow with the 80 day moving average.
14 Market Commentary14
Results
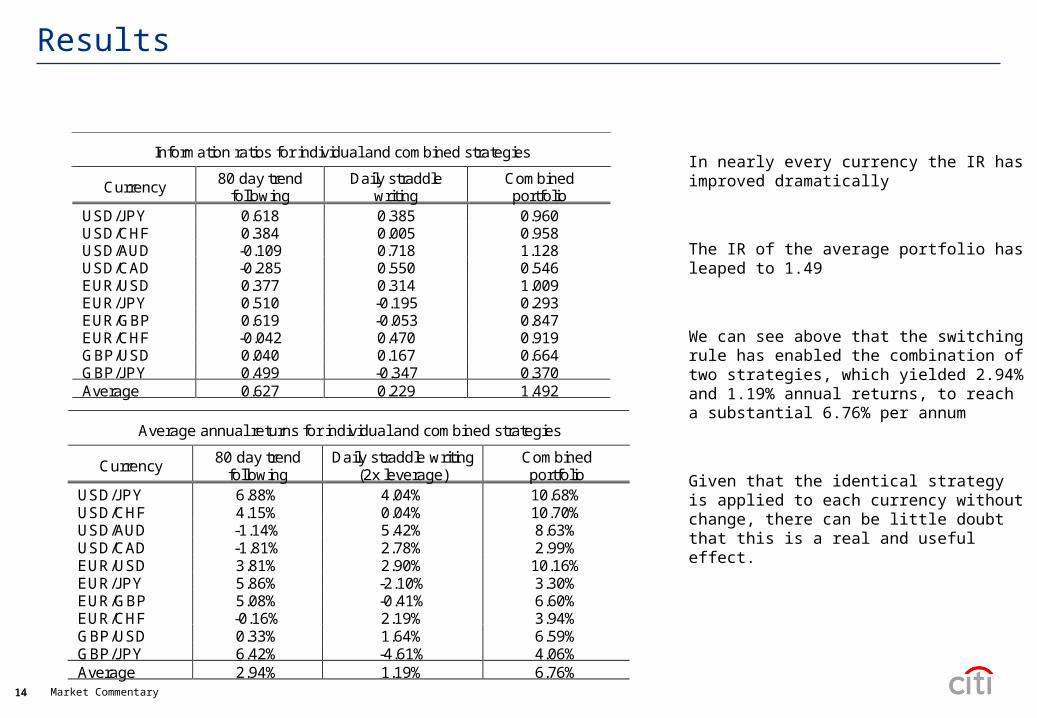
Information ratios for individual and combined strategies
Currency 80 day trend
following Daily straddle
writing Combined portfolio
USD/JPY 0.618 0.385 0.960 USD/CHF 0.384 0.005 0.958 USD/AUD -0.109 0.718 1.128 USD/CAD -0.285 0.550 0.546 EUR/USD 0.377 0.314 1.009 EUR/JPY 0.510 -0.195 0.293 EUR/GBP 0.619 -0.053 0.847 EUR/CHF -0.042 0.470 0.919 GBP/USD 0.040 0.167 0.664 GBP/JPY 0.499 -0.347 0.370 Average 0.627 0.229 1.492
Average annual returns for individual and combined strategies
Currency 80 day trend
following Daily straddle writing
(2x leverage) Combined portfolio
USD/JPY 6.88% 4.04% 10.68% USD/CHF 4.15% 0.04% 10.70% USD/AUD -1.14% 5.42% 8.63% USD/CAD -1.81% 2.78% 2.99% EUR/USD 3.81% 2.90% 10.16% EUR/JPY 5.86% -2.10% 3.30% EUR/GBP 5.08% -0.41% 6.60% EUR/CHF -0.16% 2.19% 3.94% GBP/USD 0.33% 1.64% 6.59% GBP/JPY 6.42% -4.61% 4.06% Average 2.94% 1.19% 6.76%
In nearly every currency the IR has improved dramatically
The IR of the average portfolio has leaped to 1.49
We can see above that the switching rule has enabled the combination of two strategies, which yielded 2.94% and 1.19% annual returns, to reach a substantial 6.76% per annum
Given that the identical strategy is applied to each currency without change, there can be little doubt that this is a real and useful effect.
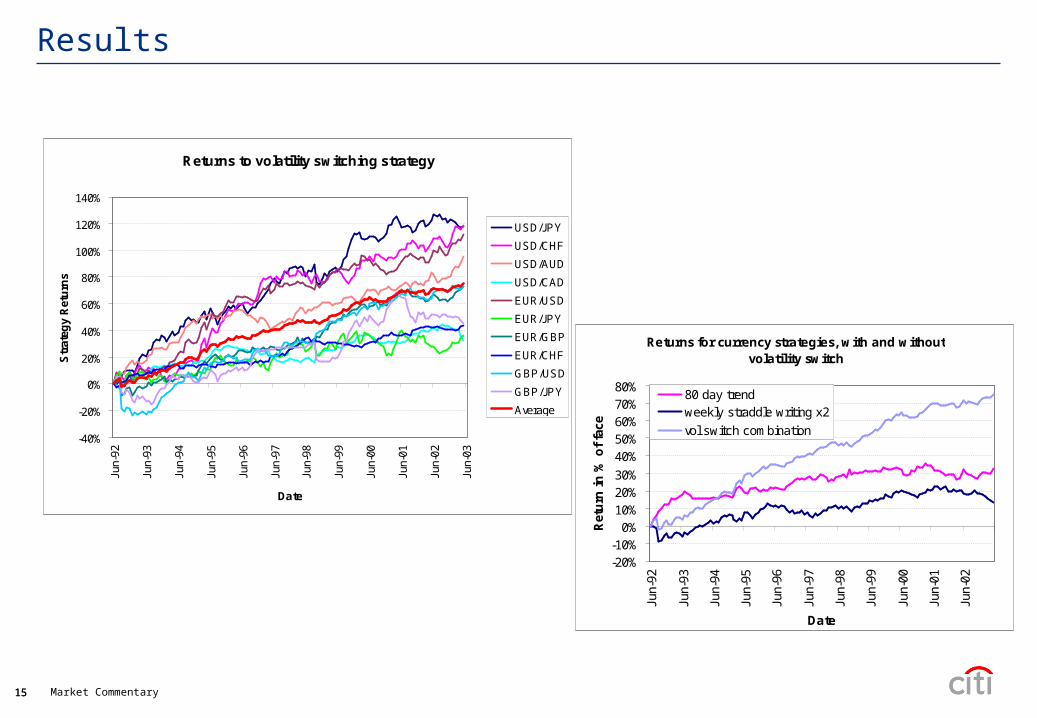
15 Market Commentary15
Results
Returns to volatility switching strategy
-40%
-20%
0%
20%
40%
60%
80%
100%
120%
140%
Jun-
92
Jun-
93
Jun-
94
Jun-
95
Jun-
96
Jun-
97
Jun-
98
Jun-
99
Jun-
00
Jun-
01
Jun-
02
Jun-
03
Date
Str
ateg
y R
etu
rns
USD/JPY
USD/CHF
USD/AUD
USD/CAD
EUR/USD
EUR/JPY
EUR/GBP
EUR/CHF
GBP/USD
GBP/JPY
Average
Returns for currency strategies, with and without volatility switch
-20%-10%
0%10%20%30%
40%50%60%70%80%
Jun-
92
Jun-
93
Jun-
94
Jun-
95
Jun-
96
Jun-
97
Jun-
98
Jun-
99
Jun-
00
Jun-
01
Jun-
02
Date
Ret
urn
in
% o
f fa
ce
80 day trendweekly straddle writing x2
vol switch combination

16 Market Commentary16
Single Currency Illustrations
Returns for EUR/USD, for trend, straddle writing and the combination
-20%
0%
20%
40%
60%
80%
100%
120%
Jun-
92
Jun-
93
Jun-
94
Jun-
95
Jun-
96
Jun-
97
Jun-
98
Jun-
99
Jun-
00
Jun-
01
Jun-
02Date
Ret
urn
in %
of
face
switch trend straddle write combination
The pale blue regions indicate the high vol periods where straddle writing was the selected strategy, and the white regions similarly are the trend following periods
The strategy is very successfully indicating which periods are best for the different strategies
Note that as this is monthly data, not quite every ‘switching’ period is represented, as these can vary on a sub-monthly level.
Switching model for GBP/USD
-40%
-20%
0%
20%
40%
60%
80%
100%
120%
92 93 94 95 96 97 98 99 00 01 02
Date
Ret
urn
in %
of
face
switch trend straddle write combination
17 Market Commentary17
This communication is issued by a member of the sales and trading department of Citigroup Global Markets Inc. or one of its affiliates (collectively, “Citi”). Sales and trading department personnel are not research analysts, and the information in this communication (“Communication”) is not intended to constitute “research” as that term is defined by applicable regulations. Unless otherwise indicated, any reference to a research report or research recommendation is not intended to represent the whole report and is not in itself considered a recommendation or research report. All views, opinions and estimates expressed in this Communication (i) may change without notice and (ii) may differ from those views, opinions and estimates held or expressed by Citi or other Citi personnel.
This Communication is provided for information and discussion purposes only. Unless otherwise indicated, it does not constitute an offer or solicitation to purchase or sell any financial instruments or other products and is not intended as an official confirmation of any transaction. Unless otherwise expressly indicated, this Communication does not take into account the investment objectives or financial situation of any particular person. Recipients of this Communication should obtain advice based on their own individual circumstances from their own tax, financial, legal and other advisors before making an investment decision, and only make such decisions on the basis of the investor's own objectives, experience and resources. The information contained in this Communication is based on generally available information and, although obtained from sources believed by Citi to be reliable, its accuracy and completeness cannot be assured, and such information may be incomplete or condensed.
Citi often acts as an issuer of financial instruments and other products, acts as a market maker and trades as principal in many different financial instruments and other products, and can be expected to perform or seek to perform investment banking and other services for the issuer of such financial instruments or other products.
The author of this Communication may have discussed the information contained therein with others within or outside Citi and the author and/or such other Citi personnel may have already acted on the basis of this information (including by trading for Citi's proprietary accounts or communicating the information contained herein to other customers of Citi). Citi, Citi's personnel (including those with whom the author may have consulted in the preparation of this communication), and other customers of Citi may be long or short the financial instruments or other products referred to in this Communication, may have acquired such positions at prices and market conditions that are no longer available, and may have interests different from or adverse to your interests.
Investments in financial instruments or other products carry significant risk, including the possible loss of the principal amount invested. Financial instruments or other products denominated in a foreign currency are subject to exchange rate fluctuations, which may have an adverse effect on the price or value of an investment in such products. No liability is accepted by Citi for any loss (whether direct, indirect or consequential) that may arise from any use of the information contained in or derived from this Communication.
Past performance is not a guarantee or indication of future results. Any prices provided in this Communication (other than those that are identified as being historical) are indicative only and do not represent firm quotes as to either price or size. You should contact your local representative directly if you are interested in buying or selling any financial instrument or other product or pursuing any trading strategy that may be mentioned in this Communication.
Although Citibank, N.A. (together with its subsidiaries and branches worldwide, "Citibank") is an affiliate of Citi, you should be aware that none of the financial instruments or other products mentioned in this Communication (unless expressly stated otherwise) are (i) insured by the Federal Deposit Insurance Corporation or any other governmental authority, or (ii) deposits or other obligations of, or guaranteed by, Citibank or any other insured depository institution.
IRS Circular 230 Disclosure: Citi and its employees are not in the business of providing, and do not provide, tax or legal advice to any taxpayer outside of Citi. Any statements in this Communication to tax matters were not intended or written to be used, and cannot be used or relied upon, by any taxpayer for the purpose of avoiding tax penalties. Any such taxpayer should seek advice based on the taxpayer’s particular circumstances from an independent tax advisor.
© 2008 Citigroup Global Markets Inc. Member SIPC. All rights reserved. Citi and Citi and Arc Design are trademarks and service marks of Citigroup Inc. or its affiliates and are used and registered throughout the world.
Disclaimer