Market Brief Focus on the Swedish Market Brief Focus on the Swedish Market Food Products May 2011
32
Market Brief Focus on the Swedish Market Food Products May 2011
Transcript of Market Brief Focus on the Swedish Market Brief Focus on the Swedish Market Food Products May 2011

Market Brief
Focus on the Swedish Market
Food Products May 2011

Area: 449,964 sq.kmPopulation: 9.4 million
Capital: Stockholm.Stockholm city: 847.100 inh.Greater Stockholm: 2 mil. inh.
Business language: Swedish, English
Religion:Lutheran
Largest cities:Stockholm city 847.100 inh.Gothenburg 513.800 inh.Malmö 298.900 inh.Uppsala 197.800 inh.Linköping 146.400 inh.Västerås 137.200 inh.Örebro 135.500 inh.Norrköping 130.100 inh.Helsingborg 129.200 inh.Jönköping 127.400 inh.
Form of government:Constitutional monarchy, parliamentary democracy
Some distances:Stockholm-Malmö 640 kmStockholm-Gothenburg 490 kmStockholm-Sundsvall 400 kmStockholm-Kiruna 1310 km
Currency:1 krona (SEK) = 100 öre
Facts about Sweden
The European Union
• Austria• Belgium• Bulgaria• Cyprus• Czech Rep.• Denmark• Estonia• Finland• France• Germany• Great Britain• Greece• Hungary• Ireland
• Italy• Latvia• Lithuania• Luxemburg• Malta• Netherlands• Poland• Portugal• Romania• Slovak Rep.• Slovenia• Spain• Sweden
The EES/EEA areaEU-countries, Iceland, Liechtenstein and Norway
EFTAIceland, Liechtenstein, Norway and Switzerland

Market Brief – Food Products
1
List of Contents Page
1 Introduction 3
2 The Swedish Food Market 4
2.1 Market Size 4
2.2 Market Characteristics 5
2.3 Market Segments 6
2.3.1 Retail Sector 6
2.3.2 Foodservice Sector 7
2.3.3 Food Processing Industry 8
3 Imports and Exports 9
3.1 Imports 9
3.2 Domestic Production and Exports 10
4 Channels of Distribution 12
4.1 Retail Groups 13
4.1.1 ICA Group 14
4.1.2 Coop Group 15
4.1.3 Axfood 15
4.1.4 Bergendahls Food 16
4.2 Wholesalers for the Convenience Store Sector 17
4.3 Wholesalers for the Foodservice Sector 17
4.4 Importers of Fresh fruit and vegetables 18
4.5 Importers of Alcoholic Beverages 19
4.6 Importers of Raw Materials and Food Ingredients 19
5 Market Access 21
6 Market Prospects 21
Appendix 1 – Imports and Exports of Food, by Value 2008-2010 23
Appendix 2 – Import of Certain Prepared and Processed Food 24
Products, by Value 2008-2010
Appendix 3 – Retail Sales of Food, by Value 2007-2009 25
Appendix 4 – Direct Consumption of Food, by Quantity 2006-2009 26
Appendix 5 – Facts about Retail Groups 27
Appendix 6 – Useful Internet Links 28
Appendix 7 – Currency Conversion 28

Market Brief – Food Products
2
Disclaimer: The information provided in this guide is believed to be accurate at the time of publishing. It is, however, passes on to the reader without any responsibility on the part of the authors and it does not release the reader from the obligation to comply with all applicable legislation.
The authors or publishers make no warranty, expresses or implied, concerning the accuracy of the information presented, and will not be liable for injury claims pertaining to the use of this publication or the information contained therein.
No obligation is assumed for updating or amending this publication for any reasons, be it new or contrary information or changes in legislation, regulations or jurisdiction.
Copyright: Sida
Author: Fox Research AB, Stockholm
Published by: The Swedish Chambers of Commerce, May 2011
This document has been financed by the Swedish International Development Cooperation Agency, Sida. Sida does not necessarily share the views expressed in this material. Responsibility for its contents rests entirely with the author.

Market Brief – Food Products
3
1 Introduction
Sweden has a population of approx. 9.5 million people. Since year 2000, the
population has grown with 0.7 million people (+8%), of which a substantial part
through immigration.
Sweden is from 1995 a full member of the European Union (EU), which has 27
member countries. The EU has abolished all trade barriers between the member
countries and can therefore be described as a single, unified market. Another four
countries cooperate with the EU in the European Economic Area (EEA) and
therefore participate in the European single market without having joined the EU.
The population of the 31 EEA-countries is around 520 million people. Sweden's
share of the total population is close to 2%, which means that it is one of the mid-
sized national markets. However, the five Nordic countries (also known as
Scandinavia) - Denmark, Norway, Sweden, Finland and Iceland - with about 25
million inhabitants, are more and more regarded as the “home market” for
companies within the Swedish food trade and industry.
Sweden has experienced a rapid growth during the last 50 years and is among the
wealthiest nations in the world. Also in comparison with other European countries,
the Swedish GDP per capita normally is about 20-25% higher than the EU average.
Sweden and the European Market
Area Pop. million Share %
Sweden 9.5 1.8 Scandinavia* 25.3 4.9 European Union (EU/EEA) 520.0 100.0
* Also called the Nordic Countries (Sweden, Denmark, Norway, Iceland, Finland)
Source: Eurostat, Statistics Sweden
GDP per capita comparison 2000-2010
Swedish volume index of Gross Domestic Product (GDP) per capita in Purchasing Power Standards (PPS) expressed in relation to the EU average, set to equal 100.
2000 2008 2009 2010*
European Union 100 100 100 100 Sweden 127 123 119 125 * Estimate
Source: Eurostat
The euro (€), the second most traded currency in the world, is the official currency
of the European Union, and is currently in use in 17 of the 27 Member States.
However, Sweden has for the moment decided not to participate in the Euro
monetary system, and therefore still uses its national currency, the Swedish krona
(code SEK), in English normally referred to as the “Swedish crown” (since krona
means crown in English).
For currency conversion between the Swedish krona, the euro and the US dollar,
please refer to Appendix 7.
Market Brief – Food Products
4
2 The Swedish Food Market 2.1 Market Size Swedish consumers spent about 20% of their household budget on food and
beverages in 2009, the same as the EU average. Other important areas of the
private consumption were consumer articles (20%), housing (27%), and transports
(13%,) as well as services, leisure activities and health care (21%).
During 2009, consumer’s expenditure of food and beverages increased about 6% to
SEK 326 billion (€31 billion). Of the total, the retail trade accounted for about 67%
and the food service sector for 33%.
Food Market 2009
Number Sales SEK M-share Sector of outlets million %
Retail trade 6 100* 217 000 67 Foodservice 31 000 109 000 33 • Total 37 100 326 000 100
* Excluding small convenience outlets
and specialised food stores
Sources: Statistics Sweden, Delfi, Fox Research
Retail sales of food and beverages amounted to SEK 217 billion (€20.5 billion) in
2009, which was 5.5% higher than the year before. The rise was due to increased
volumes (2.6%) as well as increased prices (2.9%).
The main product groups were dairy products and fats (16%), meat products
(15%), fruit and vegetable products (15%), and bread and cereal products (12.5%).
Due to high taxation, also consumption of alcoholic beverages (beer, wine, spirits)
is notable when measured by value (15%).
Even though retail sales of beverages, coffee, dairy products, bread, meat, and fish
have increased considerably in recent years, the development of the per capita
consumption is less distinct. In fact, only two product groups – bread and cereals,
and “other foods” (including convenience foods, sauces and confectionery) – can
show a positive progress, while some product groups have experienced a negative
trend, as can be seen in the tables below and the next page.
Retail Sales of Food and Beverages, By Value 2009
Value SEK million Share Product 2008 2009 ± % %
Dairy products, fats and eggs 33 238 35 140 + 5.7 16.2 Meat products 31 035 32 638 + 5.2 15.0 Fruit and vegetables 31 606 32 170 + 1.8 14.8 Bread and cereal products 26 203 27 384 + 4.5 12.6 Fish and seafood 9 931 10 456 + 5.3 4.8 Coffee, tea and cocoa 5 053 5 544 + 9.7 2.6 Other food products 27 620 28 574 + 3.5 13.0 Juice, mineral water, soft drinks 11 524 12 959 + 12.5 6.0 Beer, wine and spirits 29 750 32 389 + 8.9 14.9
• Total 205 960 217 253 + 5.5 100.0
Source: Statistics Sweden

Market Brief – Food Products
5
Per Capita Consumption 2006-2009
Per capita consumption in kg/litres Product Group 2006 2007 2008 2009 ± 06-09 ± %
Fruit and vegetable products 239 240 238 231 - 8 - 3 Dairy products, fats and eggs 183 180 179 178 - 5 - 3 Meat products 84 84 83 82 - 2 - 2 Bread and cereal products 106 103 110 110 + 4 + 6 Fish and seafood* 25 26 25 25 ± 0 ± 0 Coffee, tea and cocoa 11 11 11 11 ± 0 ± 0 Other food products 50 53 53 54 + 4 + 8 Beverages 179 177 172 177 - 2 - 1
* Based partly on trade estimations. No official figures available since 1999.
Source: Swedish Board of Agriculture
2.2 Market Characteristics Swedish food consumption consists of 90% processed foods. This is internationally
a very high figure. The remaining 10% is composed of non-processed products,
such as fresh fruit and vegetables, fresh fish, fresh meat and eggs.
Sweden counts as a mature market for groceries, which normally means that there
should be a relatively slow market growth. However, during the last couple of
years, the market value for foodstuffs and beverages has increased about 5 to 6
percent per year, of which price increases account for about half and real increase
in volumes for the remainder. But the positive trend has been slowed down since
2009, however, and the food trade therefore estimate that food sales will show a
more modest development in the coming 2 to 3 years.
The food market has for a number of years been influenced by consumer awareness
of health, environmental, and social issues. A major development is the
introduction of certified organic (also called ecological or biodynamic) foods, as
well as Fair Trade labelled products, especially within ”natural” product groups
such as fresh fruit and vegetables, cereals and coffee.
During 2009, about 4.0% of all foods and beverages sold within the retail trade
were certified organic, when measured by value. The increase was 16%, thus
substantially higher than for the overall food market, which was 5.5%.
At the same time increased interest in healthy foodstuffs has expanded sales of
products that are regarded as nutritious, e.g. nuts, cereal grains, and health bars.
There is also a high interest for food products from other countries, especially for
so called ethnic foods, such as Italian, Chinese, Indian, and Mexican style products.
This has led to significant sale increases especially of ethnic products such as oils
and vinegar, condiments, spicy sauces and dressings.
Taking into account the relatively large number of non-European immigrants
(about 5% of the total population) also foodstuffs from countries in the Middle
East, Africa and South America have increased in demand.
In fact, all major retail groups have during the last couple of years introduced an
"ethnic" assortment consisting of several hundred different products in their
supermarkets, which has been met with a relatively big success.

Market Brief – Food Products
6
Several of the these trends can be seen in the following list, showing food items
with the largest sales increases within the supermarket trade during the last couple
of years:
Exotic foods with well-defined flavours (pomegranates, goji berries, coconut
beverages, coconut milk)
Organic foods (especially organic chocolate and ready-to-eat dishes)
Gluten-free food (popular with many consumers with allergies)
Sports and energy beverages and health bars
Sliced ready-to-eat dishes and items (such as pizza slices and sliced fruit)
Spicy snacks (containing e.g. chilli, garlic, ginger, onion)
Hot sauces and spicy condiments
On the other hand, there are also several product groups that for a number of years
have shown a more modest and even a negative sales development, for example
foods with a high content of salt, fats (such as margarine), sugar, and spirits.
2.3 Market Segments For food exporters, the Swedish market can be divided into two main market
segments: the retail and food service sectors, and the food processing industry.
2.3.1 Retail Sector The Swedish retail trade has experienced a very positive trend in recent years. In
fact, sales of food and beverages have increased every year between 2000 and
2009.
During 2009, sales within the total food retailing market (including also other daily
commodities) reached SEK 251 billion (€23.6 billion). However, due to high price
increases, the actual sales volume in 2009 was only marginally higher than the year
before.
Food Retail Market 2009
Food retail market includes sales of both food and other daily commodities (such as chemico-technical and household paper products, flowers, tobacco and magazines). Sales of speciality items are excluded. Number Sales SEK M-share Sales per store Type of Store of Stores million % in SEK million
Hypermarkets 160 44 100 18 276 Supermarkets 2 330 118 300 47 51 Discount stores 440 30 400 12 69 Convenience stores 3 170 27 000 11 9 • Total 6 100 219 800 88 36
Other stores* -- 31 100 12 --
• Total -- 250 900 100 -- * Includes smaller kiosks, tobacconists, fruit and candy stores, health food stores, bakeries, meat and deli stores, fish stores, food halls, street markets, drugstores, pharmacies, etc.
Sources: Fri Köpenskap, Market Magasin

Market Brief – Food Products
7
In Sweden, most retail sales of food pass through supermarkets and other general
grocery stores with a wide assortment of foodstuffs and household items such as
paper products, chemical products, toiletries, flowers, newspapers and tobacco.
There are approx. 6,000 grocery stores with a full line of food and other household
items, of which half are larger stores, such as hypermarkets, supermarkets and
discount stores, and half are smaller convenience stores. Discount stores with a
limited assortment have in recent years obtained a relatively large market share,
approx. 12%.
There are also a large amount of bakeries, fruit stores, deli stores and other single-
line stores as well as kiosks and street markets. In addition, there are state-run
liquor stores, which are the only retailers that have the right to sell alcoholic
beverages, such as wine, spirits and strong alcoholic beer.
2.3.2 Foodservice Sector During 2009, sales of food and beverages within the foodservice sector amounted
to approx. SEK 109 billion (€10.3 billion), which indicates that this sector absorbs
about a third of consumers total food expenditures.
Sweden actually rank’s as one of Europe’s leading markets for out-of home meals.
According to a recent study, the average Swedish consumers had meals outside
their homes 168 times during 2009. For other European countries like France, Italy
and Spain, the corresponding figure was only slightly over 100 per year.
In total, the foodservice-sector comprises approx. 31,000 units, such as restaurants,
coffee shops, fast food outlets and canteens.
The restaurant sector, which account for about 70% of the sales volume, comprises
over 18,000 units, of which 12,000 are restaurants, coffee shops, and hotels, and
6,000 are fast-food outlets. Most of the units in the restaurant sector are family run
businesses, but there are also a few large national chains, especially within the fast
food and hotel segments. A trend is the fast growing number of ethnic restaurants
and fast food outlets, as well as coffee shops.
The canteen sector (also called contract catering market) account for 30% of the
sales volume and includes 12,000 units, of which a large share is located in
schools, hospitals, day-care and old age centres. Local, regional or national
authorities and agencies run the majority of these canteens. There are also a
number of staff canteens in large office and industrial complexes, either run by the
companies themselves or by national restaurant chains.
Food Service Market 2009
Number Sales SEK M-share Type of Outlet of Outlets million %
Restaurants, Coffee shops, Fast food 18 500 77 000 71 Canteens 12 500 32 000 29 • Total 31 000 109 000 100
Sources: Delfi, Statistics Sweden

Market Brief – Food Products
8
2.3.3 Food Processing Industry The Swedish food processing industry counts as an important market segment for
foreign suppliers of foodstuffs. Even though domestic producers and companies
still supply the main part of the raw materials and food ingredients used, imports
are on the increase.
The food processing industry consists of about 3,100 companies with 52,000
employees. In 2010, the estimated net turnover amounted to approx. SEK 200
million (€21.0 billion), which means that food manufacturing accounted for about
10% of Sweden’s total industrial output.
The most important sectors within the Swedish food industry are bakeries, meat
plants, and dairies, with more than 50% of the value of output. However, domestic
producers mainly supply these sectors, as well as the milling, sugar and spirits
industries.
Food Processing Industry 2008-2010
Employees Companies Industry Sector 2008 2009 2010 2010
Bakery 14 400 14 700 13 900 1 331 Meat 12 000 10 900 10 800 458 Dairy 6 100 6 100 6 400 134 Fruit & Vegetables 5 100 4 900 4 300 200 Brewery & Soft drinks 3 900 3 900 3 900 81 Chocolate & Confectionary 2 900 2 500 2 400 203 Fish and Seafood 1 900 1 900 1 900 204 Milling & Starch 1 600 1 700 1 700 110 Spices & Condiments 1 500 1 500 1 500 53 Ready-to-eat 1 000 1 400 1 300 64 Spirits & Wine 900 1 000 1 000 48 Oils & Fats 1 700 1 200 800 44 Animal feed 700 700 700 91 Coffee 500 500 600 29 Sugar 500 500 500 5 Other 500 900 1 000§ 110
• Total 55 000 54 300 52 600 3 165
Source: Statistics Sweden
The branches, which depend mostly on imports, are the coffee, oils & fats, spice &
condiments, chocolate & confectionary, and fish & seafood industries. Also
manufacturers and canners of fruit juices, and fruit & vegetables, largely depend on
imports. In recent years, also the meat industry has become a large importer.
For more details about Swedish food manufacturers, see chapter 4.6.
Market Brief – Food Products
9
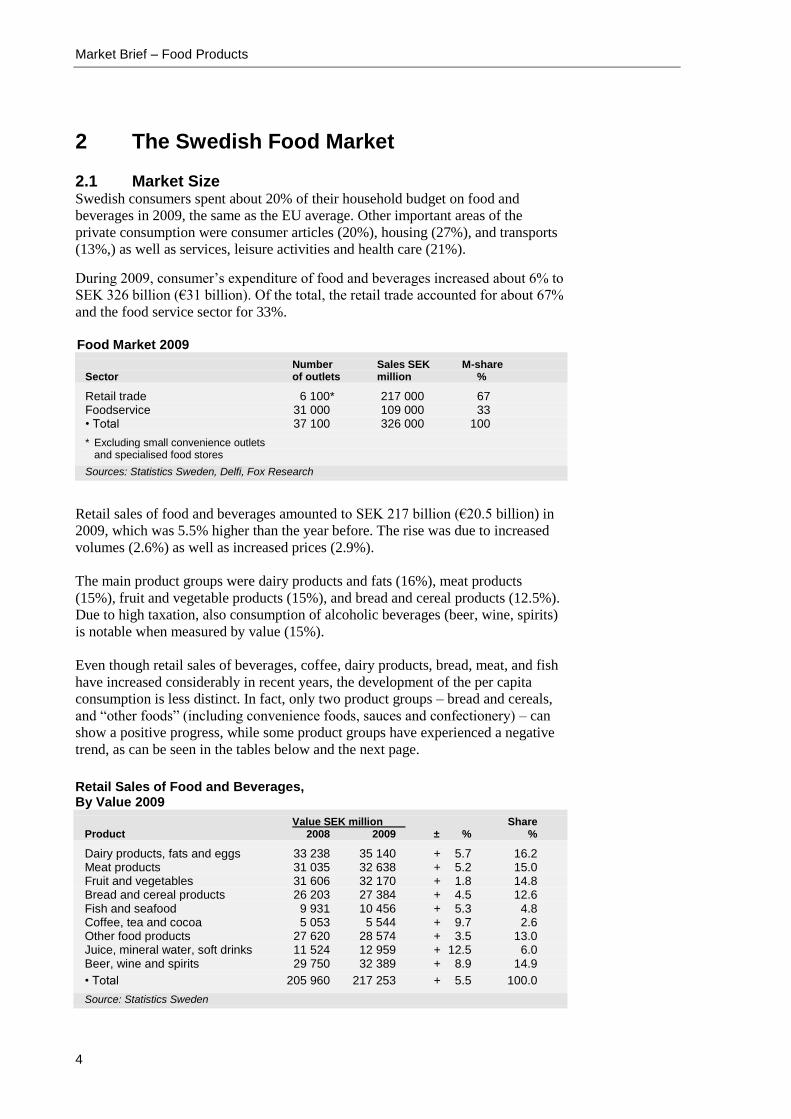
3 Imports and Exports
Sweden has traditionally been more or less self-sufficient in basic foods like meat,
dairy products and cereals. However, during the last two decades, especially since
joining the EU in 1995, imports have shown a steady yearly increase, also
regarding the basic "domestic" products.
The total degree of self-sufficiency is at present estimated to be about 65-70%, and
thus 30-35% is imported. At the same time, also exports have shown a large
increase, which means that the domestic food industry is a growing importer of raw
food materials and food ingredients.
Sweden imports almost twice as much food products as it exports. Imports in 2010
amounted to SEK 95 billion (equivalent of €9.9 billion), an increase by 3%
compared to the previous year, when measured by local currency. Exports
amounted to SEK 54 billion (€5.6 billion), an increase by 9% in local currency.
The net trade gap between imports and exports thus decreased in 2010, and now
amounted to 43%, compared to 46% two years earlier.
The Swedish Food Distribution
Products traditionally supplied domestically
• Dairy products • Meat products (fresh meat recently
imported) • Cereals (mainly wheat, rye)
Products not produced within Sweden
• Most fruit items (except temperate fruit) • Green coffee, tea and cocoa • Spices and herbs • Wine
Products produced only part of the year
• Fresh vegetables • Temperate fruit (apples, berries, etc.)
Products imported in large quantities
• All kinds of fish & seafood products • Fresh meat products • Sauces, dressings, vinegar and oils • Ready-to-eat and other convenience
foods • Frozen, canned and dried food products • Animal feed
3.1 Imports Imports of food and beverages have shown a steady increase during the last couple
of years. Between 2006 and 2010, the import value has grown by 30%, when
measured by local currency. During 2010, imports amounted to SEK 94,900
million (€ 9.9 billion), an increase of 2.7% compared to the preceding year.
The primary food import consists of food, which is not at all produced within
Sweden such as citrus fruit, nuts, green coffee, tea, cocoa, spices and wine, and
also of products, which are only produced during a part of the year, for example
fresh vegetables and most fresh fruit, such as apples.
Other notable import items are fish & seafood products (including re-exports of
farmed fish), sauces and dressings, ready-to-eat meals, certain canned, frozen and
dried foods, as well as animal feed. And as said earlier, also an increasing degree of
meat, dairy and cereal products are imported.
Even if imports comprise a large number of items, twelve food products accounted
for almost 70% of the total food imports during 2010, see table on the following
pages.
Market Brief – Food Products
10
Ranked by product groups, the two largest categories are fish and seafood products
(25%) and fruit & vegetables (18%), whether fresh or processed. Other important
product groups are meat products and beverages, as well as cheese, chocolate and
confectionery, green coffee, oils & fats, and animal feed. Even though the market
for meat products mainly is supplied by domestic production, it has in just a few
years become the third largest import product group.
Processed food items account for over 60% of all food imports. The five most
important categories are oils & fats, wine, cheese, filets of fish, and cuts of beef.
See also Appendix 1 and 2 for further data.
Food items showing the largest growth in imports during the last three years are
cocoa paste, powder and butter (81%), fresh and frozen fish and seafood (35%),
coffee (33%), charcuterie and delicatessen (33%), spices (27%), prepared and
processed seafood (25%), fish fillets (24%), and dairy products (22%), see also
Appendix 1 and 2.
About 70% of all food imports are normally imported from the European continent,
of which other EU-countries account for the dominant part. However, it should be
noted that some imports from the EU in the statistics actually have their origin in
countries outside of the EU. A typical example is fruit from Latin America that is
delivered to Sweden via ports in Germany, Belgium or the Netherlands. This
means that EU imports are somewhat overestimated in the data. In addition,
Sweden imports a lot of farmed fish from Norway, which to a large extent is re-
exported to other countries.
Four countries account for about half of the total import value: Denmark, the
Netherlands, Norway, and Germany. OECD countries have during the last couple
of years accounted for 90% of total imports, which means that non-OECD
countries have had a share of just 10%.
Of the non-OECD countries, the largest exporters to the Swedish market are Brazil
and Colombia (mostly coffee), Costa Rica, Guatemala and Panama (bananas and
coffee), as well as Kenya (coffee) and Thailand (mostly exotic fruits, both canned
and frozen items). Other notable exporters are China, India, Vietnam, the
Philippines, Indonesia, Malaysia, Chile, Egypt, Israel, Lebanon, Morocco, and
South Africa.
3.2 Domestic Production and Exports Traditionally, the Swedish food industry has been geared towards the domestic
market and only 10-15% has been exported. But since joining the EU in 1995,
exports have seen a steady increase year by year. During 2010, the export value
amounted to SEK 53,800 million (€5.6 billion), 9% more than the preceding year.
The main export item is fish and seafood products, which accounts for about 1/3 of
all food exports (which as stated earlier, includes re-exports of farmed Norwegian
fish). Other important export items are spirits, refined oils and fats, and basic cereal
products (mostly rye and wheat).
About 2/3 of food exports are highly processed foodstuffs, which have seen a
steady increase during the last few years. The largest Swedish export item is vodka,
with the Absolut brand as the leading item, distributed to over 100 countries.

Market Brief – Food Products
11
Other important export items are bakery products (mainly rye crisp bread, biscuits
and other sweet bakery goods, frozen bread, and rusk), canned fish and seafood
products, chocolate and confectionary, liquid fats and butter fat mixtures, filets of
fish, roasted coffee, and milk powder.
It should be noted that several of largest export items, especially roasted coffee,
chocolate bars, processed fish and seafood products, and refined oils and fats, fully
or to a large extent are made from imported raw materials.
The most important export markets for the domestic food industry are other EU-
countries (especially Denmark, Finland, Germany and France), accounting for over
70% of the total export value. Other large markets were Norway and the USA
(vodka, roasted coffee, and cereals). See also table Appendix 1, Imports and
Exports of Food.
Imports and Exports of Foodstuffs By Value 2010
Value SEK million Net import Gap % Product Imports Exports Difference 2008 2010
Live Animal 304 167 - 137 - 29 45 Meat products 9 842 2 060 - 7 782 - 76 79 Dairy products and Eggs 7 046 3 591 - 3 455 - 44 49 Fish & Seafood products 23 487* 19 069* - 4 418 - 31 19 Cereal & Bakery products 4 501 6 089 + 1 588 + 38 35 Fruit and vegetables 16 533 2 830 - 13 703 - 85 83 Sugar and sugar confectionery 2 179 1 244 - 935 - 32 43 Coffee, tea, chocolate, spices 7 687 3 526 - 4 161 - 65 54 Animal feed 3 055 1 195 - 1 860 - 75 61 Other food products 6 040 5 646 - 394 - 33 7 Beverages 8 329 6 263 - 2 066 - 12 25 Tobacco 1 287 567 - 720 - 64 56 Oil seeds & oils and fats 4 577 1 575 - 3 002 - 68 66
• Total 94 867 53 822 - 41 045 - 46 43 * Including re-exports of farmed Norwegian fish
Source: Statistics Sweden
Food Imports by Product Groups By Value 2009-2010
Value SEK million Change % Share % Product 2009 2010 ± 09-10 2010
Live Animal 386 304 - 21 0 Meat products 9 750 9 842 + 1 10 Dairy products and Eggs 7 010 7 046 + 1 8 Fish & Seafood products 19 991 23 487 + 17 25 Cereal & Bakery products 4 838 4 501 - 7 5 Fruit and Vegetables 16 790 16 533 - 2 18 Sugar and sugar confectionary 2 299 2 179 - 5 2 Coffee, tea, chocolate, spices 6 802 7 687 + 13 8 Animal feed 3 429 3 055 - 11 3 Other food products 6 371 6 040 - 5 6 Beverages 8 845 8 329 - 6 9 Tobacco 1 333 1 287 - 3 1 Oil seeds & Oils and fats 4 548 4 577 + 1 5
• Total 92 392 94 867 + 3 100 Source: Statistics Sweden

Market Brief – Food Products
12
4 Channels of Distribution
Four trade groups, ICA, Coop, Axfood and Bergendahls, with both retail and
wholesale activities, dominate the Swedish distribution of food and beverages to
the retail sector. All four groups have also built up their own buying and import
departments.
These trade groups import some of their general food supplies by themselves,
especially items bought in high volumes, and some through independent
wholesalers acting as importers or agents.
There are also wholesalers for different segments of the food sector. Thus, the
convenience store segment is mainly supplied by specialised wholesalers, of which
the leading ones are Axfood Närlivs, Menigo and Privab.
The foodservice sector (hotels, restaurants and catering establishments) is supplied
by several wholesalers, of which four dominate the market, Servera, Menigo.
Svensk Cater and Martin Olsson.
Besides these groups, imports are also conducted by importing wholesalers
specialised in certain food items such as fresh fruit & vegetables, cheese & egg,
fish, meat products, health foods, confectionary or alcoholic beverages.
Specialised wholesalers may distribute their goods either via the large retail groups,
catering or convenience store wholesalers, or directly to independent chains, large
food stores, or catering chains and large units.
There are also some importers specialised in selling to the food industry, including
bakeries. However, large food manufacturers often conduct their own buying.
Food Importers/Wholesalers
A selection of the largest importers and wholesalers within the Swedish food wholesale trade.
Retail Groups with integrated retailing and wholesaling activities • ICA Group • Coop Group • Axfood (Axel Johnson) • Bergendahls Food
Convenience Store Wholesalers • Axfood Närlivs • Menigo (Brakes Group) • Privab
Foodservice Wholesalers • Servera (Axel Johnson) • Menigo (Brakes Group) • Svensk Cater (Euro Cater) • Martin Olsson
Fresh Fruit & Vegetables Wholesalers • Saba Trading (Dole) • Everfresh (Total/Fyffes) • ICA Frukt & Grönt (ICA)
• Ewerman
Bakery Ingredients Wholesalers • KåKå (Orkla Group) • Kobia

Market Brief – Food Products
13
4.1 Retail Groups As mentioned above, the Swedish food-retailing sector is highly concentrated.
Four trade groups, with both integrated retail and wholesale activities, dominate
the market:
ICA - Sweden’s largest food retailer, has 1,350 stores and a market share of
about 38%.
Coop Group - has 720 stores and approx. 16% of the whole food market.
Axfood - has about 340 general grocery stores and approx. 700 convenience
stores. The market share is around 16%.
Bergendahls Food - has 180 stores and a market share of 5%.
These four groups account for about 75% of the total retail market for foodstuffs
and other everyday commodities. However, if only sales of ordinary grocery stores
are counted (excluding small convenience stores and speciality food stores) their
combined market share is even higher, about 95%.
All these groups are also cooperating with retailing groups in other Scandinavian
or European countries, especially regarding imports.
In recent years, two foreign-based discount chains have been established in
Sweden, Lidl of Germany and Netto of Denmark. Even though these chains have
built up their own supply system in Sweden, all imports are coordinated with their
headquarters in Germany and Denmark respectively. Their combined market share
is still rather insignificant, about 4%, but it is expected to rise substantially within
the next few years.
Another large food retailer is Reitan Servicehandel (with headquarters in Norway)
which runs 7-Eleven and other convenience stores. In addition there are several
petrol store chains as well as smaller independent stores and so called ethnic food
stores (usually run by immigrants). These stores are generally supplied by
specialised convenience store wholesalers, see Section 4.2 below.
Food Retailing Statistics 2009
Sales of groceries and other daily commodities. Other products excluded.
Food sales Number of Market Group SEK million ± % food stores share %
ICA Group 96 700 + 5.1 1 350 38 Coop Group 39 500 + 4.0 720 16 Axfood 39 400 + 2.0 1 030 16 Bergendahls Food 11 300 + 13.8 180 5
• Sum 186 900 + 4.2 3 280 75
Lidl 5 400 + 7.4 140 2 Netto 3 600 + 16.7 110 1.5 Reitan 4 300 + 25.0 520 1.5 Convenience stores 11 100 - 4.5 1 290 4.5 Other grocery stores 8 600 - 1.1 760 3.5
• Sum 219 800 + 4.1 6 100 88
Speciality food stores 31 100 + 5.7 12
• Total 250 900 + 4.3 100
Sources: Company information, Fox Research
Market Brief – Food Products
14
About 12% of the food retailing market consist of speciality food stores such as
pastry shops and bakeries, meat and deli stores, fish stores, health food stores, fruit
& candy stores, kiosks, street markets, and non-food retailers (such as drugstores,
pharmacies, tobacconists, and florists). Depending on line of business, these stores
are either customers of specialised wholesalers or buy their supplies from cash and
carry-units.
4.1.1 ICA Group The ICA Group, with headquarters in Stockholm, has retail subsidiaries in Sweden
(ICA Sverige), Norway (ICA Norge) and in the Baltic countries (Rimi Baltic).
With 2,200 stores and a combined turnover of SEK 93 million (€9.8 billion), the
ICA Group and its affiliated stores form together the second largest retailer within
the Scandinavian grocery sector. The ICA group is the clear market leader in
Sweden (38% market share) and number four in Norway, and one of the top three
retailers in the Baltic countries.
All Swedish ICA stores are owned by independent retailers, who are members of
the ICA Association, which in turn controls half of the ownership of ICA AB, the
parent company. Royal Ahold, based in the Netherlands, controls the remaining
part.
The Royal Ahold Group is one of the world’s largest retail chains, with activities
in several European countries as well as in the USA.
The Swedish retail business is handled by the subsidiary ICA Sverige and consists
of approx. 1,340 different types of ICA food stores, from small neighbourhood
stores to large superstores and hypermarkets.
ICA Sverige coordinates questions of common interest to all Swedish ICA
operations. It also function as the ICA retailers company for marketing, logistics,
distribution, accounts, retail development, training and financing/administration.
The buying department, which is organised within the parent company ICA AB in
Stockholm, has been established to coordinate all buying activities of both ICA in
Sweden and Norway. A special unit located in Helsingborg in south Sweden, ICA
Frukt & Grönt, handles imports of fruit and vegetables.
During the last couple years, ICA have also been coordinating buying and
trademarks with Ahold in the Netherlands. ICA is since many years also engaged
in import and buying cooperation with the Kesko Group, Finland’s second largest
food retailer.
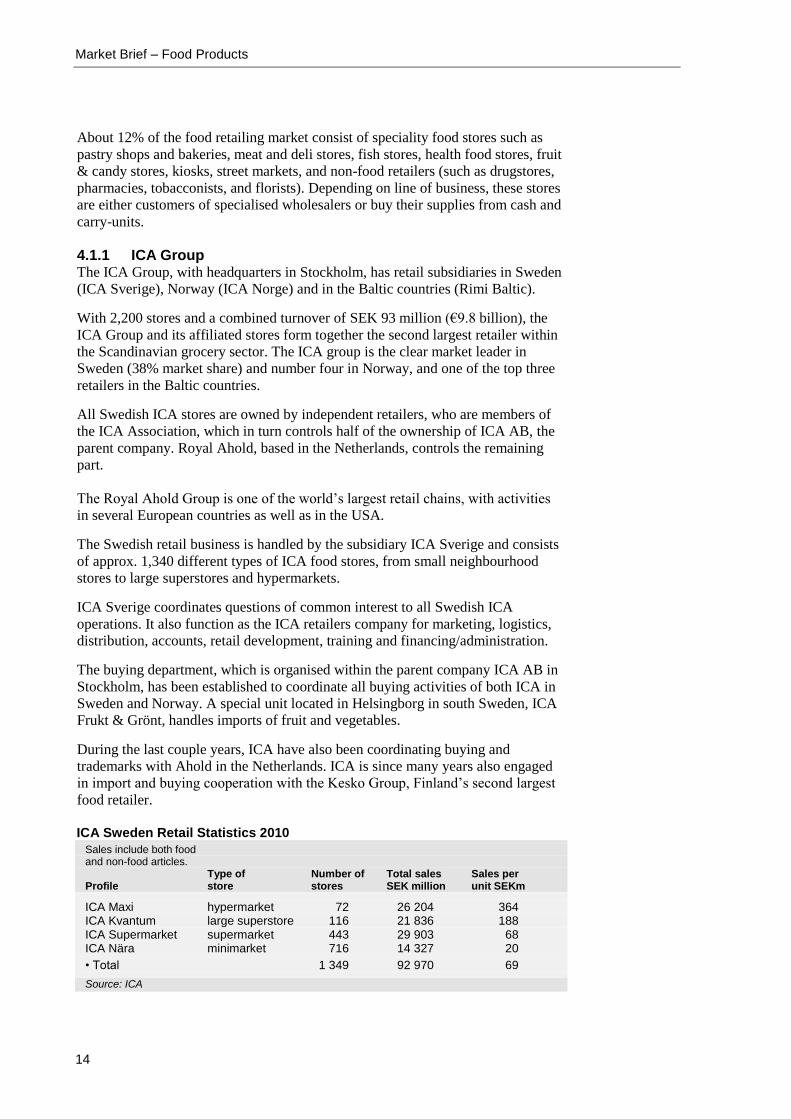
ICA Sweden Retail Statistics 2010
Sales include both food and non-food articles. Type of Number of Total sales Sales per Profile store stores SEK million unit SEKm
ICA Maxi hypermarket 72 26 204 364 ICA Kvantum large superstore 116 21 836 188 ICA Supermarket supermarket 443 29 903 68 ICA Nära minimarket 716 14 327 20
• Total 1 349 92 970 69
Source: ICA
Market Brief – Food Products
15
4.1.2 Coop Group The co-operative KF group and its affiliated regional cooperative societies is the
second largest food retail group in Sweden, with approx. 16% of the market. The
co-operatives are owned by approx. 3.2 million individual members, which mean
that about 60% of all Swedish households are owners of the Coop Group.
KF and the affiliated co-operative societies operate over 700 retail stores
nationwide, such as hypermarkets, supermarkets and minimarkets. The Coop stores
have introduced Sweden’s largest assortment of organic and environmental
friendly products, as well as an assortment of ethnic foodstuffs.
Wholesaling, importing and distribution of food is managed by Cilab AB, a newly
formed company. Another company, Coop Trading A/S, based in Copenhagen,
Denmark, handles part of the group’s international purchases of branded and
private label products. Coop Trading is owned jointly by the consumer co-
operative organisations in Scandinavia - Coop Sweden, Coop Danmark, Coop
Norway and the S-Group/SOK (Finland). The stores belonging to these four groups
account for about 30% of the total food retail market in Scandinavia.
It should be noted, that imports of fresh fruit and vegetables are handled by
Everfresh, an independent importer (see Section 4.4 below).
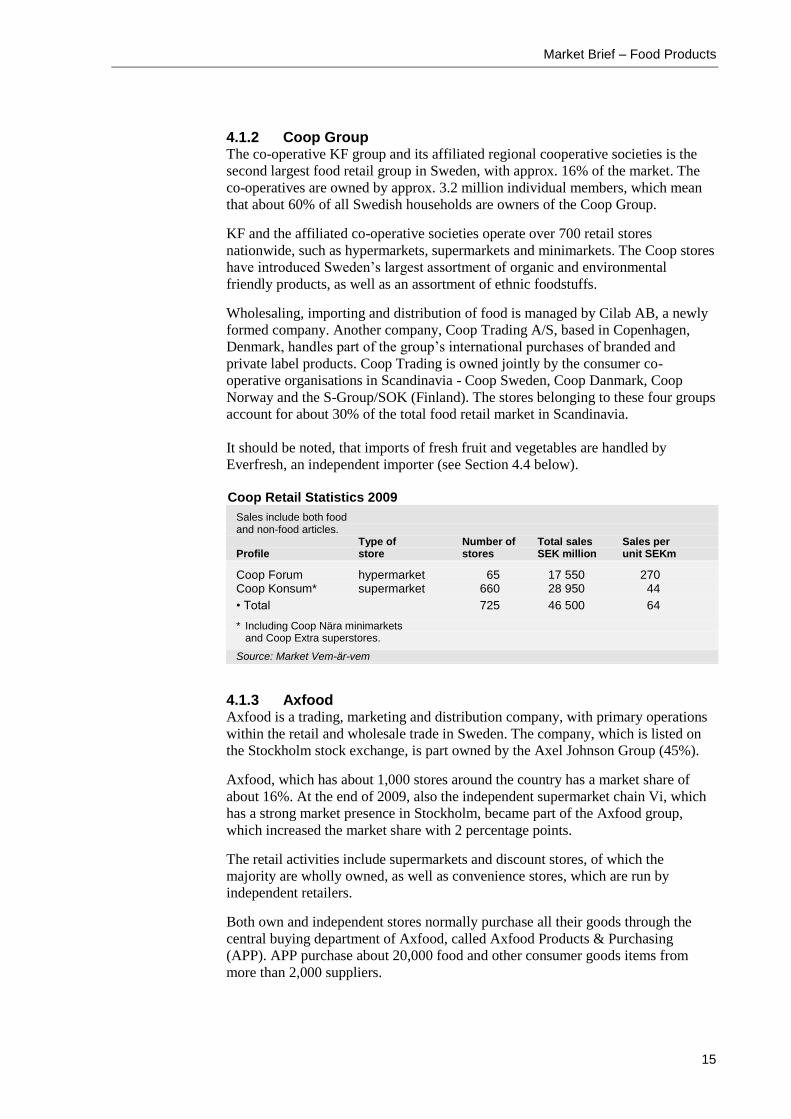
Coop Retail Statistics 2009
Sales include both food and non-food articles. Type of Number of Total sales Sales per Profile store stores SEK million unit SEKm
Coop Forum hypermarket 65 17 550 270 Coop Konsum* supermarket 660 28 950 44
• Total 725 46 500 64
* Including Coop Nära minimarkets and Coop Extra superstores.
Source: Market Vem-är-vem
4.1.3 Axfood Axfood is a trading, marketing and distribution company, with primary operations
within the retail and wholesale trade in Sweden. The company, which is listed on
the Stockholm stock exchange, is part owned by the Axel Johnson Group (45%).
Axfood, which has about 1,000 stores around the country has a market share of
about 16%. At the end of 2009, also the independent supermarket chain Vi, which
has a strong market presence in Stockholm, became part of the Axfood group,
which increased the market share with 2 percentage points.
The retail activities include supermarkets and discount stores, of which the
majority are wholly owned, as well as convenience stores, which are run by
independent retailers.
Both own and independent stores normally purchase all their goods through the
central buying department of Axfood, called Axfood Products & Purchasing
(APP). APP purchase about 20,000 food and other consumer goods items from
more than 2,000 suppliers.
Market Brief – Food Products
16
APP handles all imports (except fresh fruit and vegetables, which is conducted by
Saba Trading, see Section 4.4). APP is also responsible for the development of
private labels.
Axfood works closely with United Nordic, a part-owned company that import
items together with wholesalers in Denmark (Dagrofa/Supergros), Norway
(NorgesGruppen/Unil) and Finland (Tuko Logistics). The retail groups behind
United Nordic account for about 20% of the total Scandinavian food retail market.
Wholesale activities include Dagab, a logistics company for the retail operations,
and Axfood Närlivs wholesaler for the convenience store sector.
The Axel Johnson Group, which is Axfood’s largest owner, also owns Servera, a
wholesaler for the foodservice sector. In addition, Axel Johnson runs Åhléns,
Sweden’s only nationwide department store chain.
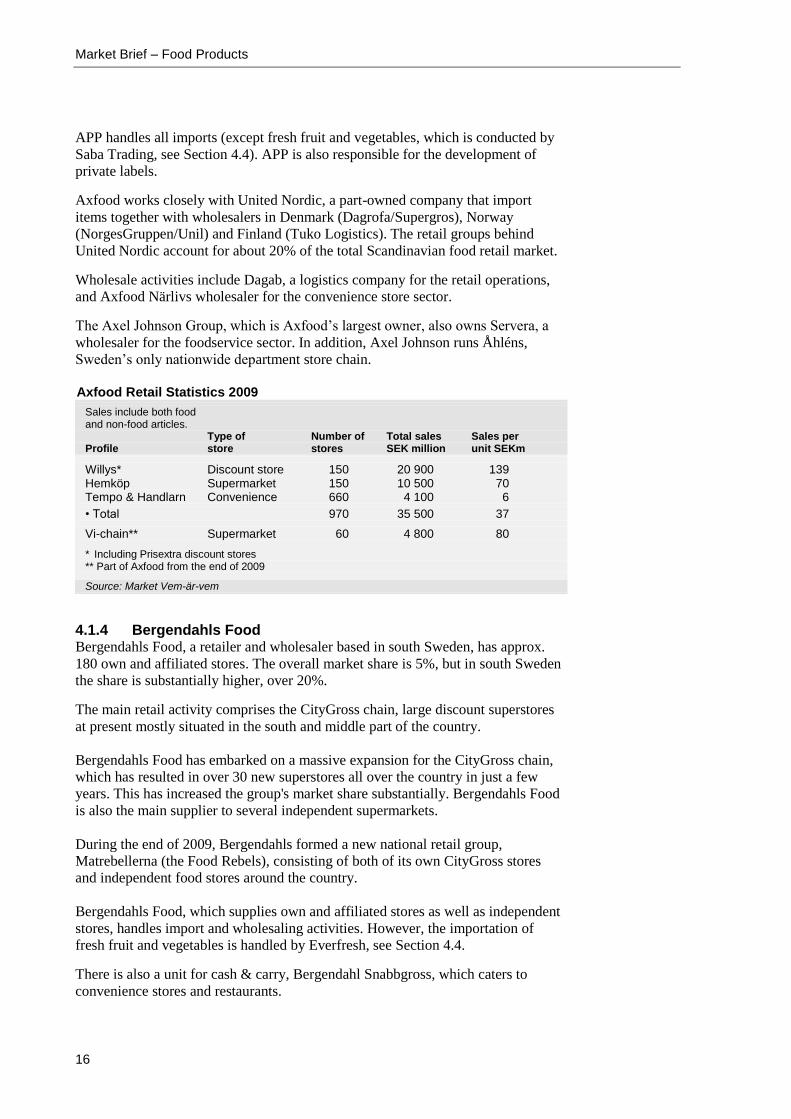
Axfood Retail Statistics 2009
Sales include both food and non-food articles. Type of Number of Total sales Sales per Profile store stores SEK million unit SEKm
Willys* Discount store 150 20 900 139 Hemköp Supermarket 150 10 500 70 Tempo & Handlarn Convenience 660 4 100 6
• Total 970 35 500 37
Vi-chain** Supermarket 60 4 800 80
* Including Prisextra discount stores ** Part of Axfood from the end of 2009
Source: Market Vem-är-vem
4.1.4 Bergendahls Food Bergendahls Food, a retailer and wholesaler based in south Sweden, has approx.
180 own and affiliated stores. The overall market share is 5%, but in south Sweden
the share is substantially higher, over 20%.
The main retail activity comprises the CityGross chain, large discount superstores
at present mostly situated in the south and middle part of the country.
Bergendahls Food has embarked on a massive expansion for the CityGross chain,
which has resulted in over 30 new superstores all over the country in just a few
years. This has increased the group's market share substantially. Bergendahls Food
is also the main supplier to several independent supermarkets.
During the end of 2009, Bergendahls formed a new national retail group,
Matrebellerna (the Food Rebels), consisting of both of its own CityGross stores
and independent food stores around the country.
Bergendahls Food, which supplies own and affiliated stores as well as independent
stores, handles import and wholesaling activities. However, the importation of
fresh fruit and vegetables is handled by Everfresh, see Section 4.4.
There is also a unit for cash & carry, Bergendahl Snabbgross, which caters to
convenience stores and restaurants.
Market Brief – Food Products
17
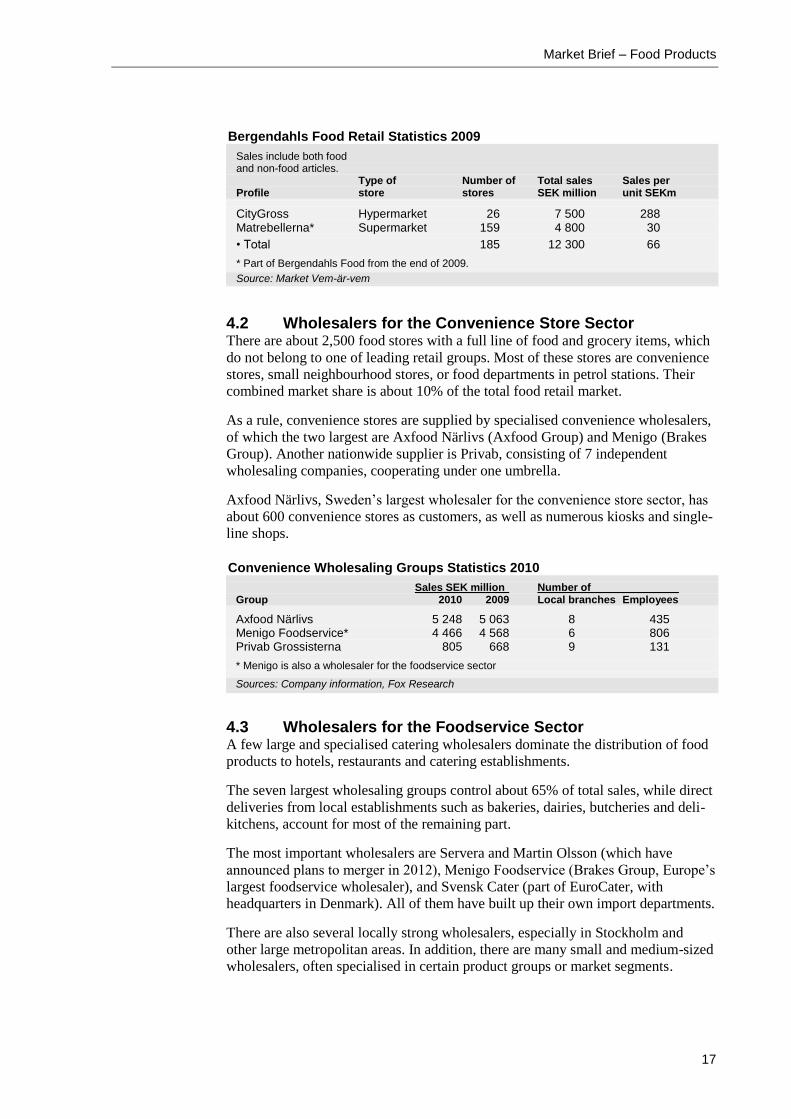
Bergendahls Food Retail Statistics 2009
Sales include both food and non-food articles. Type of Number of Total sales Sales per Profile store stores SEK million unit SEKm
CityGross Hypermarket 26 7 500 288 Matrebellerna* Supermarket 159 4 800 30
• Total 185 12 300 66
* Part of Bergendahls Food from the end of 2009.
Source: Market Vem-är-vem
4.2 Wholesalers for the Convenience Store Sector There are about 2,500 food stores with a full line of food and grocery items, which
do not belong to one of leading retail groups. Most of these stores are convenience
stores, small neighbourhood stores, or food departments in petrol stations. Their
combined market share is about 10% of the total food retail market.
As a rule, convenience stores are supplied by specialised convenience wholesalers,
of which the two largest are Axfood Närlivs (Axfood Group) and Menigo (Brakes
Group). Another nationwide supplier is Privab, consisting of 7 independent
wholesaling companies, cooperating under one umbrella.
Axfood Närlivs, Sweden’s largest wholesaler for the convenience store sector, has
about 600 convenience stores as customers, as well as numerous kiosks and single-
line shops.
Convenience Wholesaling Groups Statistics 2010
Sales SEK million Number of Group 2010 2009 Local branches Employees
Axfood Närlivs 5 248 5 063 8 435 Menigo Foodservice* 4 466 4 568 6 806 Privab Grossisterna 805 668 9 131
* Menigo is also a wholesaler for the foodservice sector
Sources: Company information, Fox Research
4.3 Wholesalers for the Foodservice Sector A few large and specialised catering wholesalers dominate the distribution of food
products to hotels, restaurants and catering establishments.
The seven largest wholesaling groups control about 65% of total sales, while direct
deliveries from local establishments such as bakeries, dairies, butcheries and deli-
kitchens, account for most of the remaining part.
The most important wholesalers are Servera and Martin Olsson (which have
announced plans to merger in 2012), Menigo Foodservice (Brakes Group, Europe’s
largest foodservice wholesaler), and Svensk Cater (part of EuroCater, with
headquarters in Denmark). All of them have built up their own import departments.
There are also several locally strong wholesalers, especially in Stockholm and
other large metropolitan areas. In addition, there are many small and medium-sized
wholesalers, often specialised in certain product groups or market segments.

Market Brief – Food Products
18
The most important of these companies are Dafgård (frozen foods), Arno Holm
(Asian foods), Trinity (delicatessen), and KåKå and Kobia (raw materials and
ingredients for bakeries, coffee houses and pastry shops).
Food Service Wholesaling Groups Statistics 2010
Sales SEK million Number of Group 2010 2009 Local branches Employees
Servera 7 072 6 743 14 1 590 Menigo Foodservice* 4 466 4 568 6 806 Svensk Cater 2 611 2 535 20 480 Martin Olsson 2 184 1 875 11 515 Dafgård** 1 934 1 989 1 951 KåKå 914 904 3 120 Kobia 474 437 3 88 ML Mårdskog & Lindkvist 426 416 2 87 Trinity 151 106 1 28 Arno Holm 136 138 2 33 Stiab 46 59 1 14
* Menigo includes wholesaling also to the convenience store sector ** Dafgård also includes manufacturing of frozen foods
Sources: Company information, Fox Research
Food Service Wholesaling Groups: Market Shares 2010
Company Market share %
Servera 28 Menigo 12 Svensk Cater 12 Martin Olsson 10 Other Wholesalers 38
• Total 100
Sources: Servera, Fox Research
4.4 Importers of Fresh Fruit and Vegetables Three groups, ICA Frukt & Grönt, Everfresh and Saba Trading, dominate imports
and distribution of fresh fruit and vegetables. All three companies are
headquartered in Helsingborg, in south Sweden.
ICA Frukt & Grönt, with an estimated 30% market share, is the buying division
within the ICA Group for all fresh fruit and vegetables. It also supplies independent
stores and restaurants.
Everfresh, subsidiary of Total Produce/Fyffes, with headquarters in Ireland, has in
recent years taken a large share of the Swedish market for fresh produce. New
customers include both Coop Sweden and the Bergendahls Group.
Saba Trading is one the leading Scandinavian importer and distributor of fruit,
vegetables and houseplants. The group is the main supplier of fresh produce to all
food stores within the Axfood group as well as to several leading convenience store
chains and large restaurant chains.
Saba Trading is a subsidiary of Dole, the world's largest producer and marketer of
fresh produce, and also one of the largest import companies within the European
market.

Market Brief – Food Products
19
There are also a large amount of medium and small importers/wholesalers of fresh
fruit and vegetables. However, as a rule these importers only buy their products
from other Scandinavian or European sources.
4.5 Importers of Alcoholic Beverages The selling of alcoholic beverages (wine, spirits and strong alcoholic beer) is
subjected to special rules in Sweden. A state monopoly, Systembolaget, has the
sole rights of over-the-counter retail sales. However, alcoholic beverages are also
sold through licensed restaurants.
Since a few years, import, production and wholesaling of alcoholic beverages is
open to all companies that have acquired a special alcoholic license. Imports are
now handled by some 700 licensed manufacturers, agents, importers, wholesalers
and breweries.
Licensed Importers of Alcoholic Beverages
Selected list of some large licensed importers of alcoholic beverages
Company
Company
Food Service Wholesalers
Servera Menigo Svensk Cater Martin Olsson Axfood Närlivs
Breweries Carlsberg Spendrups Åbro
Importers Systembolaget Altia (Finland) Fondberg & Co Chris Wine & Spirits Vin Trädgårdh Stellan Kramer Nigab (Hans Just, Denmark) Philipson Söderberg Maxxium Primewine
Source: Fox Research
Distribution to both Systembolaget's liquor stores and the restaurant sector is
carried out partly by Lagena (a subsidiary to Systembolaget) and partly by licensed
distributors.
4.6 Importers of Raw Materials and Food Ingredients Imports of raw materials and food ingredients to food manufacturers is conducted
either by importers and agents specialised in selling to this sector, or in the case of
large manufacturers, by the companies themselves.
Considering the many different kind of food materials and ingredients involved,
there are a large number of importers and agents involved in this field. Some of the
largest specialised importers of food ingredients are Norfoods, Boden & Lindeberg,
B. Engelhardt, and Smith & Son. Regarding bakery ingredients, also KåKå and
Kobia are important.
Several of the large manufacturers are also among the largest importers of raw
materials. This is especially the case for manufacturers of oils and fats (Aarhus
Karlshamn), animal feed (Lantmännen), spirits (V&S), juices (Arla Foods,
Skånemejerier, Milko), fish and seafood (Abba Seafood, Findus), frozen vegetables
(Findus, Procordia Food), coffee (Kraft, Nestlé, Löfbergs, Arvid Nordquist),
chocolate (Kraft, Cloetta), and herbs, spices and ethnic foods (Santa Maria).
Market Brief – Food Products
20
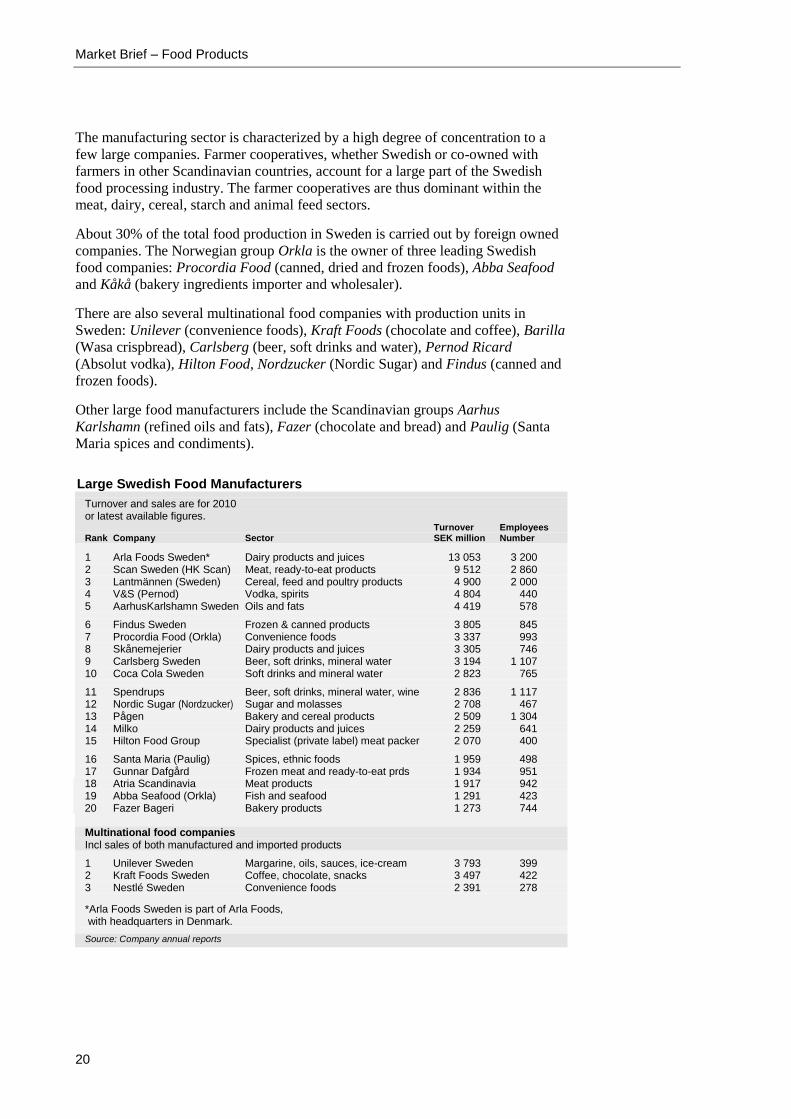
The manufacturing sector is characterized by a high degree of concentration to a
few large companies. Farmer cooperatives, whether Swedish or co-owned with
farmers in other Scandinavian countries, account for a large part of the Swedish
food processing industry. The farmer cooperatives are thus dominant within the
meat, dairy, cereal, starch and animal feed sectors.
About 30% of the total food production in Sweden is carried out by foreign owned
companies. The Norwegian group Orkla is the owner of three leading Swedish
food companies: Procordia Food (canned, dried and frozen foods), Abba Seafood
and Kåkå (bakery ingredients importer and wholesaler).
There are also several multinational food companies with production units in
Sweden: Unilever (convenience foods), Kraft Foods (chocolate and coffee), Barilla
(Wasa crispbread), Carlsberg (beer, soft drinks and water), Pernod Ricard
(Absolut vodka), Hilton Food, Nordzucker (Nordic Sugar) and Findus (canned and
frozen foods).
Other large food manufacturers include the Scandinavian groups Aarhus
Karlshamn (refined oils and fats), Fazer (chocolate and bread) and Paulig (Santa
Maria spices and condiments).
Large Swedish Food Manufacturers
Turnover and sales are for 2010 or latest available figures. Turnover Employees Rank Company Sector SEK million Number
1 Arla Foods Sweden* Dairy products and juices 13 053 3 200 2 Scan Sweden (HK Scan) Meat, ready-to-eat products 9 512 2 860 3 Lantmännen (Sweden) Cereal, feed and poultry products 4 900 2 000 4 V&S (Pernod) Vodka, spirits 4 804 440 5 AarhusKarlshamn Sweden Oils and fats 4 419 578
6 Findus Sweden Frozen & canned products 3 805 845 7 Procordia Food (Orkla) Convenience foods 3 337 993 8 Skånemejerier Dairy products and juices 3 305 746 9 Carlsberg Sweden Beer, soft drinks, mineral water 3 194 1 107 10 Coca Cola Sweden Soft drinks and mineral water 2 823 765
11 Spendrups Beer, soft drinks, mineral water, wine 2 836 1 117 12 Nordic Sugar (Nordzucker) Sugar and molasses 2 708 467 13 Pågen Bakery and cereal products 2 509 1 304 14 Milko Dairy products and juices 2 259 641 15 Hilton Food Group Specialist (private label) meat packer 2 070 400
16 Santa Maria (Paulig) Spices, ethnic foods 1 959 498 17 Gunnar Dafgård Frozen meat and ready-to-eat prds 1 934 951 18 Atria Scandinavia Meat products 1 917 942 19 Abba Seafood (Orkla) Fish and seafood 1 291 423 20 Fazer Bageri Bakery products 1 273 744 Multinational food companies Incl sales of both manufactured and imported products
1 Unilever Sweden Margarine, oils, sauces, ice-cream 3 793 399 2 Kraft Foods Sweden Coffee, chocolate, snacks 3 497 422 3 Nestlé Sweden Convenience foods 2 391 278
*Arla Foods Sweden is part of Arla Foods, with headquarters in Denmark.
Source: Company annual reports

Market Brief – Food Products
21
5 Market Access
As a full member of the European Union (EU), Sweden is also a part of the EU
customs union. This means that there are no trade barriers between Sweden and
other EU-countries.
All imports from countries outside the EU are subject to import tariffs, which vary
from 0 to 25%. Furthermore, some of these imports have to be delivered to the EU
on a quota basis.
However, developing countries enjoy preferential treatment under the Generalized
System of Preferences (GSP), which grants tariff reductions. Furthermore,
countries that are beneficiaries of the special incentive arrangement for sustainable
development and good governance (GSP+) enjoy duty free access for all products.
In addition, imports from the Least Developed Countries (LDCs) enjoy duty and
quota free access for most agricultural products, under the Everything But Arms
(EBA) arrangement.
EU regulations regarding food labelling, nutritional information, additives and food
control are now in effect in Sweden. However, under a transitional period, some
Swedish regulations will still be applicable.
More information about the EU customs duties, regulations and other market
requirements can be obtained from the EU Export Helpdesk for Developing
Countries as well as from other EU sites, see box below. See also Appendix 6, for
more links to other national and European agencies.
Internet sites about EU customs duties and regulations
EU Export Helpdesk for Developing Countries http://exporthelp.europa.eu/ EU Bilateral Trade Relations http://ec.europa.eu/trade/creating-opportunities/bilateral-relations EU General Systems of Preferences (GSP) http://ec.europa.eu/trade/issues/global/gsp/index_en.htm
6 Market Prospects
Imports of food products have increased considerably since Sweden joined the EU
and imports now account for over one third of total food consumption.
A substantial part of imports, about 40%, consists of products that are not (or
cannot be) produced within the country, such as juice, coffee, wine, tea, cocoa, and
certain vegetables and fruits, as well as fresh fish and seafood products. But an
increasing part of imports constitute of products that are competing with
domestically produced items.
EU and OECD countries supply the largest part of imports. In fact, only 10% are
imported from developing countries. The main imported items from developing
countries consist of fresh produce (e.g. citrus fruit, bananas and other tropical fruit,
as well as vegetables), bulk items that are mixed and repacked in consumer
packages by domestic packers (e.g. juice, nuts and spices), and raw materials for
domestic manufacturers, such as green coffee, oils and fats, and animal feed
ingredients.

Market Brief – Food Products
22
In recent years, imports from developing countries have also constituted a
reasonably large amount of processed food and beverage products, such as canned
fruit, canned seafood, frozen vegetables, sauces, and wine.
A market characteristic is that health, environmental and social issues have started
to play a significant role in the food trade. Organic and Fair Trade labelled
products have therefore achieved a relatively large share in a short period. At the
same time products that are seen as healthy and nutritious have shown significant
sales increases in recent years.
Another trend is the interest for ethnic food with an authentic exotic taste. Several
ethnic food items have therefore been among the fastest growing product
categories within the retail trade.
The positive trend for organic, fair trade, nutritious, or ethnic products is expected
to maintain over the next few years, which means that new suppliers are needed,
including suppliers in developing countries.
The prospects for exporters in developing countries wishing to enter the Swedish
market depend on the type of product in question. Obviously, there will be a
continued demand for products, which either are not at all produced within the EU,
or only produced within the EU during part of the year.
On the other hand, exporters that have to compete with suppliers within the EU can
only expect a successful entry into the Swedish market if superior quality and/or
favourable prices can be offered.
In conclusion, interesting prospects exist for exporters in developing countries who
can supply quality products at competitive prices.
Market Brief – Food Products
23
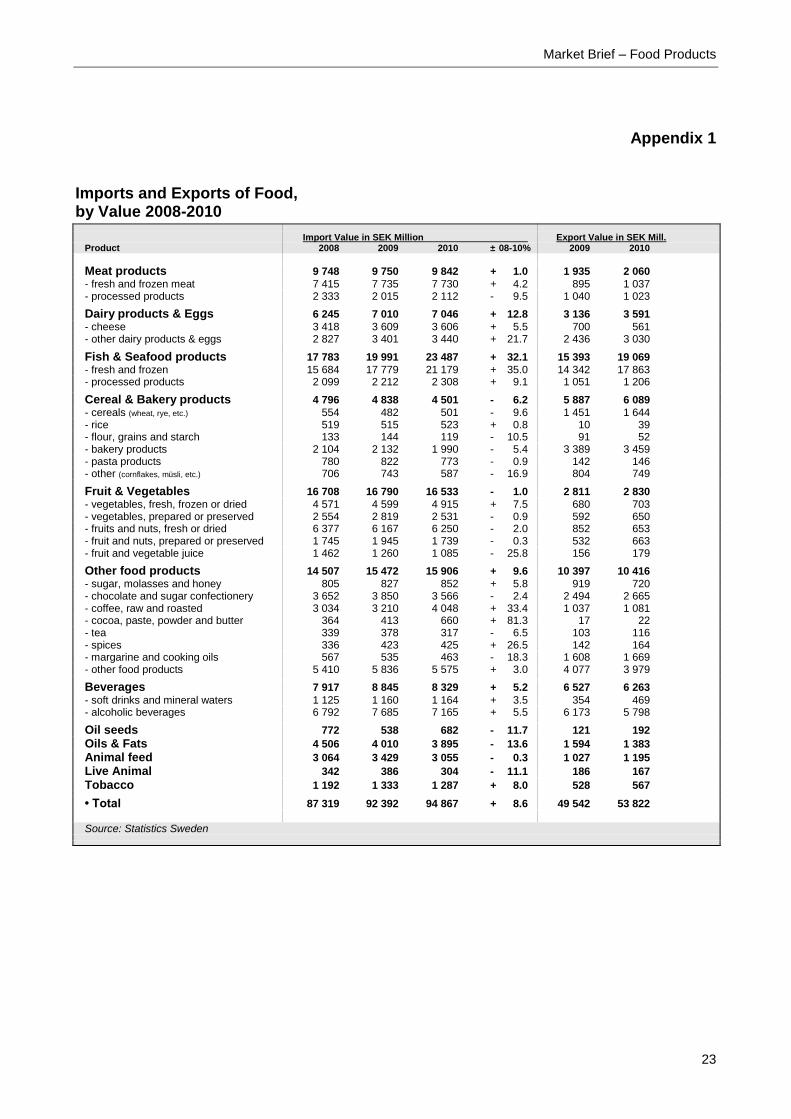
Appendix 1 Imports and Exports of Food, by Value 2008-2010
Import Value in SEK Million Export Value in SEK Mill. Product 2008 2009 2010 ± 08-10% 2009 2010
Meat products 9 748 9 750 9 842 + 1.0 1 935 2 060
- fresh and frozen meat 7 415 7 735 7 730 + 4.2 895 1 037 - processed products 2 333 2 015 2 112 - 9.5 1 040 1 023
Dairy products & Eggs 6 245 7 010 7 046 + 12.8 3 136 3 591
- cheese 3 418 3 609 3 606 + 5.5 700 561 - other dairy products & eggs 2 827 3 401 3 440 + 21.7 2 436 3 030
Fish & Seafood products 17 783 19 991 23 487 + 32.1 15 393 19 069
- fresh and frozen 15 684 17 779 21 179 + 35.0 14 342 17 863 - processed products 2 099 2 212 2 308 + 9.1 1 051 1 206
Cereal & Bakery products 4 796 4 838 4 501 - 6.2 5 887 6 089
- cereals (wheat, rye, etc.) 554 482 501 - 9.6 1 451 1 644 - rice 519 515 523 + 0.8 10 39 - flour, grains and starch 133 144 119 - 10.5 91 52 - bakery products 2 104 2 132 1 990 - 5.4 3 389 3 459 - pasta products 780 822 773 - 0.9 142 146 - other (cornflakes, müsli, etc.) 706 743 587 - 16.9 804 749
Fruit & Vegetables 16 708 16 790 16 533 - 1.0 2 811 2 830
- vegetables, fresh, frozen or dried 4 571 4 599 4 915 + 7.5 680 703 - vegetables, prepared or preserved 2 554 2 819 2 531 - 0.9 592 650 - fruits and nuts, fresh or dried 6 377 6 167 6 250 - 2.0 852 653 - fruit and nuts, prepared or preserved 1 745 1 945 1 739 - 0.3 532 663 - fruit and vegetable juice 1 462 1 260 1 085 - 25.8 156 179
Other food products 14 507 15 472 15 906 + 9.6 10 397 10 416
- sugar, molasses and honey 805 827 852 + 5.8 919 720 - chocolate and sugar confectionery 3 652 3 850 3 566 - 2.4 2 494 2 665 - coffee, raw and roasted 3 034 3 210 4 048 + 33.4 1 037 1 081 - cocoa, paste, powder and butter 364 413 660 + 81.3 17 22 - tea 339 378 317 - 6.5 103 116 - spices 336 423 425 + 26.5 142 164 - margarine and cooking oils 567 535 463 - 18.3 1 608 1 669 - other food products 5 410 5 836 5 575 + 3.0 4 077 3 979
Beverages 7 917 8 845 8 329 + 5.2 6 527 6 263
- soft drinks and mineral waters 1 125 1 160 1 164 + 3.5 354 469 - alcoholic beverages 6 792 7 685 7 165 + 5.5 6 173 5 798
Oil seeds 772 538 682 - 11.7 121 192
Oils & Fats 4 506 4 010 3 895 - 13.6 1 594 1 383
Animal feed 3 064 3 429 3 055 - 0.3 1 027 1 195
Live Animal 342 386 304 - 11.1 186 167
Tobacco 1 192 1 333 1 287 + 8.0 528 567
• Total 87 319 92 392 94 867 + 8.6 49 542 53 822 Source: Statistics Sweden

Market Brief – Food Products
24
Appendix 2
Imports of Certain Prepared and Processed Food Products,
by Value 2008-2010
Value in SEK Million Product 2008 2009 2010 ± 08-10 %
Meat products
- Dried and salted meat products 324 365 359 + 11 - Charcuterie and delicatessen 562 614 749 + 33 Dairy products
- Cheese 3 413 3 609 3 606 + 6 Fish and Seafood products
- Fish fillets 3 056 3 679 3 786 + 24 - Dried, salted or smoked fish 2 640 1 998 2 430 - 8 - Prepared and prepared fish products 1 180 1 187 1 155 - 2 - Prepared and processed seafood products 919 1 025 1 153 + 25 Cereal based products
- Bakery products 2 104 2 132 1 990 - 5 - Pasta products 780 822 773 - 1 - Cornflakes, popped popcorn (maize) 753 720 675 - 10 Fruit and Vegetable products
- Prepared and processed vegetables, frozen 526 558 552 + 5 - Prepared and processed vegetables, canned or dried 1 848 2 078 1 813 - 2 - Jams and marmalade 295 288 259 - 12 - Prepared and processed fruit and nuts 879 974 863 - 2 - Fruit and vegetable juice 1 462 1 260 1 085 - 26 Other food products
- Sugar 424 397 463 + 9 - Chocolate and sugar confectionery 3 652 3 850 3 566 - 2 - Roasted and instant coffee 340 417 492 + 45 - Tea 324 360 300 - 7 - Cocoa paste, powder and butter 363 413 660 + 82 - Sauces 1 215 1 376 1 347 + 11 - Vegetable oils and fats 640 530 576 - 10 Beverages
- Beer and cider 821 879 802 - 2 - Wine 4 461 4 990 4 678 + 5 - Spirits 1 332 1 601 1 528 + 15 Source: Statistics Sweden
Market Brief – Food Products
25
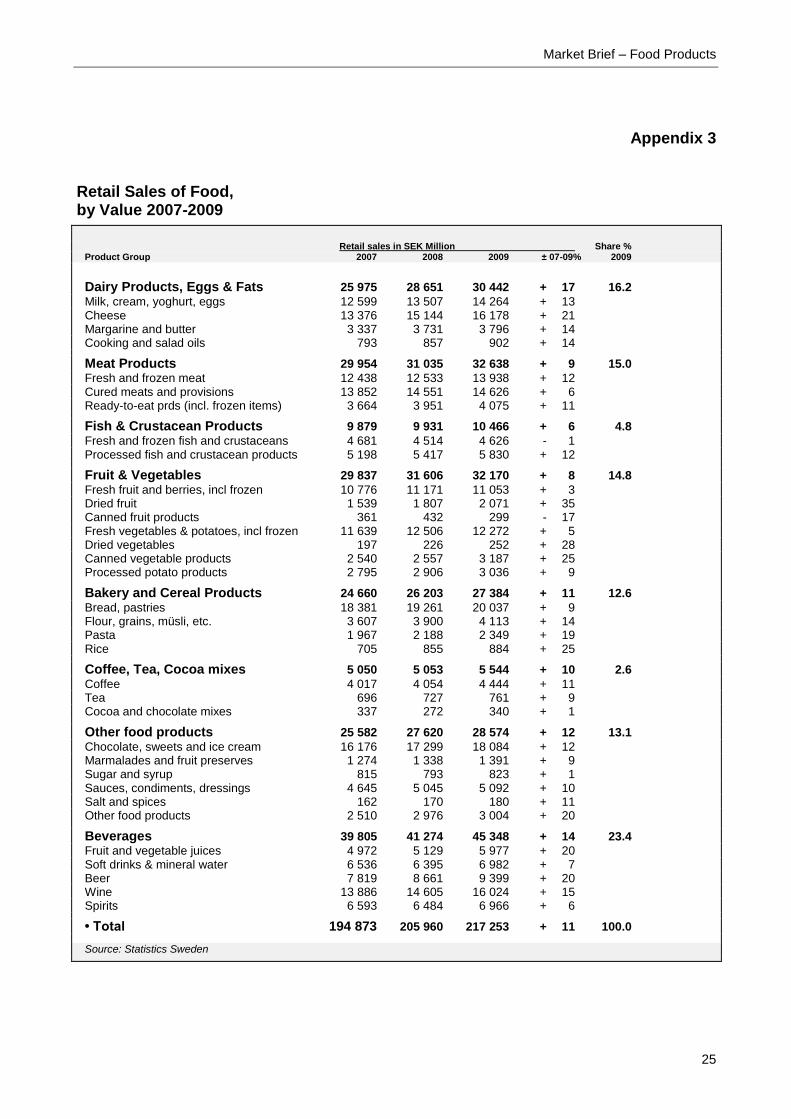
Appendix 3
Retail Sales of Food, by Value 2007-2009
Retail sales in SEK Million Share % Product Group 2007 2008 2009 ± 07-09% 2009
Dairy Products, Eggs & Fats 25 975 28 651 30 442 + 17 16.2
Milk, cream, yoghurt, eggs 12 599 13 507 14 264 + 13 Cheese 13 376 15 144 16 178 + 21 Margarine and butter 3 337 3 731 3 796 + 14 Cooking and salad oils 793 857 902 + 14
Meat Products 29 954 31 035 32 638 + 9 15.0
Fresh and frozen meat 12 438 12 533 13 938 + 12 Cured meats and provisions 13 852 14 551 14 626 + 6 Ready-to-eat prds (incl. frozen items) 3 664 3 951 4 075 + 11
Fish & Crustacean Products 9 879 9 931 10 466 + 6 4.8
Fresh and frozen fish and crustaceans 4 681 4 514 4 626 - 1 Processed fish and crustacean products 5 198 5 417 5 830 + 12
Fruit & Vegetables 29 837 31 606 32 170 + 8 14.8
Fresh fruit and berries, incl frozen 10 776 11 171 11 053 + 3 Dried fruit 1 539 1 807 2 071 + 35 Canned fruit products 361 432 299 - 17 Fresh vegetables & potatoes, incl frozen 11 639 12 506 12 272 + 5 Dried vegetables 197 226 252 + 28 Canned vegetable products 2 540 2 557 3 187 + 25 Processed potato products 2 795 2 906 3 036 + 9
Bakery and Cereal Products 24 660 26 203 27 384 + 11 12.6
Bread, pastries 18 381 19 261 20 037 + 9 Flour, grains, müsli, etc. 3 607 3 900 4 113 + 14 Pasta 1 967 2 188 2 349 + 19 Rice 705 855 884 + 25
Coffee, Tea, Cocoa mixes 5 050 5 053 5 544 + 10 2.6
Coffee 4 017 4 054 4 444 + 11 Tea 696 727 761 + 9 Cocoa and chocolate mixes 337 272 340 + 1
Other food products 25 582 27 620 28 574 + 12 13.1
Chocolate, sweets and ice cream 16 176 17 299 18 084 + 12 Marmalades and fruit preserves 1 274 1 338 1 391 + 9 Sugar and syrup 815 793 823 + 1 Sauces, condiments, dressings 4 645 5 045 5 092 + 10 Salt and spices 162 170 180 + 11 Other food products 2 510 2 976 3 004 + 20
Beverages 39 805 41 274 45 348 + 14 23.4
Fruit and vegetable juices 4 972 5 129 5 977 + 20 Soft drinks & mineral water 6 536 6 395 6 982 + 7 Beer 7 819 8 661 9 399 + 20 Wine 13 886 14 605 16 024 + 15 Spirits 6 593 6 484 6 966 + 6
• Total 194 873 205 960 217 253 + 11 100.0
Source: Statistics Sweden

Market Brief – Food Products
26
Appendix 4 Direct Consumption of Food, by Quantity 2006-2009
Per capita consumption kg Total Consumption, tonnes Product Group 2006 2007 2008 2009 2008 2009
Dairy Products, Eggs & Fats 183.2 179.8 179.3 178.1 1 652 300 1 655 900 Milk, cream, yoghurt, milk powder 142.5 139.1 138.8 137.1 1 279 300 1 274 500 Cheese 17.8 17.7 17.8 18.0 163 800 167 300 Eggs 10.0 9.6 10.0 10.1 92 300 94 000 Margarine and butter 10.9 11.6 11.2 11.6 103 200 107 600 Cooking and salad oils 2.0 1.8 1.5 1.3 13 700 12 500
Meat Products 83.5 83.5 82.8 81.9 764 400 761 600 Fresh and frozen meat 42.5 43.8 46.1 46.5 425 400 432 300 Cured meats and provisions 24.1 23.3 23.8 23.3 219 800 216 800 Ready-to-eat products (incl. frozen items) 16.9 16.4 12.9 12.1 119 200 112 500
Fish & Seafood Products* 25.3* 26.4* 25.2 25.4 238 000 245 000 Fresh, chilled or frozen fish and seafood* 13.0* 13.6* 13.7* 14.0* 132 400* 138 800* Prepared or preserved fish 10.4 10.8 9.5 9.3 87 300 86 900 Prepared and preserved seafood 1.9 2.0 2.0 2.1 18 300 19 300
Fruit & Vegetable Products 238.7 240.2 238.3 231.2 2 205 200 2 147 000 Fresh fruit and berries 64.4 65.3 64.1 57.4 597 500 533 200 Frozen fruit 0.7 0.8 0.8 1.1 7 800 10 000 Canned and dried fruit 5.5 5.5 5.5 4.8 51 300 44 800 Marmalades and fruit preserves 7.8 7.4 7.5 7.3 68 700 67 600 Fruit juices and nectars (litres) 21.8 23.6 22.0 22.0 202 800 202 800 Nuts and almonds 2.3 2.5 2.6 2.7 24 300 25 300 Fresh vegetables (excl. potatoes) 54.9 52.9 53.0 53.9 489 100 501 200 Frozen and dried vegetables 6.0 6.2 6.2 6.1 57 100 56 400 Canned vegetables 14.9 15.3 16.3 15.9 149 800 147 900 Fresh potatoes 45.9 44.9 44.5 44.7 410 700 415 400 Frozen and canned potato products 8.6 9.0 9.0 8.9 83 200 82 900 Potato mixes (incl. starch) 0.7 0.6 0.6 0.6 5 900 5 400 Potato chips 1.4 1.6 1.7 1.8 15 800 17 100 Soups, made from fruit and vegetables 3.8 4.6 4.5 4.0 41 200 37 000
Bakery Products 75.2 72.3 76.5 77.6 705 000 722 000 Soft bread & pastries 66.3 63.8 68.4 69.5 630 300 646 800 Crisp bread, rusks 3.8 3.5 3.5 3.6 32 700 33 200 Biscuits 5.1 5.0 4.6 4.5 42 100 41 800
Cereal Products 30.8 30.2 33.3 32.2 307 100 301 300 Flour (mostly wheat and rye) 7.7 7.4 10.1 10.1 92 700 94 200 Oat grains, incl. other cereal grains 2.9 3.4 3.0 2.8 28 100 26 700 Mixes 1.3 1.3 1.3 1.2 11 800 11 300 Müsli, cornflakes, popcorn 4.1 3.7 4.0 3.5 37 300 32 900 Pasta 9.5 8.8 9.0 9.4 83 100 87 800 Rice 5.4 5.6 5.9 5.2 54 100 48 400
Coffee, Tea, Cocoa 10.8 11.2 11.2 11.3 103 200 105 700 Coffee 8.5 8.4 8.3 8.2 76 700 76 700 Tea 0.2 0.4 0.4 0.4 3 700 3 800 Cocoa and chocolate mixes 2.1 2.4 2.5 2.7 22 800 25 200
Other food products 49.5 52.5 52.6 53.8 485 900 501 500 Confectionery (chocolate and sweets) 15.1 15.6 15.7 15.1 145 200 140 800 Sugar and syrup 6.9 6.7 6.7 6.9 61 500 64 400 Honey 0.7 0.7 0.6 0.6 5 300 5 800 Sauces and dressings 11.7 14.7 15.9 18.0 147 000 167 500 Mustard, spices and salt 2.9 3.0 2.7 2.8 25 500 26 500 Ice cream 12.2 11.8 11.0 10.4 101 400 96 500
Beverages (litres) 178.5 176.7 172.4 177.0 1 589 300 1 646 400 Soft drinks & mineral water (litres) 101.2 98.6 95.6 98.1 881 600 912 500 Beer (litres) 54.1 53.6 52.2 53.0 481 100 492 500 Wine and spirits (litres) 23.2 24.5 24.6 25.9 226 600 241 400
* Figures from 2000 are based on estimated data.
Source: Swedish Board of Agriculture

Market Brief – Food Products
27
Appendix 5 Facts about Retail Groups ICA Group
Parent Company ICA AB Ownership ICA AB is owned by Hakon Invest AB (40 percent) and the Netherlands-based Royal Ahold N.V. (60 percent). Due to shareholders' agreement, neither party has control of ICA AB, and both share equal voting power. Hakon Invest is majority owned (67%) by the ICA Association, which in turn is owned by the ICA-retailers in Sweden. Royal Ahold is a holding company that conducts retail operations, primarily in Europe and the US. Turnover SEK 93,860 million (2010), including Norway and the Baltic countries Headquarters Stockholm
Retail Sweden
Parent company ICA Sverige AB Total retail sales SEK 92,970 million (2010), including privately owned ICA-stores Headquarters Stockholm Internet site www.ica.se
KF Group (Coop Sverige)
Parent Company Kooperativa Förbundet (KF), the Swedish Co-operative Union Turnover SEK 36,660 million (2010) Headquarters Stockholm, Sweden
Food Retailing
Division KF Grocery Retail Group Turnover SEK 32,540 million (2010) Total retail sales SEK 46,500 million (2009), including affiliated regional cooperatives Headquarters Stockholm Internet site www.coop.se
Axfood
Parent Company Axfood AB Ownership Axel Johnson AB (46%), Others (54%) Turnover SEK 34,260 million (2010) Total retail sales SEK 40,300 million (2009), including affiliated stores Internet www.axfood.se
Axel Johnson Group
Parent Company Axel Johnson AB Headquarters Stockholm Internet site www.axeljohnson.se
Bergendahls Food
Parent Company Bergendahl & Son AB Group Turnover SEK 9,999 million (Sep 2009/Aug 2010)
Bergendahls Food
Turnover SEK 9,099 million (Sep 2009/Aug 2010) Total retail sales SEK 12,300 million (2009), including affiliated stores Headquarters Hässleholm (South Sweden) Internet site www.bergendahls.se

Market Brief – Food Products
28
Appendix 6
Useful Internet Links
Information about the EU EU Export Helpdesk http://exporthelp.europa.eu Information about duty rates, import regulations and trade data EU Trade Relations http://ec.europa.eu/trade EU official website http://europa.eu/index_en.htm EU Statistics – Eurostat http://epp.eurostat.ec.europa.eu EU Food Safety http://ec.europa.eu/food/index_en.htm CBI Centre for Promotions www.cbi.eu
Information about Sweden Sweden’s official website www.sweden.se Open Trade Gate Sweden www.opentradegate.se Trade rules and requirements
National Food Administration www.slv.se/en-gb Food safety and regulations Board of Agriculture www.sjv.se Statistics Sweden www.scb.se Swedish Trade Federation www.svenskhandel.se (enter English) Swedish Chambers of Commerce www.swedishchambers.se Business contacts, market information National Board of Trade www.kommers.se Swedish Associations of Agents www.agenturforetagen.se Network for agents and brokers Swedish Food Federation www.li.se
Other useful links eMarket Services Online business directory www.emarketservices.com FAO - Food and Agriculture Org. www.fao.org
Appendix 7
Currency Conversion
Average exchange rate of the Swedish currency SEK
Average rate in SEK
2005 2006 2007 2008 2009 2010 2011*
1 Euro € 9.28 9.26 9.25 9.61 10.62 9.54 8.89 1 US Dollar $ 7.35 7.48 6.76 6.58 7.65 7.20 6.42
* Average rate for January – April 2011
Source: Swedish Central Bank (Riksbanken)
January 2010
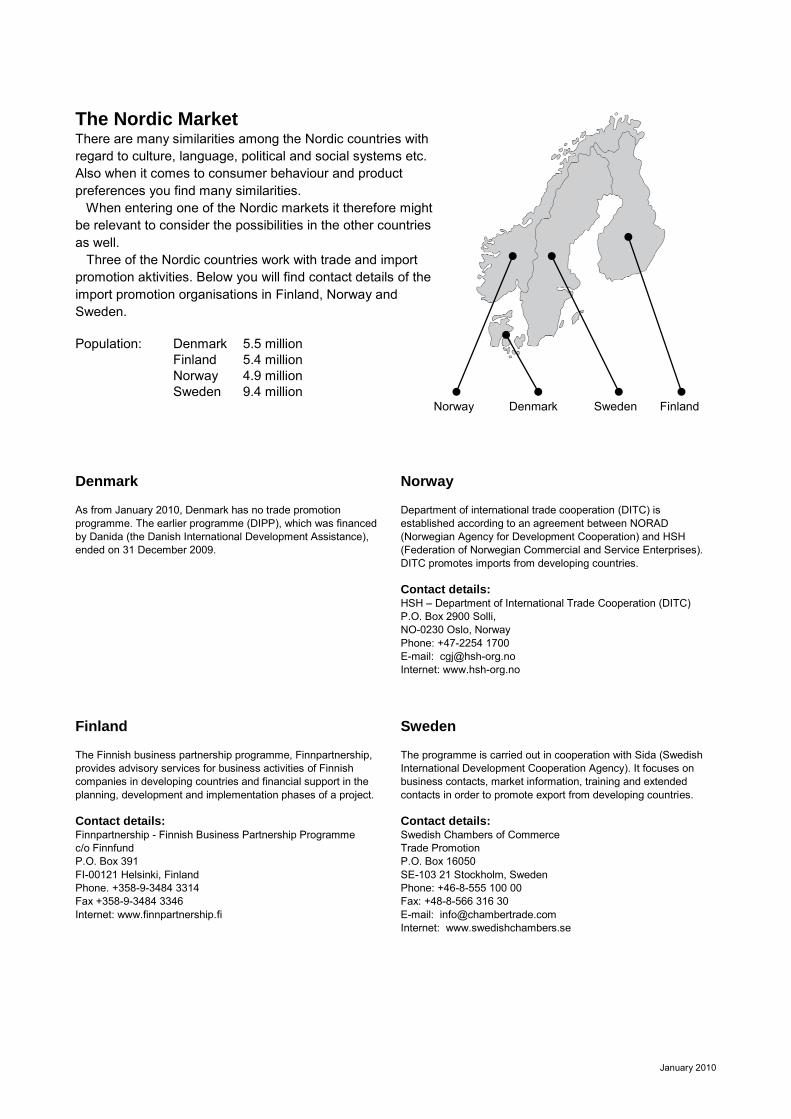
The Nordic Market There are many similarities among the Nordic countries with regard to culture, language, political and social systems etc. Also when it comes to consumer behaviour and product preferences you find many similarities. When entering one of the Nordic markets it therefore might be relevant to consider the possibilities in the other countries as well. Three of the Nordic countries work with trade and import promotion aktivities. Below you will find contact details of the import promotion organisations in Finland, Norway and Sweden. Population: Denmark 5.5 million Finland 5.4 million Norway 4.9 million Sweden 9.4 million
Norway Denmark Sweden Finland Denmark
As from January 2010, Denmark has no trade promotion programme. The earlier programme (DIPP), which was financed by Danida (the Danish International Development Assistance), ended on 31 December 2009.
Norway
Department of international trade cooperation (DITC) is established according to an agreement between NORAD (Norwegian Agency for Development Cooperation) and HSH (Federation of Norwegian Commercial and Service Enterprises). DITC promotes imports from developing countries. Contact details: HSH – Department of International Trade Cooperation (DITC) P.O. Box 2900 Solli, NO-0230 Oslo, Norway Phone: +47-2254 1700 E-mail: [email protected] Internet: www.hsh-org.no
Finland The Finnish business partnership programme, Finnpartnership, provides advisory services for business activities of Finnish companies in developing countries and financial support in the planning, development and implementation phases of a project. Contact details: Finnpartnership - Finnish Business Partnership Programme c/o Finnfund P.O. Box 391 FI-00121 Helsinki, Finland Phone. +358-9-3484 3314 Fax +358-9-3484 3346 Internet: www.finnpartnership.fi
Sweden
The programme is carried out in cooperation with Sida (Swedish International Development Cooperation Agency). It focuses on business contacts, market information, training and extended contacts in order to promote export from developing countries. Contact details: Swedish Chambers of Commerce Trade Promotion P.O. Box 16050 SE-103 21 Stockholm, Sweden Phone: +46-8-555 100 00 Fax: +48-8-566 316 30 E-mail: [email protected] Internet: www.swedishchambers.se

Swedish Chambers of CommerceTrade promotionPO Box 160 50SE-103 21 Stockholm, Sweden
Phone: +46 (0)8 555 100 000
The production and distribution of this report is funded by Sida (Swedish International Development Cooperation Agency).