
MARKET A SSESSMENT
57
MARKET ASSESSMENT NOVEMBER 2017 | VERSION 1 Kitson Mill and Uptown Greenwood City of Greenwood , SC
Transcript of MARKET A SSESSMENT

M A R K E T A S S E S S M E N T
NOVEMBER 2017 | VERSION 1
K i t s o n M i l l a n d U p t o w n G r e e n w o o d
City of G r e e n w o o d , S C

Page intentionally left blank.

City of Greenwood, SC
November 2017
i Kimley-Horn
Final Report Kitson Mill and Uptown Greenwood Study
Market Assessment
Contents
Project Overview .......................................................................................................................................................................... 1
Economic Anchors ....................................................................................................................................................................... 3
Demographic Profile ..................................................................................................................................................................... 6
Population .................................................................................................................................................................................................... 6
Households .................................................................................................................................................................................................. 9
Tapestry Segmentation Analysis ............................................................................................................................................................... 12
Employment Profile .................................................................................................................................................................... 15
Annualized Employment Growth Trends ................................................................................................................................................... 15
Annualized Wages by Industry .................................................................................................................................................................. 19
Commuting Patterns .................................................................................................................................................................................. 21
Residential Profile ...................................................................................................................................................................... 23
Residential Building Permits ...................................................................................................................................................................... 23
Housing Overview ...................................................................................................................................................................................... 24
For-Sale Housing ....................................................................................................................................................................................... 27
Rental Housing .......................................................................................................................................................................................... 29
Non-Residential Profile .............................................................................................................................................................. 31
Retail .......................................................................................................................................................................................................... 31
Office .......................................................................................................................................................................................................... 33
Light Industrial/Flex .................................................................................................................................................................................... 33
Population and Employment Forecasts ...................................................................................................................................... 35
Population .................................................................................................................................................................................................. 35
Employment ............................................................................................................................................................................................... 36
Kitson Mill Study Area Demand Forecasts ................................................................................................................................. 39
Residential ................................................................................................................................................................................................. 39
Retail .......................................................................................................................................................................................................... 39
Office .......................................................................................................................................................................................................... 42
Light Industrial/Flex .................................................................................................................................................................................... 44

City of Greenwood, SC
November 2017
ii Kimley-Horn
Final Report Kitson Mill and Uptown Greenwood Study
Market Assessment
Kitson Mill Site and Uptown Greenwood Captures .................................................................................................................... 46
Residential ................................................................................................................................................................................................. 46
Retail .......................................................................................................................................................................................................... 47
Office .......................................................................................................................................................................................................... 48
Light Industrial/Flex .................................................................................................................................................................................... 50

City of Greenwood, SC
November 2017
iii Kimley-Horn
Final Report Kitson Mill and Uptown Greenwood Study
Market Assessment
Listing of Tables
Table 1: Comparison of Population Trends, 2000-2016 ............................................................................................................... 7
Table 2: Comparison of Household Trends, 2000-2016............................................................................................................... 9
Table 3: Annualized Employment by Industry, Greenwood µSA, 2011-2016 ............................................................................ 16
Table 4: Annualized Employment by Industry, Greenwood County, 2011-2016 ........................................................................ 17
Table 5: Annualized Employment by Industry, Kitson Mill Study Area, 2009-2014 .................................................................... 18
Table 6: Annualized Average Wages, Greenwood µSA, 2011-2016 ......................................................................................... 20
Table 7: Annualized Average Wages, Greenwood County, 2000-2016 ..................................................................................... 21
Table 8: Comparison of Housing Unit Trends, 2000-2016 ......................................................................................................... 24
Table 9: Retail Leakage/Surplus, Greenwood µMSA, 2017 ...................................................................................................... 33
Table 10: Employment Forecast by Industry, Greenwood County, 2016-2030 .......................................................................... 38
Table 11: Residential Forecast, Kitson Mill Study Area, 2016-2030 .......................................................................................... 39
Table 12: Retail Demand Forecast, Greenwood County, 2016-2030 ......................................................................................... 41
Table 13: Net New Retail Demand, Greenwood County, 2016-2030 ......................................................................................... 42
Table 14: Office-Occupying Employment Forecast, Greenwood County, 2016-2030 ................................................................ 43
Table 15: Net New Office Demand, Greenwood County, 2016-2030 ......................................................................................... 43
Table 16: Net New Office Demand, Kitson Mill Study Area, 2016-2030 .................................................................................... 44
Table 17: Light Industrial-Occupying Employment Forecast, Greenwood County, 2016-2030 .................................................. 44
Table 18: Net New Light Industrial Demand, Greenwood County, 2016-2030 ........................................................................... 45
Table 19: Net New Light Industrial Demand, Kitson Mill Study Area, 2016-2030....................................................................... 45
City of Greenwood, SC
November 2017
iv Kimley-Horn
Final Report Kitson Mill and Uptown Greenwood Study
Market Assessment
Listing of Graphs
Graph 1: Comparison of Median Age Trends, 2010-2016 ............................................................................................................ 7
Graph 2: Comparison of Shares of Population by Age Cohort, 2016 ........................................................................................... 8
Graph 3: Ethnic Diversity, Study Area, 2016 ................................................................................................................................ 8
Graph 4: Comparison of Educational Attainment, 2016 ............................................................................................................... 9
Graph 5: Comparison of Average Household Size, 2000-2016 ................................................................................................. 10
Graph 6: Comparison Shares of Household by Number of Occupants, 2010 ............................................................................ 10
Graph 7: Comparison of Median Household Income, 2000-2016 .............................................................................................. 11
Graph 8: Comparison of Share of Households by Income Cohort, 2016 ................................................................................... 12
Graph 9: Share of Households by Tapestry Segment, Study Area, 2016 .................................................................................. 12
Graph 10: Annualized Net Job Growth, Greenwood µSA, 2006-2015 ....................................................................................... 15
Graph 11: Residential Building Permit Trends, Greenwood µSA, 2005-2016 ........................................................................... 23
Graph 12: Residential Building Permit Trends, Greenwood County, 2005-2016 ....................................................................... 24
Graph 13: Comparison of Share of Housing Units by Decade Completed, 2014 ....................................................................... 25
Graph 14: Housing Units by Type, Greenwood County, 2000-2014 .......................................................................................... 25
Graph 15: Comparison of Housing Units by Type, 2014 ............................................................................................................ 26
Graph 16: Housing Unit Tenure, Kitson Mill Study Area, 2000-2016 ......................................................................................... 26
Graph 17: Comparison of Housing Unit Tenure, 2016 ............................................................................................................... 27
Graph 18: Comparison of Owner-Occupied Housing by Value, 2016 ........................................................................................ 27
Graph 19: For-Sale Housing Units by Asking Price Range, 2017 .............................................................................................. 28
Graph 20: Average For-Sale Asking Price by Number of Bedrooms, 2017 ............................................................................... 28
Graph 21: Comparison of Renter-Occupied Units by Contract Rent Range, 2016 .................................................................... 29
Graph 22: Share of Existing Apartment Inventory by Decade Completed, Greenwood, 2017 ................................................... 29
Graph 23: Quoted Lease Rate versus Suite Size, City of Greenwood, 2017 ............................................................................. 32
Graph 24: Quoted Sale Price versus Building Size, City of Greenwood, 2017 .......................................................................... 34
Graph 25: Population Forecasts, Greenwood County, 2016-2030 ............................................................................................. 35
Graph 26: Population Forecasts, Kitson Mil Study Area, 2016-2030 ......................................................................................... 36
Graph 27: Employment Forecasts, Greenwood County, 2016-2030 .......................................................................................... 37
Graph 28: Household Forecast, Greenwood County, 2016-2030 .............................................................................................. 40
Graph 29: Average Household Income, Greenwood County, 2016-2030 .................................................................................. 41

November 2017
Final Report Kitson Mill and Uptown Greenwood Study
City of Greenwood, SC
1 Kimley-Horn
Market Assessment
Project Overview
In collaboration with Benchmark, Kimley-Horn was retained by the City of Greenwood to conduct a market assessment as part
of an analysis of Uptown and the former Kitson Mill site (also known as Greenwood Mill #5). This analysis documents existing
conditions from a demographic and real estate market perspective, and, ultimately, forecasts supportable residential and
commercial demand for the two areas.
Located in Greenwood County, the City of Greenwood is approximately 55 miles southeast of Greenville and 75 miles west of
Columbia. According to the US Census Bureau, the City has a total area of 1.4 miles, served primarily by US 221 and US 78,
as well as State Routes 72 and 34. Greenwood is located between the Saluda and Savannah rivers, offering recreational
opportunities within one hour of Uptown.
As previously noted, there are two focus areas for this market analysis: first, Uptown Greenwood, and secondly, the Kitson Mill
property. Uptown is oriented around Greenwood’s central business district and encompasses the Main Street square, with the
eastern limit being Phoenix Street and the western limit being Edgefield Avenue. This area is designated the Uptown
Greenwood Special Tax District and includes approximately 13 city blocks and 57 acres of property. The special tax district is
governed by the Uptown Greenwood Development Corporation (UGDC). The district was recently expanded for the first time
since its creation in 1984 to include a 53,000-square-foot, 6-acre shopping center across the railroad tracks directly north of
the previous northern border of Uptown Greenwood.
In the past several years, Uptown Greenwood has experienced growth especially in its dining and entertainment venues, such
as the Mill House and neighboring brewery. A building that formerly housed a textile mill and J.C. Penney was also recently
redeveloped for mixed-use including retail on the first floor and condominiums for sale ranging from $250,000 to $298,000 on
the upper floors.
Also within Uptown Greenwood is an arts and cultural district branded as the Emerald Triangle, which contains the
Greenwood Museum, Greenwood Community Theatre, Uptown Market, and Greenwood Federal Building, a historically
significant building that is home to the Uptown Greenwood Development Corporation (UGDC) and the Arts Council of
Greenwood County. In addition to these organizations, there is a wide variety of uses in Uptown Greenwood, including local
restaurants, bars, commercial businesses and shops, professional and medical offices, small businesses, and a hotel. Main
Street, which bisects Uptown Greenwood, is purportedly the widest in the country as a result of five major railroads that once
ran through the center of the city.
November 2017
Final Report Kitson Mill and Uptown Greenwood Study
City of Greenwood, SC
2 Kimley-Horn
Market Assessment
Uptown Greenwood is home to two annual festivals that attract visitors from around the state and region. The award-winning
South Carolina Festival of Flowers began as a 100th anniversary celebration of the George W. Park Seed Company in 1968,
and celebrated its 50th year in June 2017. The economic impact of the festival totaled $3.3 million in 2016 and reached a
record of over 80,000 visitors in recent years. As part of the festival, 40-plus topiaries are arranged throughout the square. The
South Carolina Festival of Discovery, which includes a music component called the Greenwood Blues Cruise, also takes place
in Uptown Greenwood. It was founded in 2000 as a celebration of the state’s history and culture. In 2016, the festival had an
estimated economic impact of more than $2.1 million and an estimated attendance of 38,000 visitors.
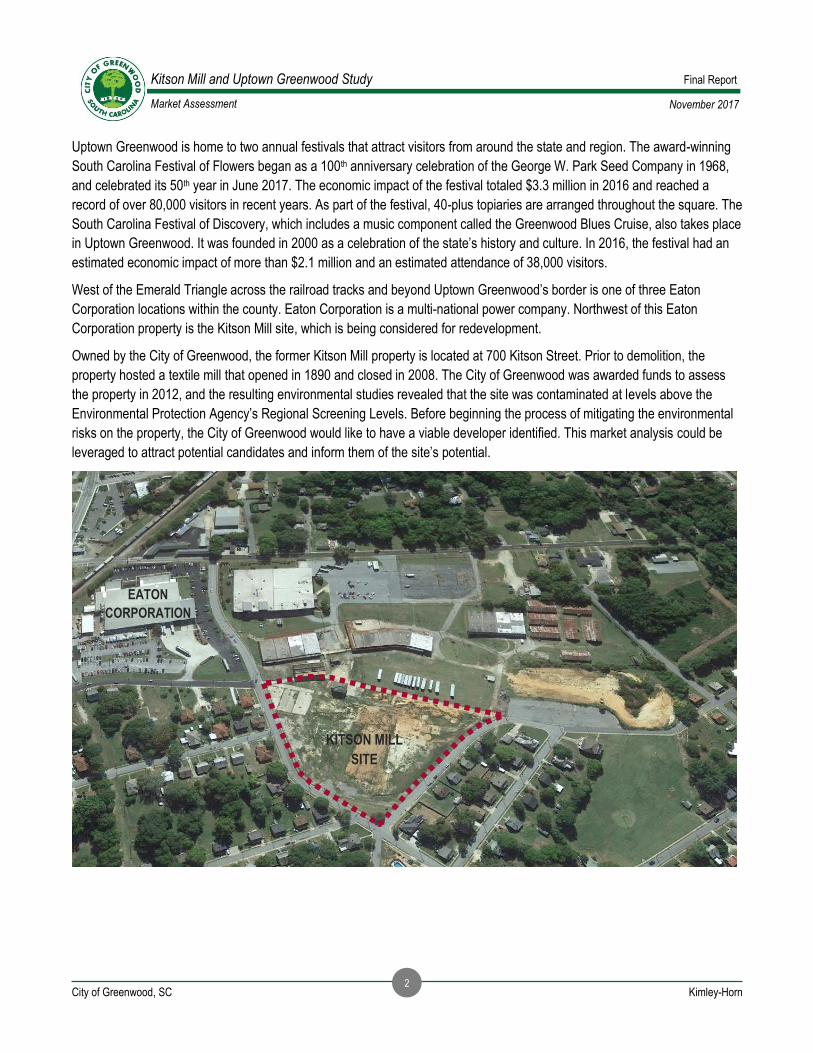
West of the Emerald Triangle across the railroad tracks and beyond Uptown Greenwood’s border is one of three Eaton
Corporation locations within the county. Eaton Corporation is a multi-national power company. Northwest of this Eaton
Corporation property is the Kitson Mill site, which is being considered for redevelopment.
Owned by the City of Greenwood, the former Kitson Mill property is located at 700 Kitson Street. Prior to demolition, the
property hosted a textile mill that opened in 1890 and closed in 2008. The City of Greenwood was awarded funds to assess
the property in 2012, and the resulting environmental studies revealed that the site was contaminated at levels above the
Environmental Protection Agency’s Regional Screening Levels. Before beginning the process of mitigating the environmental
risks on the property, the City of Greenwood would like to have a viable developer identified. This market analysis could be
leveraged to attract potential candidates and inform them of the site’s potential.
EATON
CORPORATION
KITSON MILL
SITE

November 2017
Final Report Kitson Mill and Uptown Greenwood Study
City of Greenwood, SC
3 Kimley-Horn
Market Assessment
Economic Anchors
Lander University
Located north of Uptown Greenwood within city limits on a 190-acre campus, Lander University is the second smallest
publicly-funded university in South Carolina. Founded in 1872 as Williamstown Female College, the institution moved to its
current location in 1904 and was renamed after its founder. The school began admitting male students in 1943 and
transitioned from a private institution to being state-funded in 1973. It has since undergone several expansions and additions,
including an update to old facilities, new housing complexes, athletic fields, and parking lots.
Lander University hosts approximately 560 employees, including 123 full-time faculty members, and nearly 2,700 students
enrolled in more than 60 undergraduate programs and handful of graduate and continuing education programs. The school
primarily attracts students from a seven-county upstate mega-region: Greenville, Laurens, Edgefield, Abbeville, McCormick,
Newberry, and Saluda. In 2015, the university’s endowment totaled $16.1 million.
Self Regional Healthcare
Self Regional Healthcare is a not-for-profit, regional-referral hospital that anchors the City of Greenwood’s medical district off
South Main Street. It is surrounded by several medical offices and related businesses. The hospital is the largest employer in
Greenwood County with nearly 2,300 employees. It was founded in 1951 by textile industry leader and prominent local
philanthropist, James C. Self. Services currently provided include acute and tertiary care, cancer care, neurosurgery, heart
and vascular surgery, NICU, orthopedics, genetics, and prevention and wellness care. The 450-bed hospital has an affiliate
network, Self Medical Group, which has 25 primary and specialty care practices consisting of over 75 physicians.

November 2017
Final Report Kitson Mill and Uptown Greenwood Study
City of Greenwood, SC
4 Kimley-Horn
Market Assessment
Greenwood Genetics Center
Founded in 1974, the Greenwood Genetics Center (GGC) is a non-profit medical organization that provides clinical genetic
services, diagnostic laboratory testing, educational programs, and genetics research. GGC has approximately 170 employees
and provides over 27,000 lab tests annually. Earlier this year, a $5.4 million expansion was announced to add new testing
equipment and laboratory technologists and scientists. Satellite offices are located in Charleston, Columbia, Florence, and
Greenville. The GGC campus is west of Self Regional Health care and there are other medical offices within and adjacent to
the campus, including the Carolina Health Children’s Center and Western Carolina Oral Surgery.
Initially announced in 2013, the GGC campus received its first academic addition this year when the Clemson Center for
Human Genetics opened in the newly constructed Self Regional Hall. This state-of-the-art facility is 17,000 square feet and
houses eight laboratories, several classrooms, conference rooms, and offices. The facility sits on 15 acres that were donated
by Greenwood County. Reportedly, Clemson paid for the project through $5 million in economic development bonds and $1.5
million was contributed by Greenwood County. Self Regional Healthcare also awarded the Clemson Center and GGC $5.6
million to support genetics research, including $2 million to help create an endowed chair at the new human genetics facility.

November 2017
Final Report Kitson Mill and Uptown Greenwood Study
City of Greenwood, SC
5 Kimley-Horn
Market Assessment
Manufacturing Industry
Greenwood and the larger county and upstate region have a long history of manufacturing that is rooted in the textile industry.
The county was the hardest hit in the country during the recession after several factories and mills, the backbone of the
region’s economy, closed during the time period from 2006 to 2010. The poverty rate more than doubled during this time,
reaching 24%, the largest increase in the country. In the years since, local boosters and leaders have made a deliberate effort
to diversify and have been successful in expanding industries, such as food processing, advanced materials, wood products,
and healthcare. In 2016, over 20% of the county workforce remained employed in the manufacturing sector.
Major manufacturing employers in the region include Eaton Corporation (1,275 local employees), which has three locations in
the county; Fujifilm Manufacturing U.S.A. (1,000 employees), which was established in Greenwood in 1988 and announced in
2014 that it would invest over $50 million in its local headquarters; Capsugel (600 employees), which opened a $3 million,
9,600-square-foot Quality Control Laboratory; and Colgate-Palmolive (300 employees), which finished construction in 2016 on
its $196-million, 525,000-square-foot manufacturing plant that will create approximately 300 jobs.

November 2017
Final Report Kitson Mill and Uptown Greenwood Study
City of Greenwood, SC
6 Kimley-Horn
Market Assessment
Demographic Profile
This section analyzes population and household trends by age, income, and tenure for the 2-county Greenwood micropolitan
statistical area (µSA), and more specifically for Greenwood County and a study area surrounding Kitson Mill and Uptown
Greenwood. Ethnic diversity, educational attainment, and high-level lifestyle preferences through a Tapestry Segmentation
analysis are also provided. Geographies used in this analysis demonstrate both regional and localized shifts in population
characteristics. Understanding these shifts is important to accurately project future real estate demand for the Kitson Mill
Study Area. For the purpose of this analysis, geographies are described as follows:
• The Greenwood µSA, a two-county area designated by the United States Office of Budget and Management, is
the largest micropolitan area in the state of South Carolina. It is included in the Greenville-Spartanburg-Anderson, SC
Combined Statistical Area.
• Since many third-party sources, including the State of South Carolina, provide trend and forecast scenarios on a
county-wide basis, measures for Greenwood County have been included in this analysis. Greenwood County
currently comprises approximately 74% of the two-county µSA region’s population base.
• The focus of this analysis, the Kitson
Mill Study Area, contains over 2,000
acres and was defined to encompass both
Uptown Greenwood and the Kitson Mill
site. The Study Area is roughly defined by
the city boundary and N Mathis Street to
the west, Laurel Avenue West to the north,
Cokesbury and New Market Streets to the
east, and Marshall Road and Epting
Avenue to the south. This analysis relies
on a larger study area to determine
momentum in the surrounding
neighborhoods that could generate
additional future demand for the two target
areas.
Population
The Kitson Mill Study Area had an estimated 9,271
residents in 2016 (Table 1). The population stayed
relatively stable from 2000 to 2016 with the number
of new residents roughly offsetting any losses over
the 16-year period. Comparatively, population in
Greenwood County experienced a modest increase
of 4.4% since 2000 and the larger µSA experienced
a growth rate of 2.2%. Map 1: Kitson Mill Study Area, 2017
November 2017
Final Report Kitson Mill and Uptown Greenwood Study
City of Greenwood, SC
7 Kimley-Horn
Market Assessment
Table 1: Comparison of Population Trends, 2000-2016
Median Age
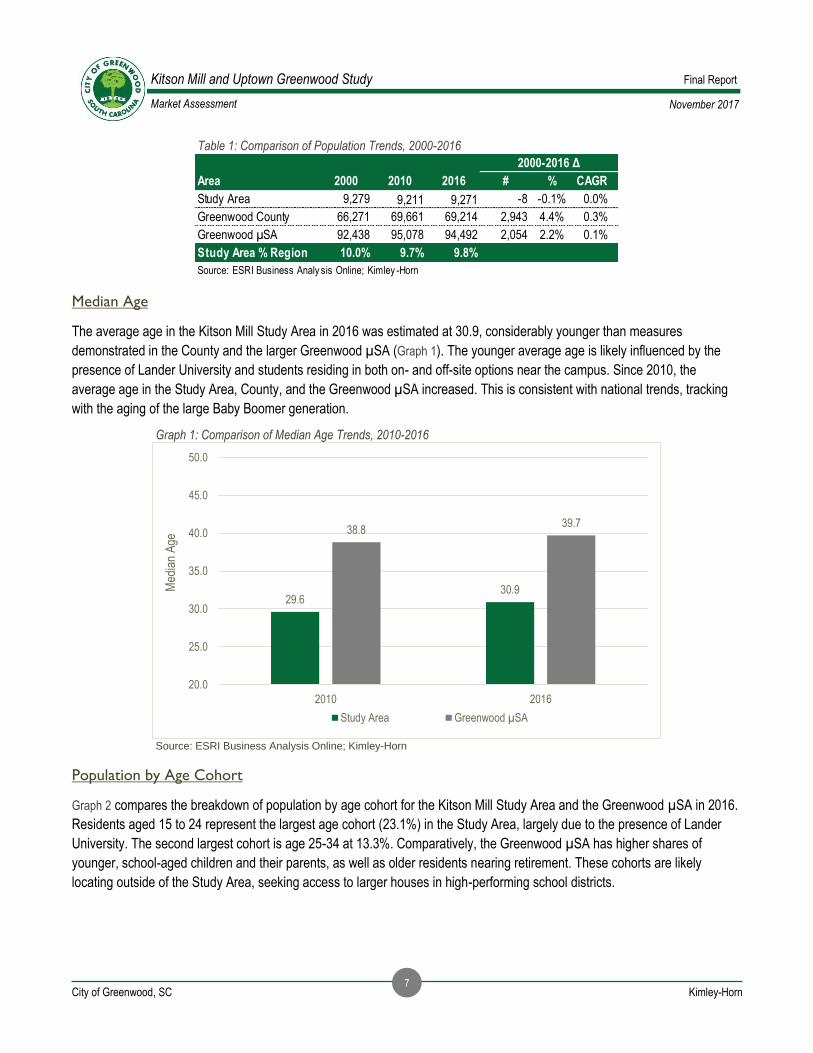
The average age in the Kitson Mill Study Area in 2016 was estimated at 30.9, considerably younger than measures
demonstrated in the County and the larger Greenwood µSA (Graph 1). The younger average age is likely influenced by the
presence of Lander University and students residing in both on- and off-site options near the campus. Since 2010, the
average age in the Study Area, County, and the Greenwood µSA increased. This is consistent with national trends, tracking
with the aging of the large Baby Boomer generation.
Graph 1: Comparison of Median Age Trends, 2010-2016
Source: ESRI Business Analysis Online; Kimley-Horn
Population by Age Cohort
Graph 2 compares the breakdown of population by age cohort for the Kitson Mill Study Area and the Greenwood µSA in 2016.
Residents aged 15 to 24 represent the largest age cohort (23.1%) in the Study Area, largely due to the presence of Lander
University. The second largest cohort is age 25-34 at 13.3%. Comparatively, the Greenwood µSA has higher shares of
younger, school-aged children and their parents, as well as older residents nearing retirement. These cohorts are likely
locating outside of the Study Area, seeking access to larger houses in high-performing school districts.
Area 2000 2010 2016 # % CAGR
Study Area 9,279 9,211 9,271 -8 -0.1% 0.0%
Greenwood County 66,271 69,661 69,214 2,943 4.4% 0.3%
Greenwood µSA 92,438 95,078 94,492 2,054 2.2% 0.1%
Study Area % Region 10.0% 9.7% 9.8%
Source: ESRI Business Analy sis Online; Kimley -Horn
2000-2016 Δ
29.630.9
38.839.7
20.0
25.0
30.0
35.0
40.0
45.0
50.0
2010 2016
Med
ian
Age
Study Area Greenwood µSA

November 2017
Final Report Kitson Mill and Uptown Greenwood Study
City of Greenwood, SC
8 Kimley-Horn
Market Assessment
Graph 2: Comparison of Shares of Population by Age Cohort, 2016
Source: ESRI Business Analysis Online; Kimley-Horn
Ethnic Diversity
Graph 3 shows the racial makeup of the Kitson Mill Study Area in 2016. The total population is comprised of similar shares of
residents that identify as White (42%) and as Black (45%). As a point of comparison, about 62% of the population in the
County and 64% in the µSA are White. Another 10% of the population in the Study Area identify as some other race. Not
noted in the graph below are residents of Hispanic origin, which can identify with any race. Approximately 13.6% of Study
Area residents are of Hispanic Origin, compared to 4.8% for the whole region.
Source: ESRI Business Analysis Online; Kimley-Horn
0.0%
5.0%
10.0%
15.0%
20.0%
25.0%S
hare
of T
otal
Pop
ulat
ion
Study Area Greenwood µSA
Graph 3: Ethnic Diversity, Study Area, 2016

November 2017
Final Report Kitson Mill and Uptown Greenwood Study
City of Greenwood, SC
9 Kimley-Horn
Market Assessment
Educational Attainment
Graph 4 compares educational attainment in the Kitson Mill Study Area with the larger Greenwood µSA for population over the
age of 25. The Study Area has a comparatively higher share of residents with less than a high school diploma, but also out-
performs for the share of residents with graduate or professional degrees. The higher share of residents with a graduate
degree could be influenced by proximity to Lander University and Self Region’s main hospital campus. In total, approximately
39.7% of the population in the Kitson Mill Study Area has completed at least some level of higher education while 49.2% has
in the larger Greenwood µSA.
Graph 4: Comparison of Educational Attainment, 2016
Source: ESRI Business Analysis Online; Kimley-Horn
Households
The Kitson Mill Study Area had an estimated 3,340 households in 2016, a slight decline from 3,397 in 2000. Similar to
population trends, the Study Area’s overall capture of regional growth slightly decreased from 3.7% in 2000 to 3.5% in 2016
(Table 2). During the same time period, Greenwood County increased by 8.2% and the Greenwood µSA grew by 2.2%,
revealing that the region’s growth was primarily concentrated in Greenwood County, outside of the Study Area.
Table 2: Comparison of Household Trends, 2000-2016
0.0%
5.0%
10.0%
15.0%
20.0%
25.0%
30.0%
35.0%Study Area Greenwood µSA
Area 2000 2010 2016 # % CAGR
Study Area 3,397 3,262 3,340 -57 -1.7% -0.1%
Greenwood County 25,729 27,547 27,846 2,117 8.2% 0.5%
Greenwood µSA 92,438 95,078 94,492 2,054 2.2% 0.1%
Study Area % Region 3.7% 3.4% 3.5%
Source: ESRI Business Analy sis Online; Kimley -Horn
2000-2016 Δ

November 2017
Final Report Kitson Mill and Uptown Greenwood Study
City of Greenwood, SC
10 Kimley-Horn
Market Assessment
Household Size
Nationally, the increase in Millennial and Baby Boomer residents has caused a gradual decline in average household size. All
three geographies exhibited this pattern from 2000 to 2016, with the Study Area experiencing a small drop in household size
from 2.36 to 2.33. Greenwood County experienced the largest decline dropping from 2.49 to 2.39. Households with children
are a minority in all three geographies: 26% in the Study Area and 31% in both Greenwood County and the µSA.
Graph 5: Comparison of Average Household Size, 2000-2016
Source: ESRI Business Analysis Online; Kimley-Horn
As shown in Graph 6, one-person households are the most common in the Study Area, followed by two-person households.
Households with two or fewer members make up 66% of households in the Study Area, slightly more than the µSA (63%).
The most prevalent household size in the µSA is two-person.
Graph 6: Comparison Shares of Household by Number of Occupants, 2010
Source: ESRI Business Analysis Online; Kimley-Horn
2.362.49 2.49
2.33 2.39 2.41
0.0
0.5
1.0
1.5
2.0
2.5
3.0
Study Area Greenwood County Greenwood µSA
Per
sons
per
Hou
seho
ld
2000
2016
37.2%
28.6%
15.2%
18.9%
27.7%
34.6%
17.1%
20.6%
0.0%
5.0%
10.0%
15.0%
20.0%
25.0%
30.0%
35.0%
40.0%
1-Person 2-Person 3-Person 4+ Person
Sha
re o
f Hou
seho
lds
Study Area
Greenwood µSA
November 2017
Final Report Kitson Mill and Uptown Greenwood Study
City of Greenwood, SC
11 Kimley-Horn
Market Assessment
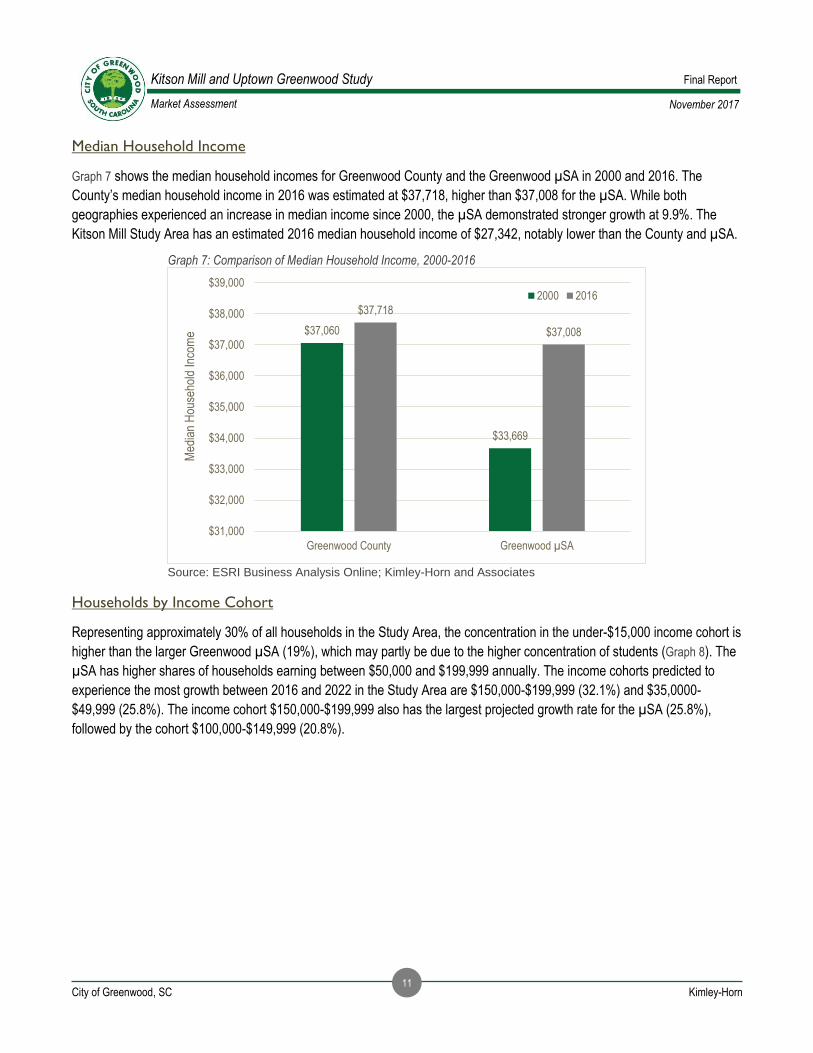
Median Household Income
Graph 7 shows the median household incomes for Greenwood County and the Greenwood µSA in 2000 and 2016. The
County’s median household income in 2016 was estimated at $37,718, higher than $37,008 for the µSA. While both
geographies experienced an increase in median income since 2000, the µSA demonstrated stronger growth at 9.9%. The
Kitson Mill Study Area has an estimated 2016 median household income of $27,342, notably lower than the County and µSA.
Graph 7: Comparison of Median Household Income, 2000-2016
Source: ESRI Business Analysis Online; Kimley-Horn and Associates
Households by Income Cohort
Representing approximately 30% of all households in the Study Area, the concentration in the under-$15,000 income cohort is
higher than the larger Greenwood µSA (19%), which may partly be due to the higher concentration of students (Graph 8). The
µSA has higher shares of households earning between $50,000 and $199,999 annually. The income cohorts predicted to
experience the most growth between 2016 and 2022 in the Study Area are $150,000-$199,999 (32.1%) and $35,0000-
$49,999 (25.8%). The income cohort $150,000-$199,999 also has the largest projected growth rate for the µSA (25.8%),
followed by the cohort $100,000-$149,999 (20.8%).
$37,060
$33,669
$37,718
$37,008
$31,000
$32,000
$33,000
$34,000
$35,000
$36,000
$37,000
$38,000
$39,000
Greenwood County Greenwood µSA
Med
ian
Hou
seho
ld In
com
e
2000 2016

November 2017
Final Report Kitson Mill and Uptown Greenwood Study
City of Greenwood, SC
12 Kimley-Horn
Market Assessment
Graph 8: Comparison of Share of Households by Income Cohort, 2016
Source: ESRI Business Analysis Online; Kimley-Horn
Tapestry Segmentation Analysis
Tapestry segmentation, provided by Environmental Systems Research Institute, divides households into 67 groups based on
consumer spending patterns and lifestyle attributes. Data provided in this type of analysis is increasingly being used by
developers, builders, and retail tenants in the site selection and due diligence process.
Small Town Simplicity comprises the largest tapestry segment at 26.0%, followed by Hardscrabble Road at 16.1%. The most
influential tapestry segments in the Study Area represent residents who are cost-conscious, have mixed feelings towards
technology, and typically seek multiunit rentals and single-family housing products. Brief descriptions of the four most common
tapestries in the Kitson Mill Study Area are provided below.
0.0%
5.0%
10.0%
15.0%
20.0%
25.0%
30.0%
35.0%S
hare
of H
ouse
hold
sStudy Area Greenwood µSA
Graph 9: Share of Households by Tapestry Segment, Study Area, 2016

November 2017
Final Report Kitson Mill and Uptown Greenwood Study
City of Greenwood, SC
13 Kimley-Horn
Market Assessment
SMALLTOWN SIMPLICITY (26.0%)
In these neighborhoods, the lifestyle is down-to-earth and semirural, with television for entertainment and news, and emphasis on convenience for both young parents and senior citizens. This is an older market, with almost half of the householders aged
55 years or older, and predominantly single-person households.
Housing Preference: Single-Family
Defining Traits
• Median home value of $88,000 is about half the US median
• Labor force participation lower at 51%, which could result from lack of jobs or retirement
• Education: 65% with high school diploma or some college
• Connected, but not to the latest or greatest gadgets; keep their landlines
• Community-oriented residents; more conservative than middle-of-the-road
HARDSCRABBLE ROAD (16.1%)
Neighborhoods defined as Hardscrabble Road are commonly located in urbanized areas within central cities, with older housing, located chiefly in the Midwest and South. The market is primarily comprised of families, married couples, and single
parents. Younger, highly diverse, and less educated, they work mainly in service, manufacturing, and retail trade industries.
Defining Traits
Housing Preference: Single-Family
• Older housing, built before 1960 with a higher proportion built in the 1940s or earlier
• Four-fifths of owned homes valued under $100,000
• Renters: About three-fifths of households
• Cost-conscious consumers purchase sale items in bulk and buy generic over name brands
• Save money for a specific purpose, and have little extra money to invest
COLLEGE TOWNS (13.7%)
About half the residents of College Towns are enrolled in college, while the rest work for a college or the services that support it. The market is primarily made up of nonfamily households with over three-quarters of the households are renter-occupied. College Towns are all about new experiences, tend to be bike and pedestrian friendly, and residents seek out
variety and adventure in their lives.
Defining Traits
Housing Preference: Multi-unit Rentals & Single Family
• Off-campus, low rent apartments comprise half of the housing stock
• One-third of homes are single family; mostly occupied by local residents who own their homes
• Median household income ($28,000) and median net worth ($11,000) are significantly below the US medians ($51,000 & $71,000)
• They feel anything that can be done online is easier than in person
• They dress to impress with the latest fashions of the season

November 2017
Final Report Kitson Mill and Uptown Greenwood Study
City of Greenwood, SC
14 Kimley-Horn
Market Assessment
SOCIAL SECURITY SET (12.6%)
Social Security Set is an older market located in metropolitan cities across the country. In the aftermath of the Great Recession, early retirement is now a dream for many approaching the retirement age. Residents live alone in low-rent, high-rise buildings, located in or close to business districts that attract heavy daytime traffic. But they enjoy the hustle and bustle
of life in the heart of the city, with the added benefit of access to hospitals, community centers, and public transportation.
Defining Traits
Housing Preference: Multi-unit Rentals
• Most residents live alone in this older market
• The average rent ($620) is significantly below the US average ($990)
• With limited resources, spending on entertainment is restricted.
• Risk-averse consumers in Social Security Set prefer to pay their bills in person, usually with cash. Some residents don’t have a checking account, although one in three maintain a savings account for their small savings.
• Technology is a bear for these consumers. They steer away from cell phones, computers, and digital cameras.
November 2017
Final Report Kitson Mill and Uptown Greenwood Study
City of Greenwood, SC
15 Kimley-Horn
Market Assessment
Employment Profile
This section analyzes annual employment and wage trends by industry over the last ten years for the 2-county Greenwood
µSA, and more specifically for Greenwood County and the Kitson Mill Study Area, describing overall growth and shifts
between economic sectors. A profile of area commuting patterns is also presented.
Annualized Employment Growth Trends
Greenwood µSA
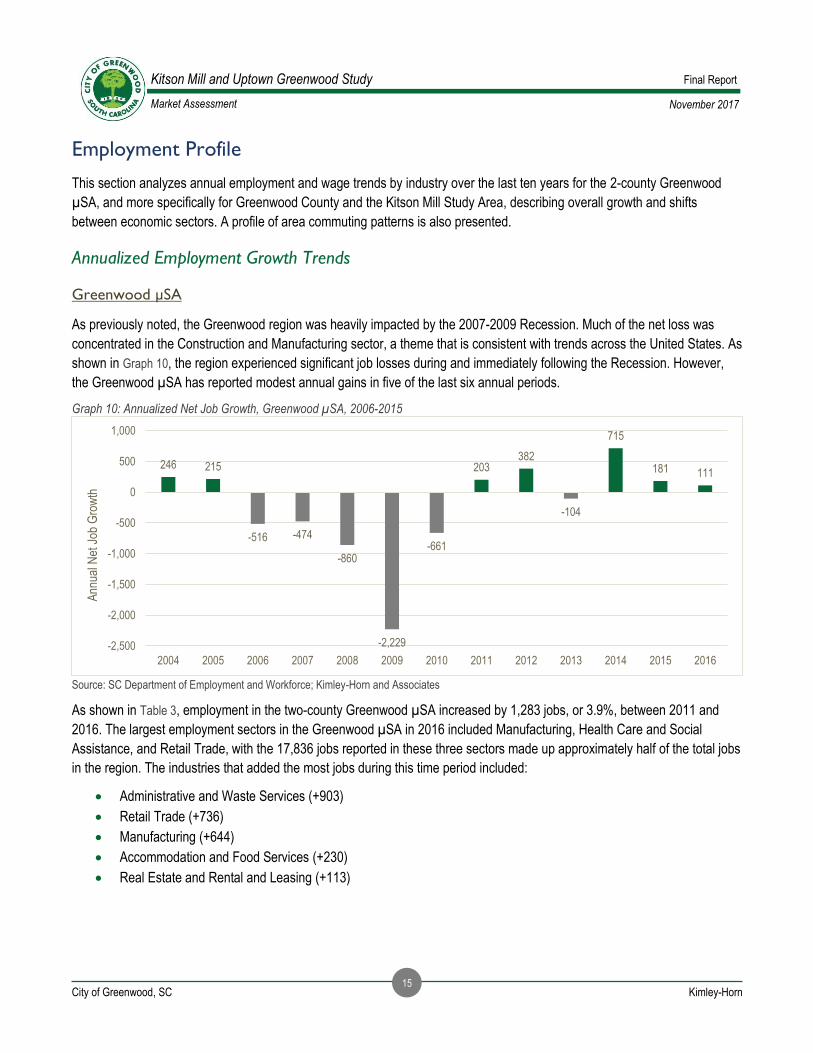
As previously noted, the Greenwood region was heavily impacted by the 2007-2009 Recession. Much of the net loss was
concentrated in the Construction and Manufacturing sector, a theme that is consistent with trends across the United States. As
shown in Graph 10, the region experienced significant job losses during and immediately following the Recession. However,
the Greenwood µSA has reported modest annual gains in five of the last six annual periods.
Graph 10: Annualized Net Job Growth, Greenwood µSA, 2006-2015
Source: SC Department of Employment and Workforce; Kimley-Horn and Associates
As shown in Table 3, employment in the two-county Greenwood µSA increased by 1,283 jobs, or 3.9%, between 2011 and
2016. The largest employment sectors in the Greenwood µSA in 2016 included Manufacturing, Health Care and Social
Assistance, and Retail Trade, with the 17,836 jobs reported in these three sectors made up approximately half of the total jobs
in the region. The industries that added the most jobs during this time period included:
• Administrative and Waste Services (+903)
• Retail Trade (+736)
• Manufacturing (+644)
• Accommodation and Food Services (+230)
• Real Estate and Rental and Leasing (+113)
246 215
-516 -474
-860
-2,229
-661
203382
-104
715
181 111
-2,500
-2,000
-1,500
-1,000
-500
0
500
1,000
2004 2005 2006 2007 2008 2009 2010 2011 2012 2013 2014 2015 2016
Ann
ual N
et J
ob G
row
th

November 2017
Final Report Kitson Mill and Uptown Greenwood Study
City of Greenwood, SC
16 Kimley-Horn
Market Assessment
Table 3: Annualized Employment by Industry, Greenwood µSA, 2011-2016
Nearly one-half of the 20 industry sectors reported above demonstrated increases in the last five years, which were enough to
off-set the notable loss in Professional and Technical Services positions (-1,000 fewer jobs). Most other industry losses were
relatively minor over the last five years.
Greenwood County
Hosting nearly 29,000 jobs, Greenwood County comprises approximately 83.9% of the two-county regional total. Making up a
large share of the regional total, Greenwood County also experienced a 3.9% increase in employment between 2011 and
2016, equating to nearly 1,200 new jobs (Table 4). Nearly all of the losses were in the Professional and Technical Services
industry. Manufacturing is the largest industry sector in the County, followed by Health Care and Social Assistance, Retail
Trade, and Accommodation and Food Services. Industries representing the largest job increases in the last five years include:
• Administrative and Waste Services (+849)
• Retail Trade (+685)
• Manufacturing (+460)
• Accommodation and Food Services (+428)
• Real Estate and Rental and Leasing (+122)
• Transportation and Warehousing (+122)
Industry
Classification 2011 2016 # %
Administrative and Waste Services 1,606 2,509 903 56.2%
Retail Trade 3,420 4,156 736 21.5%
Manufacturing 6,944 7,588 644 9.3%
Accommodation and Food Services 2,539 2,769 230 9.1%
Real Estate and Rental and Leasing 131 244 113 86.3%
Transportation and Warehousing 548 656 108 19.7%
Construction 1,097 1,197 100 9.1%
Natural Resources and Mining 89 125 36 40.4%
Utilities 306 312 6 2.0%
Public Administration 1,773 1,765 -8 -0.5%
Finance and Insurance 662 635 -27 -4.1%
Arts, Entertainment, and Recreation 393 357 -36 -9.2%
Wholesale Trade 873 836 -37 -4.2%
Information 281 244 -37 -13.2%
Health Care and Social Assistance 6,129 6,092 -37 -0.6%
Other Services, Ex. Public Admin 605 530 -75 -12.4%
Educational Services 3,557 3,400 -157 -4.4%
Management of Companies and Enterprises 363 184 -179 -49.3%
Professional and Technical Services 1,592 592 -1,000 -62.8%
Total 32,908 34,191 1,283 3.9%
Source: SC Department of Employ ment and Workforce; SC Works Online; Kimley -Horn
2011-2016 Δ

November 2017
Final Report Kitson Mill and Uptown Greenwood Study
City of Greenwood, SC
17 Kimley-Horn
Market Assessment
Table 4: Annualized Employment by Industry, Greenwood County, 2011-2016
Kitson Mill Study Area
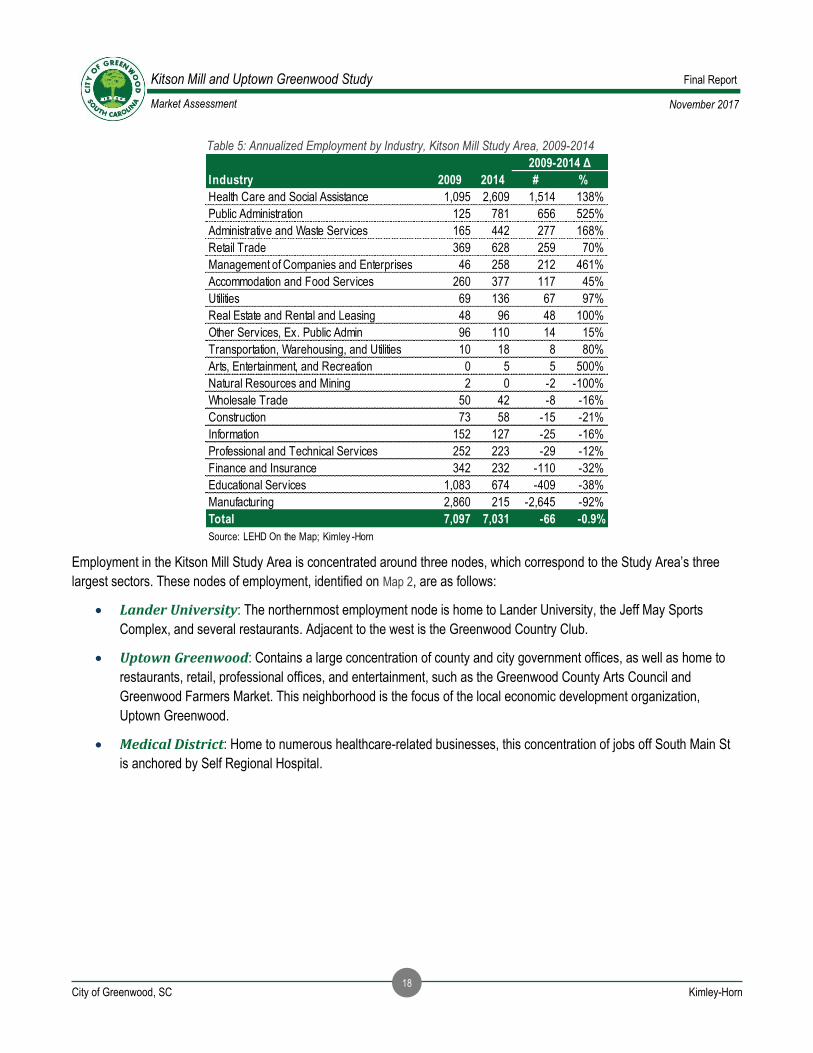
Employment for the Kitson Mill Study Area is provided by the US Census Bureau’s Longitudinal Employer-Household
Dynamics (LEHD) dataset. The most recently reported year for this information was 2014. Based on this data, the Kitson Mill
Study Area supported over 7,000 jobs in 2014. The largest sectors included Health Care and Social Assistance, Public
Administration, Educational Services, and Retail Trade ( Table 5). These sectors correspond to the primary employment
concentrations shown in Map 2. Sectors that experienced the most notable job increases over the last five years include:
• Health Care and Social Assistance (+1,514)
• Public Administration (+656)
• Administrative and Waste Services (+277)
• Retail Trade (+259)
• Management of Companies and Enterprises (+212)
Industry 2011 2016 # %
Administrative and Waste Services 1,359 2,208 849 62.5%
Retail Trade 2,999 3,684 685 22.8%
Manufacturing 5,347 5,807 460 8.6%
Accommodation and Food Services 2,051 2,479 428 20.9%
Real Estate and Rental and Leasing 112 234 122 108.9%
Transportation and Warehousing 489 611 122 24.9%
Construction 948 1,028 80 8.4%
Public Administration 1,206 1,257 51 4.2%
Natural Resources and Mining 62 96 34 54.8%
Utilities 262 262 0 0.0%
Information 186 162 -24 -12.9%
Arts, Entertainment, and Recreation 390 357 -33 -8.5%
Finance and Insurance 561 527 -34 -6.1%
Wholesale Trade 829 793 -36 -4.3%
Other Services, Ex. Public Admin 510 423 -87 -17.1%
Health Care and Social Assistance 5,536 5,425 -111 -2.0%
Educational Services 2,732 2,601 -131 -4.8%
Management of Companies and Enterprises 363 184 -179 -49.3%
Professional and Technical Services 1,562 551 -1,011 -64.7%
Total 27,504 28,689 1,185 3.9%
Source: SC Department of Employ ment and Workforce; SC Works Online; Kimley -Horn
2011-2016 Δ
November 2017
Final Report Kitson Mill and Uptown Greenwood Study
City of Greenwood, SC
18 Kimley-Horn
Market Assessment
Table 5: Annualized Employment by Industry, Kitson Mill Study Area, 2009-2014
Employment in the Kitson Mill Study Area is concentrated around three nodes, which correspond to the Study Area’s three
largest sectors. These nodes of employment, identified on Map 2, are as follows:
• Lander University: The northernmost employment node is home to Lander University, the Jeff May Sports
Complex, and several restaurants. Adjacent to the west is the Greenwood Country Club.
• Uptown Greenwood: Contains a large concentration of county and city government offices, as well as home to
restaurants, retail, professional offices, and entertainment, such as the Greenwood County Arts Council and
Greenwood Farmers Market. This neighborhood is the focus of the local economic development organization,
Uptown Greenwood.
• Medical District: Home to numerous healthcare-related businesses, this concentration of jobs off South Main St
is anchored by Self Regional Hospital.
Industry 2009 2014 # %
Health Care and Social Assistance 1,095 2,609 1,514 138%
Public Administration 125 781 656 525%
Administrative and Waste Services 165 442 277 168%
Retail Trade 369 628 259 70%
Management of Companies and Enterprises 46 258 212 461%
Accommodation and Food Services 260 377 117 45%
Utilities 69 136 67 97%
Real Estate and Rental and Leasing 48 96 48 100%
Other Services, Ex. Public Admin 96 110 14 15%
Transportation, Warehousing, and Utilities 10 18 8 80%
Arts, Entertainment, and Recreation 0 5 5 500%
Natural Resources and Mining 2 0 -2 -100%
Wholesale Trade 50 42 -8 -16%
Construction 73 58 -15 -21%
Information 152 127 -25 -16%
Professional and Technical Services 252 223 -29 -12%
Finance and Insurance 342 232 -110 -32%
Educational Services 1,083 674 -409 -38%
Manufacturing 2,860 215 -2,645 -92%
Total 7,097 7,031 -66 -0.9%
Source: LEHD On the Map; Kimley -Horn
2009-2014 Δ

November 2017
Final Report Kitson Mill and Uptown Greenwood Study
City of Greenwood, SC
19 Kimley-Horn
Market Assessment
Map 2: Employment Concentrations, Kitson Mill Study Area, 2014
Source: LEHD On the Map; Kimley-Horn
Annualized Wages by Industry
Greenwood µSA
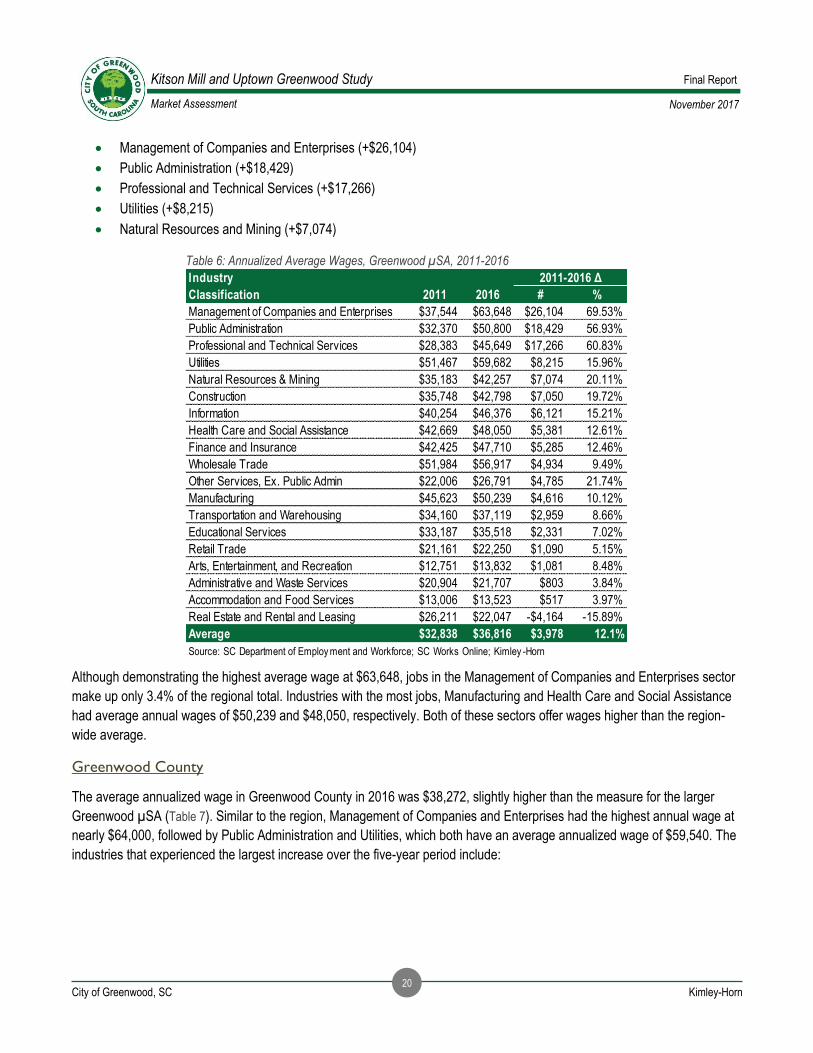
In 2016, the average annual wage in the Greenwood µSA was $36,816, an increase of $3,978 or 12.1% from $32,838 in 2011
(Table 6). Management of Companies and Enterprises reported the highest average wage, followed by Utilities. All industry
sectors posted increases except for Real Estate and Rental and Leasing, with the strongest growth as follows:
November 2017
Final Report Kitson Mill and Uptown Greenwood Study
City of Greenwood, SC
20 Kimley-Horn
Market Assessment
• Management of Companies and Enterprises (+$26,104)
• Public Administration (+$18,429)
• Professional and Technical Services (+$17,266)
• Utilities (+$8,215)
• Natural Resources and Mining (+$7,074)
Table 6: Annualized Average Wages, Greenwood µSA, 2011-2016
Although demonstrating the highest average wage at $63,648, jobs in the Management of Companies and Enterprises sector
make up only 3.4% of the regional total. Industries with the most jobs, Manufacturing and Health Care and Social Assistance
had average annual wages of $50,239 and $48,050, respectively. Both of these sectors offer wages higher than the region-
wide average.
Greenwood County
The average annualized wage in Greenwood County in 2016 was $38,272, slightly higher than the measure for the larger
Greenwood µSA (Table 7). Similar to the region, Management of Companies and Enterprises had the highest annual wage at
nearly $64,000, followed by Public Administration and Utilities, which both have an average annualized wage of $59,540. The
industries that experienced the largest increase over the five-year period include:
Industry
Classification 2011 2016 # %
Management of Companies and Enterprises $37,544 $63,648 $26,104 69.53%
Public Administration $32,370 $50,800 $18,429 56.93%
Professional and Technical Services $28,383 $45,649 $17,266 60.83%
Utilities $51,467 $59,682 $8,215 15.96%
Natural Resources & Mining $35,183 $42,257 $7,074 20.11%
Construction $35,748 $42,798 $7,050 19.72%
Information $40,254 $46,376 $6,121 15.21%
Health Care and Social Assistance $42,669 $48,050 $5,381 12.61%
Finance and Insurance $42,425 $47,710 $5,285 12.46%
Wholesale Trade $51,984 $56,917 $4,934 9.49%
Other Services, Ex. Public Admin $22,006 $26,791 $4,785 21.74%
Manufacturing $45,623 $50,239 $4,616 10.12%
Transportation and Warehousing $34,160 $37,119 $2,959 8.66%
Educational Services $33,187 $35,518 $2,331 7.02%
Retail Trade $21,161 $22,250 $1,090 5.15%
Arts, Entertainment, and Recreation $12,751 $13,832 $1,081 8.48%
Administrative and Waste Services $20,904 $21,707 $803 3.84%
Accommodation and Food Services $13,006 $13,523 $517 3.97%
Real Estate and Rental and Leasing $26,211 $22,047 -$4,164 -15.89%
Average $32,838 $36,816 $3,978 12.1%
Source: SC Department of Employ ment and Workforce; SC Works Online; Kimley -Horn
2011-2016 Δ

November 2017
Final Report Kitson Mill and Uptown Greenwood Study
City of Greenwood, SC
21 Kimley-Horn
Market Assessment
• Management of Companies and Enterprises (+$26,104)
• Public Administration (+$25,324)
• Professional and Technical Services (+$17,888)
• Utilities (+$9,516)
• Finance and Insurance (+$6,812)
Table 7: Annualized Average Wages, Greenwood County, 2000-2016
Commuting Patterns
As of 2014, more than 6,500 people traveled into the Kitson Mill Study Area for employment daily and over 2,700 of the Study
Area’s employed population commuted out. The Study Area has an estimated 474 people that live and work there, making up
only 14.6% of the total employed population. The percentage of those who live within the Study Area and work within
Greenwood County is 50.5% of employed Study Area residents.
Industry
Classification 2011 2016 # %
Management of Companies and Enterprises $37,544 $63,648 $26,104 69.5%
Public Administration $34,216 $59,540 $25,324 74.0%
Professional and Technical Services $28,496 $46,384 $17,888 62.8%
Utilities $50,024 $59,540 $9,516 19.0%
Finance and Insurance $43,940 $50,752 $6,812 15.5%
Natural Resources & Mining $38,480 $45,032 $6,552 17.0%
Construction $37,076 $43,576 $6,500 17.5%
Health Care and Social Assistance $43,680 $48,932 $5,252 12.0%
Wholesale Trade $52,416 $57,356 $4,940 9.4%
Other Services, Ex. Public Admin $22,308 $26,728 $4,420 19.8%
Manufacturing $47,632 $51,740 $4,108 8.6%
Educational Services $34,164 $37,180 $3,016 8.8%
Transportation and Warehousing $34,216 $36,452 $2,236 6.5%
Arts, Entertainment, and Recreation $12,688 $13,832 $1,144 9.0%
Retail Trade $21,788 $22,776 $988 4.5%
Administrative and Waste Services $20,592 $21,476 $884 4.3%
Information $36,088 $36,712 $624 1.7%
Accommodation and Food Services $13,156 $13,572 $416 3.2%
Real Estate and Rental and Leasing $25,012 $21,060 -$3,952 -15.8%
Average $35,308 $38,272 $2,964 8.4%
Source: SC Department of Employ ment and Workforce; SC Works Online; Kimley -Horn
2011-2016 Δ

November 2017
Final Report Kitson Mill and Uptown Greenwood Study
City of Greenwood, SC
22 Kimley-Horn
Market Assessment
Map 3: Commuting Patterns, Study Area, 2014
Source: LEHD On the Map; Kimley-Horn

November 2017
Final Report Kitson Mill and Uptown Greenwood Study
City of Greenwood, SC
23 Kimley-Horn
Market Assessment
Residential Profile
This section provides an overview of the residential market in Greenwood County, including building permits, housing units by
type, for-sale closing trends and price points, and a review of the rental multi-family market. As possible, housing unit
performance is compared to performance in the larger region.
Residential Building Permits
Based on data from the US Census, 172 residential building permits were issued in the Greenwood µSA in 2016 (Graph 11).
Although building permits have more than doubled since 2010, marking the annual period with the slowest activity, the region
is performing behind pre-Recession levels. The makeup of the housing type has also changed with single-family homes
making up a smaller share post-Recession and five-plus unit structures making up a greater share. Comparably, permits for
buildings with five or more units were extremely limited before 2007. During recovery from the Recession, no permits for any
size multi-unit structure were pulled.
Graph 11: Residential Building Permit Trends, Greenwood µSA, 2005-2016
Source: U.S. Census; Kimley-Horn
Modeling a similar pattern to the larger µSA, Greenwood County experienced strong residential building permit totals between
2005 and 2007, before declining rapidly during and following the Recession (Graph 12). Although the County has experienced
recovery, from the trough of only 47 units permitted in 2011 to the 133 total in 2016, residential permits are still well below the
total at the peak in 2005. All the multi-unit structures permitted from 2005-2016 in the larger µSA were in Greenwood County,
thus the same shift from domination of single family homes to a larger share of multi-units is exhibited post-Recession. The
multi-unit structures permitted in recent years have primarily been five-plus or two-units, with no three or four-unit structures
permitted in 2015 or 2016.
0
50
100
150
200
250
300
350
2005 2006 2007 2008 2009 2010 2011 2012 2013 2014 2015 2016
Uni
ts
5+ Units
3 & 4 Units
2-Units
1-Unit

November 2017
Final Report Kitson Mill and Uptown Greenwood Study
City of Greenwood, SC
24 Kimley-Horn
Market Assessment
Graph 12: Residential Building Permit Trends, Greenwood County, 2005-2016
Source: U.S. Census; Kimley-Horn
Housing Overview
As shown in Table 8, the Kitson Mill Study Area experienced an increase of 129 housing units between 2000 and 2016,
reaching an estimated total of 4,004 units. During the same time period, the Greenwood µSA added over 3,500 housing units,
equating to a 9.0% increase in 16 years. The Study Area captured 3.6% of this regional growth. The share of the total regional
housing units in the Study Area declined from 9.7% in 2000 to 9.2% in 2016.
Table 8: Comparison of Housing Unit Trends, 2000-2016
Based on American Community Survey data from 2014, the median year of completion for housing stock in the Kitson Mill
Study Area was 1958, compared to 1977 for both Greenwood County and the Greenwood µSA. As shown in Graph 13, over
half of the total housing stock in the Study Area was built before 1960, compared with only 26.9% in the larger µSA. Relatedly,
a greater share of housing units was built since 1980 in the larger µSA (45.4%) than in the Study Area (29.2%). It should be
noted that housing completions in the Study Area have slowed since the Recession with only 0.4% of the housing stock
delivered post-2010.
Area 2000 2010 2016 # % CAGR
Study Area 3,875 3,910 4,004 129 3.3% 0.2%
Greenwood County 28,243 31,054 31,103 2,860 10.1% 0.6%
Greenwood µSA 39,899 43,133 43,475 3,576 9.0% 0.5%
Study Area % Region 9.7% 9.1% 9.2% 3.6%
Source: US Census; Kimley -Horn
2000-2016 Δ
0
50
100
150
200
250
300
2005 2006 2007 2008 2009 2010 2011 2012 2013 2014 2015 2016
Uni
ts
5+ Units
3 & 4 Units
2-Units
1-Unit

November 2017
Final Report Kitson Mill and Uptown Greenwood Study
City of Greenwood, SC
25 Kimley-Horn
Market Assessment
Graph 13: Comparison of Share of Housing Units by Decade Completed, 2014
Source: US Census; Kimley-Horn
Units by Type
As shown in Graph 14, single-family detached housing makes up the largest share by type in Greenwood County at nearly
65% of the total stock. The shares of single-family detached housing units and mobile homes experienced slight decreases
between 2000 and 2014, while both single-family attached (townhouses) and multi-family product increased their total capture
of housing units in Greenwood County since 2000.
Graph 14: Housing Units by Type, Greenwood County, 2000-2014
Source: US Census; Kimley-Horn
0.0%
5.0%
10.0%
15.0%
20.0%
25.0%
Sha
re H
ousi
ng U
nits
by
Dec
ade
Com
plet
ed Study Area
Greenwood Region
67.2%
2.7%
15.8% 14.3%
64.7%
3.4%
18.7%
13.2%
0.0%
10.0%
20.0%
30.0%
40.0%
50.0%
60.0%
70.0%
80.0%
Single-Family,Detached
Single-Family,Attached
Multi-Family Mobile Home/Other
2000 2014

November 2017
Final Report Kitson Mill and Uptown Greenwood Study
City of Greenwood, SC
26 Kimley-Horn
Market Assessment
Based on 2014 data, the Kitson Mill Study Area reported notably higher shares of multi-family units than the larger Greenwood
µSA (Graph 15). These measures are largely due to the greater density of Uptown Greenwood and the surrounding
neighborhoods. Conversely, the Greenwood µSA had higher shares of single-family detached, as well as mobile homes.
Graph 15: Comparison of Housing Units by Type, 2014
Source: US Census; Kimley-Horn
Tenure
Consistent with national and statewide trends, the share of owner-occupied units in the Study Area has demonstrated a
decline since 2000, reaching 30.1% in 2016 (Graph 16). Largely a result of the 2007-2009 Recession and increase of leasing
during the subsequent mortgage crisis, the share of renter-occupied units increased in the 16-year period, from 51.9% in 2000
to 53.3% in 2016. Approximately 16.6% of the housing stock was vacant in 2016, an increase from 12.3% in 2000.
Graph 16: Housing Unit Tenure, Kitson Mill Study Area, 2000-2016
Source: US Census; Kimley-Horn
54.3%
4.8%
37.7%
3.3%
65.3%
2.7%
15.3% 16.7%
0.0%
10.0%
20.0%
30.0%
40.0%
50.0%
60.0%
70.0%
Single-Family,Detached
Single-Family,Attached
Multi-Family Mobile Home/Other
Hou
sing
Uni
ts b
y T
ype
Study Area
Greenwood µSA
35.7%
51.9%
12.3%
30.1%
53.3%
16.6%
0.0%
10.0%
20.0%
30.0%
40.0%
50.0%
60.0%
70.0%
80.0%
90.0%
100.0%
Owner-Occupied Renter-Occupied Vacant
Sha
re o
f Hou
sing
Uni
ts b
y T
enur
e
2000
2016
November 2017
Final Report Kitson Mill and Uptown Greenwood Study
City of Greenwood, SC
27 Kimley-Horn
Market Assessment
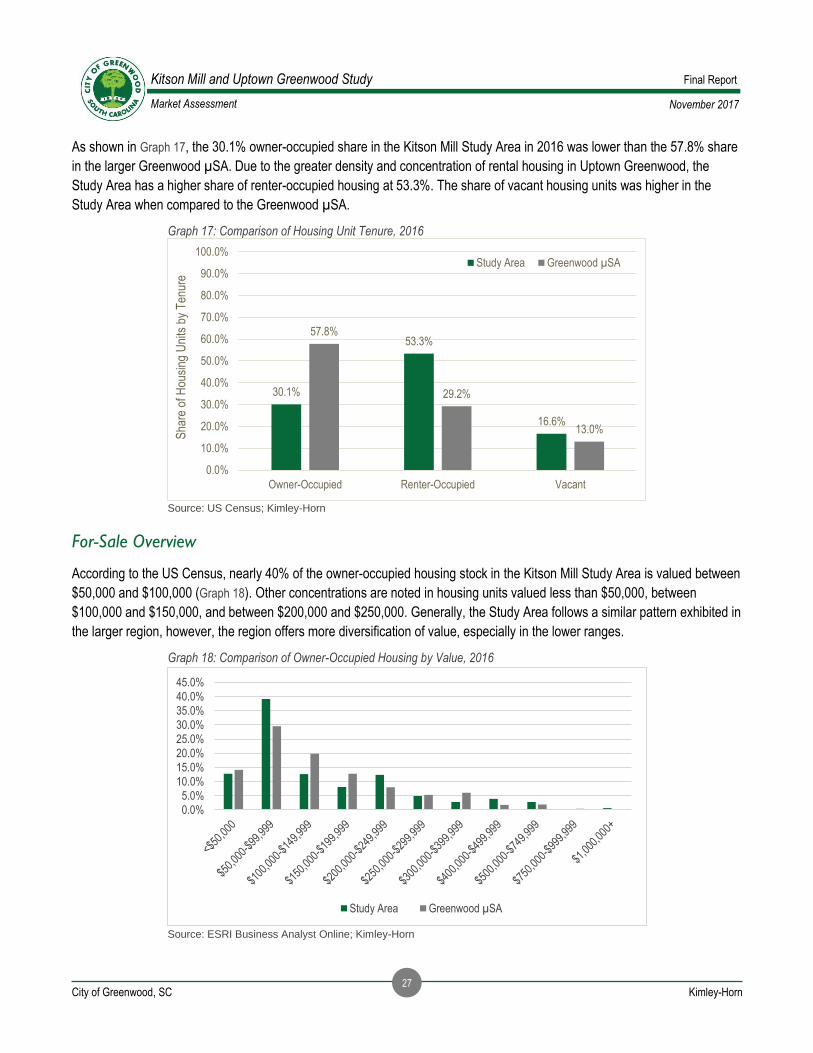
As shown in Graph 17, the 30.1% owner-occupied share in the Kitson Mill Study Area in 2016 was lower than the 57.8% share
in the larger Greenwood µSA. Due to the greater density and concentration of rental housing in Uptown Greenwood, the
Study Area has a higher share of renter-occupied housing at 53.3%. The share of vacant housing units was higher in the
Study Area when compared to the Greenwood µSA.
Graph 17: Comparison of Housing Unit Tenure, 2016
Source: US Census; Kimley-Horn
For-Sale Overview
According to the US Census, nearly 40% of the owner-occupied housing stock in the Kitson Mill Study Area is valued between
$50,000 and $100,000 (Graph 18). Other concentrations are noted in housing units valued less than $50,000, between
$100,000 and $150,000, and between $200,000 and $250,000. Generally, the Study Area follows a similar pattern exhibited in
the larger region, however, the region offers more diversification of value, especially in the lower ranges.
Graph 18: Comparison of Owner-Occupied Housing by Value, 2016
Source: ESRI Business Analyst Online; Kimley-Horn
30.1%
53.3%
16.6%
57.8%
29.2%
13.0%
0.0%
10.0%
20.0%
30.0%
40.0%
50.0%
60.0%
70.0%
80.0%
90.0%
100.0%
Owner-Occupied Renter-Occupied Vacant
Sha
re o
f Hou
sing
Uni
ts b
y T
enur
e
Study Area Greenwood µSA
0.0%
5.0%
10.0%
15.0%
20.0%
25.0%
30.0%
35.0%
40.0%
45.0%
Study Area Greenwood µSA

November 2017
Final Report Kitson Mill and Uptown Greenwood Study
City of Greenwood, SC
28 Kimley-Horn
Market Assessment
Since market-wide for-sale closing and price point data is relatively limited in Greenwood, additional insight into this real estate
sector is based on an inventory of 28 single-family detached units that are currently listed for sale in the Study Area. Data was
pulled through a variety of Realtor sites, including Zillow. The inventory does not include any townhouse or attached units. The
only attached for-sale product that was identified are listed as part of the redevelopment of a downtown building offering retail
on the first floor and condominiums for sale ranging from $250,000 to $298,000 on the upper floors.
Asking prices in the Study Area vary significantly, both by unit size and location; however, the most common price range is
between $100,000 and $150,000. This range comprises one-quarter of the inventory identified as part of this analysis. The
second most common range is between $150,000 and $199,999.
Graph 19: For-Sale Housing Units by Asking Price Range, Study Area, 2017
As shown in Graph 20, the overall average asking price for single-family detached product in the Kitson Mill Study Area is
estimated at $155,800. Asking prices vary significantly by bedroom type, ranging from an average of $70,700 for the three
two-bedroom units identified to $296,200 for housing units with five or more bedrooms.
Graph 20: Average For-Sale Asking Price by Number of Bedrooms, Study Area, 2017
Source: Third-Party Realtor Sites; Zillow; Kimley-Horn
0
1
2
3
4
5
6
7
8
Uni
ts
Asking Price
$0
$50,000
$100,000
$150,000
$200,000
$250,000
$300,000
$350,000
1BR 2BR 3BR 4BR 5BR
Ask
ing
Pric
e
Overall Average = $155,800
Source: Third-Party Realtor Sites; Zillow; Kimley-Horn

November 2017
Final Report Kitson Mill and Uptown Greenwood Study
City of Greenwood, SC
29 Kimley-Horn
Market Assessment
Rental Housing
According to the US Census, nearly 50% of the renter-occupied units in the Study Area have a contract rent range from $250
to $500 per month, higher than the share demonstrated in the larger region (Graph 21). It should be noted that the information
supplied in the graph below includes both rental units in traditional apartment communities, as well as investor-owned single-
family detached and attached residences that are leased out on a monthly or annual basis. Contract rents are consistent
between both geographies with nearly all units leasing for less than $750 per month. In fact, over 95% of the units in the Study
Area have lease rates below $750, including those with no cash rent (largely representing Section 8 or voucher programs).
Graph 21: Comparison of Renter-Occupied Units by Contract Rent Range, 2016
Source: ESRI Business Analyst Online; Kimley-Horn
An inventory of multifamily rental communities identified
32 market-rate and affordable developments. As shown
in Graph 22, nearly 25% of the current inventory of
apartments was completed in the 1970s, with another
22.0% built in the 2000s. Only one community has been
completed in the last decade, Barrington Apartments,
built in 2016. Four additional communities have been built
in the 2000s, supporting over 500 units.
While nationally, the average size of newer apartment
communities has expanded to 200 to 250 units,
developments in the Study Area tend to be smaller, most
with less than 100 units each. In fact, only seven of the
32 communities have more than 100 units.
Lease rates for the identified apartment communities are
relatively limited, with many of the communities unwilling
to share rate or vacancy information. However,
0.0%
10.0%
20.0%
30.0%
40.0%
50.0%
60.0%
Study Area Greenwood µSA
Graph 22: Share of Existing Apartment Inventory by Decade
Completed, Greenwood, 2017
Source: Kimley-Horn

November 2017
Final Report Kitson Mill and Uptown Greenwood Study
City of Greenwood, SC
30 Kimley-Horn
Market Assessment
supporting the results from the US Census graph above, for properties in a traditional apartment community setting, tend to
quote lease rates ranging from $500 to $700 per month. The newest product, primarily built in the 2000s, has the highest
quoted rents ranging from $600 to $1,000, depending on bedroom size. This range includes units at three communities:
Regency Park, Winter Ridge, and Barrington, which are profiled briefly below.
• Regency Park. Containing 132 total units, Regency Park
is one of the newest apartment communities in
Greenwood, and currently achieves the highest rents.
Located at 120 Edinborough Circle, the five-building
community has a unit mix of 13.6% one-bedrooms, 50.0%
two-bedrooms and 36.4% three-bedrooms. Three
floorplans are offered, an 800-square-foot one-bedroom, a
1,050-square-foot-two bedroom, and a 1,250-square-foot
three-bedroom. Unfurnished apartments generally range
from $721 per month to $1,032, depending on unit size. A
small number of the units are furnished at a price premium. Interior features are mixed, but many units have been
updated to include stainless steel appliances and granite countertops.
• Winter Ridge. Located at 102 Winter Way, the Winter
Ridge Apartment community offers 252 one-, two-, and
three-bedroom apartment units. Based on research
prepared as part of this analysis, Winter Ridge is the
largest apartment community in Greenwood. The one-
bedroom floor plan contains 665 square feet, two-
bedrooms range from 985 to 998 square feet, and the
community offers a 1,180-square-foot three-bedroom.
Average monthly rents range from $645 to $950. Interior
features are modest, offering white appliances in the
kitchen and a mixture of ceramic tile and carpet flooring.
• Barrington Apartments. A townhouse-style community
with 133 units, Barrington is located at 101 Bevington
Court. This community was completed in 2016, making it
the newest in Greenwood. The one-bedroom floorplan
contains 608 square feet, and rents for $695-$775 per
month, and the 1,216-square-foot two-bedroom rents for
$895 per month. Interior features are updated, including
laminate countertops, black appliances, and a mixture of
faux hardwood and carpet flooring. Exterior community
amenities are limited.

November 2017
Final Report Kitson Mill and Uptown Greenwood Study
City of Greenwood, SC
31 Kimley-Horn
Market Assessment
Non-Residential Profile
Retail
As previously noted for residential real estate performance, real estate trend information highlighting vacancy rates and price
points is extremely limited in Greenwood. This analysis relies on a current snapshot of performance to demonstrate potential
opportunities in Greenwood, and more specifically for the Kitson Mill Study Area.
Competitive Retail Framework
This section provides a high-level inventory of key national and regional chain retailers to demonstrate presence and
distribution serving Greenwood. This inventory includes stores in and near the defined Study Area. The US 178/SC 72 Bypass
corridor has established itself as the primary retail destination in Greenwood, attracting the highest concentration of national
and regional retailers over other areas. The Bypass corridor extends east-west near the northern border of the Study Area.
Within the larger geography of the City of Greenwood, Walmart is the dominate supercenter, offering one Supercenter location
on the SC 72 Bypass, as well as a smaller, secondary, location in eastern Greenwood at the intersection of US 178 and East
Cambridge Avenue. There are five primary national and regional chain grocers serving the City: Publix, Food Lion, LIDL,
ALDI, and Save a lot. Each of the national grocers have a location on the Bypass. Additionally, three pharmacy chains were
also identified, including Walgreens, Rite Aid, and CVS. Chain pharmacy services are also offered in the larger grocery stores
and in the supercenters.
Supercenters
Grocery Stores
Pharmacy
While national retailers have gravitated towards the major transportation corridors, primarily north of Uptown Greenwood, the
Study Area benefits from more localized offerings, including small grocery/convenience stores, local pharmacies, as well as
boutique restaurant and retail opportunities that attract customers from across the region. The most notable chain presence in
the Study Area is a variety of pharmacy locations seeking proximity to both Lander University and Self Regional Hospital.
Current Performance Snapshot
A search of retail listings resulted in six in-line suites or buildings, primarily focused along the US 178/SC 72 Bypass. Graph 23
compares the quoted rent per square foot and suite or building sizes for each of the identified listings.
November 2017
Final Report Kitson Mill and Uptown Greenwood Study
City of Greenwood, SC
32 Kimley-Horn
Market Assessment
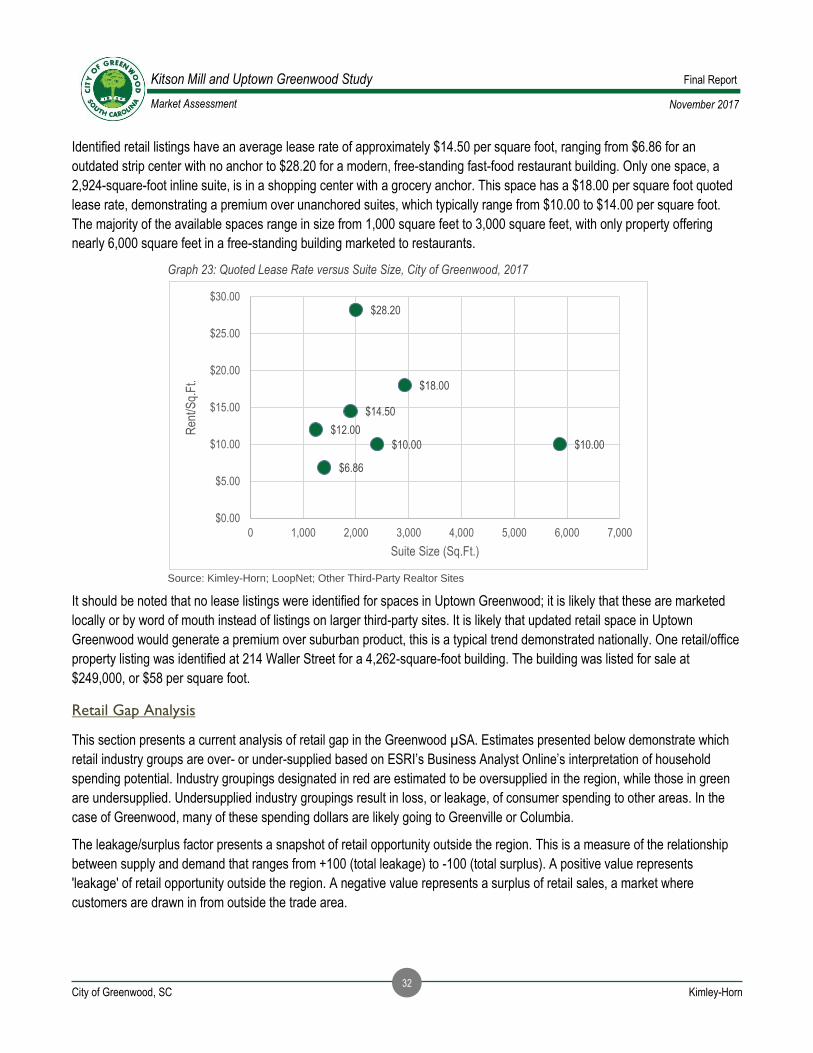
Identified retail listings have an average lease rate of approximately $14.50 per square foot, ranging from $6.86 for an
outdated strip center with no anchor to $28.20 for a modern, free-standing fast-food restaurant building. Only one space, a
2,924-square-foot inline suite, is in a shopping center with a grocery anchor. This space has a $18.00 per square foot quoted
lease rate, demonstrating a premium over unanchored suites, which typically range from $10.00 to $14.00 per square foot.
The majority of the available spaces range in size from 1,000 square feet to 3,000 square feet, with only property offering
nearly 6,000 square feet in a free-standing building marketed to restaurants.
Graph 23: Quoted Lease Rate versus Suite Size, City of Greenwood, 2017
Source: Kimley-Horn; LoopNet; Other Third-Party Realtor Sites
It should be noted that no lease listings were identified for spaces in Uptown Greenwood; it is likely that these are marketed
locally or by word of mouth instead of listings on larger third-party sites. It is likely that updated retail space in Uptown
Greenwood would generate a premium over suburban product, this is a typical trend demonstrated nationally. One retail/office
property listing was identified at 214 Waller Street for a 4,262-square-foot building. The building was listed for sale at
$249,000, or $58 per square foot.
Retail Gap Analysis
This section presents a current analysis of retail gap in the Greenwood µSA. Estimates presented below demonstrate which
retail industry groups are over- or under-supplied based on ESRI’s Business Analyst Online’s interpretation of household
spending potential. Industry groupings designated in red are estimated to be oversupplied in the region, while those in green
are undersupplied. Undersupplied industry groupings result in loss, or leakage, of consumer spending to other areas. In the
case of Greenwood, many of these spending dollars are likely going to Greenville or Columbia.
The leakage/surplus factor presents a snapshot of retail opportunity outside the region. This is a measure of the relationship
between supply and demand that ranges from +100 (total leakage) to -100 (total surplus). A positive value represents
'leakage' of retail opportunity outside the region. A negative value represents a surplus of retail sales, a market where
customers are drawn in from outside the trade area.
$18.00
$14.50
$12.00
$10.00 $10.00
$6.86
$28.20
$0.00
$5.00
$10.00
$15.00
$20.00
$25.00
$30.00
0 1,000 2,000 3,000 4,000 5,000 6,000 7,000
Ren
t/Sq.
Ft.
Suite Size (Sq.Ft.)

November 2017
Final Report Kitson Mill and Uptown Greenwood Study
City of Greenwood, SC
33 Kimley-Horn
Market Assessment
As shown in Table 9, demand in the two-county Greenville region is outpacing supply in the Furniture and Home Furnishings,
Electronics & Appliance Stores, Gasoline Stores, Clothing & Clothing Accessories, Sporting Goods, Non-Store Retailers, and
Food Services & Drinking Places industry groups. This demonstrates that the region has opportunity to grow its regional
attractiveness as a retail center in these categories.
Table 9: Retail Leakage/Surplus, Greenwood µSA, 2017
A similar analysis of the Kitson Mill Study Area shows more surplus than the larger region, which is expected given the
average household income and lower spending potential. Key areas where there is unmet demand are in Furniture Stores,
Gasoline Stations, Sporting Goods, and General Merchandise stores. Based on the Study Area estimate, in a more urban
environment like Uptown Greenwood, opportunities exist to attract specialty food stores, general merchandise, and drinking
places.
Office
Five office properties were identified as being currently marketed for sale in Greenwood. Generally, Greenwood’s office
properties are heavily concentrated near the urban core of downtown. Medical office space is located near Self Regional
Hospital, and typically generates a significant premium over spaces targeting professional services firms. The premium for
medical office space is consistent with national trends, and is heavily influenced by the necessary construction specifications
that are required to support medical uses.
The five office listings identified in Greenwood have an aggregate average sales price of $51 per square foot, ranging from
$30 per square foot for a condominiumized business space on Waller Avenue to nearly $65 for near the Bypass. No medical
office buildings were identified to test the extent of potential premium achievable in Greenwood.
Light Industrial/Flex
There is over 4.0 million square feet of industrial space actively being marketed for-sale in Greenwood, with buildings ranging
from 1,800 square feet to 125,000 square feet. The majority of the buildings are either targeted to manufacturing uses, or
have been used by a non-traditional such as a church congregation. Quoted sales prices average approximately $40 per
Leakage/
Industry Group Demand Supply Retail Gap Surplus Factor
Motor Vehicles & Parts Dealers $214,676,496 $230,171,798 -$15,495,302 -3.5
Furniture & Home Furnishings $31,028,180 $18,252,816 $12,775,364 16.9
Electronics & Appliance Stores $25,206,856 $17,053,148 $8,153,708 25.9
Building Materials & Supply Stores $68,743,143 $128,042,870 -$59,299,727 -30.1
Food and Beverage Stores $166,621,954 $182,725,962 -$16,104,008 -4.6
Health & Personal Care Stores $63,264,735 $72,230,995 -$8,966,260 -6.6
Gasoline Stations $114,769,773 $108,595,545 $6,174,228 2.8
Clothing & Clothing Accessory Stores $38,449,047 $28,131,493 $10,317,554 15.5
Sporting Goods, Hobby, Books & Music Stores $25,088,213 $19,829,172 $5,259,041 11.7
General Merchandise Stores $151,959,804 $195,254,503 -$43,294,699 -12.5
Miscellaneous Store Retailers $37,640,777 $27,524,230 $10,116,547 15.5
Nonstore Retailers $15,454,295 $2,653,519 $12,800,776 70.7
Food Services & Drinking Places $94,138,241 $88,291,212 $5,847,029 3.2
Restaurants/Other Eating Places $86,928,873 $87,242,826 -$313,953 -0.2
Source: ESRI Business Analy st Online

November 2017
Final Report Kitson Mill and Uptown Greenwood Study
City of Greenwood, SC
34 Kimley-Horn
Market Assessment
square foot, generally ranging from $25 to $75. As shown in Graph 24, the majority of the available spaces identified in
Greenwood as industrial contain less than 10,000 square feet.
Graph 24: Quoted Sale Price versus Building Size, City of Greenwood, 2017
Source: Kimley-Horn; LoopNet; Other Third-Party Realtor Sites
The former Self Regional laundry processing facility space located at the corner of Maxwell Avenue and Kitson Street is
currently on the market, although a sale of the property is pending. This property is located very close to the Kitson Mill site,
and according to Economic Development is one of Greenwood’s few available updated warehousing spaces with proximity to
Uptown. The building was constructed in 1980 and contains approximately 125,000 square feet on 6.70 acres. The asking
price is listed at $1.67 million, although the actual closing price is likely to vary from that number. This equates to nearly $14
per square foot.
$0
$10
$20
$30
$40
$50
$60
$70
$80
$90
0 20,000 40,000 60,000 80,000 100,000 120,000 140,000
Sal
e P
rice/
Sq.
Ft.
Building Size (Sq.Ft.)

November 2017
Final Report Kitson Mill and Uptown Greenwood Study
City of Greenwood, SC
35 Kimley-Horn
Market Assessment
Population and Employment Forecasts
This section provides population and employment forecasts for Greenwood County and the Kitson Mill Study Area,
considering the geographic location in the region, demographic and economic trends, tourism, and real estate market
performance. The forecasted population growth is used to project demand for housing and retail in the following section, and
future increases in employment are used to determine supportable amounts of office and industrial.
Population
The starting point for the population forecasts presented in this analysis are 2016 population estimates, provided by ESRI.
Population forecasts have been prepared for both Greenwood County and the Kitson Mill Study Area through 2030.
Greenwood County
Based on data provided by ESRI, Greenwood County had an estimated 70,780 residents in 2016. Forecasts are based on
interpretation of projections provided by the State of South Carolina, ESRI, and Woods & Poole, a third-party population and
employment forecasting firm. As shown in Graph 25, the projections for Greenwood County show population increasing
moderately through 2030, resulting in an increase of 3,920 people.
Graph 25: Population Forecasts, Greenwood County, 2016-2030
Kitson Mill Study Area
Residents in the Study Area currently make up approximately 13.2% of Greenwood County’s total population. The Study
Area’s share of the total population has remained constant in recent years, even as new residential development has targeted
greenfield sites in the County around the periphery of Greenwood. Population forecasts for the Study Area consider future
growth rates, as well as entitlements and announcements that could impact growth in the future.
70,780 71,500 73,100 74,700
0
10,000
20,000
30,000
40,000
50,000
60,000
70,000
80,000
PO
PU
LAT
ION
Source: ESRI Business Analyst Online; State of South Carolina; Woods & Poole; Kimley-Horn

November 2017
Final Report Kitson Mill and Uptown Greenwood Study
City of Greenwood, SC
36 Kimley-Horn
Market Assessment
The Study Area had an estimated 9,270 residents in 2016 (Graph 26). Based on projected growth in the County, this analysis
forecasts a total population of 10,080 residents by 2030, an 8.7% increase. This analysis assumes that the trend of limited
population and residential growth in the Study Area is likely to reverse in the future with a resurgence of living in areas offering
proximity to services, entertainment, and transportation options.
Graph 26: Population Forecasts, Kitson Mil Study Area, 2016-2030
Employment
Employment forecasts are based on interpretations of datasets prepared by Woods & Poole for Greenwood County. Economic
development and job growth is a function of regional and county-wide success and partnership. As such, this section provides
employment forecasts for the County because understanding this momentum is vital to achieving accurate real estate demand
projections for the Kitson Mill Study Area.
Based on data provided by Woods & Poole, Greenwood County had approximately 28,689 jobs in 2016. As shown in Graph
27, the projections for Greenwood County show a total of 34,899 jobs by 2030, an increase of 21.3%. These projections,
suggest modest growth in the future, continuing the positive trends in the last five years.
9,270 9,510 9,800 10,080
0
2,000
4,000
6,000
8,000
10,000
12,000
2016 2017 2018 2019 2020 2021 2022 2023 2024 2025 2026 2027 2028 2029 2030
PO
PU
LAT
ION
Source: ESRI Business Analyst Online; State of South Carolina; Woods & Poole; Kimley-Horn

November 2017
Final Report Kitson Mill and Uptown Greenwood Study
City of Greenwood, SC
37 Kimley-Horn
Market Assessment
Graph 27: Employment Forecasts, Greenwood County, 2016-2030
As previously noted, Greenwood County is expected to have 34,899 total jobs by 2030, a 21.3% increase from an estimated
28,689 jobs in 2016 (Table 10). With 7,741 total jobs, the Healthcare and Social Assistance sector is expected to remain the
largest industry in 2030, supported by success at Self Regional Hospital. All industries are expected to experience growth
through 2030. The strongest growth in Greenwood County employment sectors through 2030 are forecasted to be:
• Healthcare and Social Assistance (+2,316)
• Accommodation and Food Services (+762)
• Administrative and Waste Services (+536)
• Manufacturing (+449)
• Wholesale Trade (+323)
28,68930,448
32,66934,899
0
5,000
10,000
15,000
20,000
25,000
30,000
35,000
40,000
EM
PLO
YM
EN
T
Source: SC Works Online Services; SCESC; Woods & Poole; Kimley-Horn
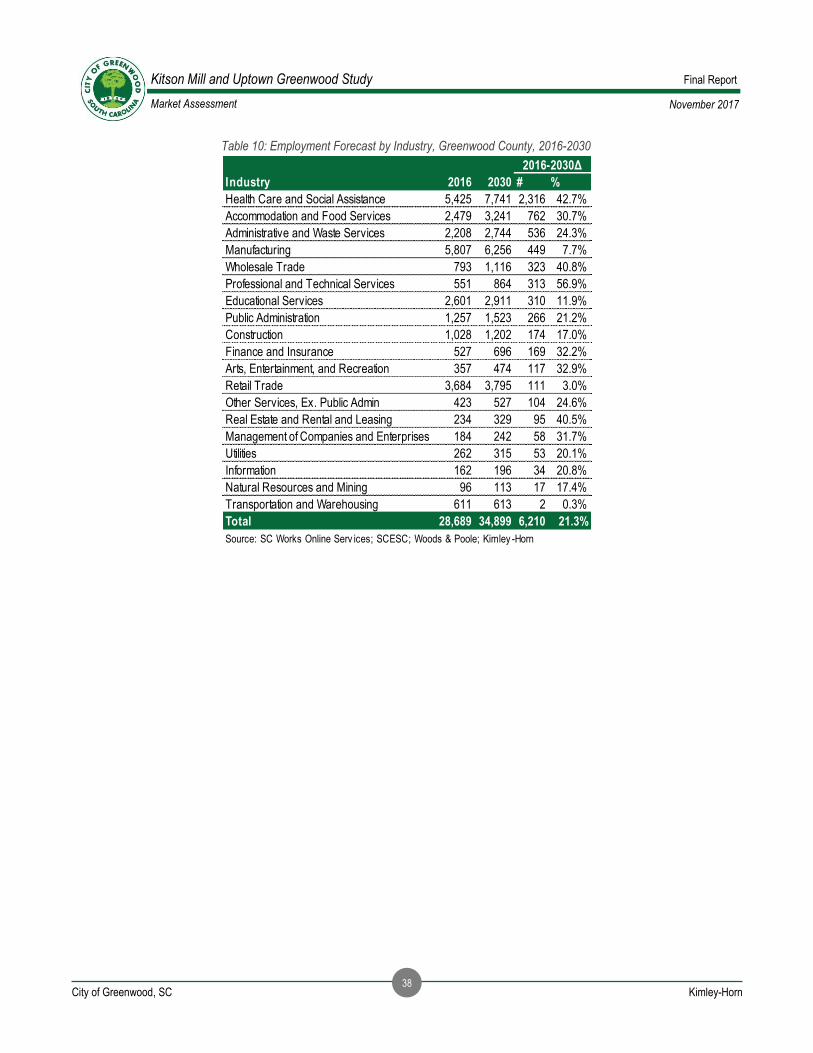
November 2017
Final Report Kitson Mill and Uptown Greenwood Study
City of Greenwood, SC
38 Kimley-Horn
Market Assessment
Table 10: Employment Forecast by Industry, Greenwood County, 2016-2030
Industry 2016 2030 # %
Health Care and Social Assistance 5,425 7,741 2,316 42.7%
Accommodation and Food Services 2,479 3,241 762 30.7%
Administrative and Waste Services 2,208 2,744 536 24.3%
Manufacturing 5,807 6,256 449 7.7%
Wholesale Trade 793 1,116 323 40.8%
Professional and Technical Services 551 864 313 56.9%
Educational Services 2,601 2,911 310 11.9%
Public Administration 1,257 1,523 266 21.2%
Construction 1,028 1,202 174 17.0%
Finance and Insurance 527 696 169 32.2%
Arts, Entertainment, and Recreation 357 474 117 32.9%
Retail Trade 3,684 3,795 111 3.0%
Other Services, Ex. Public Admin 423 527 104 24.6%
Real Estate and Rental and Leasing 234 329 95 40.5%
Management of Companies and Enterprises 184 242 58 31.7%
Utilities 262 315 53 20.1%
Information 162 196 34 20.8%
Natural Resources and Mining 96 113 17 17.4%
Transportation and Warehousing 611 613 2 0.3%
Total 28,689 34,899 6,210 21.3%
Source: SC Works Online Serv ices; SCESC; Woods & Poole; Kimley -Horn
2016-2030Δ

November 2017
Final Report Kitson Mill and Uptown Greenwood Study
City of Greenwood, SC
39 Kimley-Horn
Market Assessment
Kitson Mill Study Area Demand Forecasts
Housing Units
Residential housing unit demand is based on the population projections for the Kitson Mill Study Area presented in the
previous section. Ultimately, the Study Area’s performance through 2030 could be further impacted by policy decisions, public
and private investment, and utility and transportation infrastructure.
As demonstrated in the previous section, the Kitson Mill Study Area could have approximately 810 new residents between
2016 and 2030, representing an 8.7% growth rate (Table 11). The forecasted growth rate represents continued modest growth,
largely constrained by land availability as compared to other areas in Greenwood County. Based on the forecasted growth,
total population in the Study Area could increase from 9,270 people in 2016 to 10,080 people in 2030.
Table 11: Residential Forecast, Kitson Mill Study Area, 2016-2030
Housing unit forecasts are based on average household sizes and an 7% vacancy rate. This analysis assumes that the
average household size will remain relatively constant through 2030 years at approximately 2.3 persons per household. Based
on these assumptions, the Study Area could support approximately 330 net new housing units through 2030. This projection
does not take into consideration replacement units required for demolished housing units that have become obsolete,
uncompetitive, or are damaged or destroyed.
Greenwood, and surrounding Greenwood County, have higher shares of single-family detached units with a focus on families
and empty nesters seeking affordable housing options. Although the development of new townhouses and apartments have
recently been more limited in the Kitson Mill Study Area, given the amount of available land this product type is likely to
capture much of the future residential demand. This is further supported by student and aging populations that may seek to
live in a pedestrian-friendly environment or downsize into properties with more minimal maintenance. Financing for higher-
density housing units is likely to stand as one of the largest challenges in developing these product types in Greenwood given
the sales prices and lease rates currently demonstrated at existing product.
Retail
The Greenwood County geography is the basis for the retail forecasts because the City of Greenwood serves as the primary
commercial hub for residents throughout the region. The 2016-2030 retail demand for Greenwood County and the Study Area
was forecasted using the following method:
1. Calculating Greenwood County’s total household income in 2016, 2020, 2025, and 2030 by applying the forecasted
households to average income projections presented earlier in this document
2. Estimating the County’s expenditure potential based on reported data that indicates the percentage of income spent
on various retail goods and services
Measure 2016 2020 2025 2030 # %
Population 9,270 9,510 9,800 10,080 810 8.7%
Households 3,340 3,440 3,570 3,690 350 10.5%
Housing Units 4,000 4,090 4,210 4,330 330 8.3%
Source: US Census; ESRI; Kimley -Horn
2016-2030 Δ

November 2017
Final Report Kitson Mill and Uptown Greenwood Study
City of Greenwood, SC
40 Kimley-Horn
Market Assessment
3. Determining Greenwood County’s sales through 2030, taking into account leakage resulting from resident commuting
patterns
4. Estimating sales inflow from non-County residents, include those who work there, commuters traveling through the
area to reach other destinations, and tourists
5. Converting retail sales to square feet based on sales per square feet data by type of retail
Household and Income Forecasts
As shown in Graph 28, Greenwood County had an estimated 27,850 households in 2016. This analysis forecasts the addition
of approximately 1,880 households over the forecast period, reaching a total of 29,730 households in 2030. This analysis
aligns with forecasts that suggest slow, but modest, growth for the County and region in the future.
Graph 28: Household Forecast, Greenwood County, 2016-2030
Retail demand forecasts generally rely on average household income, which is typically higher than the median household
income statistics reported previously in this analysis. According to ESRI, Greenwood County had an estimated average
household income of over $53,920 in 2016. Based on income projections derived from US Census and ESRI trends, the
County is expected to have an average household income of over $72,890 by 2030 (Graph 29).
27,850 28,350 29,030 29,730
0
5,000
10,000
15,000
20,000
25,000
30,000
35,000
2016 2020 2025 2030
Hou
seho
lds
Source: ESRI Business Analyst Online; Kimley-Horn
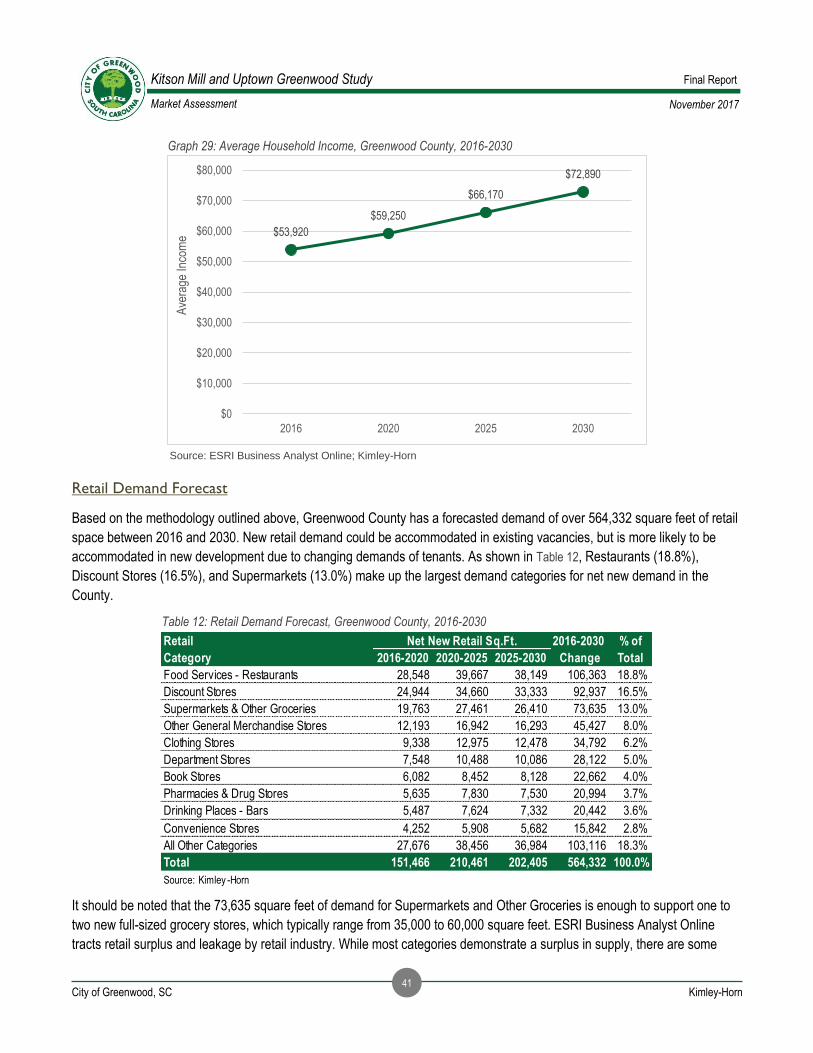
November 2017
Final Report Kitson Mill and Uptown Greenwood Study
City of Greenwood, SC
41 Kimley-Horn
Market Assessment
Graph 29: Average Household Income, Greenwood County, 2016-2030
Retail Demand Forecast
Based on the methodology outlined above, Greenwood County has a forecasted demand of over 564,332 square feet of retail
space between 2016 and 2030. New retail demand could be accommodated in existing vacancies, but is more likely to be
accommodated in new development due to changing demands of tenants. As shown in Table 12, Restaurants (18.8%),
Discount Stores (16.5%), and Supermarkets (13.0%) make up the largest demand categories for net new demand in the
County.
Table 12: Retail Demand Forecast, Greenwood County, 2016-2030
It should be noted that the 73,635 square feet of demand for Supermarkets and Other Groceries is enough to support one to
two new full-sized grocery stores, which typically range from 35,000 to 60,000 square feet. ESRI Business Analyst Online
tracts retail surplus and leakage by retail industry. While most categories demonstrate a surplus in supply, there are some
$53,920
$59,250
$66,170
$72,890
$0
$10,000
$20,000
$30,000
$40,000
$50,000
$60,000
$70,000
$80,000
2016 2020 2025 2030
Ave
rage
Inco
me
Retail 2016-2030 % of
Category 2016-2020 2020-2025 2025-2030 Change Total
Food Services - Restaurants 28,548 39,667 38,149 106,363 18.8%
Discount Stores 24,944 34,660 33,333 92,937 16.5%
Supermarkets & Other Groceries 19,763 27,461 26,410 73,635 13.0%
Other General Merchandise Stores 12,193 16,942 16,293 45,427 8.0%
Clothing Stores 9,338 12,975 12,478 34,792 6.2%
Department Stores 7,548 10,488 10,086 28,122 5.0%
Book Stores 6,082 8,452 8,128 22,662 4.0%
Pharmacies & Drug Stores 5,635 7,830 7,530 20,994 3.7%
Drinking Places - Bars 5,487 7,624 7,332 20,442 3.6%
Convenience Stores 4,252 5,908 5,682 15,842 2.8%
All Other Categories 27,676 38,456 36,984 103,116 18.3%
Total 151,466 210,461 202,405 564,332 100.0%
Source: Kimley -Horn
Net New Retail Sq.Ft.
Source: ESRI Business Analyst Online; Kimley-Horn

November 2017
Final Report Kitson Mill and Uptown Greenwood Study
City of Greenwood, SC
42 Kimley-Horn
Market Assessment
notable sectors that would represent potential for future demand because residents are going elsewhere for these services.
The most notable of these “leakage” sectors are general merchandise stores, motor vehicle and parts dealers, and furniture
and home furnishing stores.
Table 13 demonstrates the potential capture of the County-wide retail demand forecast in the Kitson Mill Study Area. This
analysis uses a 12-15% capture rate for forecasted demand to demonstrate a future range. The capture rates consider the
concentration of services in the City of Greenwood that serve more rural areas in Greenwood County and the region, as well
as forecasted household growth in the core of the City. Based on these captures, the Kitson Mill Study Area could support
approximately 67,720 to 84,650 square feet of net new retail space through 2030.
Table 13: Net New Retail Demand, Greenwood County, 2016-2030
Office
Office demand for the Kitson Mill Study Area was based on employment growth forecasted for Greenwood County. The
employment growth scenarios are used to forecast both office and industrial demand by considering the types of jobs that
would require different development types.
Office-Occupying Employment Forecast
To forecast the increase in office-occupying employment, office shares were applied to each industry projection for
Greenwood County (as demonstrated in the employment projections in the previous section). Finance and Insurance,
Management of Companies and Enterprises, and Professional and Technical Services have the highest shares of office-
occupying employment, ranging from 80% to 85%. As shown in Table 14, the County is projected to have an increase of
approximately 1,742 office-occupying employees, or 27.0%, between 2016 and 2030.
Measure LOW HIGH
Greenwood County 564,332 564,332
Capture Rate 12.0% 15.0%
Kitson Mill Study Area 67,720 84,650
Source: US Census; ESRI; Kimley -Horn
New Retail Demand

November 2017
Final Report Kitson Mill and Uptown Greenwood Study
City of Greenwood, SC
43 Kimley-Horn
Market Assessment
Table 14: Office-Occupying Employment Forecast, Greenwood County, 2016-2030
Demand Forecast
Forecasted office-occupying jobs have been used to estimate demand for square footage. National trends indicate a declining
amount of office space per employee, with companies seeking to more efficiently utilize space. However, this decline is most
notably demonstrated in core urban markets, and is impacting suburban or rural markets at a slower pace. Estimates for office
demand are based on a 225-square-feet per employee estimate through 2030.
Greenwood County is forecasted to add 1,742 new office jobs between 2016 and 2030. At an average space per employee of
225 square feet, this equates to demand of approximately 391,958 square feet of net new single- and multi-tenant office
space through 2030 (Table 15). It is important to have vacant space offerings for inter- and intra-market moves. This analysis
uses an average vacancy rate of 10% to show total net new office space demand. Based on this vacancy measure,
Greenwood County could support the development of over 423,000 square feet of new office space over the forecast period.
Table 15: Net New Office Demand, Greenwood County, 2016-2030
Table 16 demonstrates the potential capture of the County-wide office demand forecast in the Kitson Mill Study Area. This
analysis uses a 30-35% capture rate for forecasted demand to demonstrate a future range. While much of the new office
Office
Industry Share 2016 2020 2025 2030 # %
Natural Resources and Mining 5.0% 5 5 5 6 1 17.4%
Utilities 15.0% 39 42 44 47 8 20.1%
Construction 10.0% 103 108 115 120 17 17.0%
Manufacturing 5.0% 290 299 307 313 22 7.7%
Wholesale Trade 25.0% 198 221 249 279 81 40.8%
Retail Trade 10.0% 368 374 378 380 11 3.0%
Transportation and Warehousing 25.0% 153 150 151 153 0 0.3%
Information 30.0% 49 51 55 59 10 20.8%
Finance and Insurance 85.0% 448 494 546 592 144 32.2%
Real Estate and Rental and Leasing 75.0% 176 194 219 247 71 40.5%
Professional and Technical Services 80.0% 441 501 589 692 251 56.9%
Management of Companies and Enterprises 85.0% 156 171 189 206 50 31.7%
Administrative and Waste Services 70.0% 1,546 1,646 1,783 1,921 375 24.3%
Educational Services 15.0% 390 404 422 437 46 11.9%
Health Care and Social Assistance 15.0% 814 903 1,026 1,161 347 42.7%
Arts, Entertainment, and Recreation 15.0% 54 58 64 71 18 32.9%
Accommodation and Food Services 10.0% 248 269 297 324 76 30.7%
Other Services, Ex. Public Admin 25.0% 106 113 122 132 26 24.6%
Public Administration 70.0% 880 938 1,006 1,066 186 21.2%
Total 6,463 6,942 7,568 8,204 1,742 27.0%
Source: SC Works Online Serv ices; SCESC; Woods & Poole; Kimley -Horn
2016-2030 Δ
2016-2030
Measure 2016-2020 2020-2025 2025-2030 Total
Office-Occupying Jobs 479 625 637 1,742
Square Feet/Employee 225 225 225
Net Demand (Sq.Ft.) 107,840 140,721 143,397 391,958
Net Office Space Demand 116,467 151,979 154,869 423,315
Source: SC Works Online Serv ices; SCESC; Woods & Poole; Kimley -Horn
New Office Demand
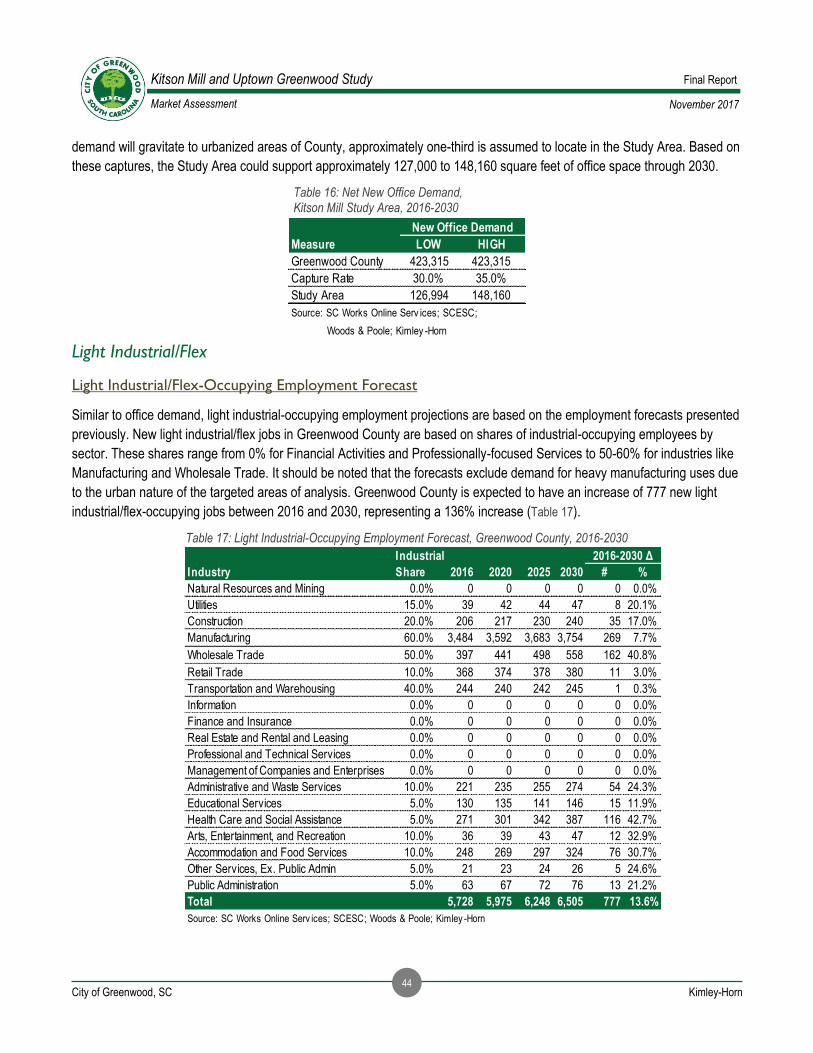
November 2017
Final Report Kitson Mill and Uptown Greenwood Study
City of Greenwood, SC
44 Kimley-Horn
Market Assessment
demand will gravitate to urbanized areas of County, approximately one-third is assumed to locate in the Study Area. Based on
these captures, the Study Area could support approximately 127,000 to 148,160 square feet of office space through 2030.
Table 16: Net New Office Demand, Kitson Mill Study Area, 2016-2030
Light Industrial/Flex
Light Industrial/Flex-Occupying Employment Forecast
Similar to office demand, light industrial-occupying employment projections are based on the employment forecasts presented
previously. New light industrial/flex jobs in Greenwood County are based on shares of industrial-occupying employees by
sector. These shares range from 0% for Financial Activities and Professionally-focused Services to 50-60% for industries like
Manufacturing and Wholesale Trade. It should be noted that the forecasts exclude demand for heavy manufacturing uses due
to the urban nature of the targeted areas of analysis. Greenwood County is expected to have an increase of 777 new light
industrial/flex-occupying jobs between 2016 and 2030, representing a 136% increase (Table 17).
Table 17: Light Industrial-Occupying Employment Forecast, Greenwood County, 2016-2030
Measure LOW HIGH
Greenwood County 423,315 423,315
Capture Rate 30.0% 35.0%
Study Area 126,994 148,160
Source: SC Works Online Serv ices; SCESC;
Woods & Poole; Kimley -Horn
New Office Demand
Industrial
Industry Share 2016 2020 2025 2030 # %
Natural Resources and Mining 0.0% 0 0 0 0 0 0.0%
Utilities 15.0% 39 42 44 47 8 20.1%
Construction 20.0% 206 217 230 240 35 17.0%
Manufacturing 60.0% 3,484 3,592 3,683 3,754 269 7.7%
Wholesale Trade 50.0% 397 441 498 558 162 40.8%
Retail Trade 10.0% 368 374 378 380 11 3.0%
Transportation and Warehousing 40.0% 244 240 242 245 1 0.3%
Information 0.0% 0 0 0 0 0 0.0%
Finance and Insurance 0.0% 0 0 0 0 0 0.0%
Real Estate and Rental and Leasing 0.0% 0 0 0 0 0 0.0%
Professional and Technical Services 0.0% 0 0 0 0 0 0.0%
Management of Companies and Enterprises 0.0% 0 0 0 0 0 0.0%
Administrative and Waste Services 10.0% 221 235 255 274 54 24.3%
Educational Services 5.0% 130 135 141 146 15 11.9%
Health Care and Social Assistance 5.0% 271 301 342 387 116 42.7%
Arts, Entertainment, and Recreation 10.0% 36 39 43 47 12 32.9%
Accommodation and Food Services 10.0% 248 269 297 324 76 30.7%
Other Services, Ex. Public Admin 5.0% 21 23 24 26 5 24.6%
Public Administration 5.0% 63 67 72 76 13 21.2%
Total 5,728 5,975 6,248 6,505 777 13.6%
Source: SC Works Online Serv ices; SCESC; Woods & Poole; Kimley -Horn
2016-2030 Δ

November 2017
Final Report Kitson Mill and Uptown Greenwood Study
City of Greenwood, SC
45 Kimley-Horn
Market Assessment
Light Industrial/Flex Demand Forecast
Forecasted light industrial/flex-occupying jobs have been used to estimate square footage demand. Estimates for industrial
demand are based on an average of 600 square feet per employee. Square feet per employee estimates typically vary from
300 square feet to 900 square feet, depending on use.
Table 18 demonstrates the expected increase in new light industrial-occupying employees and required square footage
through 2030 for Greenwood County. The County is forecasted to have demand for over 513,000 million square feet of
industrial space between 2016 and 2030. Similar to office, this analysis incorporates a 10% vacancy factor to support
movement into and within the market by existing and new companies. It is important to note that this forecast is based on
organic job growth, and excludes large “drop-in” distribution relocations.
Table 18: Net New Light Industrial Demand, Greenwood County, 2016-2030
Table 19 demonstrates the potential capture of the County-wide industrial demand forecast in the Study Area. This analysis
uses a 10-15% capture rate for forecasted demand to demonstrate a future range. Capture shares are relatively low given the
amount of land that is available for larger-footprint light industrial buildings. Based on these captures, the Study Area could
support approximately 51,350 to 77,000 square feet of net new light industrial/flex space through 2030.
Table 19: Net New Light Industrial Demand, Kitson Mill Study Area, 2016-2030
2016-2030
Measure 2016-2020 2020-2025 2025-2030 Total
Industrial-Occupying Jobs 247 273 258 778
Square Feet/Employee 600 600 600
Net Demand (Sq.Ft.) 147,939 164,008 154,844 466,791
Net Industrial Space Demand 162,732 180,409 170,328 513,470
Source: SC Works Online Serv ices; SCESC; Woods & Poole; Kimley -Horn
New Light Industrial Demand
Measure LOW HIGH
Greenwood County 513,470 513,470
Capture Rate 10.0% 15.0%
Study Area 51,347 77,020
Source: SC Works Online Serv ices; SCESC;
Woods & Poole; Kimley -Horn
New Office Demand
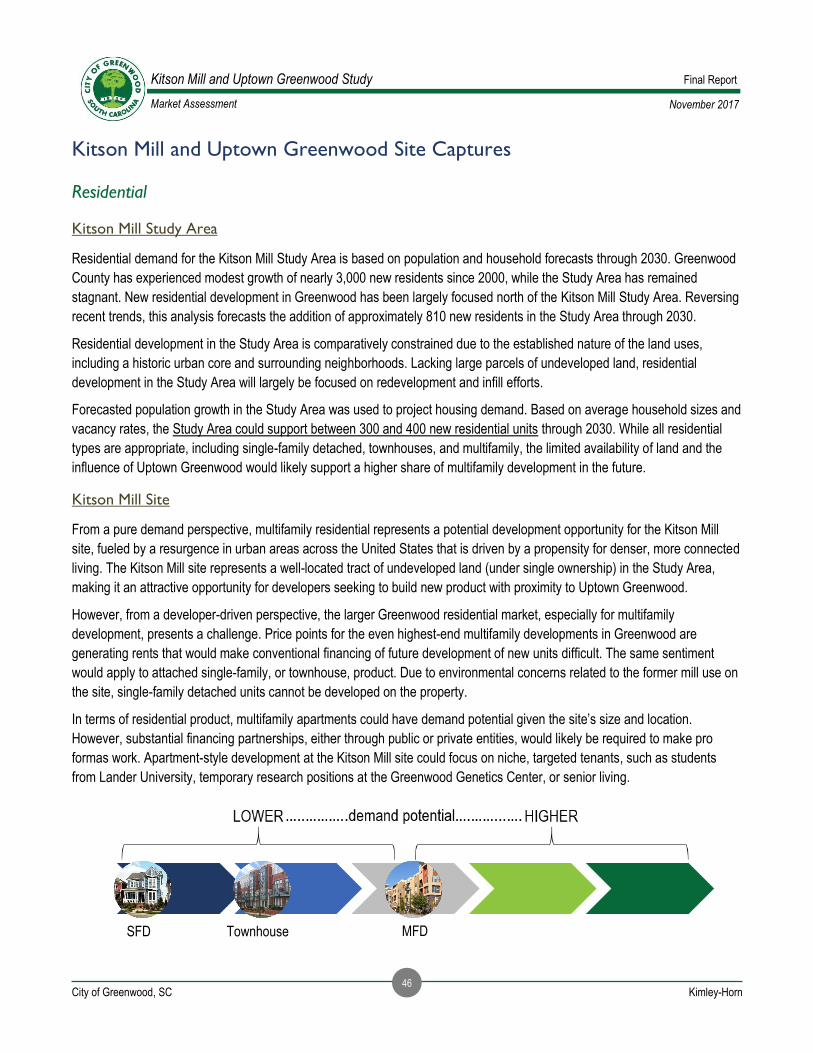
November 2017
Final Report Kitson Mill and Uptown Greenwood Study
City of Greenwood, SC
46 Kimley-Horn
Market Assessment
Kitson Mill and Uptown Greenwood Site Captures
Residential
Kitson Mill Study Area
Residential demand for the Kitson Mill Study Area is based on population and household forecasts through 2030. Greenwood
County has experienced modest growth of nearly 3,000 new residents since 2000, while the Study Area has remained
stagnant. New residential development in Greenwood has been largely focused north of the Kitson Mill Study Area. Reversing
recent trends, this analysis forecasts the addition of approximately 810 new residents in the Study Area through 2030.
Residential development in the Study Area is comparatively constrained due to the established nature of the land uses,
including a historic urban core and surrounding neighborhoods. Lacking large parcels of undeveloped land, residential
development in the Study Area will largely be focused on redevelopment and infill efforts.
Forecasted population growth in the Study Area was used to project housing demand. Based on average household sizes and
vacancy rates, the Study Area could support between 300 and 400 new residential units through 2030. While all residential
types are appropriate, including single-family detached, townhouses, and multifamily, the limited availability of land and the
influence of Uptown Greenwood would likely support a higher share of multifamily development in the future.
Kitson Mill Site
From a pure demand perspective, multifamily residential represents a potential development opportunity for the Kitson Mill
site, fueled by a resurgence in urban areas across the United States that is driven by a propensity for denser, more connected
living. The Kitson Mill site represents a well-located tract of undeveloped land (under single ownership) in the Study Area,
making it an attractive opportunity for developers seeking to build new product with proximity to Uptown Greenwood.
However, from a developer-driven perspective, the larger Greenwood residential market, especially for multifamily
development, presents a challenge. Price points for the even highest-end multifamily developments in Greenwood are
generating rents that would make conventional financing of future development of new units difficult. The same sentiment
would apply to attached single-family, or townhouse, product. Due to environmental concerns related to the former mill use on
the site, single-family detached units cannot be developed on the property.
In terms of residential product, multifamily apartments could have demand potential given the site’s size and location.
However, substantial financing partnerships, either through public or private entities, would likely be required to make pro
formas work. Apartment-style development at the Kitson Mill site could focus on niche, targeted tenants, such as students
from Lander University, temporary research positions at the Greenwood Genetics Center, or senior living.
SFD Townhouse MFD

November 2017
Final Report Kitson Mill and Uptown Greenwood Study
City of Greenwood, SC
47 Kimley-Horn
Market Assessment
Uptown Greenwood
Multifamily residential represents a strong development opportunities for Uptown Greenwood, fueled by a resurgence in urban
areas across the United States. Based on a capture of the forecasted housing demand for the Kitson Mill Study Area, Uptown
Greenwood could support between 150 and 200 residential units. Urban multifamily product is likely to take the form of smaller
developments, typically less than 50 units per development, largely due to the infill or redevelopment nature of the Uptown
area. The balance of the Study Area’s demand would likely gravitate to areas near Lander University, serving students, or
near the hospital.
The newest downtown residential product, represented by the redevelopment of a historic building into condominiums,
demonstrates a notable price premium over other non-urban product. The newly renovated mixed-use building includes retail
on the first floor and condominiums for sale on the upper floors ranging from $250,000 to $298,000. Premiums that may be
generated by downtown proximity are likely enough to meet the needs of an investment from a price point perspective. These
same premiums are unlikely at the Kitson Mill site; although it is adjacent to downtown, it feels disconnected due to separation
created by the railroad.
This analysis recommends that townhouse, condominium, and apartment opportunities would be supportable in Uptown
Greenwood in the future. In order to allow flexibility for changes in the real estate market, as well as creation of site concepts
and pro formas by potential developers, each separate product type should be considered to have strong potential. Given the
lower densities and increased land needs of single-family detached, it is unlikely that new units of this type would be
developed.
Retail
Study Area
Retail demand for the Kitson Mill Study Area is based on a variety of factors, including household growth and average
incomes, as well as inflow and leakage from commuter patterns. Uptown Greenwood represents a significant retail node in the
City, and is by far the most influential activity center in the Study Area. Projected retail demand will likely gravitate to the
Uptown Greenwood area, seeking to capitalize on the growing momentum of new retail, dining, and nightlife tenants.
Demand for new retail space in the Study Area is projected to be between 67,000 and 85,000 square feet through 2030. Retail
space could be introduced as reinvestment of currently vacant buildings in Uptown or redevelopment/new construction.
Ground-level retail space will be attracted to corridors in Uptown with the highest vehicle and pedestrian foot traffic. Potential
target tenants are outlined in the Retail Strategies Recruitment Plan, under separate cover.
SFD Townhouse MFD

November 2017
Final Report Kitson Mill and Uptown Greenwood Study
City of Greenwood, SC
48 Kimley-Horn
Market Assessment
Kitson Mill Site
Although the Kitson Mill site offers proximity to Uptown Greenwood, the site does not benefit from the same levels of vehicle
and pedestrian traffic. Demand for retail land uses will likely be limited for the Kitson Mill site at less than 5,000 square feet
through 2030. Retail uses would be the last to develop, following future starts at the property by other commercial anchors to
enhance a base of customers.
Uptown Greenwood
Retail represents another real estate sector with strong potential in Uptown Greenwood. It is likely that the Uptown area would
capture the majority of the total Study Area demand through 2030, resulting in 50,000 to 60,000 square feet of new space
potential. Retail in Uptown would gravitate to ground-level spaces on streets with strong pedestrian and vehicular traffic, first
seeking locations near thriving business nodes. While future demand will seek flexibility to accommodate a variety of in-line
suites, smaller retail spaces would likely be the most popular. As previously noted, specifics on potential tenant types, largely
focused on locally-owned businesses, are outlined in the Retail Strategies Recruitment Plan, under separate cover.
Office
Study Area
Office space located in well-designed suburban mixed-use projects or near urban central business districts have achieved
success in attracting talent-seeking companies and young, educated workers. Similar to multifamily residential, urban office
space is experiencing a resurgence across the nation.
Office demand for the Kitson Mill Study Area is based on employment growth forecasted for Greenwood County. The
employment growth scenarios are used to forecast demand by considering the types of jobs that would require different
development types. Although longer-trends demonstrate County-wide job losses in Greenwood, more recent industrial wins
have started to build momentum towards growth. This analysis projects the addition of 6,210 jobs in Greenwood County
through 2030, heavily influenced by the Healthcare, Accommodation and Food Service, Administrative Services, and
Manufacturing sectors.
Retail
Retail
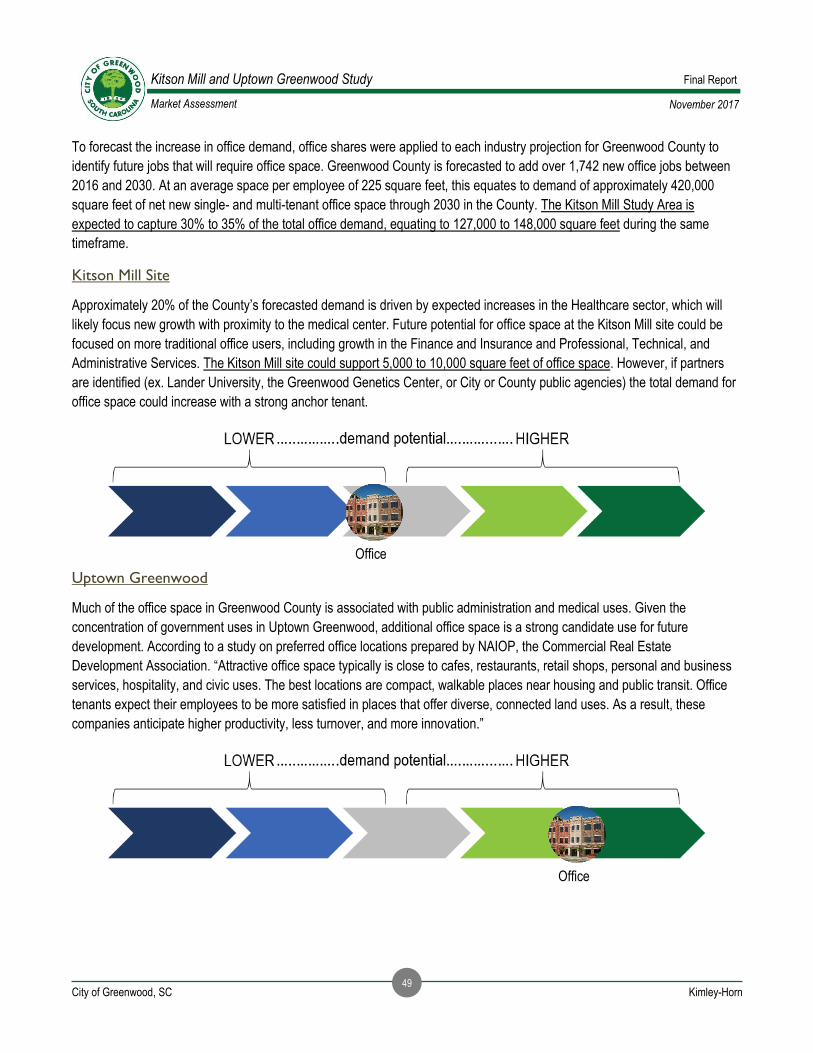
November 2017
Final Report Kitson Mill and Uptown Greenwood Study
City of Greenwood, SC
49 Kimley-Horn
Market Assessment
To forecast the increase in office demand, office shares were applied to each industry projection for Greenwood County to
identify future jobs that will require office space. Greenwood County is forecasted to add over 1,742 new office jobs between
2016 and 2030. At an average space per employee of 225 square feet, this equates to demand of approximately 420,000
square feet of net new single- and multi-tenant office space through 2030 in the County. The Kitson Mill Study Area is
expected to capture 30% to 35% of the total office demand, equating to 127,000 to 148,000 square feet during the same
timeframe.
Kitson Mill Site
Approximately 20% of the County’s forecasted demand is driven by expected increases in the Healthcare sector, which will
likely focus new growth with proximity to the medical center. Future potential for office space at the Kitson Mill site could be
focused on more traditional office users, including growth in the Finance and Insurance and Professional, Technical, and
Administrative Services. The Kitson Mill site could support 5,000 to 10,000 square feet of office space. However, if partners
are identified (ex. Lander University, the Greenwood Genetics Center, or City or County public agencies) the total demand for
office space could increase with a strong anchor tenant.
Uptown Greenwood
Much of the office space in Greenwood County is associated with public administration and medical uses. Given the
concentration of government uses in Uptown Greenwood, additional office space is a strong candidate use for future
development. According to a study on preferred office locations prepared by NAIOP, the Commercial Real Estate
Development Association. “Attractive office space typically is close to cafes, restaurants, retail shops, personal and business
services, hospitality, and civic uses. The best locations are compact, walkable places near housing and public transit. Office
tenants expect their employees to be more satisfied in places that offer diverse, connected land uses. As a result, these
companies anticipate higher productivity, less turnover, and more innovation.”
Office
Office

November 2017
Final Report Kitson Mill and Uptown Greenwood Study
City of Greenwood, SC
50 Kimley-Horn
Market Assessment
The ability to concentrate near other office users with proximity to dining and entertainment, Uptown Greenwood is likely to
capture 40,000 to 50,000 square feet of office space in the future. The balance of the Study Area’s forecast is likely to
gravitate near Self Regional Hospital and take the form of medical office space.
Light Industrial/Flex
Study Area
Industrial demand in the Kitson Mill Study Area is calculated in a similar manner to office space, based on expected growth in
jobs that require space typically categorized as industrial or flexible works space. Greenwood County is expected to
experience an increase of approximately 775 light industrial-occupying jobs through 2030. Based on an average space per
employee of 600 square feet, this equates to 515,000 square feet of County-wide demand through 2030.
Given the urban nature of the Study Area, and the resulting limited amount of easily developable, large-lot tracts, only 10% to
15% of the County-wide demand projection is expected to be captured. This equates to approximately 51,350 to 77,000
square feet of light industrial and flex space demand through 2030. Demand will likely be concentrated in tenants seeking
smaller, flexible work spaces that offer office space and warehouse/storage space in the same building configuration. This
product typically requires less land, has smaller building footprints, and more limited impacts on traffic.
Kitson Mill Site
Given the existing land uses immediately south of the site, focusing on manufacturing and warehousing buildings seeking
accessibility to Maxwell Avenue and, eventually US 178, light industrial or flexible work spaces would be a viable use for the
property. Additionally, more modern product with a blend of front offices and back warehouse space would present an
appropriate buffer between existing tenants like Eaton Corporation and Greenwood Fabricating & Planting and the
surrounding established neighborhoods. This forecast could also include buildings that house shared “maker-space” that
might attract artisans or other goods-producing small businesses.
Given the limited availability of larger tracts of land in the Study Area, the Kitson Mill site could capture a significant portion of
the projected demand through 2030. This analysis forecasts demand at the site for light industrial or flex space of 35,000 to
45,000 square feet for the forecast period.
Uptown Greenwood
Uptown Greenwood is not expected to capture any demand for light industrial/flex space given the urban nature of the area.
Light industrial/flex space will either gravitate to the Kitson Mill site, or other areas surrounding the periphery of the Study
Area.
Lt. Ind/Flex

November 2017
Final Report Kitson Mill and Uptown Greenwood Study
City of Greenwood, SC
51 Kimley-Horn
Market Assessment
Lt. Ind/Flex