markers of oxidative damage: The SABPA study
126
Urinary 1,4-dihydroxynonene mercapturic acid (DHN- MA) and 8-hydroxy-2’-deoxyguanosine (8-OHdG) as markers of oxidative damage: The SABPA study By LEANDRIE STEENKAMP, B.Sc. (Hons.) Dissertation submitted for the degree Magister Scientiae (M.Sc.) in Biochemistry at the Potchefstroom Campus of the North-West University Supervisor: Dr. R. Louw School for Physical and Chemical Sciences, North-West University (Potchefstroom Campus), South Africa Co-supervisor: Mr. E. Erasmus School for Physical and Chemical Sciences, North-West University (Potchefstroom Campus), South Africa November 2010
Transcript of markers of oxidative damage: The SABPA study

Urinary 1,4-dihydroxynonene mercapturic acid (DHN-
MA) and 8-hydroxy-2’-deoxyguanosine (8-OHdG) as
markers of oxidative damage: The SABPA study
By
LEANDRIE STEENKAMP, B.Sc. (Hons.)
Dissertation submitted for the degree Magister Scientiae (M.Sc.) in Biochemistry
at the Potchefstroom Campus of the North-West University
Supervisor: Dr. R. Louw
School for Physical and Chemical Sciences, North-West University (Potchefstroom
Campus), South Africa
Co-supervisor: Mr. E. Erasmus
School for Physical and Chemical Sciences, North-West University (Potchefstroom
Campus), South Africa
November 2010

Equipped with his five senses, man explores the universe around him
and calls the adventure Science
~ Edwin Powell Hubble, The Nature of Science, 1954

This dissertation is dedicated to my son, Gunther,
who is expected in November 2010.

i
Abstract vi
Opsomming viii
Acknowledgements x
List of Symbols and Abbreviations xi
List of Equations xvi
List of Figures xvii
List of Tables xx
Chapter 1: Introduction 1
Chapter 2: Literature review 3
2.1. Free radicals 3
2.1.1. Origin of ROS 3
2.1.1.1. Mitochondria 3
2.1.1.2. Detoxification 6
2.1.1.3. Peroxisomes and neutrophils 7
2.1.2. Oxidative stress and free radical defence 7
2.1.3. Consequences of oxidative stress 9
2.2. Biomarkers of oxidative damage 10
2.2.1. DNA damage and 8-OHdG 10
2.2.2. Lipid peroxidation and DHN-MA 13
2.3. Aims and objectives 16
2.4. Experimental approach 17
Chapter 3: Materials and methods 18
3.1. The SABPA study 18
TABLE OF CONTENTS

ii
3.1.1. Participants and methodological approach 18
3.1.2. Ethics approval 18
3.1.3. Sample collection and storage 19
3.2. Creatinine values 20
3.3. Reactive oxygen species (ROS) assay 20
3.3.1. Basis of ROS assay 20
3.3.2. Reagents 20
3.3.3. Buffers and solutions 20
3.3.4. ROS assay 21
3.4. Statistical analysis and interpretation of data 22
Chapter 4: Optimisation and validation of the 8-OHdG assay 23
4.1. Introduction 23
4.2. Chemicals, standard solutions and buffers 24
4.2.1. Chemicals 24
4.2.2. Standard solutions and buffers 24
4.3. Optimisation of LC-MS/MS conditions for quantification of
8-OHdG in urine 23
4.3.1. Specifications of the LC-MS/MS 23
4.3.2. Optimisation of the MS conditions 25
4.3.3. Chromatographic separation of 8-OHdG, 2’dG and 2’dG15N 27
4.4. Solid phase extraction (SPE) of 8-OHdG from urine 30
4.5. The optimised 8-OHdG assay 33
4.6. Validation of the 8-OHdG quantification assay 35
4.6.1. Linearity of the 8-OHdG assay 35
4.6.2. Response factor of 8-OHdG to 2’dG15N 37

iii
4.6.3. Intrabatch and interbatch variation of the 8-OHdG
quantification method 37
4.7. Conclusions on the optimised assay 39
Chapter 5: Optimisation and validation of the DHN-MA assay 40
5.1. Introduction 40
5.2. Chemicals, standard solutions and buffers 40
5.2.1. Chemicals 40
5.2.2. Standard solutions and buffers 40
5.3. Synthesis of DHN-MA and DHN-MA-d3 from 4-HNE-MA
and 4-HNE- MA-d3 respectively 41
5.4. Optimisation of LC-MS/MS conditions for quantification of
DHN-MA in urine 42
5.4.1. Specifications of the LC-MS/MS 42
5.4.2. Optimisation of the MS conditions for 4-HNE-MA
and 4-HNE-MA-d3 quantification 42
5.4.3. Optimisation of the MS conditions for DHN-MA and
DHN-MA-d3 quantification 44
5.4.4. Chromatographic separation 45
5.5. Purification of the synthesised DHN-MA and DHN-MA-d3 49
5.6. Quantification of the synthesised DHN-MA and DHN-MA-d3 51
5.7. Solid phase extraction of DHN-MA from urine 54
5.8. The optimised DHN-MA assay 54
5.9. Validation of the standardised DHN-MA assay 55
5.9.1. Linearity of the DHN-MA assay 55
5.9.2. Validation of the solid phase extraction (SPE) process

iv
for the DHN-MA assay 58
5.9.3. Measuring DHN-MA in human urine 62
5.10. Additional modifications to the DHN-MA assay 64
5.10.1. The effect of different reversed phase chromatographic
columns on the DHN-MA assay 64
5.10.2. The effect of a normal phase chromatographic column
on the DHN-MA assay 66
5.10.3. The effect of pH on the chromatography of DHN-MA 67
5.11. Conclusions on the optimised DHN-MA assay 68
Chapter 6: Results and discussion 70
6.1. Introduction 70
6.2. Urinary 8-OHdG levels 70
6.2.1. The effect of gender on urinary 8-OHdG levels 72
6.2.2. The effect of ethnicity on urinary 8-OHdG levels 75
6.3. The correlation between 8-OHdG and ROS levels 77
6.4. Discussion 78
Chapter 7: Conclusion 80
7.1. Introduction 80
7.2. Optimisation of the 8-OHdG and DHN-MA assay 80
7.3. The effect of ethnicity and gender on urinary 8-OHdG levels and the
correlation of 8-OHdG with serum ROS levels 81
7.4. Recommendations for further studies 83
i. 8-OHdG assay 83
ii. DHN-MA assay 83
iii. Studies including Caucasians and Africans 84
iv. ROS assay, BER enzyme analysis (DNA glycosylase/lyase)
and gene knock-out experiments (OGG1) 84

v
7.5. Conclusion 84
References 85
Appendix A 95

vi
The human body has evolved certain defence mechanisms to cope with the high occurrence of
free radicals. These radicals are obtained endogenously from the mitochondria, peroxisomes,
the cytochrome P450 (CYP 450) system and neutrophils, or exogenously from the environment.
Lack of antioxidants and/or increased production of free radicals will result in oxidative stress,
which has been implicated in certain human diseases such as hypertension, inflammation,
ageing, autoimmunity, atherosclerosis, Parkinson’s disease, cancer and diabetes.
Although the initial aim was to standardise a single assay to quantify both 8-OHdG and DHN-
MA, this could not be achieved in this study due to the vast difference in the chemical properties
of these two metabolites. Following the decision to use two separate assays for the
quantification of the mentioned biomarkers, the 8-OHdG assay was standardised and validated.
The intrabatch variation of the assay was 4.18% and the interbatch variation was 17.37%.
Unfortunately, the DHN-MA assay could not be standardised within the time frame of this study
due to experimental difficulties. Therefore, only urinary 8-OHdG and serum ROS levels were
quantified.
Urinary 8-OHdG levels were measured in 409 participants (209 Caucasians, 101 males and 108
females and 200 Africans, 100 males and 100 females) from the SABPA study. After removal of
outliers from the data matrix, the effect of gender and ethnicity was investigated on the
measured urinary 8-OHdG levels. No significant difference in the urinary 8-OHdG levels
between Caucasian males (n=87) and females (n=96) were observed (p = 0.68). A similar
observation was made for the African males (n=86) and females (n=84), where no significant
difference in 8-OHdG levels was detected (p = 0.053). Thus, from the results obtained in this
study, it seems that urinary 8-OHdG levels are not influenced by gender. However, 8-OHdG
levels were dramatically influenced by ethnicity. Caucasian males (n=87) excreted 70% higher
amounts of 8-OHdG compared to African males (n=86) (p < 0.001). Caucasian females (n=96)
also excreted larger urinary 8-OHdG amounts (42%) compared to African females (n=84) (p <
0.001). Therefore, it seems that urinary 8-OHdG levels are dramatically influenced by ethnicity.
Finally, urinary 8-OHdG levels were compared to serum ROS levels, but no significant
correlation between the measured metabolites was observed (r = -0.045). Hence, urinary 8-
OHdG and serum ROS levels are not related in these subjects.
Even though the initial aim of this study was to standardise an analytical method to quantify
both urinary 8-OHdG and DHN-MA, this could not be achieved due to time constraints.
ABSTRACT

vii
However, an LC-MS/MS analytical assay was standardised and validated for the quantification
of urinary 8-OHdG. The method proved reliable for the quantification of 8-OHdG from urine
samples and can thus be used for further studies on oxidative DNA damage.

viii
Die menslike liggaam beskik oor sekere verdedigings meganismes om die hoë voorkoms van
vrye radikale te neutraliseer. Die vrye radikale kom endogeen voor vanuit die mitokondria,
peroksisome, die sitochroom P450 sisteem (CYP450) en neutrofiele of eksogeen van die
omgewing. ʼn Tekort aan antioksidante en/of ʼn verhoogde produksie van vrye radikale sal
oksidatiewe stres tot gevolg hê, wat al geimpliseer is in veroudering en verskeie siekte-
toestande soos, hipertensie, inflammasie, veroudering, outo-immuun-siektes, arterosklerose,
Parkinson se siekte, kanker en diabetes.
Alhoewel die aanvanklike doel van hierdie studie was om een metode te standardiseer om
beide 8-OHdG en DHN-MA te kwantifiseer, kon dit nie in die studie bereik word nie a.g.v. die
groot verskil in die chemiese eienskappe van die twee metaboliete. Na besluitneming om die
kwantifisering van die twee metaboliete te skei, is die 8-OHdG analise gestandardiseer en
gevalideer. Die intra-groep variasie van die analise was 4.18% en die inter-groep variasie was
17.37%. Weens verskeie struikelblokke kon die DHN-MA analise nie gestandardiseer word
binne die tydraamwerk van die studie nie. Daarom is net die urinêre 8-OHdG en serum ROS
vlakke gekwantifiseer.
Urinêre 8-OHdG vlakke is in 409 deelnemers van die SABPA studie bepaal (209 Kaukasieërs,
101 manlik en 108 vroulik en 200 Afrikane, 100 manlik en 100 vroulik). Na die verwydering van
uitskieters van die data matriks is die effek van geslag en etnisiteit op die gemete urinêre 8-
OHdG vlakke ondersoek. Geen betekenisvolle verskil is waargeneem in die urinêre 8-OHdG
vlakke in Kaukasieër-mans (n=87) en -vrouens (n=96) nie (p = 0.68). ʼn Soortgelyke resultaat
was waargeneem in Afrikaan-mans (n=86) en -vrouens (n=84), waar geen betekenisvolle
verskil in 8-OHdG vlakke gevind was nie (p = 0.053). Die resultate van die studie toon dus dat
urinêre 8-OHdG vlakke nie deur geslag beïnvloed word nie. Vervolgens is die effek van etnisiteit
op urinêre 8-OHdG vlakke bestudeer. By Kaukasieër-mans (n=87) is 70% hoër 8-OHdG vlakke
gemeet in vergelyking met Afrikaan-mans (n=86) (p < 0.001). Kaukasieër-vrouens (n=96) het
ook meer 8-OHdG uitgeskei (42%) as Afrikaan-vrouens (n=84) (p < 0.001). Dit blyk dus dat
urinêre 8-OHdG vlakke dramaties beïnvloed word deur etnisiteit. Laastens is bevind dat urinêre
8-OHdG vlakke geen korrelasie toon met serum ROS vlakke nie (r = -0.045). Gevolglik is geen
verwantskap in hierdie studiegroep gevind tussen urinêre 8-OHdG en serum ROS vlakke nie.
Die oorspronklike doel van die studie was om een analitiese metode te standardiseer vir die
kwantifisering van beide 8-OHdG en DHN-MA. Hierdie doelstelling kon egter nie bereik word nie
OPSOMMING

ix
weens tydbeperkinge op die studie. ʼn LC-MS/MS analise is gestandardiseer en gevalideer vir
die kwantifisering van urinêre 8-OHdG vlakke. Die metode is betroubaar vir die kwantifisering
van 8-OHdG vlakke in uriene en kan dus gebruik word vir verdere studies op oksidatiewe DNS-
skade.

x
I would like to express my sincere gratitude to the following persons and institutions for their
contribution made to this study:
I would like to share my greatest appreciation for the Lord, my savior, for all the talents and
oppurtunities that He has given me.
Dr. Roan Louw, my supervisor, for his guidance, patience and support.
Mr. Erasmus, my co-supervisor, for his guidance with the chromatography analysis.
Dr. G. Koekemoer, with all his help and input in the statistical analysis of the data obtained.
Mr. Peet Jansen van Rensburg, for his guidance and help with the LC-MS/MS.
Mrs. Hettie Sieberhagen, for checking and editing the language of this dissertation.
The Physiology department and in particular Prof. Leone Malan, for giving me the oppurtunity to
take part in the SABPA study.
My mother, mother- and father-in-law, for their love and support.
Finally and most important, my husband Kobus, for his patience, support, kind words and love.
Thank you for always being there for me.
ACKNOWLEDGEMENTS

xi
Symbols
°C Degrees Celsius
% Percentage
> Greater than
< Less than
® Registered
™ Trademark
± Plus minus
β Beta
ω Omega
Abbreviations
2’dG 2’-deoxyguanosine
2’dG15N 2’-deoxyguanosine-N15
4-HNE trans-4-hydroxy-2-nonenal
4-HNE-MA trans-4-hydroxy-2-nonenal mercapturic acid
4-HNE-MA-d3 trans-4-hydroxy-2-nonenal mercapturic acid-d3
8-OHAde 8-hydroxy-adenine
8-OHdA 8-hydroxy-2’-deoxyadenosine
8-OHGua 8-hydroxy-guanine
8-OHdG 8-hydroxy-2’-deoxyguanosine
A
ADP Adenosine diphosphate
AKR Aldo-keto reductase
Aq Aqua
ATP Adenosine Triphosphate
B
BER Base excision repair
LIST OF SYMBOLS AND
ABBREVIATIONS

xii
BDM Brunner-Dette-Munk
BHT Butylated Hydroxytoluene
C
CA California
Cat. No. Catalogue number
CE-ECD Capillary electrophoresis-electrochemical detection
CE-MS Capillary electrophoresis-mass spectrometery
CO2 Carbon dioxide
CoA Coenzyme A
cm Centimeter
CuZn-SOD Copper-Zinc superoxide dismutase
CYP 450 Cytochrome P450 system
D
DEPPD N,N-diethyl-para-phenylenediamine
dGTP Deoxyguanosine triphosphate
DHN 1,4-dihydroxynonene
DHN-MA 1,4-dihydroxynonene mercapturic acid
DHN-MA-d3 1,4-dihydroxynonene mercapturic acid-d3
DNA Deoxyribonucleic acid
E
e.g. For example
et al. And others
etc. et cetera
ETC Electron transport chain
ELISA Enzyme-linked immunosorbent assay
ECSOD Extracellular superoxide dismutase
G
g g force (9.80665 m/s2)
g gram

xiii
GCL Glutamate cysteine ligase
GC-MS Gas chromatography-mass spectrometry
GMP Guanosine monophosphate
GSH Glutathione
GSSG Oxidised glutathione
GST Glutathione-S-transferase
H
H2O2 Hydrogen peroxide
HCl Hydrochloric acid
HPLC-ECD High-performance liquid chromatography-
electrochemical detection
I
i.e. that is
L
l Liter
LC-MS/MS Liquid chromatography- tandem mass spectrometry
M
µl microliter
µM micromolar
ml milliliter
mg/ml milligram/ milliliter
ml/min milliliter/ minute
min minutes
mM Millimolar
mm Hg millimeters of mercury
M Molar
m/z mass-to-charge-ratio
MDA Malondialdehyde
MeCN Acetonitrile

xiv
MeOH Methanol
MnSOD Mitochondrial-manganese superoxide dismutase
MRM Multiple reaction monitoring
MS Mass spectrometer
MS/MS Tandem mass spectrometer
N
Nm nanometer
nmol/g nanomol/ gram
NER Nucleotide excision repair
-NH2 Amino group
O
O2 Oxygen
O2.- Superoxide anion
1O2 Singlet oxygen
OH. Hydroxyl radical
Ox-LDL Oxidised low-density lipoprotein
OGG1 DNA glycosylase/lyase
P
PUFA Polyunsaturated fatty acid
R
RNS Reactive nitrogen species
ROS Reactive oxygen species
RSA Republic of South Africa
RSD Relative Standard Deviation
S
SABPA Sympathetic Activity and Ambulatory Blood pressure in
Africans
SB Stable bond
SD Standard deviation

xv
SOD Superoxide dismutase
SPE Solid phase extraction
SST Serum separator tube
T
TCA Tricarboxylic acid cycle
Tg Thymine glycol
TIC Total ion chromatogram
U
USA United States of America
UV Ultraviolet

xvi
Equation no. Title of equation Page no.
Equation 4.1: Response factor of 8-OHdG to 2’dG15N 37
Equation 5.1: Response factor of DHN-MA to AMA 54
LIST OF EQUATIONS
SS

xvii
Figure no. Titel of Figure Page no.
Figure 2.1: Liver detoxification, illustrating reactions of Phase I and II,
excretion of xenobiotics and formation of ROS (Adapted
from Liska, 1998) 6
Figure 2.2: Free radical defence 8
Figure 2.3: Formation of DHN-MA (Adapted from Peiro et al., 2005) 15
Figure 2.4: Visual representation of the strategy used in this study 17
Figure 4.1: Chromatographic separation of 2’dG and 8-OHdG standard
solutions 28
Figure 4.2: Chromatographic separation of 2’dG15N and 8-OHdG
standard solutions 29
Figure 4.3: TIC of the loading and wash step of the SPE method 31
Figure 4.4: TIC showing the elution of 8-OHdG and 2’dG15N from the SPE
column with the first elution step 32
Figure 4.5: TIC for 8-OHdG and 2’dG15N from the SPE column with the
second elution step 33
Figure 4.6: Calibration curve of 8-OHdG as obtained with the standardised
8-OHdG method 36
Figure 4.7: Calibration curve of 8-OHdG as obtained with the standardised
8-OHdG method in the lower concentration range 36
Figure 5.1: Chromatogram of DHN-MA obtained when using the
standard chromatographic conditions for DHN-MA separation 47
LIST OF FIGURES
SS

xviii
Figure 5.2: Chromatogram of DHN-MA-d3 obtained with
chromatographic separation using the same standard
chromatographic conditions as for DHN-MA separation 48
Figure 5.3: LC-MS/MS analysis of the synthesised DHN-MA by direct
infusion on an LC-MS/MS 50
Figure 5.4: Chromatogrpahic separation of acetaminophen
mercapturic acid (AMA) 52
Figure 5.5: Chromatographic separation of AMA and DHN-MA
on an LC-MS/MS 53
Figure 5.6: The linearity of the DHN-MA assay. (R2 > 0.99) 56
Figure 5.7: The linearity of the DHN-MA-d3 assay. (R2 > 0.99) 57
Figure 5.8: TIC of the eluate from the loading step of the SPE process 58
Figure 5.9: TIC of the first washing step of the SPE process 59
Figure 5.10: TIC of the first elution step with 6 ml 40% MeOH of
the SPE process 59
Figure 5.11: TIC of the second washing step with 6 ml 100% MeCN of
the SPE process 60
Figure 5.12: Chromatogram of the product ion spectra of the contaminant
metabolite that eluted at approximately 2 minutes as well as the
product ion spectra of DHN-MA 61
Figure 5.13: Chromatogram of a control urine sample 63
Figure 5.14: Chromatographic separation of DHN-MA-d3 on a C18 column 65
Figure 5.15: Chromatographic separation of DHN-MA-d3 using a C8 column 66
Figure 5.16: Overlay of chromatographic separation of DHN-MA-d3 on an

xix
AscentisTM Si column using different concentrations mobile
phases 67
Figure 5.17: Chromatogram of DHN-MA-d3 obtained with the C18
column with different pH buffers of ammonium formate 68
Figure 6.1: Distribution of the urinary 8-OHdG data. Since the data was
skewed (p < 0.01), non-parametric tests were used to further
analyse the data 71
Figure 6.2: Schematic representation of the 8-OHdG data for the
SABPA participants after outliers were removed from the data
set by the use of Tukey’s method 72
Figure 6.3: Urinary 8-OHdG levels of African females (n=84) and African
males (n=86) (p = 0.053) 73
Figure 6.4: Urinary 8-OHdG levels of Caucasian females (n=96) and
Caucasian males (n=87) (p = 0.68) 74
Figure 6.5: Urinary 8-OHdG levels of African males (n=86) and Caucasian
males (n=87) (p < 0.001) 75
Figure 6.6: Urinary 8-OHdG levels of African females ( n=84) and
Caucasian females (n=96) (p < 0.001) 76
Figure 6.7: Scatter plot of 8-OHdG vs. ROS levels measured in the
SABPA participants 77

xx
Table no. Title of Table Page no.
Table 4.1: The optimal electrospray tandem mass spectrometric conditions
for the detection of 8-OHdG 25
Table 4.2: The optimal electrospray tandem mass spectrometric conditions
for the detection of 2’dG 26
Table 4.3: The optimal electrospray tandem mass spectrometric conditions
for the detection of 2’dG15N 26
Table 4.4: Mobile phase gradient timetable used for the
chromatographic separation of 8-OHdG, 2’dG and 2’dG15N 28
Table 4.5: Mobile phase gradient timetable for the wash program
used after every batch of 20 samples analysed on the
LC-MS/MS 35
Table 4.6: Intrabatch variation of the 8-OHdG method 38
Table 4.7: Interbatch variation of the 8-OHdG method 38
Table 5.1: The optimal electrospray tandem mass spectrometric conditions
for the detection of 4-HNE-MA 43
Table 5.2: The optimal electrospray tandem mass spectrometric conditions
for the detection of 4-HNE-MA-d3 43
Table 5.3: The optimal electrospray tandem mass spectrometric conditions
for the detection of DHN-MA 44
Table 5.4: The optimal electrospray tandem mass spectrometric conditions
for the detection of DHN-MA-d3 45
LIST OF TABLES
SS

xxi
Table 5.5: Mobile phase gradient timetable used for the
chromatographic separation of 8-OHdG, 2’dG15N, DHN-MA
and DHN-MA-d3 46
Table 5.6: The optimal electrospray tandem mass spectrometric conditions
for the detection of acetaminophen mercapturic acid (AMA) 51
Table 5.7: A dilution range of the synthesised DHN-MA used to
evaluate the linearity of the DHN-MA assay 56
Table 5.8: A dilution range of the synthesised DHN-MA-d3 used to
evaluate the linearity of the DHN-MA-d3 assay 57
Table A1: Raw data of the 409 SABPA participants 95
1
CHAPTER 1
Introduction
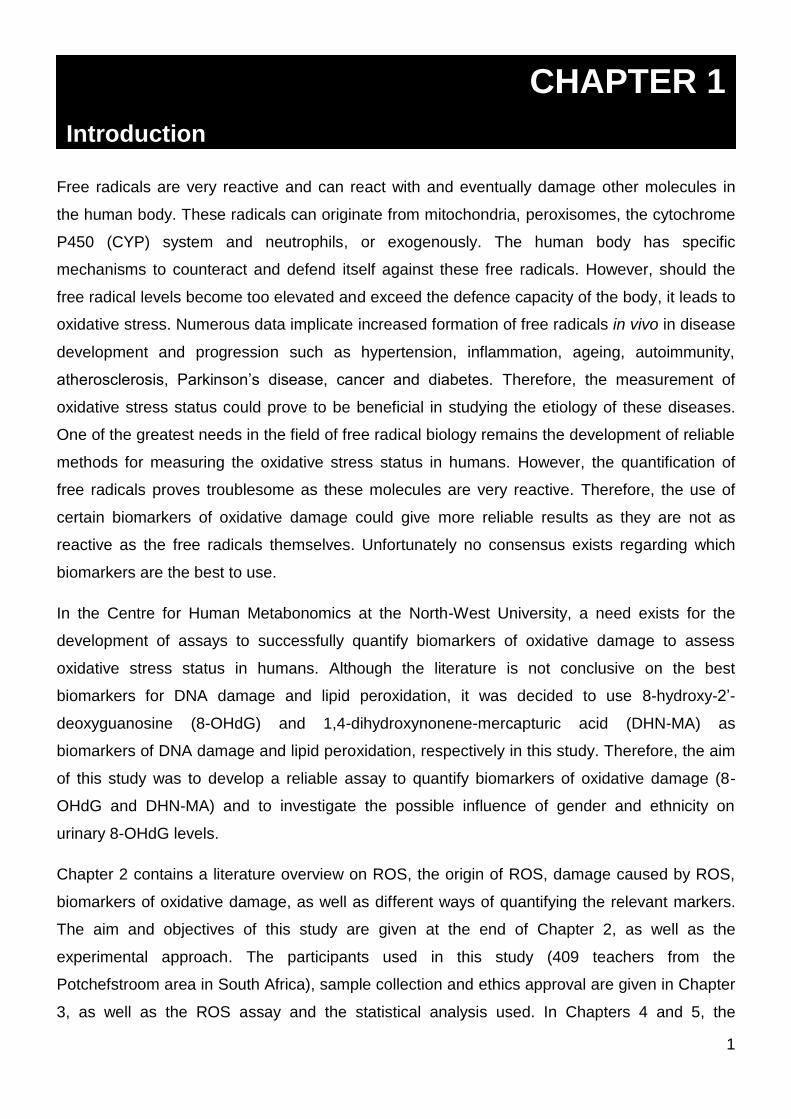
Free radicals are very reactive and can react with and eventually damage other molecules in
the human body. These radicals can originate from mitochondria, peroxisomes, the cytochrome
P450 (CYP) system and neutrophils, or exogenously. The human body has specific
mechanisms to counteract and defend itself against these free radicals. However, should the
free radical levels become too elevated and exceed the defence capacity of the body, it leads to
oxidative stress. Numerous data implicate increased formation of free radicals in vivo in disease
development and progression such as hypertension, inflammation, ageing, autoimmunity,
atherosclerosis, Parkinson’s disease, cancer and diabetes. Therefore, the measurement of
oxidative stress status could prove to be beneficial in studying the etiology of these diseases.
One of the greatest needs in the field of free radical biology remains the development of reliable
methods for measuring the oxidative stress status in humans. However, the quantification of
free radicals proves troublesome as these molecules are very reactive. Therefore, the use of
certain biomarkers of oxidative damage could give more reliable results as they are not as
reactive as the free radicals themselves. Unfortunately no consensus exists regarding which
biomarkers are the best to use.
In the Centre for Human Metabonomics at the North-West University, a need exists for the
development of assays to successfully quantify biomarkers of oxidative damage to assess
oxidative stress status in humans. Although the literature is not conclusive on the best
biomarkers for DNA damage and lipid peroxidation, it was decided to use 8-hydroxy-2’-
deoxyguanosine (8-OHdG) and 1,4-dihydroxynonene-mercapturic acid (DHN-MA) as
biomarkers of DNA damage and lipid peroxidation, respectively in this study. Therefore, the aim
of this study was to develop a reliable assay to quantify biomarkers of oxidative damage (8-
OHdG and DHN-MA) and to investigate the possible influence of gender and ethnicity on
urinary 8-OHdG levels.
Chapter 2 contains a literature overview on ROS, the origin of ROS, damage caused by ROS,
biomarkers of oxidative damage, as well as different ways of quantifying the relevant markers.
The aim and objectives of this study are given at the end of Chapter 2, as well as the
experimental approach. The participants used in this study (409 teachers from the
Potchefstroom area in South Africa), sample collection and ethics approval are given in Chapter
3, as well as the ROS assay and the statistical analysis used. In Chapters 4 and 5, the

Introduction
2
optimisation and validation of the 8-OHdG and DHN-MA assays respectively are given and
discussed. The quantification of ROS and oxidative damage biomarkers are described and
discussed in Chapter 6 before the concluding remarks and observations are given in Chapter 7.
Raw data are presented in Appendix A.

3
2.1. Free radicals
Chemical species which possess one or more unpaired electrons are known as free radicals
(Aruoma, 1998). These molecules are unstable and can react with, and consequently fragment,
other molecules (Singh et al., 2009.) The term, reactive oxygen species (ROS) is used to
describe free radicals such as superoxide anions (O2.-), hydroxyl radicals (.OH), singlet oxygen
(1O2) as well as some non-radicals like hydrogen peroxide (H2O2) (Wiseman & Halliwell, 1996;
Aruoma, 1998). Since O2.- could react with nitric oxide (NO.) to produce peroxynitrite, a powerful
oxidant, the oxidants derived from NO. are termed reactive nitrogen species (RNS) (Turrens,
2003).
2.1.1. Sources of ROS
Reactive oxygen species in the body may originate from exogenous as well as endogenous
sources. Endogenously, ROS are produced in the mitochondria, peroxisomes, the cytochrome
P450 (CYP 450) system and neutrophils or could originate from exogenous sources such as UV
radiation, drugs, etc. (Karithala & Soini, 2007). Irrespective of their origin, high ROS levels could
have detrimental consequences for the cell (Cooke et al., 2003) if it is not sequestered by
defence mechanisms.
2.1.1.1. Mitochondria
Mitochondria are better known as the power-generating units of the cell (Johannsen &
Ravussin, 2009). They are plentiful where energy-requiring processes take place, such as
cardiac muscle, and provide most of the energy required for cellular processes (Johannsen &
Ravussin, 2009).
Respiration can be divided into three main pathways: glycolysis, the tricarboxylic acid cycle
(TCA cycle) and the electron transport chain (ETC). During glycolysis, which occurs in the
cytoplasm, glucose is catabolised to yield two molecules of pyruvic acid and two NADH
molecules with a net gain of two ATP molecules. In the mitochondria, the enzyme system of the
TCA cycle functions to break down acetyl Coenzyme A (CoA), derived from pyruvate (produced
by glycolysis in the cytoplasm), fatty acids and amino acids. During this process, CO2 is
produced and NAD+ and FAD2+ are reduced to form the electron donors NADH and FADH
respectively (Duchen, 2004).
CHAPTER 2
Literature review

Literature review
4
The enzyme pathway (electron transport chain) responsible for ATP generation through
oxidative phosphorylation, consists of complexes I through V (Hatefi, 1985). The ETC consists
of NADH-quinine oxidoreductase (Complex I), succinate dehydrogenase (Complex II),
cytochrome bc1 complex (Complex III), cytochrome c oxidase (Complex IV) and ATP synthase
(Complex V) (Vedel et al., 1999). The electron donors (NADH and FADH2), produced during
glycolysis and the TCA cycle, transfer their electrons to complex I and II of the ETC,
respectively (Duchen, 2004). As the electrons pass through the ETC to molecular oxygen, the
terminal electron acceptor (Kowaltowski et al., 2009), protons are pumped from the
mitochondrial matrix to the intermembrane space, establishing a proton gradient (Johannsen &
Ravussin, 2009). This proton gradient generates a proton motive force (Bratic & Trifunovic,
2010). When protons diffuse back along this gradient they drive the synthesis of ATP through
ATP synthase (Complex V) by the phosphorylation of ADP (Johannsen & Ravussin, 2009).
Approximately 90% of the total ROS produced in the cell, originates from the mitochondria
(Bratic & Trifunovic, 2010) and is formed due to an electron “leak” that occurs mainly from
complex I and III (St. Pierre et al., 2002). This is because approximately 90% of the oxygen
consumed by humans is used by the mitochondria (Nohl et al., 2005). Should the ETC become
saturated with electrons, the accumulated electrons from complex I and III could pass directly to
O2 to generate superoxide (O2.-) (Turrens, 2003). Due to its reactivity, O2
.- is transformed into
H2O2 (Kowaltowski et al., 2009) either through spontaneous dismutation or by superoxide
dismutase, such as mitochondrial manganese SOD (Mn-SOD) as well as copper-zinc SOD
(CuZn-SOD) (Weisiger & Fridovich, 1973; Nohl et al., 2005). O2.- is also the primary ROS
produced in the mitochondria (Lenaz, 1998; Bartosz, 2009). Should the resultant H2O2 not be
metabolised by the mitochondrial antioxidant system, it could lead to the formation of hydroxyl
radicals (OH.) which are highly reactive radicals (Cooke et al., 2003; Kowaltowski et al., 2009). It
is estimated that approximately 0.2 % of all the oxygen consumed by humans will eventually
result in the formation of ROS (St-Pierre et al., 2002).
2.1.1.2. Detoxification
Humans have become progressively more exposed to toxic compounds in the air, water and
food, and people’s ability to cope with these toxins, either obtained exogenously or
endogenously, are of great importance to their health (Liska et al., 2006). Detoxification
enzymes in general, function sufficiently to minimise cellular damage (lipid peroxidation, DNA-
and protein damage), however, dysfunction may occur should the system be overloaded or
imbalanced (Liska et al., 2006). Detoxification, also known as biotransformation, converts non-

Literature review
5
polar xenobiotics into a more polar substance for excretion and it is mainly divided into two
phases, Phase I and Phase II detoxification (Vander et al., 1994).
Phase I detoxification is the first step in the elimination of non-polar xenobiotics, and depends
on antioxidant support to be effective (Liska et al., 2006). Here, the cytochrome P450 (CYP
450) family of enzymes is the first line of defence against xenobiotics (Liska, 1998) (Figure 2.1).
In Phase I, a functional group (a hydroxyl-, carboxyl- or amino group) is exposed on the
xenobiotic either through oxidation, hydrolation or reduction, which then needs to be further
transformed by Phase II (Percival, 1997; Zamek-Gliszczynski et al., 2006) (Figure 2.1). This is
necessary since the by-products of Phase I can sometimes be more toxic than the original
substance (Percival, 1997; Liska, 1998). Many xenobiotics undergo Phase I oxidation before
conjugation during Phase II (Crayford & Hutson, 1980). However, certain xenobiotics may
undergo Phase II conjugation directly (Gram & Gilette, 1971).
Each CYP 450 reaction also leads to the formation of ROS, such as superoxide, peroxide or
hydroxyl radicals (Liska et al., 2006). Thus, an increase in toxin exposure increases CYP 450
activity which in turn increases ROS production and ultimately oxidative stress (Percival, 1997).
Should the detoxification system be burdened or not functioning properly, intermediary
metabolites may not be eliminated successfully. When these reactive oxygen intermediates
accumulate, it may also contribute to oxidative stress (Percival, 1997).

Literature review
6
Figure 2.1: Phase I and II detoxification in the liver. Phase I is the first line of defence in the
biotransformation process. The CYP 450 enzyme system exposes a functional group on the xenobiotic
through one of CYP 450s’ reactions. Phase II functions to conjugate a protecting agent onto the
intermediary metabolites from Phase I to further increase the polar nature which is needed to eliminate
the xenobiotic. Free radicals are produced during detoxification through Phases I and II (Adapted from
Liska, 1998).
Phase II is better known as the conjugation pathway and depends on specific nutritional support
to be fully functional (Liska et al., 2006). It functions by decreasing the activity and toxicity of a
xenobiotic from Phase I (Liska et al., 2006). Here, xenobiotics from Phase I are further
transformed by conjugating to a protecting agent, which makes the xenobiotic more polar and
thus ready for excretion (Figure 2.1). The reactions for Phase II are sulfation-, glucuronidation-,
acetylation-, methylation-, as well as glutathione- (GSH) and amino acid conjugation (Liska et
al., 2006) (Figure 2.1). The most prevalent of the conjugation reactions are sulfation-,
glucuronide- and glutathione conjugation (Zamek-Gliszczynski et al., 2006). Although sulfation
and glucuronide both conjugate with many of the same xenobiotics, glucuronide conjugation is
most common at high concentrations when sulfation is inundated (due to co-substrate depletion
or enzyme saturation) (Zamek-Gliszczynski et al., 2006). GSH conjugation is a vital Phase II
conjugation reaction and its substrates include parent compound electrophiles, electrophilic
Endogenous- and
exogenous non-polar
xenobiotics
Phase I Phase II
Intermediary
metabolites (More
polar) CYP450
Oxidation
Reduction
Hydrolysis
Hydration
Dehalogenation
Conjugation
Sulfation
Glucuronidation
Glutathione and amino
acid conjugation
Acetylation
Methylation
Reactive oxygen
species intermediate
Excretion of polar
molecules
Secondary tissue
damage
Free radicals
O2.-

Literature review
7
Phase I metabolites and some Phase II conjugates (Zamek-Gliszczynski et al., 2006). Both
Phases I and II are imperative to detoxification, evidence suggests that induced Phase I and/or
decreased Phase II reactions increase the risk of cancer and Parkinson’s disease (LeCouteur et
al., 2002; Norrpa, 2004). Thus, it is important for these two phases of detoxification to work
together, to successfully complete the detoxification process (Liska et al., 2006).
2.1.1.3. Peroxisomes and neutrophils
Peroxisomes are present in all eukaryotic cells except erythrocytes (Fidaleo, 2009).
Peroxisomes are involved in β-oxidation of very long chain fatty acids, prostaglandins and
leukotrienes (Ferdinandusse et al., 2002) as well as the biosynthesis of cholesterol, bile acids,
dolichol, and ether lipids (Van den Bosch et al., 1992). They also function to oxidize polyamines,
uric acid and amino acids (Subramani et al., 2000) and are involved in the detoxification of
xenobiotics (Schrader & Fahimi, 2006). The respiratory pathway in peroxisomes reduce O2 to
H2O2, thus, peroxisomes are involved in the production of ROS and also in the scavenging of
ROS through catalase (Fidaleo, 2009).
Neutrophils on the other hand are phagocytic and important for defence against pathogens.
During their defence, neutrophils will produce substances such as lysozyme, peroxidases as
well as ROS during an oxidative burst to destroy cells infected with viruses or bacteria (Rosen
et al., 1995; Cooke et al., 2003), thereby contributing to the pool of ROS in the body.
2.1.2. Oxidative stress and free radical defence
Oxidative stress may be defined as an increased production of free radicals and a decreased
antioxidant defence system (Blumberg, 2004). When there is a high ROS load present and
defence mechanisms are overwhelmed, these accumulated radicals might damage
macromolecules such as DNA, lipids and proteins (Halliwell, 1991; Bartosz, 2009).
Although ROS are normally produced during aerobic respiration, as stated earlier, defence
mechanisms are usually in place to neutralise and keep ROS levels in balance (Renner et al.,
2000). Enzymatic, non-enzymatic, endogenous and exogenous antioxidants are the defence
mechanisms present to counteract increased ROS levels (Karithala & Soini, 2007).
The superoxide dismutase (SOD) class of enzymes are divided into three types, namely
copper-zinc SOD (CuZnSOD) which is present in the cytoplasm, mitochondrial manganese
SOD (MnSOD) found in the mitochondria and extracellular SOD (ECSOD) (Karithala & Soini,
2007; Bartosz, 2009). All of these SODs are capable of converting O2.- to H2O2 before catalase
reduces hydrogen peroxide to water. Glutathione peroxidase reduces the formed hydrogen

Literature review
8
peroxide, using glutathione (GSH) as substrate. Glutathione reductase reduces the formed
GSSG again to form GSH (Karithala & Soini, 2007). In the presence of Fe2+, the formed H2O2
produce OH. (Singal et al., 1988) (Figure 2.2).
Figure 2.2: Free radical defence comprises of superoxide dismutase, catalase and glutathione
peroxidase. The Haber-Weiss and Fenton reaction shows the formation of hydroxy radicals.
Glutathione (GSH) is a tripeptide, γ-glutamyl-cysteinyl-glycine and is synthesised from the
amino acids cysteine, glycine, and glutamate (Kaplowitz, 1981; Cotgreave & Gerdes, 1998).
GSH is involved in detoxifying xenobiotics and their metabolites (Kaplowitz, 1981; Lu, 2009).
The synthesis of GSH depends on the availability of the rate-limiting amino acid and enzyme,
cysteine and glutamate cysteine ligase (GCL) (Lu, 2009).
The substrates for glutathione conjugation are a broad spectrum of electrophiles (Zamek-
Gliszczynski et al., 2006). Glutathione-S-transferase (GST) is a group of enzymes responsible
for the conjugation of GSH with electrophiles. Its basic mechanism of action is that GSH
conjugates to the electrophiles which are then metabolised further by cleavage of the glutamate
and glycine residues. The resultant free amino acid group of the cysteinyl group is then
acetylated to produce the final product, a mercapturic acid (Habig et al., 1974; Lu, 2009).
Free radical defences
Superoxide dismutase
(SOD)
CuZnSOD MnSOD ECSOD
2 O2.- + 2 H+ = O2 + H2O2
Catalase Glutathione peroxidase
2 H2O2 = O2 + 2 H2O 2 H2O2 + 2 GSH = GSSG + 2 H2O
Haber-Weiss reaction Fenton reaction
Fe3+ + .O2- = Fe2+ + O2 Fe2+ H2O2 = Fe3+ + OH- + .OH
Net reaction
.O2- +H2O2 = .OH + HO- + O2

Literature review
9
Intracellular GSH is difficult to deplete because of the high concentrations of GSH in the liver,
but should this happen due to extremely high substrate concentrations, severe hepatoxicity may
follow (Zamek-Gliszczynski et al., 2006). Thus, GSH is not only vital as an antioxidant but is
also vital in detoxification and cell physiology (Kaplowitz, 1981).
2.1.3. Consequences of oxidative stress
Free radicals can modify DNA, activate cytoplasmic/nuclear signal transduction pathways,
modify DNA polymerase activity and modulate gene expression and protein production, to name
only a few (Cooke et al., 2002). Therefore, these effects have led to oxidative stress being
implicated in ageing and in human diseases such as hypertension, inflammation, autoimmunity,
atherosclerosis, Parkinson’s disease, cancer and diabetes (Aruoma, 1998).
Known characteristics of Diabetes mellitus include hyperglycaemia and insufficient insulin
(Maritim et al., 2003). Oxidative stress has been implicated in diabetes development and
progression (Baynes, 1991; Singh et al., 2009), although the exact role of how oxidative stress
accelerates diabetes is not completely understood. However, an increase in free radicals
(Baynes, 1991), as well as a decrease in defence against free radicals (Halliwell & Gutteridge,
1990), have been shown to lead to insulin resistance, amongst others (Maritim et al., 2003).
Impaired mitochondrial function, iron content in the brain, lowered activity in the enzymatic
defence mechanisms (in particular SOD) and reduced levels of GSH have been shown to be
involved in the pathogenesis of Parkinson’s disease patients (Jenner & Olanow, 1996). All of
these are also linked to oxidative stress.
In cultured vascular smooth muscle cells, it was found that ROS induced the production of
inositol triphosphate and reduced production of cyclic GMP, thus leading to vasoconstriction, i.e.
hypertension (De Champlain et al., 2004). Oxidative damage to DNA is also considered an
important factor in the development of cancer (Olinski et al., 2003) since these lesions can alter
the integrity of the genome (Jackson & Loeb, 2001). Atherosclerosis starts when the LDL in the
body becomes oxidised by free radicals and then forms oxidised-LDL (ox-LDL). This ox-LDL
damages the arterial wall, and the body’s immune system then responds to the damage. The
macrophages take up the ox-LDL, which then leads to cholesterol ester accumulation and foam
cell formation (Witzum & Steinberg, 1991).

Literature review
10
2.2. Biomarkers of oxidative damage
As ROS are short-lived, the measurement of certain biomarkers may give a better indication of
oxidative status rather than only measuring the free ROS. These biomarkers may also be more
stable than and not as reactive as ROS (Guéraud et al., 2006). It should be kept in mind that no
biomarker will always meet the requirements of an “ideal biomarker”, however, some are better
options than others (Dalle-Donne et al., 2006).
Biomarkers can be used to assess the degree of oxidative stress, to diagnose diseases earlier
in their development, give an indication of disease progression and to determine whether an
antioxidant therapy works efficiently (Dalle-donne et al., 2006). The following should be kept in
mind when choosing a biomarker: the biomarker chosen should be a major product of oxidative
damage that could be implicated in the development of diseases, it should be stable (not an
artificial product or lost during storage), it should represent a balance between oxidative
damage generation and clearance and lastly it should not be influenced by the diet. The assay
used for quantification of the biomarker should also be specific, reproducible and robust
(Griffiths et al., 2002).
2.2.1. DNA damage and 8-OHdG
Radicals produced within an individual, either naturally as a result of aerobic respiration, or from
exogenous sources such as chemicals, drugs, air pollution cigarette smoke etc., puts DNA at
risk of being damaged (Halliwell, 2000; Cooke et al., 2002). The effects of free radical damage
on DNA include oxidation of guanine, cytosine, thymine and adenine (Cooke et al., 2002), ring
fragmentation, modifications of the sugar back-bone, strand breaks and covalent cross links
with amino acids or other DNA bases (Breen & Murphy, 1995). Because guanine contains the
lowest oxidation potential of the four bases found in DNA, it is more prone to oxidative damage
(Chiou et al., 2003; Peoples & Karnes, 2005). 8-Hydroxy-2’-deoxyguanosine (8-OHdG) is
formed from a hydroxyl radical and a deoxyguanosine residue (Harri et al., 2007). It is a well-
known biomarker of oxidative stress (Cooke et al., 2003), most often studied (Chiou et al., 2003)
and also has mutagenic potential (Harri et al., 2007). During DNA replication, 8-OHdG may pair
with adenine which then results in G to T substitutions, which could lead to the misreading of
neighbouring bases (Harri et al., 2007).
Defence mechanisms, such as antioxidants, reduce the interaction of radicals with
macromolecules and in this case, DNA (Cooke et al., 2002). When DNA is oxidatively damaged
by ROS, repair mechanisms are in place to safeguard the integrity of DNA for cellular survival
(Chiou et al., 2003). However, the repair process responsible for urinary 8-OHdG levels is not

Literature review
11
known yet (Evans et al., 2010). The repair mechanisms for urinary 8-OHdG can include the
following: sanitisation of the nucleotide pool (Nudix hydrolases), endonucleases (Cooke et al.,
2008), base excision repair (BER), nucleotide incision repair (NIR), nucleotide excision repair
(NER) and/ or mismatch repair mechanisms (MMR) (Harri et al., 2007; Evans et al., 2010). The
products of excision repair are then transported from the cells and leave the body via the urine
(Pilger et al., 2002; Harri et al., 2007). Although Dalle-Donne et al., (2006) reported that 8-
OHdG may originate from the degradation of dGTP from the DNA precursor pool and thus not
be representative of whole-body oxidative DNA damage, other authors differ. The more widely
accepted view is that 8-OHdG in urine appears to be dependent on the rate of DNA damage in
vivo and on the efficiency of the repair processes (Loft et al., 1992) and is therefore
representative of total body oxidative DNA damage (Halliwell & Whiteman, 2004). Patients
treated with Adriamycin (a drug used in cancer treatment) showed an increase in uric acid,
which is an indicator of cell turnover, although no increase in 8-OHdG levels was reported
(Faure et al., 1998). 8-OHdG is not affected by diet because nucleosides are not absorbed from
the intestinal tract (Wiseman & Halliwell, 1996). Thus, it was concluded that, according to the
literature, 8-OHdG levels are not influenced by cell turnover or by the diet, however, more work
needs to be done (Cooke et al., 2008).
Additional markers used to assess oxidative DNA damage include 8-hydroxy-guanine (8-
OHGua), 8-hydroxy-adenine (8-OHAde), 8-hydroxy-2’-deoxy-adenosine (8-OHdA) and thymine
glycol. Adenine lesions were found to be less prevalent in DNA damage than guanine lesions
(Burrows & Muller, 1998). After quantification of 8-OHdG and 8-OHdA, it was found that 8-
OHdA levels were 15 times lower than 8-OHdG levels (Podmore et al., 2000). 8-OHGua is
another marker that can be considered as a biomarker, however, it is influenced by the diet and
thus its use as biomarker should be avoided (Wiseman & Halliwell, 1996; Kawai et al., 2007).
Thymine glycol (Tg) was the first marker used to measure oxidative DNA damage, however, 8-
OHdG is now more often used (Cooke et al., 2002). Although Cathcart et al., (1984) reported
that the diet did not have an effect on thymine glycol levels, Simic (1994) reported that Tg was
actually absorbed from the diet. Therefore the usage of Tg as biomarker of DNA damage was
rejected and now 8-OHdG is most often used as a biomarker of oxidative damage on DNA.
However, European standards committee on urinary DNA lesion analysis (ESCULA), still need
to complete the validation of 8-OHdG as biomarker of oxidative stress (Cooke et al., 2008).
Before 8-OHdG can be quantified in blood, DNA has to be isolated and degraded to generate
free bases. Unfortunately, the chemical hydrolysis of DNA may lead to the artificial production of
8-OHdG, and as a consequence, to an overestimation of the 8-OHdG levels present (Collins et
al., 2004). When using urine as sample matrix, there is no artificial production of 8-OHdG and
Literature review
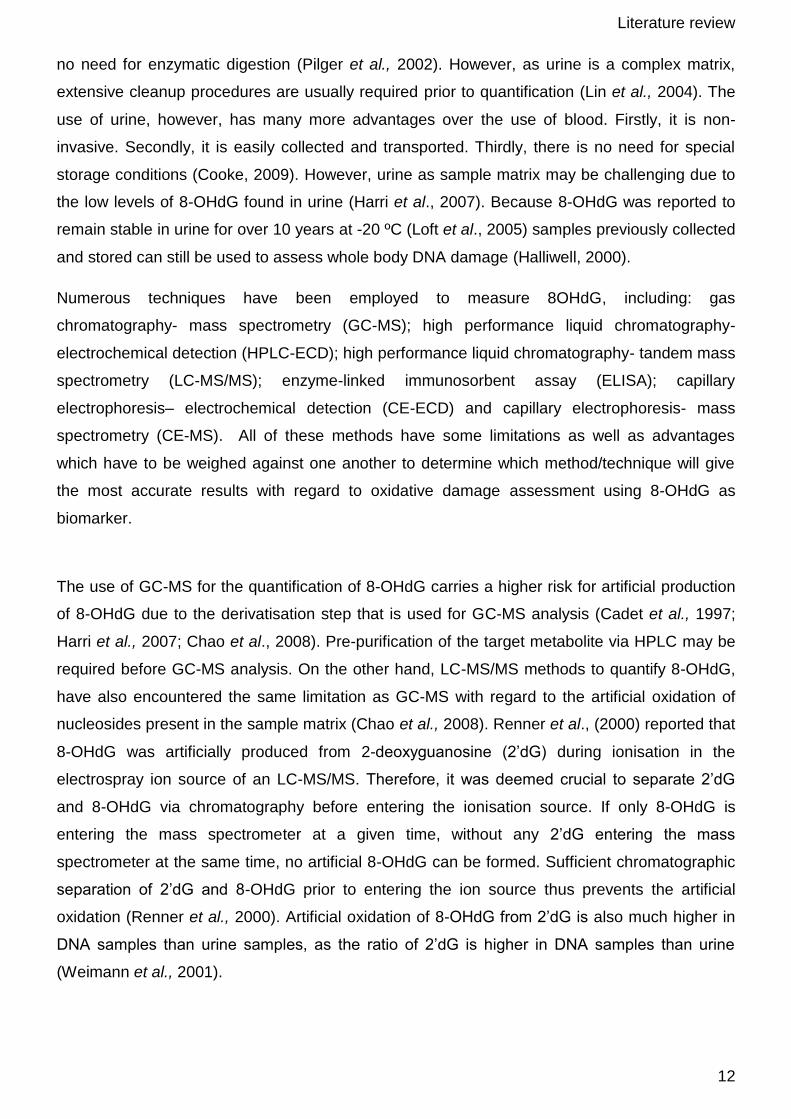
12
no need for enzymatic digestion (Pilger et al., 2002). However, as urine is a complex matrix,
extensive cleanup procedures are usually required prior to quantification (Lin et al., 2004). The
use of urine, however, has many more advantages over the use of blood. Firstly, it is non-
invasive. Secondly, it is easily collected and transported. Thirdly, there is no need for special
storage conditions (Cooke, 2009). However, urine as sample matrix may be challenging due to
the low levels of 8-OHdG found in urine (Harri et al., 2007). Because 8-OHdG was reported to
remain stable in urine for over 10 years at -20 ºC (Loft et al., 2005) samples previously collected
and stored can still be used to assess whole body DNA damage (Halliwell, 2000).
Numerous techniques have been employed to measure 8OHdG, including: gas
chromatography- mass spectrometry (GC-MS); high performance liquid chromatography-
electrochemical detection (HPLC-ECD); high performance liquid chromatography- tandem mass
spectrometry (LC-MS/MS); enzyme-linked immunosorbent assay (ELISA); capillary
electrophoresis– electrochemical detection (CE-ECD) and capillary electrophoresis- mass
spectrometry (CE-MS). All of these methods have some limitations as well as advantages
which have to be weighed against one another to determine which method/technique will give
the most accurate results with regard to oxidative damage assessment using 8-OHdG as
biomarker.
The use of GC-MS for the quantification of 8-OHdG carries a higher risk for artificial production
of 8-OHdG due to the derivatisation step that is used for GC-MS analysis (Cadet et al., 1997;
Harri et al., 2007; Chao et al., 2008). Pre-purification of the target metabolite via HPLC may be
required before GC-MS analysis. On the other hand, LC-MS/MS methods to quantify 8-OHdG,
have also encountered the same limitation as GC-MS with regard to the artificial oxidation of
nucleosides present in the sample matrix (Chao et al., 2008). Renner et al., (2000) reported that
8-OHdG was artificially produced from 2-deoxyguanosine (2’dG) during ionisation in the
electrospray ion source of an LC-MS/MS. Therefore, it was deemed crucial to separate 2’dG
and 8-OHdG via chromatography before entering the ionisation source. If only 8-OHdG is
entering the mass spectrometer at a given time, without any 2’dG entering the mass
spectrometer at the same time, no artificial 8-OHdG can be formed. Sufficient chromatographic
separation of 2’dG and 8-OHdG prior to entering the ion source thus prevents the artificial
oxidation (Renner et al., 2000). Artificial oxidation of 8-OHdG from 2’dG is also much higher in
DNA samples than urine samples, as the ratio of 2’dG is higher in DNA samples than urine
(Weimann et al., 2001).

Literature review
13
HPLC-ECD is the most commonly used method for the detection of 8-OHdG. Conversely, a ten
times increase in sensitivity for the quantification of 8-OHdG was reported using LC-MS/MS
compared to HPLC-ECD (Peoples & Karnes, 2005). The ELISA assay used to quantify 8-OHdG
is a very popular assay since it is easy to use, it requires no specialised equipment, numerous
sample matrixes can be used, no sample pre-treatment is required and it is also a high-
throughput technology (Cooke, 2009). However, the antibody, N45.1, used in the assay as it is
highly specific for 8-OHdG, can lead to an overestimation of 8-OHdG levels as urea is also
recognised by N45.1. This is because 8-OHdG and urea share a common –NH-CO-N-
structure. This problem can be overcome by treating the sample with urease to remove the
urea. Performing the ELISA assay at 4 ºC instead of 37 ºC reduced the recognition of the
antibody with urea. However, it was found that although the analysis was done at 4 ºC, the 8-
OHdG levels were still 1.5 fold higher compared to that found with HPLC-ECD. It was found that
8-hydroxy-guanine (8-OH-Gua) cross-reacts with N45.1 at 4 ºC which leads to higher 8-OHdG
levels being reported (Song et al., 2009).
A method for the detection of 8-OHdG in urine via CE-ECD was also described (Mei et al.,
2005). After comparing this method to a GC-MS method, it was concluded that both of these
methods are suitable for detecting 8-OHdG in urine with sufficient accuracy. However, CE-ECD
doesn’t need a derivatisation step and thus is simpler. The method precision of CE-ECD is also
better than the GC-MS method and the instrumentation of CE-ECD is cheaper. Nevertheless,
because small volumes are used for detection in CE compared to HPLC, it resulted in lowered
concentration sensitivity and reduced limits of detection (Peoples & Karnes, 2005). When CE is
interfaced with MS/MS, it can also pose some problems. CE has a limited loading capacity of 1
µl and usually only 10-100 nl. These small volumes lead to small peaks being detected in the
MS and prove problematic for MS/MS analysis (Dakna et al., 2009).
2.2.2. Lipid peroxidation and DHN-MA
Lipids, especially polyunsaturated fatty acids (PUFAs), are highly susceptible to reactions with
free radicals (Rathahao et al., 2005). Lipid hydroperoxides are the major initial products
produced when radicals react with, and consequently damage these lipids (Uchida, 2003). Lipid
hydroperoxides produce certain breakdown products when decomposed, which, when
compared to free radicals, are relatively stable, allows them to diffuse from the cell and damage
targets far from their site of origin (Uchida, 2003). Therefore, these lipid peroxidation products
are also known as second-toxic messengers of free radicals and can cause severe
disturbances of cell functions, both at the genetic and biochemical levels (Srivastava et al.,

Literature review
14
2000; Spies-Martin et al., 2002). Lipid peroxidation has been implicated in the development and
progression of numerous diseases, such as cancer, atherosclerosis, and diabetes (Esterbauer
et al., 1991). Thus, it could be useful to measure these products of lipid peroxidation to
determine the extent of damage so that proper intervention can be considered. However, the
question remains: which product of lipid peroxidation is the better option to consider as a
biomarker?
Malondialdehyde (MDA), F2- isoprostanes, and trans-4-hydroxy-2-nonenal (4-HNE) are the lipid
peroxidation products most often used as markers of oxidative damage on lipids (Peiro et al.,
2005). However, the use of these metabolites has some limitations. Arachidonic acid is the only
source of F2- isoprostanes, therefore, it only represents the degradation of arachidonic acid
(Peiro et al., 2005). The main F2- isoprostanes in vivo are 8-iso-prostaglandin F2α. This
metabolite is only moderately stable at -20 ºC and requires the addition of butylated
hydroxytoluene (BHT) to improve stability (Peiro et al., 2005). The MDA present in urine is partly
due to the presence of oxidized PUFAs in the diet (Draper et al., 2000). Like F2 – isoprostanes,
this metabolite is also only moderately stable at -20 ºC and also requires addition of BHT (Peiro
et al., 2005). 4-HNE is the primary aldehyde formed from lipid peroxidation (Esterbauer et al.,
1991). Unfortunately this metabolite is highly reactive (Rathahao et al., 2005) and can therefore
not be considered a reliable marker of lipid peroxidation. However, 4-HNE is chemically reactive
towards GSH (Völkel et al., 2005) and when conjugation occurs, it finally gives rise to the end
metabolite 1,4 dihydroxynonene mercapturic acid (DHN-MA). This metabolite is stable and can
be considered as a biomarker of lipid peroxidation since it does not present the same
shortcomings as its precursor, 4-HNE (Guéraud et al., 2006). DHN-MA remains stable during
storage because its precursor, 4-HNE, is not present in urine (Alary et al., 1995), and the
synthesis of DHN-MA occurs enzymatically (Alary et al., 2003). It is the main urinary product of
exogenous 4-HNE in the rat and human (Alary et al., 1995). DHN-MA is considered to be a
good and convenient biomarker of lipid peroxidation (Guéraud et al., 2006), compared to MDA
or 8-iso-prostaglandin F2α (Peiro et al., 2005). Due to the presence of 4-HNE in certain foods,
the influence of these foods on 4-HNE levels measured in urine cannot be ruled out (Lang et al.,
1985; Draper et al., 2000; Wilson et al., 2002). However, when subjects are fasting, the use of
hydroxy fatty acids (i.e. MDA, 4-HNE and DHN-MA) as markers of lipid peroxidation may be
valid (Wilson et al., 2002). In this study, 10 hour fasting baseline urine and serum samples were
collected from the SABPA participants, thus excluding the diet as possible artificial influences
on lipid peroxidation levels measured in urine.
The 4-hydroxy-2-alkenals are the most prominent lipid peroxidation aldehydes (Esterbauer et
al., 1991) and are formed from ω-6-PUFAs which are the PUFAs with the highest concentration
Literature review
15
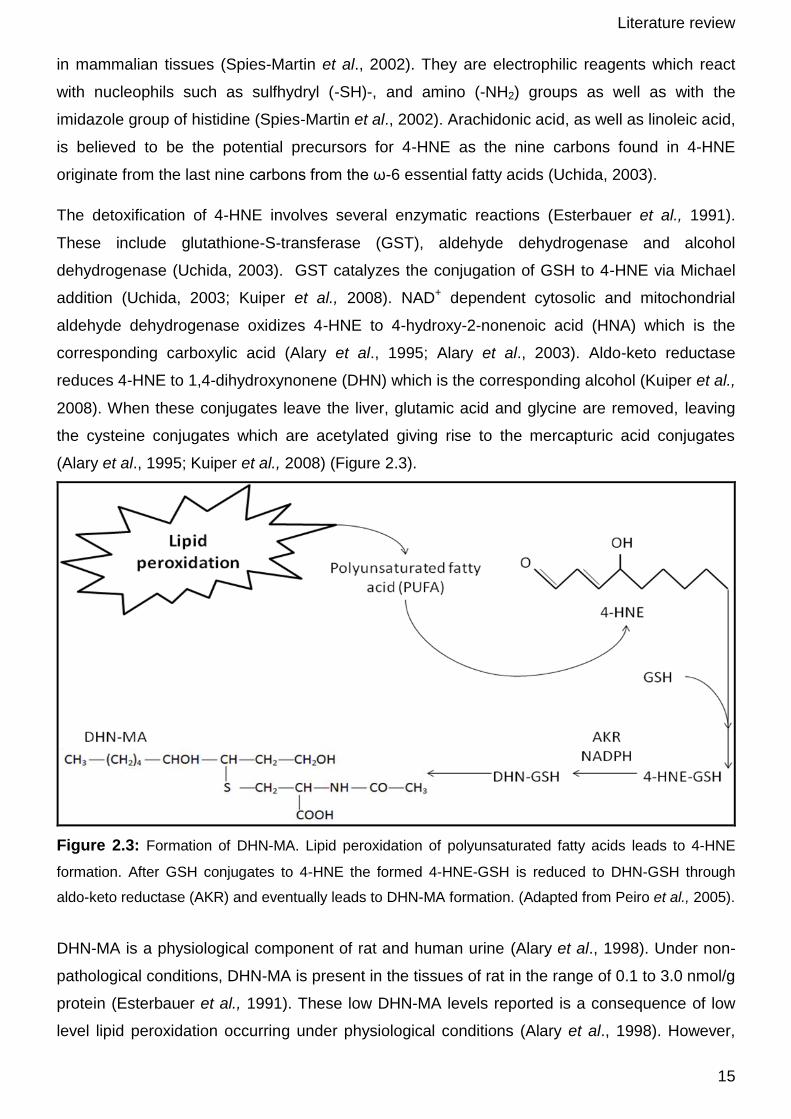
in mammalian tissues (Spies-Martin et al., 2002). They are electrophilic reagents which react
with nucleophils such as sulfhydryl (-SH)-, and amino (-NH2) groups as well as with the
imidazole group of histidine (Spies-Martin et al., 2002). Arachidonic acid, as well as linoleic acid,
is believed to be the potential precursors for 4-HNE as the nine carbons found in 4-HNE
originate from the last nine carbons from the ω-6 essential fatty acids (Uchida, 2003).
The detoxification of 4-HNE involves several enzymatic reactions (Esterbauer et al., 1991).
These include glutathione-S-transferase (GST), aldehyde dehydrogenase and alcohol
dehydrogenase (Uchida, 2003). GST catalyzes the conjugation of GSH to 4-HNE via Michael
addition (Uchida, 2003; Kuiper et al., 2008). NAD+ dependent cytosolic and mitochondrial
aldehyde dehydrogenase oxidizes 4-HNE to 4-hydroxy-2-nonenoic acid (HNA) which is the
corresponding carboxylic acid (Alary et al., 1995; Alary et al., 2003). Aldo-keto reductase
reduces 4-HNE to 1,4-dihydroxynonene (DHN) which is the corresponding alcohol (Kuiper et al.,
2008). When these conjugates leave the liver, glutamic acid and glycine are removed, leaving
the cysteine conjugates which are acetylated giving rise to the mercapturic acid conjugates
(Alary et al., 1995; Kuiper et al., 2008) (Figure 2.3).
Figure 2.3: Formation of DHN-MA. Lipid peroxidation of polyunsaturated fatty acids leads to 4-HNE
formation. After GSH conjugates to 4-HNE the formed 4-HNE-GSH is reduced to DHN-GSH through
aldo-keto reductase (AKR) and eventually leads to DHN-MA formation. (Adapted from Peiro et al., 2005).
DHN-MA is a physiological component of rat and human urine (Alary et al., 1998). Under non-
pathological conditions, DHN-MA is present in the tissues of rat in the range of 0.1 to 3.0 nmol/g
protein (Esterbauer et al., 1991). These low DHN-MA levels reported is a consequence of low
level lipid peroxidation occurring under physiological conditions (Alary et al., 1998). However,

Literature review
16
when free radicals exceed the capacity of defence mechanisms in the rat, levels can reach 10
nmol/g protein (Esterbauer et al., 1991). DHN-MA is very stable in urine and thus appears to be
an appropriate biomarker of lipid peroxidation (Alary et al., 1998).
2.3. Aims and objectives
“One of the greatest needs in the field of free radical biology is the development of reliable
methods for measuring oxidative stress status in humans” (Pryor & Godber, 1991). Thus, the
aim of this study was to develop a single analytical method to successfully and reliably quantify
urinary 8-OHdG and DHN-MA in human samples as a marker of oxidative stress status. As
tandem mass spectrometry was available to this study, it was decided to use this platform for
quantification of 8-OHdG and DHN-MA.
This study was divided into three main objectives:
i. Standardisation and validation of the LC-MS/MS assay for the simultaneous
quantification of 8-OHdG and DHN-MA in human urine samples.
ii. Quantification of the urinary 8-OHdG and DHN-MA levels in a selected group of South
African teachers.
iii. Investigating a possible correlation between urinary 8-OHdG-, DHN-MA- and serum ROS
levels in a selected group of South African teachers.

Literature review
17
2.4. Experimental approach
The basic experimental approach for this study was as follows:
Figure 2.4: Visual representation of the strategy proposed for this study.
Ethics approval from
the Ethics Committee
of the North-West
University:
06M09 (2006) and NWU-00036-07-S6
Urine collection:
200 black Africans
(male and female)
(2008) 209 white
Africans (male and
female) (2009)
Serum
collection:
200 black Africans
(male and female)
(2008) 209 white
Africans (male and
female) (2009)
Sample
collection:
2008 - 2009
LC-MS/MS method
standardisation,
optimisation and
validation
8-OHdG and DHN-
MA quantification
(URINE)
ROS assay
(SERUM)
Statistical
analysis

18
3.1. The SABPA study
3.1.1. Participants and methodological approach
This study forms part of the SABPA (Sympathetic activity and Ambulatory Blood Pressure in
Africans) study, which is mainly concerned with the effect of lifestyle and stress on
hypertension in urbanised Africans. Potential participants completed a standard information
questionnaire and were selected according to their responses in November 2007 for Phase I
sample collection, and in November 2008 for Phase II sample collection. The inclusion criteria
for the SABPA study included 209 Caucasian (101 males; 108 females) and 200 African (100
males; 100 females) teachers in the Potchefstroom area of the North-West province of South
Africa. Age range between 25 and 60 years and a similar socio-economic status were also part
of the inclusion criteria. Pregnancy, lactation, any acute/chronic medication (e.g. hypertension,
tuberculosis, diabetes, coagulation factors, inflammation, epilepsy/mental disorders including
psychotropic substance abuse or dependence) were used as exclusion criteria. Informed
consent was obtained from the selected participants prior to the commencing of the study. For
the SABPA study, sympathetic activity responses were measured. These were done at
baseline level and after participants had been exposed to two laboratory stressors: colour-word
conflict chart and the cold pressor test. However, 10 hour fasting baseline urine and serum
samples were collected for the quantification of ROS, 8-OHdG and DHN-MA.
3.1.2. Ethics approval
This study was approved by the Ethics Committee of the North-West University under the title:
“Development and standardisation of analytical techniques to determine oxidative
stress and antioxidant capacity in humans” (06M09). As stated earlier this study also forms
part of the SABPA study, which has ethics approval under the title: “SABPA, Sympathetic
Activity and Ambulatory Blood Pressure in Africans” (NWU-00036-07-S6).
CHAPTER 3
Materials and methods

Materials and methods
19
3.1.3. Sample collection and storage
The sample collection for the SABPA study was divided into two phases. During phase I,
samples from 200 African males and females were collected from February to May of 2008.
During phase II of this study, samples from 209 Caucasian males and females were collected.
The collection of these samples began on February 2009 and ended in May of 2009. The
samples collected included fasting baseline serum for the ROS assay and fasting baseline
urine for 8-OHdG and DHN-MA quantification. These serum and urine samples were collected
daily between 06:30 – 07:30.
An SST vacutainer was used for blood collection. The blood in the vacutainer was left to
coagulate for 30 minutes. This was then centrifuged at 1000 x g for 10 minutes. Serum was
collected and stored at -80 ºC until the day of analysis. Urine samples were collected in 30 ml
polypropylene specimen containers and stored at -20 ºC until the day of analysis. A urine
sample was randomly selected for the optimisation and validation of the DHN-MA and 8-OHdG
assay.
The ROS assay was performed on the serum samples within a six month period after
samplecollection. However, the urine samples were stored at -20 ºC until the analysis could be
performed. Since the analytical methods for the quantification of 8-OHdG and DHN-MA had to
be optimised and validated, it was essential that 8-OHdG and DHN-MA remains stable in the
urine samples at -20 ºC for an extended period. According to the literature, no artificial
formation of DHN-MA is known to occur during the storage of urine, since its precursor, 4-HNE,
is not present in urine and because the formation of DHN-MA cannot occur without enzyme
action. DHN-MA can also not be easily degraded since it does not contain a chemical reactive
group (Peiro et al., 2005). The metabolite 8-OHdG, was also found to have remained stable in
urine for more than 10 years of storage at -20 ºC (Loft et al., 2006).
Materials and methods
20
3.2. Creatinine values
Urinary levels of oxidative lesions are influenced by the efficacy of renal excretion of the
metabolites. The use of urinary creatinine levels is necessary to correct for variations in the
individual urine concentration (Cooke et al., 2002). Therefore, the creatinine values are
important in order to make it possible to compare urinary results with one another (Nakano et
al., 2003).
The creatinine values of samples collected during February 2008 – May 2008, were determined
in 2008. The creatinine values of samples collected in February 2009 – May 2009 were
determined in 2009. The creatinine values were determined by Du Buisson & Associates
(AMPATH, Potchefstroom). See Appendix A for the creatinine values of the SABPA
participants.
3.3. Reactive oxygen species (ROS) assay
3.3.1. Basis of ROS assay
The ROS assay is a high throughput and automated analysis with high reproducibility and
consistent accuracy (Hayashi et al., 2007). The basis of this assay is that in an acidic medium,
ROS will react with transition metals, such as iron, to form alkoxyl- and peroxyl radicals. The
formed radicals will then oxidize N,N-diethyl-para-phenylenediamine (DEPPD) to its cation
which is followed kinetically at 546 nm.
3.3.2. Reagents
Sodium acetate (anhydrous) (Cat. No. S2889), N,N-diethyl-para-phenylenediamine (DEPPD)
(Cat. No. 168343) and hydrogen peroxide (H2O2) (Cat. No. H1009) were purchased from
Sigma-Aldrich Co., USA. Ferrous sulphate (Cat. No. F106029) was purchased from Labchem,
Edenvale, RSA.
3.3.3. Buffers and solutions
Standard curve: Hydrogen peroxide (0; 60; 120; 180; 240; 300 mg/L):
The concentration of the H2O2 stock solution was 8.8 M. A standard range of H2O2 solutions (0,
60, 120, 180, 240 and 300 mg/L respectively) were prepared by diluting the stock solution with
milli Q water. The aliquots were stored at -8

Materials and methods
21
Sodium acetate buffer [0.1 M]:
A 0.1 M sodium acetate buffer was prepared as follows: Anhydrous sodium acetate (4.1015 g)
was added to 400 ml milli Q water. After adjusting the pH to 4.8 with glacial acetic acid, the
buffer was stored at 2 – 8 ºC. The buffer usually remains stable for approximately 6 months.
DEPPD solution (R1 [100 mM]):
A 100 mM DEPPD solution was prepared by adding 1.3117 g of DEPPD to 50 ml sodium
acetate buffer (covered with foil), and it was stored at 2 – 8 0C. This reagent remains stable for
a maximum of 4 weeks. As soon as a colour change from light pink to black occurs, the DEPPD
solution needs to be discarded.
FeSO4 solution (R2 [4.37 µM]):
Ferrous sulphate (0.0121 g) was dissolved in 1 ml sodium acetate buffer to give a
concentration of 43.7 µM. This was then diluted to give a final concentration of 4.37 µM
(covered with foil), and it was stored at 2 – 8 ºC. This remains stable for approximately 6
months.
3.3.4. ROS assay
Serum samples were thawed on ice. Sodium acetate buffer (140 µl) was added to each well of
the 96-well microtiter plate with a multichannel pipette. The standards/samples (2.5 µl) were
then added to the 96-well microplate (standards in duplicate and samples in triplicate). The
volume of R1:R2 (ratio, 1:25) required was calculated and mixed in a glass beaker (1000 µl R2
for each 40 µl R1). The R1:R2 solution (100 µl) was added to each well with a multichannel
pipette. This was incubated at room temperature for 1 minute. The reaction was followed
kinetically at 546 nm for 10 minutes (at 25 ºC) with a BIO-TEK® 7 FL600 microplate fluorescence
reader. The ROS levels in serum were then extrapolated from the H2O2 standard curve.

Materials and methods
22
3.4. Statistical analysis and interpretation of data
All statistical analysis were carried out with Statistica Software (Version 9). Firstly the measured
8-OHdG data was tested for normal distribution using the Shapiro Wilk test. Normality was
rejected (p < 0.01). Although sample sizes were large in all groups, non-parametric tests were
employed for further data analysis based on the skewness in the data. Outliers were removed
from the data matrix by the use of Tukey’s method, which defines outliers as those data points
falling outside the control limits. The control limits are defined as three interquartile ranges
below the 25th percentile or above the 75th percentile (Tukey, 1977). Because initial
investigation of the data revealed that the 8-OHdG levels might differ between some of the
groups, each of the four groups were separately assessed to identify outliers in that group.
A BDM test was used to test the significance of the interaction between ethnicity and gender on
8-OHdG levels. The problem with the Kruskal-Wallis test is that, while it does not assume
normality for groups, it assumes that the groups have the same distribution shape
(homoscedasticity). Brunner et al., (1997) proposed a heteroscedastic version of the Kruscal-
Wallis test which utilizes the F-distribution. This test, the Brunner-Dette-Munk test, is referred to
as the BDM test throughout this study. Since no interaction between ethnicity and gender was
found with the BDM test, the significance of the main effect can be investigated by pooling the
data (i.e. ethnicity and gender). This means that the gender effect is investigated by ignoring
ethnicity and vice versa. However, because the data is skewed and the ranges differ
considerably between groups, pooling of data may not be advisable. Therefore, it was decided
to analyse the main effect of gender on different levels of ethnicity and vice versa. Mann-
Whitney U tests were used for this purpose while box plots were used for schematic
representations of the data.
The existence of a correlation between urinary 8-OHdG and serum ROS levels was assessed
with Spearman correlations. The following guidelines were used to interpret the correlation
coefficient: a correlation coefficient is bounded between -1 and 1 where negative values
indicate inverse relationships and positive values indicate direct relationships. Values close to
zero indicate a small or no relationship between the given parameters while values close to 1 or
-1 indicate a very strong relationship between the parameters.

23
4.1. Introduction
Free radicals can cause DNA damage (Halliwell, 2000; Cooke et al., 2002). Although many
oxidative DNA damage markers have been identified, adenine lesions were found to be less
prevalent in DNA damage than guanine lesions (Burrows & Muller, 1998). Quantification of 8-
hydroxy-2’-deoxyguanosine (8-OHdG) and 8-hydroxy-2’-deoxyadenosine (8-OHdA) revealed
that 8-OHdA levels were 15 times lower than 8-OHdG levels (Podmore et al., 2000). This
finding also correlates with the results obtained by Burrows & Muller (1998). Although 8-
hydroxy-guanine (8-OHGua) is another metabolite that can be considered as a biomarker, its
concentration in urine may be influenced by diet, compromising its value as a biomarker
(Wiseman & Halliwell, 1996; Kawai et al., 2007). Thymine glycol (Tg) is another marker used to
quantify oxidative DNA damage. Although Tg is formed from the repair of oxidised DNA,
literature is contradictory on whether Tg is also absorbed from the diet (Cathcart et al., 1984;
Simic, 1994), and therefore the use of Tg should also be limited. 8-OHdG is a well-known
biomarker of oxidative stress (Cooke et al., 2003), it has mutagenic potential (Harri et al., 2007)
and therefore it is most often studied (Chiou et al., 2003). 8-OHdG is formed from the reaction
of a hydroxyl radical and a deoxyguanosine residue and is excreted in urine as a result of DNA
repair (Harri et al., 2007). Many analytical methods have been used to successfully measure 8-
OHdG in urine, such as GC-MS, HPLC-ECD, LC-MS/MS, ELISA, CE-ECD and CE-MS.
Because LC-MS/MS appears to be a more sensitive and accurate analytical method to quantify
8-OHdG (Weimann et al., 2001), and since LC-MS/MS technology was available to this study, it
was decided to use LC-MS/MS to quantify 8-OHdG.
CHAPTER 4
Optimisation and validation of the 8-OHdG assay

Optimisation and validation of the 8-OHdG assay
24
4.2. Chemicals, standard solutions and buffers
4.2.1. Chemicals
The 8-hydroxy-2’-deoxyguanosine (Cat No. 095K40974) and 2’-deoxyguanosine (Cat. No.
056K1400) were purchased from Sigma Aldrich Co., USA. The stable isotope 2’deoxyguanosine
(2’dG15N) (Cat. No.124303603) was purchased from Cambridge isotope, USA. Ammonium
formate (Cat No. 70221) and formic acid (Cat. No. 33015) were purchased from Sigma, Aldrich
Co., USA. Acetonitrile (MeCN) (Cat. No. 017-4) was purchased from Agilent, South Africa.
Methanol (MeOH) (Cat. No. 1.06007.2500) was purchased from Merck Chemicals, South Africa.
4.2.2. Standard solutions and buffers
Standard solutions of 8-OHdG, 2’dG and 2’dG15N were separately prepared in milli Q water with
a final concentration of 1 mg/ml respectively. These standard solutions were used for optimising
the mass spectrometer (MS) conditions (Section 4.3.2), the chromatographic conditions
(Section 4.3.3) and calibrations (Section 4.6.1).
A 1 mM ammonium formate buffer (pH 3.75) was prepared by dissolving ammonium formate in
milli Q water. The pH was adjusted to 3.75 with concentrated formic acid.
4.3. Optimisation of LC-MS/MS conditions for quantification of 8-
OHdG in urine
4.3.1. Specifications of the LC-MS/MS
An Agilent 1200 series LC (Santa Clara, CA, USA) was used for sample handling as well as for
mobile phase delivery. Samples (20 µl of each) were injected and a constant flow rate of 0.2
ml/min was maintained throughout the run. The MS/MS analysis was performed on an Agilent
6410 Triple Quadrupole mass spectrometer (Santa Clara, CA, USA) with positive ionisation.

Optimisation and validation of the 8-OHdG assay
25
4.3.2. Optimisation of the MS conditions
The first step in standardising the 8-OHdG assay was to optimise the MS conditions. For this
optimisation, the MassHunter optimiser software from Agilent was used. MassHunter works on
chromatographic and electrophoretic mass spectral data to extract information, reduce data
complexity, eliminate potential interferences and generate a list of molecular features (Anon,
2005). MassHunter optimiser software provides a way to automatically optimise the data
acquisition parameters for MRM mode (multiple-reaction monitoring) on an MS/MS instrument
for each individual compound analysed. Specifically, it automates the selection of the precursor
ions, the optimisation of the fragmentor voltage for each precursor ion, the selection of the
optimal fragment ions, and the optimisation of collision energy values for each transition for a
specified list of compounds (Anon, 2009).
For the optimisation of the MS conditions, 10 µl of each standard solution (8-OHdG, 2’dG and
2’dG15N, 100 ng/ml respectively) was separately infused in the MS with 50% MeCN: 50% water
and 0.1% formic acid as the mobile phase. The results obtained for the optimiser are given in
Tables 4.1 to 4.3.
Table 4.1: The optimal electrospray tandem mass spectrometric conditions for the detection of
8-OHdG. MassHunter software was used to optimise the conditions for 8-OHdG detection with
the LC-MS/MS.
Compound
name
Formula
Nominal mass
Polarity
Ion source
8-OHdG
C10H13N5O5
283.2
Positive
ESI
Precursor ion
Fragmentor
Product ion
Collision energy
Abundance
284.2
90
168
12
302706
284.2
90
140
32
61640
284.2
90
112
40
26660
284.2
90
151
40
13941

Optimisation and validation of the 8-OHdG assay
26
Table 4.2: The optimal electrospray tandem mass spectrometric conditions for the detection of
2’dG. MassHunter software was used to optimise the conditions for 8-OHdG detection with the
LC-MS/MS.
Compound
name
Formula
Nominal mass
Polarity
Ion source
2’dG
C10H13N5O4
267.2
Positive
ESI
Precursor ion
Fragmentor
Product ion
Collision energy
Abundance
268.2
75
152.1
12
737
268.2
75
124
24
17
268.2
75
135.1
40
200
268.2
75
206.5
8
9
Table 4.3: The optimal electrospray tandem mass spectrometric conditions for the detection of
2’dG15N. MassHunter software was used to optimise the conditions for 2’dG15N detection with
the LC-MS/MS.
Compound
name
Formula
Nominal mass
Polarity
Ion source
2’dG15N
C10H13
15N5O4
272.2
Positive
ESI
Precursor ion
Fragmentor
Product ion
Collision energy
Abundance
273.2
75
157
16
1324
273.2
75
139
36
414
273.2
75
115.3
20
17
273.2
75
210.4
0
11
From the optimiser reports it is clear that a product ion of 168 m/z and a precursor ion of 284.1
m/z are optimal for detection of 8-OHdG (Table 4.1) with the LC-MS/MS. A precursor of 268.1
m/z and a product ion of 152.1 m/z were selected for 2’dG detection (Table 4.2). For 2’dG15N

Optimisation and validation of the 8-OHdG assay
27
detection, a precursor of 273.2 m/z and a product ion of 157 m/z were selected (Table 4.3). The
precursor and product ions selected for 8-OHdG, 2’dG and 2’dG15N quantification are consistent
with those most often reported in the literature (Renner et al., 2000; Weimann et al., 2001; Harri
et al., 2007).
4.3.3. Chromatographic separation of 8-OHdG, 2’dG and 2’dG15N
Since 8-OHdG can spontaneously form from 2’dG in the electrospray ion source of the mass
spectrometer (Renner et al., 2000), it was concluded that chromatographic separation of 2’dG
and 8-OHdG was essential. The chromatographic separation of 8-OHdG and 2’dG would
prevent both metabolites from entering the mass spectrometer when 8-OHdG is quantified. This
would prevent artificial formation of 8-OHdG from 2’dG, since no 2’dG molecules are eluting
from the column when 8-OHdG elutes, as their retention times differ. Chromatographic
separation was performed on a Zorbax SB-Aq (2.1 x 150 mm, 3.5 µm) column (Cat. No. USSQG
01048) purchased from Agilent. This type of column, with an alkyl reversed-phase bonded
phase, is designed to retain hydrophillic compounds while using an aqueous mobile phase and
is highly stable at low pH (pH < 4). The column was protected using a Zorbax SB-Aq (2.1 X 12.5
mm, 5 µm) (Cat. No. 82125-933) guard column, also purchased from Agilent. The flow rate was
0.2 ml/min and the injection volume was 20 µl. Electrospray ionisation was performed in the
positive ion mode. Nitrogen gas was used as nebulising gas.
For chromatographic separation of 8-OHdG, 2’dG and 2’dG15N a 1 mM ammonium formate
buffer pH 3.75 was used as mobile phase A and 100% MeCN as mobile phase B. Initially the
elution gradient was adjusted a couple of times to get optimal retention and sharp peaks on the
chromatogram for 8-OHdG, 2’dG and 2’dG15N (Figure 4.1 and 4.2). The optimal elution gradient
is given in Table 4.4. Figure 4.1 illustrates the chromatographic separation of 8-OHdG and 2’dG
standard solutions. Multiple reaction monitoring (MRM) was used to monitor and quantify 8-
OHdG and 2’dG. The total ion chromatogram, as depicted in Figure 4.1, is the sum of both
MRMs used for the detection of 8-OHdG and 2’dG.

Optimisation and validation of the 8-OHdG assay
28
Table 4.4: Mobile phase gradient timetable used for the chromatographic separation of 8-
OHdG, 2’dG and 2’dG15N. The mobile phases used for chromatographic separation were 1 mM
ammonium formate buffer pH 3.75 (mobile phase A) and 100% MeCN as mobile phase B.
Time B % Flow
0 5 0.2
2 5 0.2
10 26 0.2
12 50 0.2
13 50 0.2
15 100 0.2
21 100 0.2
26 5 0.2
41 5 0.2
Figure 4.1: Chromatographic separation of 2’dG and 8-OHdG standard solutions: (A) the total ion
chromatogram (TIC) illustrating retention times for both 2’dG and 8-OHdG (B) MRM of 8-OHdG and (C)
MRM of 2’dG.

Optimisation and validation of the 8-OHdG assay
29
Chromatographic separation of 8-OHdG and 2’dG15N is illustrated in Figure 4.2. Multiple
reaction monitoring (MRM) was used to monitor and quantify 8-OHdG and 2’dG15N. The total
ion chromatogram, as depicted in Figure 4.2, is the sum of both MRMs used for the detection of
8-OHdG and 2’dG15N.
Figure 4.2: Chromatographic separation of 2’dG15N and 8-OHdG standard solutions: (A) is the total ion
chromatogram (TIC) illustrating retention times for both 2’dG15N and 8-OHdG; (B) MRM of 8-OHdG and
(C) MRM of 2’dG15N.
When the gradient given in Table 4.4 is used for chromatographic separation, the biomarker 8-
OHdG (284.1 – 168.0 m/z) has a retention time of ± 12 minutes (Figure 4.1 and 4.2), 2’dG
(268.1 – 152.1 m/z) has a retention time of ± 10 minutes (Figure 4.1) and the isotope 2’dG15N
(273.2 – 157.2 m/z) has a retention time of ± 10 minutes (Figure 4.2). As mentioned previously,
8-OHdG can spontaneously form from 2’dG in the electrospray ion source of the mass
spectrometer, therefore chromatographic separation of 8-OHdG and 2’dG is essential. The

Optimisation and validation of the 8-OHdG assay
30
chromatographic separation of 2’dG and 8-OHdG was sufficient to prevent any 2’dG from
entering the MS at the same time as 8-OHdG (Figure 4.1).
4.4. Solid phase extraction (SPE) of 8-OHdG from urine
Although Weimann et al., (2001) reported direct quantification of 8-OHdG in urine (without a
clean-up step), this could not be achieved in this study (data not shown). The concentration of
8-OHdG in human urine was below the detection limit of the method and therefore a sample
clean-up step was necessary. In an effort to increase the concentration of 8-OHdG, it was
decided to use solid phase extraction (SPE). If a large volume of urine can be applied to the
SPE column and the 8-OHdG retained on the column, a lot of contaminants can be washed
from the column before the 8-OHdG is eluted in a small volume of mobile phase. This strategy
would not only remove a lot of contaminants/metabolites from the sample, but would also
increase the concentration of 8-OHdG to levels that can be detected and quantified.
A STRATA-X 200 mg/ 6 ml (Cat. No. 8B-S100-FCH) SPE column was chosen and purchased
from Separations, Phenomenex, South Africa, for sample clean up. The STRATA-X 200 mg/ 6
ml SPE column, is a polymeric reversed phase SPE, designed to retain polar molecules. A
vacuum manifold, (VisiprepTM, from Supelco: Cat. No. 5-7030) at 125 mm Hg was used for solid
phase extraction. The SPE column was preconditioned with 6 ml 100% methanol (MeOH) and
then with 6 ml milli Q water. The sample to be analysed (3 ml urine, 200 µl 5 M ammonium
formate buffer pH 3.75 and 50 µl 2’dG15N, 100 ng/ml) was applied to the column, and the
column was washed with 2 ml milli Q water. Elution of 8-OHdG was performed using 6 ml 40%
MeOH:water as described by Hu et al., (2004).
Retaining 8-OHdG and 2’dG15N during the loading and washing steps of the SPE is essential
for good reproducibility of the assay and was therefore investigated. A control urine sample was
used to test whether all 8-OHdG and 2’dG15N was retained by the SPE column during the
loading and wash steps, and whether all the 8-OHdG and 2’dG15N were removed from the SPE
column during the elution step. After the SPE column had been conditioned as described
previously, the control urine sample was loaded onto the SPE column (3 ml urine, 200 µl 5 M
ammonium formate buffer pH 3.75 and 50 µl 2’dG15N, 100ng/ml). The eluate from the loading
step was collected in a 6 ml Medispo tube. The SPE column was washed with 2 ml milli Q water
to remove some of the metabolites not of interest and the eluate was also collected in a new 6
ml Medispo tube. The 8-OHdG and 2’dG15N were then eluted from the SPE column with 6 ml

Optimisation and validation of the 8-OHdG assay
31
40% MeOH: water. A second elution step with 6 ml 100% MeOH was used to determine
whether 8-OHdG and 2’dG15N remained on the SPE column after the initial elution step. The
eluates from both these elution steps were separately collected in Medispo tubes.
All the collected fractions were evaporated under nitrogen on an AB 2000 Stargate Scientific
Nitrogen gas dryer, for approximately 20 minutes before they were frozen and freeze dried
overnight on a Virtis Manual Set freeze dryer. All the samples were reconstituted in 100 µl, 1
mM ammonium formate buffer pH 3.75 and analysed with the optimised 8-OHdG assay as
described in Section 4.5. Firstly, the fractions collected during the loading and wash steps of the
SPE column were evaluated. As can be seen from Figure 4.3, no 8-OHdG or 2’dG15N was
detected in the loading eluate (Figure 4.3, a) or the washing eluate (Figure 4.3, b).
Figure 4.3: TIC of the loading and wash step of the SPE method. This chromatogram shows that no 8-
OHdG (± 12 minutes) or 2’dG15N (± 10 minutes) eluted from the column during the (A) loading (B) and
washing of the STRATA-X SPE column.
The first and second elution steps were also evaluated to determine whether all the 8-OHdG
and 2’dG15N eluted from the SPE column with the first elution step. If any 8-OHdG or 2’dG15N
remained on the SPE column after the first elution step, a second elution step had to be
introduced to the standard method. As can be seen from Figure 4.4, 8-OHdG and 2’dG15N
eluted from the SPE column within the first elution step. This was expected, as this step was
designed to elute the wanted metabolites (8-OHdG and 2’dG15N) from the SPE column.

Optimisation and validation of the 8-OHdG assay
32
However, if the first elution step was insufficient, the second elution step would also contain 8-
OHdG and 2’dG15N. This was not the case as can be seen in Figure 4.5, since no 8-OHdG or
2’dG15N could be detected in the second elution step.
Figure 4.4: (A) TIC showing the elution of 8-OHdG and 2’dG15N from the SPE column with the first
elution step. The metabolites were eluted from the SPE column with 6 ml 40% MeOH during sample
clean up (B) The MRM of 8-OHdG (C) The MRM of 2’dG15N.

Optimisation and validation of the 8-OHdG assay
33
Figure 4.5: (A) TIC for 8-OHdG and 2’dG15N from the SPE column with the second elution step. No 8-
OHdG or 2’dG15N was detected in the eluate from the second elution step (B) MRM for 8-OHdG (C)
MRM for 2’dG15N.
It is clear from the data obtained that the chosen SPE column, as well as the sample clean up
method used, are sufficient in retaining the metabolites of interest during loading and washing. It
also proves that the first elution, with 6 ml 40% MeOH is sufficient to elute all the 8-OHdG and
2’dG15N from the SPE column, since no residual 8-OHdG and 2’dG15N was eluted from the SPE
column during the second elution with 6 ml 100% MeOH. It can therefore be concluded that the
SPE process is sufficient to clean and concentrate the urine sample in order to detect and
quantify 8-OHdG. No 8-OHdG or isotope is lost during the loading and washing steps, due to
insufficient binding of the metabolites by the SPE column. However, all the 8-OHdG and
2’dG15N are eluted from the SPE column by a single elution step, resulting in a concentrated
sample where 8-OHdG can be successfully detected and quantified.
4.5. The optimised 8-OHdG assay
Urine samples which were collected in 2008 and 2009 (See Chapter 3) and stored at -20 ºC
were thawed overnight in a fridge at 2 – 8 ºC. Each SPE column was preconditioned with 6 ml
100% MeOH and 6 ml milli Q water before the sample to be analysed (3 ml urine, 200 µl 5M

Optimisation and validation of the 8-OHdG assay
34
ammonium formate buffer pH 3.75 and 50 µl 2’dG15N, 100 ng/ml) was loaded onto the column.
After each loading step, each column was washed with 2 ml milli Q water. Elution of 8-OHdG
was performed with 6 ml 40% MeOH: water. The eluted sample was dried under a gentle
stream of nitrogen gas for ± 40 minutes at 37 °C on an AB 2000 Stargate Scientific Nitrogen gas
dryer to remove the MeOH. After the nitrogen drying, the remainder of the sample was frozen at
-80 °C for 2 hours. This was freeze dried overnight using a Virtis Manual Set freeze dryer. The
dried sample was reconstituted in 1 mM ammonium formate buffer pH 3.75 (100 µl) prior to
analysis. Chromatographic separation was performed on a Zorbax SB-Aq (2.1 x 150 mm, 3.5
µm) column and was protected with a Zorbax SB-Aq (2.1 X 12.5 mm, 5 µm) guard column. A 1
mM ammonium formate buffer pH 3.75 was used as mobile phase A and 100% MeCN as
mobile phase B and the gradient selected can be seen in Table 4.4. The flow rate was 0.2
ml/min and the injection volume was 20 µl. Electrospray ionisation was performed in the positive
ion mode. Nitrogen gas was used as nebulising gas. The tandem mass spectrometer was set to
detect specific precursor and product ions for 8-OHdG (284.1 – 168.0 m/z) and the isotope
2’dG15N (273.2 – 157.2 m/z). However, only the eluate fractions that contain the metabolites of
interest (8-OHdG and 2’dG15N) were directed to the mass spectrometer (time 5 minutes to 16
minutes). During the earlier (time 0 – 5 minutes) and later (time 16 – 41 minutes) part of the
chromatographic separation, eluting compounds were directed to waste instead of going into
the MS. During the analysis of the SABPA samples, a wash program (Table 4.5) was also
introduced after every batch of 20 samples. Since the normal gradient used for 8-OHdG
quantification (Table 4.4) only varied between 5 and 100% MeCN, some metabolites could
theoretically remain on the chromatographic column. Therefore, the wash program was
introduced to remove any residual metabolites from the column, and varied between 0 and
100% MeCN. For the wash step, 1 mM ammonium formate buffer pH 3.75 was used as mobile
phase A and 100% MeCN was used as mobile phase B.

Optimisation and validation of the 8-OHdG assay
35
Table 4.5: Mobile phase gradient timetable for the wash program used after every batch of 20
samples analysed on the LC-MS/MS. The mobile phases used was 1 mM ammonium formate
buffer pH 3.75 (mobile phase A) and 100% MeCN as mobile phase B.
Time B % Flow
0 5 0.2
2 0 0.2
14 0 0.2
24 100 0.2
30 100 0.2
40 5 0.2
4.6. Validation of the 8-OHdG quantification assay
Since method validation is an integral part in method development and it affects the quality of
the data it ultimately produces (Peters et al., 2007), the standardised method had to be
validated before it could be used. The parameters assessed during the process of validation
were specificity/selectivity, precision and linearity. The accuracy of the assay was not
measured. However, the 8-OHdG data obtained from the SABPA participants (0.27 – 106.17
ng/mg creatinine), is more or less in the same range as the 8-OHdG levels reported in the
literature, 0.49 – 14.29 ng/mg creatinine (Harri et al., 2007).
4.6.1. Linearity of the 8-OHdG assay
In this study linearity of the 8-OHdG assay was investigated as follows: a calibration range,
consisting of eight samples, was prepared, each containing 50 ng/ml 2’dG15N. The samples
also contained 0.5, 1, 2.5, 5, 10, 25, 50, 100 ng/ml 8-OHdG, respectively.
All the samples were prepared in 1 mM ammonium formate buffer pH 3.75 and analysed
immediately. Twenty µl of each sample was injected onto the LC-MS/MS with the gradient
given in Table 4.4. Mobile phase A consisted of 1 mM ammonium formate buffer pH 3.75 and
mobile phase B contained 100% MeCN. A flow rate of 0.2 ml/min was maintained in positive ion
mode during electrospray ionisation.

Optimisation and validation of the 8-OHdG assay
36
Figure 4.6: Calibration curve of 8-OHdG as obtained with the standardised 8-OHdG method. The [8-
OHdG] ranged from 0.5 to 100 ng/ml while the [2’dG15N] was 50 ng/ml in each sample (R2 > 0.99).
As can be seen from Figure 4.6, the standardised 8-OHdG assay is linear over the
concentration range measured (0.5 - 100 ng/ml) with a R2 > 0.99. Even at the lower
concentration range, the 8-OHdG assay is still linear (Figure 4.7).
Figure 4.7: Calibration curve of 8-OHdG as obtained with the standardised 8-OHdG method in the
lower concentration range.
0
0.05
0.1
0.15
0.2
0.25
0.3
0.35
0.4
0 0.05 0.1 0.15 0.2 0.25
[8OHdG/2'dG15N]
Are
a (
8O
Hd
G/2
'dG
15N
)
0
0.5
1
1.5
2
2.5
3
3.5
4
0 0.5 1 1.5 2 2.5
[8OHdG/2'dG15N]
Are
a (8
OH
dG
/2d
G1
5N
)

Optimisation and validation of the 8-OHdG assay
37
4.6.2. Response factor of 8-OHdG to 2’dG15N
The data used to demonstrate the linearity of the standardised 8-OHdG assay (section 4.6.1)
were also used to calculate the response factor of 8-OHdG relative to the isotope used
(2’dG15N). The following equation was used:
Equation 4.1:
analyte][ (analyte) Response
[IS] IS Responsefactor Response
Where: Response IS = the response of the internal standard (isotope)
[analyte] = the concentration of the analyte
Response (analyte) = the response of the analyte
[IS] = the concentration of the internal standard (isotope).
The average response factor (RF) of 8-OHdG to 2’dG15N is 0.55. Since the RF was obtained as
the average over a broad concentration range (0.5 to 100 ng/ml 8-OHdG), the RF can be used
to quantify [8-OHdG] over the specified concentration range.
4.6.3. Intrabatch and interbatch variation of the 8-OHdG quantification assay
Precision is the closeness of agreement between a series of measurements of the same
homogenous sample (Peters et al., 2007). Precision is usually measured in terms of imprecision
and is expressed as relative standard deviation (RSD %). The precision of the newly
standardised 8-OHdG assay was assessed by calculating the intra- and interbatch variations of
the assay. The intrabatch variation gives the variation of the assay within a batch (variation on
the same day), while the interbatch variation gives an indication of variation between different
days. Since all the urine samples from this study would not be analysed in one day, but over a
period of time, the interbatch variation should be considered more important.
A control urine sample was used to determine the intra- and interbatch variation of the 8-OHdG
method. This urine sample was thawed overnight at 2 – 8 °C. Eight aliquots of 3 ml each were
prepared and stored at -20 °C. For the intrabatch variation, four of these aliquots were thawed
and prepared in a single batch with the optimised method (Section 4.5) before being analysed
by LC-MS/MS. For the interbatch assay, four of the aliquots were separately assessed on four

Optimisation and validation of the 8-OHdG assay
38
consecutive days using the optimised method. Thus, these four samples were SPE extracted on
separate days and were also analysed on the LC-MS/MS on separate days. The results
obtained are given in Tables 4.6 and 4.7.
Table 4.6: Intrabatch variation of the 8-OHdG method. Mean = the mean of the four 8-OHdG
concentrations measured with the standardised 8-OHdG method. SD = standard deviation and
RSD = the relative standard deviation as a %
Sample # [8-OHdG]
Intra1 40.79
Intra2 37.63
Intra3 41.09
Intra4 38.78
Mean 39.57
SD 1.65
RSD % 4.18
Table 4.7: Interbatch variation of the 8-OHdG method. Mean = the mean of the four 8-OHdG
concentrations measured with the standardised 8-OHdG method. SD = standard deviation and
RSD = the relative standard deviation as a %
Sample # [8-OHdG]
Inter1 34.86
Inter2 40.97
Inter3 33.22
Inter4 26.64
Mean 33.92
SD 5.89
RSD % 17.37
For the intrabatch variation a RSD of 4.2% and for the interbatch variation a RSD of 17.4% was
obtained. The higher than expected interbatch variation could be due to differences within the
flow rate of the solvents on different days of the solid phase extraction process. A vacuum

Optimisation and validation of the 8-OHdG assay
39
manifold system was used to enhance the flow rate of organic solvent through the SPE.
However, maintaining a constant flow rate over time (on different days) proved problematic.
Although a constant flow rate was attempted each day, this was not always possible and could
have contributed to the higher than expected interbatch variation.
4.7. Conclusions on the optimised 8-OHdG assay
After numerous trial and error efforts with regard to optimising the best conditions for the
quantification of urinary 8-OHdG and a stable isotope, 2’dG15N, using LC-MS/MS, an analytical
assay was standardised. The 8-OHdG assay was validated with acceptable linearity (4.6.1) and
precision (4.6.3) and performed satisfactory using human urine.

40
5.1. Introduction Lipids, especially polyunsaturated fatty acids (PUFAs), are highly susceptible to reactions with
free radicals (Rathahao et al., 2005). Since PUFAs are part of membrane phospholipids or
lipoproteins, lipid peroxidation has been implicated in the development and progression of
numerous diseases, such as cancer, atherosclerosis, diabetes and aging (Esterbauer et al.,
1991). Thus, it could be useful to quantify products of lipid peroxidation to determine the extent
of lipid damage. One such lipid peroxidation product is 4-HNE. The latter is the primary
aldehyde formed from lipid peroxidation (Esterbauer et al., 1991). However, 4-HNE is
chemically reactive towards GSH (Völkel et al., 2005), and when conjugation occurs, it finally
gives rise to the end metabolite 1,4-dihydroxynonene mercapturic acid (DHN-MA). This
metabolite is relatively stable in urine and can be considered as a biomarker of lipid
peroxidation (Alary et al., 1998).
5.2. Chemicals, standard solutions and buffers
5.2.1. Chemicals
4-HNE-MA (Cat no. 32110) and its stable isotope, 4-HNE-MA-d3 (Cat no. 9000348) were
purchased from Cayman Chemicals. Sodium borohydride (Cat no. S9125), sodium hydroxide
(Cat. No. S8045), ammonium formate (Cat. No. 70221) and formic acid (Cat. No. 33015) were
purchased from Sigma Aldrich Co., USA. HCl (Cat no. 1006660), ethyl acetate (Cat no.
1.09623.2500) and methanol (MeOH) (Cat. No. 1.06007.2500) were purchased from Merck
Chemicals, South Africa. Acetonitrile (MeCN) (Cat. No. 017-4) was purchased from Agilent.
5.2.2. Standard solutions and buffers
A 1 mM ammonium formate buffer (pH 3.75) was prepared by dissolving the ammonium
formate in milli Q water. The pH was adjusted to 3.75 with concentrated formic acid. This buffer
was used as mobile phase A and MeCN was used as mobile phase B during chromatographic
separation on the LC-MS/MS.
CHAPTER 5
Optimisation and validation of the DHN-MA assay
MA

Optimisation and validation of the DHN-MA assay
41
For the synthesis of DHN-MA and DHN-MA-d3, from 4-HNE-MA and 4-HNE-MA-d3
respectively, a 5 M sodium borohydride (NaBH4) and a 1 N sodium hydroxide (NaOH) solution
were prepared by dissolving sodium borohydride in milli Q water and sodium hydroxide in milli
Q water respectively. A 5 N hydrochloric acid (HCl) solution was prepared by diluting
concentrated HCl in milli Q water. For the quantification of DHN-MA and DHN-MA-d3, a 5 mg/
10 ml H2O acetaminophen mercapturic acid solution was prepared.
5.3. Synthesis of DHN-MA and DHN-MA-d3 from 4-HNE-MA and 4-HNE-MA-
d3 respectively
Since DHN-MA and DHN-MA-d3 was not commercially available, it was necessary to
synthesise and purify it. A modified version of the method described by Kuiper et al., (2008)
was used for the synthesis of DHN-MA and DHN-MA-d3. DHN-MA was synthesised from the
commercially available 4-HNE-MA and the stable isotope DHN-MA-d3 was synthesised from 4-
HNE-MA-d3.
4HNE-MA in ethanol solution (100 µl, 1 mg/ml) was added to a clean Kimax tube and dried
under a gentle stream of nitrogen with an AB 2000 Stargate Scientific nitrogen dryer. After the
4-HNE-MA had been dried, 1 ml of the 1 N NaOH and 10 µl of the 5 M NaBH4 were added to
the dried 4-HNE-MA in the Kimax tube. The mixture was sonicated at room temperature for 30
minutes. The pH was then lowered to pH 3 with 5 N HCl prior to extraction. Ethylacetate (1 ml)
was added to the sample, and mixed on a rotor for 10 minutes at room temperature to extract
all the formed DHN-MA from the water phase. The Kimax tube was centrifuged for 3 minutes at
2000 x g to ensure good phase separation. After centrifugation, the organic top phase was
removed and added to a clean Kimax tube. This extraction of DHN-MA with ethylacetate was
repeated twice. After each centrifugation step, the organic phase, containing DHN-MA, was
added to the organic phase in the clean Kimax tube. The extracted sample was dried slowly
under nitrogen at 20 °C. The dried sample was reconstituted in 1 mM ammonium formate buffer
pH 3.75 (1 ml) and stored at -80 °C. The same conditions were used for the synthesis of DHN-
MA-d3, except that 4-HNE-MA-d3 (100 µl, 1 mg/ml) was used as the substrate instead of 4-
HNE-MA.

Optimisation and validation of the DHN-MA assay
42
5.4. Optimisation of LC-MS/MS conditions for quantification of
DHN-MA in urine
5.4.1. Specifications of the LC-MS/MS
An Agilent 1200 series LC (Santa Clara, CA, USA) was used for sample handling as well as for
mobile phase delivery. Samples (20 µl of each) were injected and a constant flow rate of 0.2
ml/min was maintained throughout the run. The MS/MS analysis was performed on an Agilent
6410 Triple Quadrupole mass spectrometer (Santa Clara, CA, USA) in positive ionisation.
5.4.2. Optimisation of the MS conditions for 4-HNE-MA and 4-HNE-MA-d3
quantification
MassHunter optimiser software was used to optimise the MS conditions in order to quantify 4-
HNE-MA and 4-HNE-MA-d3. MassHunter optimiser software provides a way to automatically
optimise the data acquisition parameters of the mass spectrometer for MRM mode (multiple-
reaction monitoring) of each individual compound to be analysed. It specifically automates the
selection of the best precursor ions, the optimisation of the fragmentor voltage for each
precursor ion, selection of the best fragment ions, and optimisation of collision energy values
for each transition for a list of compounds specified. Ten µl of each standard solution (4-HNE-
MA and 4-HNE-MA-d3) was separately infused in the MS (directly injected) with 50% MeCN:
50% water and 0.1% formic acid as the mobile phase. The results obtained for the MassHunter
optimiser are given in Tables 5.1 and 5.2.

Optimisation and validation of the DHN-MA assay
43
Table 5.1: The optimal electrospray tandem mass spectrometric conditions for the detection of
4-HNE-MA. MassHunter software was used to optimise the conditions for 4-HNE-MA detection
with the LC-MS/MS.
Compound
name
Formula
Nominal
mass
Polarity
Ion source
4-HNE-MA
C14H25NO5S
319.2
Positive
ESI
Precursor ion
Fragmentor
Product ion
Collision energy
Abundance
320.2
96
161.8
24
147
320.2
96
164.1
4
2761
320.2
96
273.8
0
145
320.2
96
80.2
32
533
Table 5.2: The optimal electrospray tandem mass spectrometric conditions for the detection of
4-HNE-MA-d3. MassHunter software was used to optimise the conditions for 4-HNE-MA-d3
detection with the LC-MS/MS.
Compound
name
Formula
Nominal mass
Polarity
Ion source
4-HNE-MA-d3
C14H22D3NO5S
322.2
Positive
ESI
Precursor ion
Fragmentor
Product ion
Collision energy
Abundance
323.2
65
164.1
4
803
323.2
65
122.1
20
319
323.2
65
83.1
36
119
323.2
65
282.2
4
43
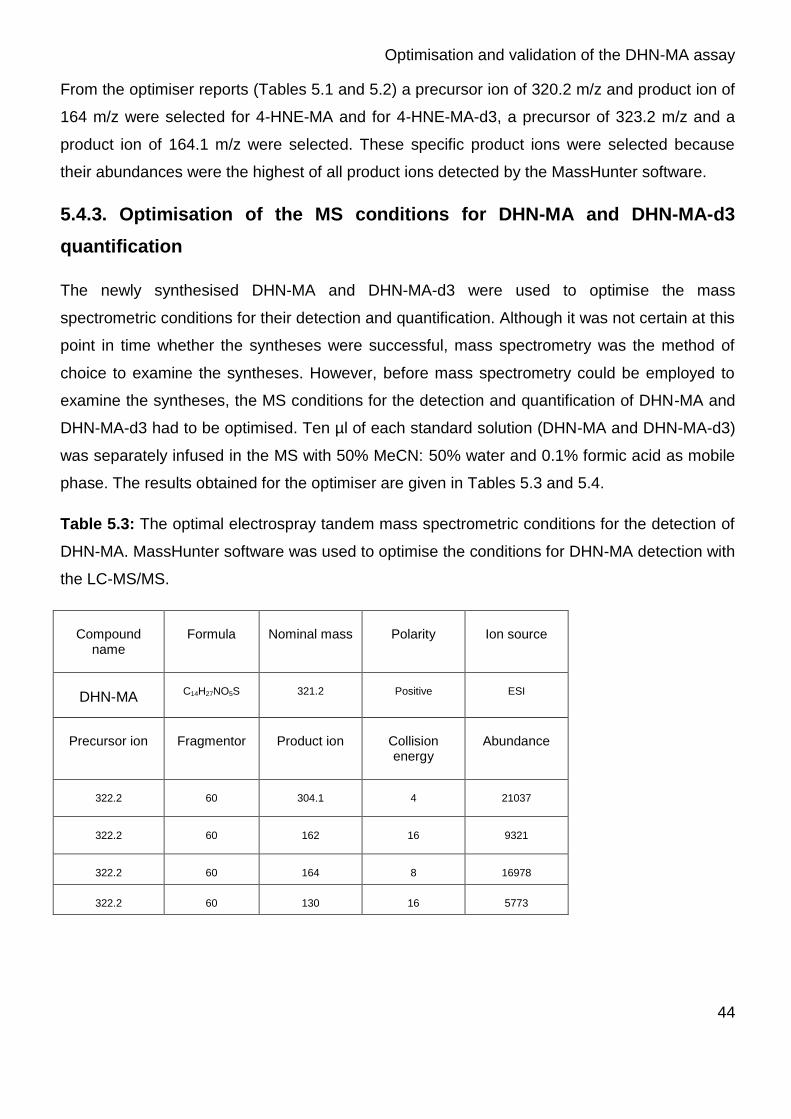
Optimisation and validation of the DHN-MA assay
44
From the optimiser reports (Tables 5.1 and 5.2) a precursor ion of 320.2 m/z and product ion of
164 m/z were selected for 4-HNE-MA and for 4-HNE-MA-d3, a precursor of 323.2 m/z and a
product ion of 164.1 m/z were selected. These specific product ions were selected because
their abundances were the highest of all product ions detected by the MassHunter software.
5.4.3. Optimisation of the MS conditions for DHN-MA and DHN-MA-d3
quantification
The newly synthesised DHN-MA and DHN-MA-d3 were used to optimise the mass
spectrometric conditions for their detection and quantification. Although it was not certain at this
point in time whether the syntheses were successful, mass spectrometry was the method of
choice to examine the syntheses. However, before mass spectrometry could be employed to
examine the syntheses, the MS conditions for the detection and quantification of DHN-MA and
DHN-MA-d3 had to be optimised. Ten µl of each standard solution (DHN-MA and DHN-MA-d3)
was separately infused in the MS with 50% MeCN: 50% water and 0.1% formic acid as mobile
phase. The results obtained for the optimiser are given in Tables 5.3 and 5.4.
Table 5.3: The optimal electrospray tandem mass spectrometric conditions for the detection of
DHN-MA. MassHunter software was used to optimise the conditions for DHN-MA detection with
the LC-MS/MS.
Compound
name
Formula
Nominal mass
Polarity
Ion source
DHN-MA
C14H27NO5S
321.2
Positive
ESI
Precursor ion
Fragmentor
Product ion
Collision energy
Abundance
322.2
60
304.1
4
21037
322.2
60
162
16
9321
322.2
60
164
8
16978
322.2
60
130
16
5773

Optimisation and validation of the DHN-MA assay
45
Table 5.4: The optimal electrospray tandem mass spectrometric conditions for the detection of
DHN-MA-d3. MassHunter software was used to optimise the conditions for DHN-MA-d3
detection with the LC-MS/MS.
Compound
name
Formula
Nominal mass
Polarity
Ion source
DHN-MA-d3
C14H24D3NO5S
324.2
Positive
ESI
Precursor ion
Fragmentor
Product ion
Collision energy
Abundance
325.2
70
307.3
0
6308
325.2
70
164.1
8
8072
325.2
70
130
12
5711
325.2
70
162
16
4304
From the optimiser reports for DHN-MA and DHN-MA-d3, a precursor ion of 322.2 m/z and
product ion of 304 m/z were selected for DHN-MA. However, the product ion of 304 m/z for
DHN-MA proved problematic (Section 5.9.2) and therefore the 164 m/z was later used as the
product ion of choice for DHN-MA detection. For DHN-MA-d3 a precursor of 325.2 m/z and a
product ion of 164.1 m/z were selected. These specific product ions were selected because
their abundances were the highest of all product ions detected by the MassHunter software.
5.4.4. Chromatographic separation
Since the initial aim was to standardise an analytical method for the simultaneous quantification
of 8-OHdG and DHN-MA, the same chromatographic conditions were used for the DHN-MA
assay as were used for the 8-OHdG assay (Chapter 4.3.3). Chromatographic separation was
performed on a Zorbax SB-Aq (2.1 x 150 mm, 3.5 µm) column (Cat. No. USSQG 01048)
purchased from Agilent. The column was protected with a Zorbax SB-Aq (2.1 X 12.5 mm, 5 µm)
(Cat. No. 82125-933) guard column also purchased from Agilent. The flow rate was 0.2 ml/min
and the injection volume was 20 µl. Electrospray ionisation was performed in the positive ion
mode. Nitrogen gas was used as nebulising gas. The optimal elution gradient, as was found for

Optimisation and validation of the DHN-MA assay
46
the 8-OHdG assay (Table 4.4), was used for chromatographic separation of DHN-MA and
DHN-MA-d3 (Table 5.5).
Table 5.5: Mobile phase gradient timetable used for the chromatographic separation of 8-
OHdG, 2’dG15N, DHN-MA and DHN-MA-d3. The mobile phases used for chromatographic
separation were 1 mM ammonium formate buffer pH 3.75 (mobile phase A) and 100% MeCN
as mobile phase B.
Time B % Flow
0 5 0.2
2 5 0.2
10 26 0.2
12 50 0.2
13 50 0.2
15 100 0.2
21 100 0.2
26 5 0.2
41 5 0.2

Optimisation and validation of the DHN-MA assay
47
Figure 5.1: Chromatogram of DHN-MA obtained when using the standard chromatographic conditions
for DHN-MA separation (A) TIC of DHN-MA (B) MRM of DHN-MA. DHN-MA was observed at ± 18
minutes analysed on an LC-MS/MS.

Optimisation and validation of the DHN-MA assay
48
Figure 5.2: Chromatogram of DHN-MA-d3 obtained with chromatographic separation using the same
standard chromatographic conditions as for DHN-MA separation. DHN-MA-d3 can be seen at ± 18
minutes analysed on an LC-MS/MS (A) TIC of DHN-MA-d3 (B) MRM of DHN-MA-d3.
DHN-MA (Figure 5.1) and DHN-MA-d3 (Figure 5.2) elute off the column at ± 18 minutes and
the 2’dG15N and 8-OHdG elute at ± 9 minutes and ± 11 minutes (Figure 4.2, Chapter 4)
respectively. Thus, it will be possible to analyse both DHN-MA and 8-OHdG during the same
run.

Optimisation and validation of the DHN-MA assay
49
5.5. Purification of the synthesised DHN-MA and DHN-MA-d3
After the chemical synthesis of DHN-MA and DHN-MA-d3 (as described in Section 5.3), both
were separately purified using a HPLC and a fraction collector. An Agilent 1200 series LC
(Santa Clara, CA, USA) was used for sample handling as well as for mobile phase delivery.
Forty fractions of 20 µl each of the synthesised DHN-MA were injected and a constant flow rate
of 0.2 ml/min was maintained throughout the run. This was coupled to an Agilent 1200 series
diode array detector (Santa Clara, CA, USA). Fraction collections were performed on an Agilent
1200 series analytical scale fraction collector (Santa Clara, CA, USA). The same mobile
phases and gradient used for LC-MS/MS analysis (Section 5.2.2 and Table 5.5) were also used
for the fractionation of DHN-MA and DHN-MA-d3.
The fraction collector (coupled to the HPLC) can be set to collect the fraction either based on
time or based on the elution of a peak during the chromatographic run. Therefore, it works
either in time based or in signal based mode. Due to the fact that DHN-MA has no
chromatophore and can therefore not be detected using a UV detector, the DHN-MA was
collected using a time-based strategy. However, the question remained at what retention time
the DHN-MA would elute from the chromatographic column since that would ultimately
determine the fraction to be collected. Caffeine was used to overcome the problem of DHN-MA
not being detectable using a UV detection system. Caffeine (0.325 mg/L) was prepared and
separated on the LC-MS/MS using the same mobile phases and chromatographic conditions
used on the HPLC-UV. Therefore, one can expect the caffeine and DHN-MA to elute from the
chromatographic column at approximately the same time as they would have eluted if they had
been separated on the HPLC-UV system. Using the LC-MS/MS, the elution of both caffeine
and DHN-MA could be monitored using mass spectrometry. After the elution times of both
compounds had been determined using the LC-MS/MS (retention times of 16 minutes for
caffeine and 18 minutes for DHN-MA), the same sample (containing both caffeine and DHN-
MA) was analysed on the HPLC-UV. Although DHN-MA could not be detected using UV
detection, caffeine could easily be detected. Since the retention time of caffeine was exactly the
same on the LC-MS/MS and HPLC-UV (16 minutes), it was concluded that the retention time of
DHN-MA should also be relatively constant. Therefore, it was decided to collect the fraction
from 17.5 to 18.5 minutes. Although the exact retention time of DHN-MA remained unknown on
the HPLC-UV, the fraction collected should contain the synthesised DHN-MA.

Optimisation and validation of the DHN-MA assay
50
The 40 fractions collected were pooled and dried under nitrogen. The dried sample was
reconstituted in 1 mM ammonium formate buffer pH 3.75 (1 ml). To determine whether 4-HNE-
MA was indeed converted to DHN-MA the mass spectrometer was set to detect both DHN-MA
and 4-HNE-MA (Sections 5.4.2 and 5.4.3) by direct infusion. Direct infusion was chosen instead
of chromatographic separation as only two metabolites were monitored in the synthesised
standard. Therefore, minimal interference with the detection of the two targeted compounds
was expected. The results are depicted in Figure 5.3.
Figure 5.3: LC-MS/MS analysis of the synthesised DHN-MA by direct infusion on a LC-MS/MS (A) TIC
of DHN-MA synthesis (B) MRM of DHN-MA (C) MRM of 4-HNE-MA.
From the results it is clear that the fractions collected contained DHN-MA. It is also clear that
the synthesis contains DHN-MA only, since no 4-HNE-MA was detected. Since no 4-HNE-MA
could be detected in the DHN-MA synthesis it can be concluded that an almost 100%
conversion from 4-HNE-MA to DHN-MA was achieved. Therefore, the synthesised DHN-MA
could be used as a standard to optimise and validate the DHN-MA quantification assay. The
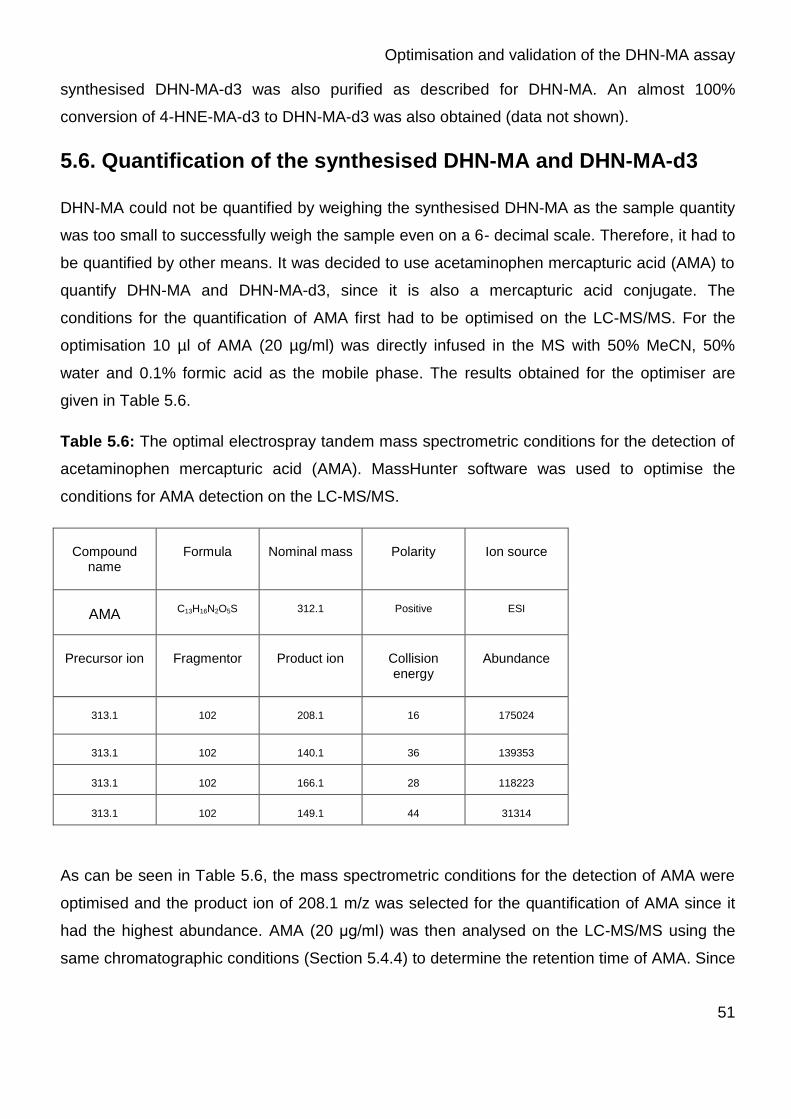
Optimisation and validation of the DHN-MA assay
51
synthesised DHN-MA-d3 was also purified as described for DHN-MA. An almost 100%
conversion of 4-HNE-MA-d3 to DHN-MA-d3 was also obtained (data not shown).
5.6. Quantification of the synthesised DHN-MA and DHN-MA-d3
DHN-MA could not be quantified by weighing the synthesised DHN-MA as the sample quantity
was too small to successfully weigh the sample even on a 6- decimal scale. Therefore, it had to
be quantified by other means. It was decided to use acetaminophen mercapturic acid (AMA) to
quantify DHN-MA and DHN-MA-d3, since it is also a mercapturic acid conjugate. The
conditions for the quantification of AMA first had to be optimised on the LC-MS/MS. For the
optimisation 10 µl of AMA (20 µg/ml) was directly infused in the MS with 50% MeCN, 50%
water and 0.1% formic acid as the mobile phase. The results obtained for the optimiser are
given in Table 5.6.
Table 5.6: The optimal electrospray tandem mass spectrometric conditions for the detection of
acetaminophen mercapturic acid (AMA). MassHunter software was used to optimise the
conditions for AMA detection on the LC-MS/MS.
Compound
name
Formula
Nominal mass
Polarity
Ion source
AMA
C13H16N2O5S
312.1
Positive
ESI
Precursor ion
Fragmentor
Product ion
Collision energy
Abundance
313.1
102
208.1
16
175024
313.1
102
140.1
36
139353
313.1
102
166.1
28
118223
313.1
102
149.1
44
31314
As can be seen in Table 5.6, the mass spectrometric conditions for the detection of AMA were
optimised and the product ion of 208.1 m/z was selected for the quantification of AMA since it
had the highest abundance. AMA (20 μg/ml) was then analysed on the LC-MS/MS using the
same chromatographic conditions (Section 5.4.4) to determine the retention time of AMA. Since

Optimisation and validation of the DHN-MA assay
52
the retention time of AMA was ± 13 minutes (Figure 5.4), it was seen as satisfactory for the
quantification of DHN-MA.
Figure 5.4: Chromatogrpahic separation of acetaminophen mercapturic acid (AMA). The TIC illustrates
the retention time of AMA at ± 13 minutes using the standard chromatographic conditions used for the
separation of 8-OHdG and DHN-MA.
The next step was to separate DHN-MA and AMA in the same sample using the LC-MS/MS.
This was essential in order to quantify the synthesised DHN-MA solution. Twenty µl of a 10 x
dilution of the synthesised DHN-MA was added to 20 µl of a 250 ng/ml AMA solution. These
samples were analysed on the LC-MS/MS and the results obtained are depicted in Figure 5.5.

Optimisation and validation of the DHN-MA assay
53
Figure 5.5: Chromatographic separation of AMA and DHN-MA on an LC-MS/MS (A) TIC of AMA (±
13 minutes) and DHN-MA (± 18 minutes) on an LC-MS/MS (B) MRM of DHN-MA on LC-MS/MS (C)
MRM of AMA on LC-MS/MS.
From Figure 5.5 the relative concentration of the synthesised DHN-MA was calculated using
Equation 5.1.

Optimisation and validation of the DHN-MA assay
54
Equation 5.1: Response factor of DHN-MA to AMA.
analyte][ (analyte) Response
[IS] IS Responsefactor Response
Where: Response IS = the response of the internal standard (isotope)
[analyte] = the concentration of the analyte
Response (analyte) = the response of the analyte
[IS] = the concentration of the internal standard (isotope).
Since no response factor of DHN-MA to AMA could be calculated, the response factor was
taken as one. Therefore, only the relative concentration of DHN-MA could be calculated and
not the exact concentration. The relative concentration of the synthesised DHN-MA (dissolved
in 1 ml 1 mM ammonium formate buffer pH 3.75) was calculated as 0.56 µg/ml. The same
approach was used to determine the relative concentration of the synthesised DHN-MA-d3
(dissolved in 1 ml 1 mM ammonium formate buffer pH 3.75). This concentration was calculated
as 9.08 µg/ml.
5.7. Solid phase extraction of DHN-MA from urine
As the initial aim was to develop a single assay to quantify both DHN-MA and 8-OHdG, the
same method of sample cleanup used for 8-OHdG (Section 4.4) was used for DHN-MA. A
vacuum manifold, (VisiprepTM, from Supelco: Cat. No. 5-7030) was used at 125 mm Hg for solid
phase extraction. Initially the SPE column was preconditioned with 6 ml 100% methanol
(MeOH) and then with 6ml milli Q water. The sample to be analysed (3 ml urine, 200 µl 5M
ammonium formate buffer pH 3.75, 50 µl 2’dG15N, 100 ng/ml and 50 µl DHN-MA-d3, 0.908
ng/ml) was applied to the column and the column was washed with 2 ml milli Q water. Elution of
DHN-MA was performed using 6 ml 40% MeOH: water.
5.8. The optimised DHN-MA assay
Each SPE column was preconditioned with 6 ml 100% MeOH and 6 ml milli Q water before the
sample to be analysed (3 ml urine, 200 µl 5M ammonium formate buffer pH 3.75, 50 µl
2’dG15N, 100 ng/ml and 50 µl DHN-MAd3, 0.908 ng/ml) was loaded onto the column. After the
loading step, each column was washed with 2 ml milli Q water. Elution of DHN-MA was
performed with 6 ml 40% MeOH: water. The eluted sample was dried under a gentle stream of
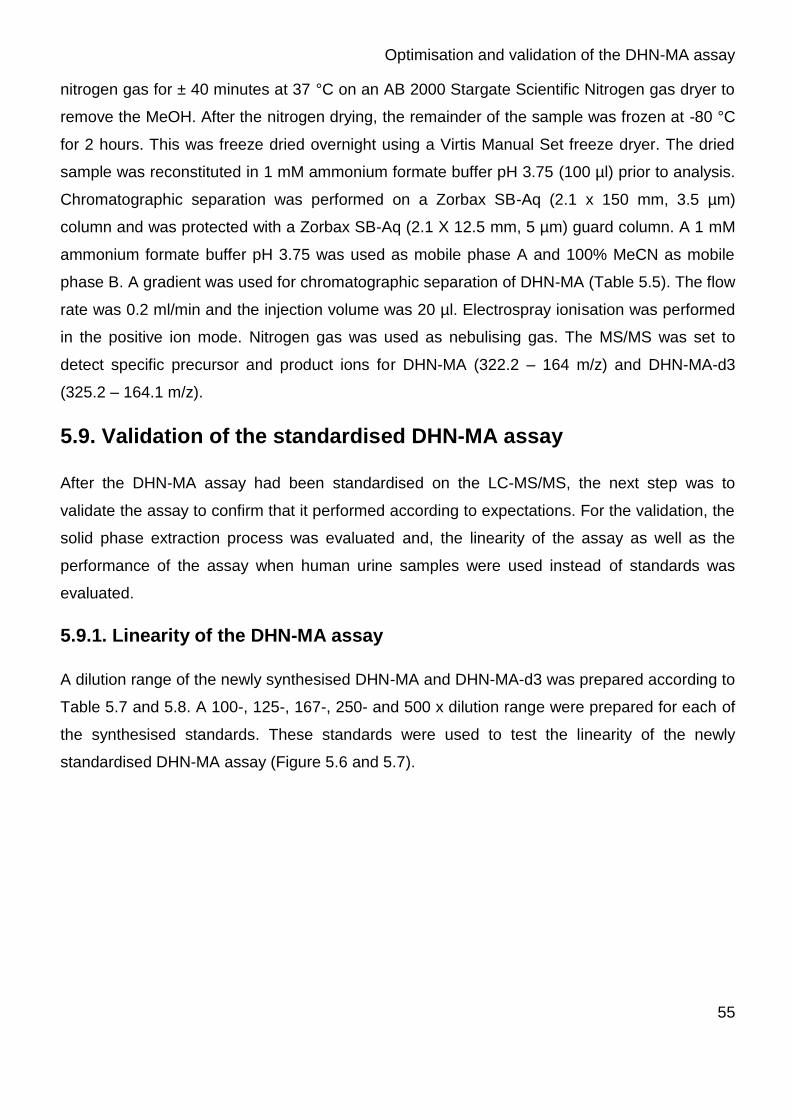
Optimisation and validation of the DHN-MA assay
55
nitrogen gas for ± 40 minutes at 37 °C on an AB 2000 Stargate Scientific Nitrogen gas dryer to
remove the MeOH. After the nitrogen drying, the remainder of the sample was frozen at -80 °C
for 2 hours. This was freeze dried overnight using a Virtis Manual Set freeze dryer. The dried
sample was reconstituted in 1 mM ammonium formate buffer pH 3.75 (100 µl) prior to analysis.
Chromatographic separation was performed on a Zorbax SB-Aq (2.1 x 150 mm, 3.5 µm)
column and was protected with a Zorbax SB-Aq (2.1 X 12.5 mm, 5 µm) guard column. A 1 mM
ammonium formate buffer pH 3.75 was used as mobile phase A and 100% MeCN as mobile
phase B. A gradient was used for chromatographic separation of DHN-MA (Table 5.5). The flow
rate was 0.2 ml/min and the injection volume was 20 µl. Electrospray ionisation was performed
in the positive ion mode. Nitrogen gas was used as nebulising gas. The MS/MS was set to
detect specific precursor and product ions for DHN-MA (322.2 – 164 m/z) and DHN-MA-d3
(325.2 – 164.1 m/z).
5.9. Validation of the standardised DHN-MA assay
After the DHN-MA assay had been standardised on the LC-MS/MS, the next step was to
validate the assay to confirm that it performed according to expectations. For the validation, the
solid phase extraction process was evaluated and, the linearity of the assay as well as the
performance of the assay when human urine samples were used instead of standards was
evaluated.
5.9.1. Linearity of the DHN-MA assay
A dilution range of the newly synthesised DHN-MA and DHN-MA-d3 was prepared according to
Table 5.7 and 5.8. A 100-, 125-, 167-, 250- and 500 x dilution range were prepared for each of
the synthesised standards. These standards were used to test the linearity of the newly
standardised DHN-MA assay (Figure 5.6 and 5.7).

Optimisation and validation of the DHN-MA assay
56
Table 5.7: A dilution range of the synthesised DHN-MA used to evaluate the linearity of the
DHN-MA assay. The table shows the final concentration of DHN-MA in each sample.
Sample Number DHN-MA
1 0.0 ng/ml
2 1.1 ng/ml
3 2.2 ng/ml
4 3.3 ng/ml
5 4.5 ng/ml
6 5.6 ng/ml
Figure 5.6: The linearity of the DHN-MA assay (R2 > 0.99).
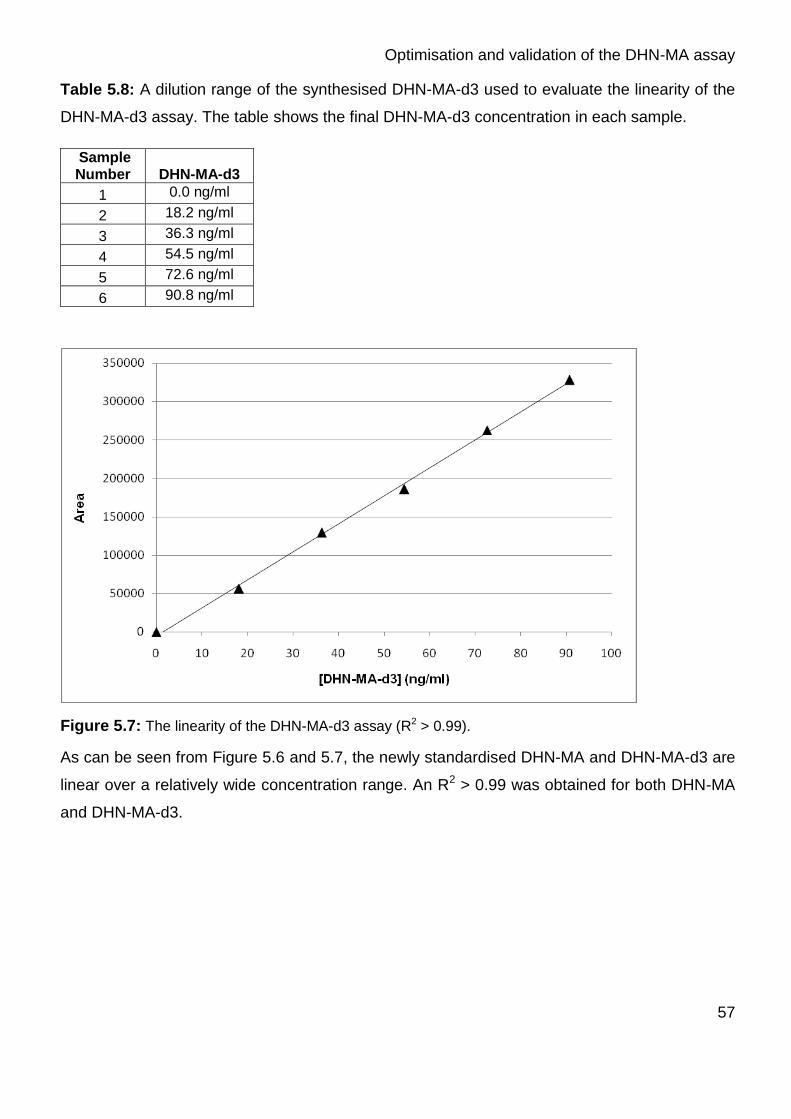
Optimisation and validation of the DHN-MA assay
57
Table 5.8: A dilution range of the synthesised DHN-MA-d3 used to evaluate the linearity of the
DHN-MA-d3 assay. The table shows the final DHN-MA-d3 concentration in each sample.
Sample Number DHN-MA-d3
1 0.0 ng/ml
2 18.2 ng/ml
3 36.3 ng/ml
4 54.5 ng/ml
5 72.6 ng/ml
6 90.8 ng/ml
Figure 5.7: The linearity of the DHN-MA-d3 assay (R2 > 0.99).
As can be seen from Figure 5.6 and 5.7, the newly standardised DHN-MA and DHN-MA-d3 are
linear over a relatively wide concentration range. An R2 > 0.99 was obtained for both DHN-MA
and DHN-MA-d3.

Optimisation and validation of the DHN-MA assay
58
5.9.2. Validation of the solid phase extraction (SPE) process for the DHN-MA
assay
As the initial aim was to standardise a single assay for the quantification of DHN-MA and 8-
OHdG, the same SPE clean-up process was used for DHN-MA as was used for 8-OHdG
(Section 5.7). However, the binding of DHN-MA to the SPE column had to be evaluated. For
this purpose, the synthesised DHN-MA (55.7 ng/ml) was used.
Initially, the SPE column was preconditioned with 6 ml 100% methanol (MeOH) and then with 6
ml milli Q water. The sample containing DHN-MA [(100 µl of the synthesised DHN-MA standard
with a concentration of 55.7 ng/ml), ammonium formate buffer pH 3.75 (80 µl of a 5 M solution)
and 820 µl milli Q water], was applied to the column and the loading eluate was collected for
analysis. The SPE column was then washed with 2 ml milli Q water and the eluate was again
collected. Elution of DHN-MA was performed using 6 ml 40% MeOH: water and the eluate
collected. After metabolite elution, the column was again washed with 6 ml 100% MeCN to
determine whether any DHN-MA remained on the SPE column after the initial elution step. All
the collected eluates were analysed for the presence of DHN-MA using the optimised DHN-MA
assay (Section 5.8) and the results obtained are depicted in Figures 5.8 to 5.11.
Figure 5.8: TIC of the eluate from the loading step of the SPE process. No DHN-MA (retention time ±
18 minutes) was detected.

Optimisation and validation of the DHN-MA assay
59
Figure 5.9: TIC of the first washing step of the SPE process. No DHN-MA was detected in the eluate
of the wash step.
Figure 5.10: TIC of the first elution step with 6 ml 40% MeOH of the SPE process. DHN-MA was
detected in the eluate with a retention time of approximately 18 minutes.

Optimisation and validation of the DHN-MA assay
60
Figure 5.11: TIC of the second washing step with 6 ml 100% MeCN of the SPE process (A) TIC of
second elution step of DHN-MA (B) MRM of DHN-MA.
As can be seen from Figures 5.8 and 5.9, no DHN-MA eluted from the SPE column. This
means that the DHN-MA was retained on the SPE during the loading and washing steps. DHN-
MA was detected in the elution fraction (Figure 5.10) as was expected. However, no DHN-MA
was detected in the second elution eluate (Figure 5.11). From these data it is clear that a single
elution step with 6 ml 40% MeOH: water was sufficient to remove all the DHN-MA from the SPE
column. No DHN-MA remained on the SPE column after the first wash step and therefore no
additional elution step was required.
Another concern was the metabolite that eluted at approximately 2 minutes on the
chromatogram (Figures 5.8 to 5.11). Although the retention time differed dramatically from that
of DHN-MA (retention time ± 18 minutes), the identity of this peak at ± 2 minutes was
investigated.
The metabolite that elutes at ± 2 minutes was of concern since the LC-MS/MS was set to
detect all metabolites with a precursor ion of 322 m/z and product ion of 304 m/z, at that stage.
However, it was found that the peak at 2 minutes was not DHN-MA as its precursor ion and
daughter ions differed from that of DHN-MA (Figure 5.12).

Optimisation and validation of the DHN-MA assay
61
Figure 5.12: Chromatogram of the product ion spectra of the contaminant metabolite that eluted at
approximately 2 minutes as well as the product ion spectra of DHN-MA. (A) Product ion scan of the
contaminant. This spectrum shows a very similar precursor ion (321.9 m/z) to DHN-MA (322.0 m/z) as
well as precursor ion (303.9 m/z) (B) Product ion scan of DHN-MA.
Although the contaminant had almost the same precursor ion (321.9 m/z) compared to that of
DHN-MA (322.0 m/z) the product ions differed markedly. The product ions obtained for the
contaminant were 303.9, 281.0 and 263.1 m/z. However, the product ions obtained for DHN-
MA were 304.1, 164.0, 162.0 and 130.0 (Table 5.3). Therefore, the contaminant peak that
eluted at approximately 2 minutes during the validation of the SPE process (Figures 5.8 to
5.11) cannot be DHN-MA and, consequently its presence could be ignored as it eluted far from
the other metabolites of interest (DHN-MA and 8-OHdG).

Optimisation and validation of the DHN-MA assay
62
An MRM was used to quantify DHN-MA, monitoring for a specific precursor and product ion.
Initially, 322 m/z was used as the precursor ion and 304 m/z as the product ion since 304 m/z
gave the highest abundance during optimisation (Table 5.3). However, Rathahao et al., (2005)
suggested that a product ion of 304 m/z should not be used for the detection of DHN-MA but
rather 164 m/z. Since the product ion of 304 m/z is formed by the elimination of water, and
several urinary compounds containing a hydroxylated group could easily eradicate a water
molecule, the loss of 18 m/z is not specific enough to use for an MRM and should be avoided.
Therefore, it was decided to use a product ion of 164 m/z and precursor ion of 322 m/z for
DHN-MA quantification, as also recommended by Alary et al., (1998).
5.9.3. Measuring DHN-MA in human urine
It was concluded that the SPE method, optimised for 8-OHdG, worked well for DHN-MA in
retaining the metabolite of interest during the SPE loading and washing steps. The elution step
also performed well for eluting DHN-MA from the SPE column. The next step was to test the
performance of the standardised DHN-MA assay on urine samples. For this purpose, a control
urine sample (Section 3.1.3) was analysed and the results are depicted in Figure 5.13.

Optimisation and validation of the DHN-MA assay
63
Figure 5.13: Chromatogram of a control urine sample (a) TIC showing co-eluting peaks at the
retention time where DHN-MA elutes (± 18 minutes) (b) MRM of DHN-MA.
As can be seen in Figure 5.13, numerous other metabolites co-eluted with DHN-MA and also
presented the same product and precursor ions. Since an MRM was used for DHN-MA
detection, using a precursor ion of 322.2 m/z and a product ion of 164.1 m/z, any other
metabolites displaying the same product and precursor ions will also be detected with the
MRM. Thus, only a difference in retention time could be used to discriminate between DHN-MA
and other metabolites displaying the same product and precursor ions. Since numerous
metabolites with the same product and precursor ions eluted at approximately the same time as
DHN-MA, it could not be said for certain which peak on the chromatogram presented DHN-MA.
Another problem is that different samples might contain different contaminants eluting at
approximately the same time as DHN-MA and having the same product and precursor ions as

Optimisation and validation of the DHN-MA assay
64
DHN-MA. Therefore, numerous peaks might appear on the chromatogram at the time interval
where DHN-MA usually elutes from the column, making quantification of DHN-MA in different
urine samples basically impossible with the standardised method.
The reason for numerous metabolites eluting from the column at the same time as DHN-MA, is
that DHN-MA elutes from the column only at 100% MeCN. This means that very little
chromatographic separation still occurs in the sample and all the metabolites still on the column
elute simultaneously when 100% MeCN is applied to the column. Therefore, new
chromatographic conditions were needed where DHN-MA eluted from the column before the
100% organic mobile phase was reached.
5.10. Additional modifications to the DHN-MA assay
Since the newly standardised DHN-MA assay did not perform to satisfaction, additional
modifications were considered. Firstly, different reverse phase chromatographic columns were
tested in an effort to elute the DHN-MA from the column before 100 % organic mobile phase
was applied. Secondly, a normal phase silica column was used for the chromatography of
DHN-MA. Lastly, the effect of different pH ranges on the DHN-MA assay was evaluated.
5.10.1. The effect of different reverse phase chromatographic columns on
the DHN-MA assay
The performance of different chromatographic columns was tested on the chromatography of
DHN-MA. A Zorbax SB-C18 (2.1 mm x 15 cm) from Agilent (Cat. No. 883700.922) was
selected as well as a Luna 5u C8 (2) 100A (150 x 2.00 mm, 5 µm) (Cat. No. 00F-4249-BO)
from Phenomenex. The chromatographic separation of DHN-MA-d3 was tested on both these
columns using the same gradient (Table 5.5) and mobile phases (1 mM ammonium formate
buffer pH 3.75 and 100% MeCN) and compared to the separation obtained using the Zorbax
SB-Aq column (used up to this point and also used for 8-OHdG chromatography). The results
obtained are illustrated in Figures 5.14 and 5.15.

Optimisation and validation of the DHN-MA assay
65
Figure 5.14: Chromatographic separation of DHN-MA-d3 on a C18 column (A) TIC obtained for DHN-
MA-d3 (B) MRM of DHN-MA-d3. DHN-MA-d3 eluted from the column at ± 18 minutes.

Optimisation and validation of the DHN-MA assay
66
Figure 5.15: Chromatographic separation of DHN-MA-d3 using a C8 column (A) TIC of DHN-MA-d3
(B) MRM for DHN-MA-d3. DHN-MA-d3 eluted from the column at ± 19 minutes.
No signifficant difference was observed in the retention times of DHN-MA-d3 using the C18
column (Figure 5.14), the C8 column (Figure 5.15) or the Aqua column (Figure 5.2). Using all
three columns, the DHN-MA-d3 only eluted from the column when 100% MeCN was applied.
Since the aim was to get DHN-MA-d3 to elute from the column before 100% organic phase was
applied, none of the tested columns proved satisfactory.
5.10.2. The effect of a normal phase chromatographic column on the DHN-
MA assay
Next a normal phase AscentisTM Si (15 cm x 2.1 mm 5 µm) column from Supelco (Cat. No.
581509-U) was used for chromatographic separation of DHN-MA-d3. With this column,
isocratic elution with mobile phases MeCN 100% (A) and 1 mM ammonium formate buffer pH
3.75 (B) were used. The following isocratic elutions were selected and tested: firstly 90% A and
10% B, secondly 80% A and 20% B, thirdly 95% A and 5% B and lastly 99% A and 1% B, and
the results are given in Figure 5.16.

Optimisation and validation of the DHN-MA assay
67
Figure 5.16: Overlay of chromatographic separation of DHN-MA-d3 on an AscentisTM Si column using
different concentrations mobile phases. The green peak was obtained with 80% mobile phase A and
20% mobile phase B. The blue peak is the result of 90% mobile phase A and 10% mobile phase B. With
95% mobile phase A and 5% mobile phase B, the red peak was obtained, while the black peak was
obtained with 99% mobile phase A and 1% mobile phase B.
As can be clearly seen from Figure 5.16, the AscentisTM Si column could not retain DHN-MA,
not even when 99% MeCN (and 1 mM ammonium formate buffer pH 3.75) was used as mobile
phase. Therefore, the idea of using a normal phase column instead of a reverse phase column
was rejected.
5.10.3. The effect of pH on the chromatography of DHN-MA
A Zorbax SB-C18 (2.1 mm x 15 cm) from Agilent was again used and three different pH
ammonium formate buffers (mobile phase B) were prepared (pH 5, 6 and 7.5 respectively). The
standard gradient was used for chromatography (Table 5.5).

Optimisation and validation of the DHN-MA assay
68
Figure 5.17: Chromatogram of DHN-MA-d3 obtained with the C18 column with different pH buffers of
ammonium formate (a) TIC of DHN-MA-d3 obtained with an ammonium formate buffer of pH5 (b) TIC of
DHN-MA-d3 obtained with a pH6 ammonium formate buffer and (c) TIC of DHN-MA-d3 obtained with a
pH of 7.5 ammonium formate buffer.
Different pH ranges of the mobile phase, 1 mM ammonium formate buffer, show that a higher
pH (Figure 5.17.c) does not retain DHN-MA-d3 as much as a mobile phase with a lower pH
(Figure 5.17.a). However, DHN-MA-d3 eluted at ± 15 minutes with a pH of 7.5. At 15 minutes,
the gradient (Table 5.5) is already on 100% MeCN, thus it does not solve the problem of co-
eluting peaks.
5.11. Conclusions on the optimised DHN-MA assay
Although the initial aim was to optimise and standardise a single analytical assay to quantify
both 8-OHdG and DHN-MA in urine samples, this was not possible within the scope and
timeframe of this study. An analytical method was standardised and validated for the
quantification of 8-OHdG using an LC-MS/MS and a stable isotope. As discussed in Section
4.6, the 8-OHdG assay was validated and performed satisfactory using human urine. However,
the application of this method for the quantification of DHN-MA proved problematic.
Since DHN-MA and its stable isotope, DHN-MA-d3, was not commercially available, both had
to be synthesised and purified. As the synthesis could only be performed on a very small scale,

Optimisation and validation of the DHN-MA assay
69
the synthesised standards could not be dried and the weight determined effectively. Therefore,
the two synthesised standards were dissolved in 1 ml, 1 mM ammonium formate buffer pH 3.75
respectively. Acetaminophen mercapturic acid (AMA) was commercially available and it was
used for the relative quantification of DHN-MA and DHN-MA-d3. With the standards
synthesised, purified and quantified, DHN-MA was used to test the performance of the
standardised DHN-MA assay. The assay performed reasonably when standards were used, but
when urine samples were used, the results were totally unreliable. Not only did numerous
metabolites elute from the chromatographic column at the same time when DHN-MA did, but
some of the eluting metabolites also displayed the same product and precursor ions used to
detect DHN-MA. This was the result of DHN-MA only eluting from the column when 100%
organic phase was applied. Because no gradient was applied any longer, metabolites did not
elute form the column according to their polarities anymore and numerous metabolites eluted at
once. This resulted in numerous peaks being detected around the DHN-MA peak and it could
not be established for certain which peak represented DHN-MA in the sample.
Different approaches were followed in an effort to enhance the chromatographic separation of
DHN-MA. Unfortunately, none were successful. Due to the time limitation on this study, it was
decided to only use the standardised 8-OHdG assay to study the 409 participants described in
Section 3.1.3. It was also realised that a single assay to quantify both 8-OHdG and DHN-MA
may not be viable. A new approach is needed to successfully and reliably quantify DHN-MA.

70
6.1. Introduction
The aim of this study was to develop an LC-MS/MS assay to successfully and reliably quantify
urinary 8-OHdG and DHN-MA as markers of oxidative stress and to calculate the correlation
between ROS, 8-OHdG and DHN-MA. However, due to a number of difficulties with the
quantification of DHN-MA (Chapter 5), it was decided to only quantify urinary 8-OHdG and
serum ROS levels.
Participating study subjects in the SABPA study included 200 African (100 males and 100
females) and 209 Caucasian (101 males and 108 females) teachers in the Potchefstroom area
of the North-West province of South Africa. Ten hour fasting baseline urine and serum samples
were collected in 2008 and 2009 for the quantification of ROS, 8-OHdG and DHN-MA. The
newly optimised and validated 8-OHdG assay (Section 4.5) was then used to quantify urinary 8-
OHdG levels in all the SABPA participants, and the ROS assay (Section 3.3) was used to
quantify serum ROS levels. The study was approved by the Ethics Committee of the North-
West University (06M09 and NWU-00036-07-S6).
6.2. Urinary 8-OHdG levels
The newly optimised 8-OHdG assay (Section 4.5) was used to quantify urinary 8-OHdG levels
for all the SABPA participants (Appendix A). Firstly, the Shapiro Wilk test for normality was
applied to the data. From Figure 6.1 it is clear that normality was rejected (p < 0.01). Although
sample sizes were large in all groups, non-parametric tests were employed for further data
analysis based on the skewness in the data (Figure 6.1).
CHAPTER 6
Results and discussion

Results and discussion
71
-20 0 20 40 60 80 100 120
X <= Category Boundary
0
20
40
60
80
100
120
140
160
180
200
220N
o. of o
bs.
Figure 6.1: Distribution of the urinary 8-OHdG data. Since the data were skewed (p < 0.01), non-
parametric tests were used to further analyse the data.
Before the data were analysed, outliers were removed by the use of Tukey’s method, which
defines outliers as those data points falling outside the control limits. The control limits are
defined as three interquartile ranges below the 25th percentile or above the 75th percentile
(Tukey, 1977). Because initial investigation of the data revealed that the 8-OHdG levels might
differ between some of the groups, each of the four groups was separately assessed to identify
outliers in that group. After removal of the outliers, 84 African females, 86 African males, 96
Caucasian females and 87 Caucasian males remained.
A BDM test was used to test the significance of the interaction between ethnicity and gender
(Figure 6.2). Since no interaction was found (p = 0.32), the significance of the main effect could
be investigated by pooling the data (i.e. ethnicity and gender). This means that the gender effect
is investigated by ignoring ethnicity and vice versa. However, because the data are skewed
(Figure 6.1) and the ranges differ considerably between groups, pooling of data may not be
advisable. Therefore, it was decided to analyse the main effect of gender on different levels of
ethnicity and vice versa. Mann-Whitney U tests were used for this purpose while box plots were
used for schematic representations of the data.

Results and discussion
72
8O
HdG
(ng/m
g c
reatin
ine)
Median
25%-75%
Min-MaxGENDER: male
African Caucasian-20
0
20
40
60
80
100
120
GENDER: female
African Caucasian
Figure 6.2: Schematic representation of the 8-OHdG data for the SABPA participants after outliers
were removed from the data set by the use of Tukey’s method. A BDM test was used to test the
significance of the interaction between ethnicity and gender. No interaction was evident (p = 0.32).
6.2.1. The effect of gender on urinary 8-OHdG levels
The first step in comparing the different groups was to compare the measured 8-OHdG in males
to that of the females for each ethnic group (Figures 6.3 and 6.4).

Results and discussion
73
Median 25%-75% Min-Max
African Females African Males
GENDER
-10
0
10
20
30
40
50
608O
Hd
G (
ng/m
g c
reatin
ine)
Figure 6.3: Urinary 8-OHdG levels of African females (n=84) and African males (n=86). p = 0.053.
For African men, the median urinary 8-OHdG level was 13.07 ng/mg creatinine and that of
African females was 17.6 ng/mg creatinine. In the African male group, the 8-OHdG levels
ranged from 0.99 to 52.38 ng/mg creatinine. In the African female group the 8-OHdG levels
ranged between 0.27 and 56.63 ng/mg creatinine. A p-value of 0.053 was obtained, indicating
that no statistical significant difference exist between African males and females regarding
urinary 8-OHdG levels.

Results and discussion
74
Median 25%-75% Min-Max
Caucasian Females Caucasian Males
GENDER
-20
0
20
40
60
80
100
1208O
Hd
G (
ng/m
g c
reatin
ine)
Figure 6.4: Urinary 8-OHdG levels of Caucasian females (n=96) and Caucasian males (n=87). p =
0.68.
For Caucasian men, the median urinary 8-OHdG level was 22.22 ng/mg creatinine and that of
Caucasian females was 24.95 ng/mg creatinine. In the Caucasian male group, the 8-OHdG
levels ranged from 0.54 to 106.17 ng/mg creatinine. In the Caucasian female group the 8-OHdG
levels ranged between 0.54 and 83.50 ng/mg creatinine. A p-value of 0.68 was obtained with
the Mann Whitney U test, indicating no statistically significant difference between Caucasian
males and females regarding urinary 8-OHdG levels.
From the data obtained during this study no statistically significant difference between the
urinary 8-OHdG levels between men and women from both ethnicities was evident.
Randomly selected Caucasian healthy subjects (52 females and 31 males) were included in the
study done by Loft et al., (1992), where slightly higher urinary 8-OHdG levels were found in
males compared to females. The same result was obtained in a study done by Lin et al., (2004).
Here, 12 healthy non-smoking persons from Singapore were included in the study (seven males
and five females). However, the differences observed in both studies were not statistically
significant (p > 0.05) (Loft et al., 1992; Lin et al., 2004). Nakano et al., (2003) found a slightly

Results and discussion
75
higher level of urinary 8-OHdG levels in females (n=1254) compared to that of males (n=1253),
but this difference was also not statistically significant. Thus, the results obtained in this study
are consistent with the literature as no statistically significant difference was observed between
urinary 8-OHdG levels of males and females for both ethnic groups.
6.2.2. The effect of ethnicity on urinary 8-OHdG levels
In order to determine the effect of ethnicity on 8-OHdG levels, Africans and Caucasians were
compared for each gender group. The median with 25%-75% confidence intervals, as well as
the spread (minimum and maximum values) for each parameter, is illustrated in Figures 6.5 and
6.6. Non-parametric comparisons between the groups were also made by using Mann-Whitney
U tests.
Median 25%-75% Min-Max
African Males Caucasian Males
ETHNIC
-20
0
20
40
60
80
100
120
8O
HdG
(ng/m
g c
reatin
ine)
Figure 6.5: Urinary 8-OHdG levels of African males (n=86) and Caucasian males (n=87). p < 0.001.
The urinary 8-OHdG levels in the African male group (n=86) ranged between 0.99 and 52.38
ng/mg creatinine and the median was found to be 13.07 ng/mg creatinine. In the Caucasian
male group (n=87), the median was 22.22 ng/mg creatinine and the 8-OHdG levels ranged
between 0.53 – 106.17 ng/mg creatinine. The median of the Caucasian male group was ~70%
higher than that of the African males. A p-value < 0.001 was obtained when these two groups

Results and discussion
76
were compared using the Mann Whitney U test. This signifies that there is a statistical
significant difference in urinary 8-OHdG levels in African and Caucasian males, with Caucasian
males excreting higher amounts of 8-OHdG.
Median 25%-75% Min-Max
African Fermales Caucasian Females
ETHNIC
-10
0
10
20
30
40
50
60
70
80
90
8O
Hd
G (
ng/m
g c
reatin
ine)
Figure 6.6: Urinary 8-OHdG levels of African females (n=84) and Caucasian females (n=96). p < 0.001.
In the African female group (n=84) the median was found to be 17.6 ng/mg creatinine. The
median in the Caucasian female group was found to be 24.95 ng/mg creatinine. Thus, the
median 8-OHdG value of the Caucasian females was ~42% higher than that of the African
females. The urinary 8-OHdG levels in the African female group and Caucasian female group
ranged between 0.27 – 56.63 ng/mg creatinine and 0.54 – 83.50 ng/mg creatinine, respectively.
A p-value < 0.001 indicates a statistically significant difference in urinary 8-OHdG levels
between African and Caucasian females.
In a study done by Huang et al., (2000), a difference in the urinary 8-OHdG levels between
African Americans and Caucasians was observed. A higher urinary 8-OHdG level was reported
in Caucasians compared to that of African Americans (p < 0.001). The data obtained in this
study also found higher 8-OHdG levels Caucasians than in Africans for both gender groups.
The 8-OHdG levels in Caucasian males (0.53 – 106.17 ng/mg creatinine) were significantly

Results and discussion
77
higher compared to African males (0.99 – 52.38 ng/mg creatinine). Caucasian females also had
higher urinary 8-OHdG levels (0.54 - 83.50 ng/mg creatinine) compared to African females (0.27
– 56.63 ng/mg creatinine). Thus, the results obtained in this study are consistent with the results
obtained by Huang et al., (2000).
6.3. The correlation between urinary 8-OHdG and serum ROS
levels
Serum ROS levels were measured using the method described in Section 3.3.4 and the results
are given in Appendix A. Spearman correlations were used to assess the possible correlation
between ROS and 8-OHdG levels measured in the SABPA participants. The data are depicted
in Figure 6.7.
ROS
8OHdG
Figure 6.7: Scatter plot of 8-OHdG vs. ROS levels measured in the SABPA participants. A Spearman
correlation coefficient indicated that no significant correlation exists between urinary 8-OHdG and serum
ROS levels (r = -0.045).
As can be seen from Figure 6.7, no significant correlation was found between serum ROS
levels and urinary 8-OHdG levels (r = -0.045). A correlation coefficient is bounded between -1

Results and discussion
78
and 1 where negative values indicate inverse relationships and positive values indicate direct
relationships. Values close to zero indicate a small or no relationship between the given
parameters while values close to 1 or -1 indicate a very strong relationship between
parameters. The small r-value indicates that these two markers are not related. However, in the
literature it is widely accepted that free radicals in an individual can damage DNA (Halliwell,
2000; Cooke et al., 2002). This damage to DNA gives rise to the biomarker 8-OHdG which is
excreted in the urine (Harri et al., 2007). However, the data obtained in this study are in contrast
to the literature. Since ROS causes damage not only to DNA, but also to proteins and lipids, it is
unclear which of these macromolecules will be damaged the most by ROS. Repair mechanisms
are also involved in the excision and repair of damaged DNA, resulting in 8-OHdG being
excreted in the urine. Thus, it makes sense that no strong correlation between serum ROS and
urinary 8-OHdG was observed in this study.
6.4. Discussion
In this study, urine and serum samples of the 409 participants from the SABPA project were
used to determine serum ROS levels and urinary 8-OHdG levels. These 409 participants
differed in ethnicity (Africans and Caucasians) and gender (males and females).
When urinary 8-OHdG levels from males and females were compared, no statistically
significant difference was found for both the African and Caucasian ethnicities. The data
obtained when males and females from both ethnicities were compared correlate with the
literature, where no statistical significant difference was observed in the urinary 8-OHdG levels
between males and females (Loft et al., 1992; Nakano et al., 2003; Lin et al., 2004). However,
when the urinary 8-OHdG levels in Africans and Caucasians were compared, a significant
difference was observed. African males had significantly lower urinary 8-OHdG levels than
Caucasian males (p < 0.001), and African females also had significantly lower urinary 8-OHdG
levels compared to Caucasian females (p < 0.001). This is consistent with the results obtained
in a study done by Huang et al., (2000). This difference between Africans and Caucasians could
be due to differences in genetic susceptibility, efficiency in detoxification and DNA repair or
environmental factors (Huang et al., 2000). As there are differences between human
populations, a polymorphism in the DNA repair mechanism in one geographic or ethnic group
could be less prevalent in another geographic or ethnic group. Differences in diet between
Caucasians and Africans could also contribute to the differences seen between these 2
ethnicities.

Results and discussion
79
No significant correlation between ROS and 8-OHdG levels was found in this study. However, in
the literature it is clear that increased free radicals, such as in cancer patients, will lead to higher
incidence of oxidative DNA damage, and consequently, to higher 8-OHdG levels (Olinski et al.,
2003; Mei et al., 2005; Kuo et al., 2007). However, certain factors could influence urinary 8-
OHdG levels. Increased oxidative damage to DNA could lead to increased excretion of DNA
base damage products, and decreased DNA repair activity could have lower excretion rates of
DNA base damage products (Wiseman & Halliwell, 1996). Thus, urinary 8-OHdG levels are
dependent on the rate of DNA damage in vivo and the efficacy of the DNA repair processes
(Chiou et al., 2003; Kuo et al., 2007). In theory, high ROS levels and impaired defence
mechanisms lead to oxidative damage, and the degree of the repair thereof leads to high or low
urinary levels of the DNA damaged lesion. If the repair mechanism is compromised in any way it
could influence the levels of excreted 8-OHdG. Therefore, a person with high urinary 8-OHdG
levels and low ROS levels could be indicative of efficient repair mechanisms, and a person with
low 8-OHdG levels and high ROS levels could indicate that repair mechanisms are impaired.
This could lead to the result obtained in Figure 6.7, where it was concluded that serum ROS
levels and urinary 8-OHdG does not correlate. Thus, it is recommended that in further studies,
the efficiency of repair mechanisms (responsible for the excision of 8-OHdG) should also be
investigated parallel to ROS and urinary 8-OHdG levels.

80
7.1. Introduction
A great need exists in the development of methods for measuring oxidative stress status in
humans. The reactivity of free radicals, however, is an immense drawback for use as an
indicator of oxidative stress status. Therefore, more accurate results could be obtained when
using biomarkers of oxidative damage instead. As there is uncertainty regarding which
biomarkers are the better options, it was decided to use 8-OHdG and DHN-MA, as makers of
oxidative damage. Thus, the aim of this study was to develop an analytical method to
successfully and reliably quantify urinary 8-OHdG and DHN-MA as an indicator of oxidative
stress status. As LC-MS/MS was available to this study, it was used as platform. The objectives
of this study were to first standardise and validate an LC-MS/MS method for the quantification of
urinary 8-OHdG and DHN-MA. Secondly, to quantify urinary 8-OHdG and DHN-MA levels in a
selected group of South African teachers, and lastly to determine whether a correlation could be
made between the urinary 8-OHdG and DHN-MA biomarkers of oxidative damage, and the
serum ROS levels.
The strategy presented in Section 2.4 was followed. After ethics approval for this study had
been obtained, 409 participants from the SABPA study (209 Caucasians, 101 males and 108
females and 200 Africans, 100 males and 100 females), were selected. Ten hour fasting,
baseline urine and serum samples were collected from the 409 SABPA participants for the
quantification of ROS, 8-OHdG and DHN-MA.
7.2. Optimisation of the 8-OHdG and DHN-MA assay
Before urinary 8-OHdG could be quantified, an assay needed to be optimised and validated on
the LC-MS/MS. After numerous trial and error efforts with regard to optimising the best
conditions for its quantification, an LC-MS/MS assay was developed for the quantification of
urinary 8-OHdG. The optimised 8-OHdG assay was validated with acceptable linearity (R2 >
0.99) and precision (intrabatch variation, RSD = 4.18% and interbatch variation, RSD =
17.37%). It was concluded that this optimised LC-MS/MS, 8-OHdG assay worked successfully
and reliably in the quantification of urinary 8-OHdG.
CHAPTER 7
Conclusion

Conclusion
81
Since a need exists in the Centre for Human Metabonomics at the North-West University, for
assays to successfully quantify biomarkers of oxidative damage, this goal was achieved.
However, this 8-OHdG assay is time-consuming as a sample cleanup step and long
chromatographic run are employed. Therefore, its use in research will offer great results but its
use for routine analyses should be limited, even though the assay works effectively.
For the optimisation of the DHN-MA assay, DHN-MA and its stable isotope needed to be
synthesised as it was not commercially available. This then needed to be quantified, but due to
the fact that synthesis could only be carried out on a small scale, it could not be quantified by
successfully weighing the synthesised samples. Therefore, the synthesised DHN-MA and its
isotope could only be relatively quantified. The synthesised, purified and relatively quantified
DHN-MA and DHN-MA-d3 were then used to determine whether the optimised 8-OHdG assay
performed effectively for the quantification of DHN-MA. The synthesised standards produced
good results with the optimised 8-OHdG assay. However, when urine samples were used,
problems were encountered. The DHN-MA could not be successfully and unequivocally
quantified during the chromatographic run. This was due to the 100% MeCN needed to elute
DHN-MA from the chromatographic column. During the time when DHN-MA elutes (± 18
minutes with 100% MeCN), there is no more chromatographic separation. Numerous non-polar
metabolites present in the urine sample then elute simultaneously with DHN-MA. It was also
observed that many metabolites in the urine sample have the same precursor and product ion
as was used with DHN-MA which leads to a decrease in specificity. Due to this, the optimised 8-
OHdG assay could not be duplicated for the quantification of DHN-MA as DHN-MA could not be
distinguished in the chromatogram from other co-eluting peaks, which makes the data obtained
very unreliable. Therefore, it was decided to separate the quantification of 8-OHdG and DHN-
MA. Different chromatographic columns (C8, C18 and normal phase silica columns) were then
considered, as well as differences in the pH ranges of the mobile phase (pH5, 6 and 7.48 of 1
mM Ammonium formate buffer). Still, DHN-MA only eluted with 100% MeCN which
consequently did not solve the problem of co-eluting peaks. Time was an issue, thus no more
strategies could be investigated.
7.3. The effect of ethnicity and gender on urinary 8-OHdG levels
and the correlation of 8-OHdG with serum ROS levels
The 8-OHdG data obtained were then compared in groups as follows: Caucasian males vs.
Caucasian females, African males vs. African females, Caucasian males vs. African males and

Conclusion
82
Caucasian females vs. African females. No significant difference in the urinary 8-OHdG levels in
Caucasian males (n=87) and females (n=96) was observed (p = 0.68) neither was any
significant difference in African males (n=86) and females (n=84) observed (p = 0.053). The
data obtained are consistent with the literature, which found no statistically significant difference
between males and females of both ethnicities. However, a significant difference was observed
when urinary 8-OHdG levels in African males (n=86) and Caucasian males (n=87) were
compared (p < 0.001), as well as Caucasian females (n=96) and African females (n=84) (p <
0.001). It was found that Caucasian males and Caucasian females excreted higher amounts of
8-OHdG in relation to African males and African females respectively. The difference seen in
the urinary 8-OHdG levels between African and Caucasian males and African and Caucasian
females was also obtained in another study (Huang et al., 2000) and thus these results are also
consistent with the literature.
Differences in the urinary 8-OHdG levels between Caucasian males and African males and
Caucasian females and African females could possibly be explained by differences in their
efficiency in detoxification and DNA repair or could be attributed by environmental factors. Since
oxidative stress has been implicated in diseases such as hypertension, inflammation, ageing,
autoimmunity, atherosclerosis, Parkinson’s disease, cancer and diabetes, the results obtained
in this study could contribute to an explanation why certain ethnicities have a predisposition to
developing a certain disease. However, insufficient information regarding urinary 8-OHdG is
available which was conducted in African and Caucasian males and females to draw sufficient
conclusions. Thus, there can only be speculated as to why a difference exists.
It is widely accepted that increased levels of free radicals, and in this case ROS, will lead to
higher incidence of oxidative DNA damage and consequently to higher urinary 8-OHdG levels.
However, this was not the case in this study; as no significant correlation could be made
between ROS and 8-OHdG levels it was concluded that ROS and 8-OHdG levels are not
related. It was concluded that different factors could have an influence on the urinary 8-OHdG
levels. Decreased DNA damage repair activity by base excision repair (BER) will lead to
decreased excretion rates of DNA base damage products. Sufficient repair activity of damaged
DNA will lead to increased levels of DNA base damage products. Therefore, it is believed that
the urinary 8-OHdG levels are dependent on the rate of DNA damage in vivo and the efficacy of
the repair processes. Thus, in theory, the BER mechanism can be considered the determining
factor of urinary 8-OHdG levels. Accordingly, a person with high urinary 8-OHdG levels and low
ROS levels could indicate efficient repair mechanisms, and a person with low 8-OHdG levels

Conclusion
83
and high ROS levels could indicate that repair mechanisms are impaired. This could explain
why no correlation could be made between ROS and 8-OHdG levels. Nevertheless, care should
be taken when commenting on urinary 8-OHdG levels as other contributing factors could
influence results.
7.4. Recommendations for further studies
i. 8-OHdG assay
The optimised 8-OHdG assay was successful in quantifying urinary 8-OHdG, but its use
for routine analysis is limited due to laborious and time consuming sample preparation.
However, this optimised 8-OHdG assay could be further refined to determine whether the
time needed for sample preparation and for chromatographic separation could be
reduced to such an extent that would make this assay more acceptable for use in routine
analysis.
ii. DHN-MA assay
It could be beneficial to determine the octanol: water partition coefficient of DHN-MA prior
to optimising and validating an assay for its quantification. As was seen in this study,
even though a metabolite is believed to act in a certain manner, it could react very
differently from what was first believed. This could help in deciding which sample clean-
up as well as chromatographic column and mobile phases would ultimately give the best
result for its successful quantification. If the octanol: water partition coefficient had been
determined for DHN-MA after its synthesis, it could have been established earlier that the
quantification of 8-OHdG and DHN-MA should be separated and consequently more time
could have been spent developing an LC-MS/MS assay for DHN-MA.
Seeing that DHN-MA and DHN-MA-d3 is not commercially available and they need to be
synthesised, it is recommended to begin the synthesis with higher amounts of 4-HNE-MA
and 4-HNE-MA-d3. Small quantities (1 mg) of 4-HNE-MA and 4-HNE-MA-d3 were used
to synthesise DHN-MA and DHN-MA-d3 in this study, mainly because a concern existed
that the synthesis might not work. However, it was established that the synthesis of DHN-
MA and DHN-MA-d3 from 4-HNE-MA and 4-HNE-MA-d3 worked very well. Thus, the
synthesis could be scaled up with larger quantities of 4-HNE-MA and 4-HNE-MA-d3
which could lead to more DHN-MA and DHN-MA-d3 being synthesised, which could then
be successfully weighed and thus successfully quantified.

Conclusion
84
iii. Studies including Caucasians and Africans
As only a few studies were conducted where oxidative DNA damage was determined in
Caucasian- and African-Americans, not sufficient information is available regarding
oxidative stress status in Africans and Caucasians. Thus, a need exists for more studies
to be conducted in Caucasians and Africans, where oxidative stress status is assessed.
iv. ROS assay, repair mechanism, and gene knock-out experiments
A possibility exists that the ROS assay used in this study is not as reliable as was first
believed, which could explain why no correlation was found between the 8-OHdG and
ROS levels. Thus, an improved assay could be used to quantify serum ROS levels.
As ROS and 8-OHdG levels does not correlate as was first suggested, it was concluded
that other factors could influence the results obtained. One very important contributing
factor was overlooked in the design of this study. This contributing factor is assumed to
be the repair mechanism responsible for defending the integrity of the genome, by
removing the oxidative damaged DNA ribonucleosides. However, the precise repair
mechanism responsible for the excision of 8-OHdG remains elusive. Therefore, the use
of gene knock-out experiments could be used to help clarify the repair mechanism/s
responsible for excising 8-OHdG.
7.5. Conclusion
As DHN-MA could not be unequivocally quantified in urine, a different assay needed to
be optimised and validated for its quantification. However, time was an issue and no
more time could be spent on developing a different assay for the quantification of DHN-
MA. Nonetheless, an LC-MS/MS assay was developed for the successful quantification
of urinary 8-OHdG. The urinary 8-OHdG levels of the 409 SABPA participants were then
quantified. This data obtained from the 8-OHdG assay were then correlated with the ROS
levels. Thus, the aim and objectives of this study were partially reached.

85
ALARY, J., BRAVAIS, F., CRAVEDI, J.P., DEBRAUWER, L., RAO, D., & BORIES, G. 1995.
Mercapturic acid conjugates as urinary end metabolites of the lipid peroxidation product 4-hydroxy-2-
nonenal in the rat. Chemical Research in Toxicology, 8 (1): 34-39 p.
ALARY, J., DEBRAUWER, L., FERNANDEZ, Y., CRAVEDI, J.P., RAO, D., & BORIES, G. 1998. 1,4-
dihydroxynonene mercapturic acid, the major end metabolite of exogenous 4-hydroxy-2-nonenal, is a
physiological component of rat and human urine. Chemical Research in Toxicology, 11 (2): 130-135 p.
ALARY, J., GUERAUD, F., & CRAVEDI, J.P. 2003. Fate of 4-hydroxynonenal in vivo: disposition and
metabolic pathways. Molecular Aspects of Medicine, 24: 177-187 p.
ALTIERI, F., GRILLO, C., MACERONI, M., CHICHIARELLI, S. 2008. DNA damage and repair from
molecular mechanisms to health implications. Antioxidants and Redox Signalling, 10: 891-937 p.
ANON. 2005. Agilent mass hunter software. Quick start guide. Agilent Technologies, Inc. USA,
September.
ANON. 2009. Agilent mass hunter software. Quick start guide. Agilent Technologies, Inc. USA,
December.
ARUOMA, O.I. 1998. Free radicals, oxidative stress and antioxidants in human health and disease.
Journal of the American’s oil Chemists Society, 75 (2): 199-212 p.
BARTOSZ, G. 2009. Reactive oxygen species: Destroyers or messengers? Biochemical
Pharmacology, 77 (8): 1303-1315 p.
BAYNES, J.W. 1991. Role of oxidative stress in development of complications in diabetes. Diabetes,
40: 405-412 p.
BLUMBERG, J. 2004. Use of biomarkers of oxidative stress in research studies. Journal of Nutrition,
134: 3188-3189 p.
BRATIC, I & TRIFUNOVIC, A. 2010. Review: Mitochondrial energy metabolism and ageing. Biochimica
et Biophysica Acta, 1797 (6-7): 961-967 p.
REFERENCES

References
86
BREEN, A.P., & MURPHY, J.A. 1995. Reactions of oxyl radicals with DNA. Free Radical Biology &
Medicine, 18: 1033-1077 p.
BRUNNER, E., DETTE, H., & MUNK, A. 1997. Box-type approximations in nonparametric factorial
designs. Journal of the American Statistical Association, 92: 1494 – 1502 p.
BURROWS, C.J. & MULLER, J.G. 1998. Oxidative nucleobase modifications leading to strand scission.
Chemical Reviews, 98: 1109-1151 p.
CADET, J., DOUKI, T., & RAVANAT, J.L. 1997. Artifacts associated with the measurement of oxidized
DNA bases. Environmental Health Perspectives, 105: 1034-1039 p.
CATHCART, R., SCHWIERS, E., SAUL, R.L., & AMES. B.N. 1984. Thymine glycol and thymidine
glycol in human and rat urine: a possible assay for oxidative DNA damage. Proceedings of the National
Academy of Sciences, 81 (18): 5633-5637 p.
CHAO, M., YEN, C., & HU, C. 2008. Prevention of artifactual oxidation in determination of cellular 8-
oxo-7,8-2‟-deoxyguanosine by isotope-dilution LC-MS/MS with automated solid-phase extraction. Free
Radical Biology & Medicine, 44: 464-473 p.
CHIOU, C., CHANG, P., CHAN, E., WU, T., TSAO, K-C., & WU, J.T. 2003. Urinary 8-hydroxyguanosine
and its analogs as DNA marker of oxidative stress: development of an ELISA and measurement in both
bladder and prostate cancers. Clinica Chimica Acta, 334: 87-94 p.
COLLINS, A.R., CADET, J., MOLLER, L., POULSEN, H.E., & VINA, J. 2004. Are we sure we know how
to measure 8-oxo-7,8-dihydroxyguanine in DNA from human cells? Archives of Biochemistry and
Biophysics, 423: 57-65 p.
COOKE, M.S., LUNEC, J., & EVANS, M.D. 2002. Progress in the analysis of urinary oxidative DNA
damage. Free Radical Biology & Medicine, 33 (12): 1601-1614 p.
COOKE, M.S., EVANS, M.D., DIZDAROGU, M., & LUNEC, J. 2003. Oxidative DNA damage:
mechanisms, mutation & disease. The FASEB Journal, 17: 1195-1214 p.
COOKE, M.S., OLINSKI, R., LOFT, S., European Standards Committee on Urinary (DNA) Lesion
Analysis. 2008. Measurement and meaning of oxidatively modified DNA lesions in urine. Cancer
Epidemiology Biomarkers and Prevention, 17: 3-14p.

References
87
COOKE, M.S. 2009. A commentary on “Urea, the most abundant component in urine, cross-reacts with
a commercial 8-OHdG ELISA kit and contributes to overestimation of urinary 8-OHdG”. What is ELISA
detecting? Free Radical Biology & Medicine, 47 (1): 41- 46 p.
COTGREAVE, I.A., & GERDES, R.G. 1998. Recent trends in glutathione biochemistry. Glutathione-
protein interactions: A molecular link between oxidative stress and cell proliferation. Biochemical and
Biophysical Research Communications, 242 (1): 1-9 p.
CRAYFORD, J.V., & HUTSON, D.H. 1980. Comperative metabolism of Phenobarbital in the rat (cfe)
and in the mouse (cf1). Food and Cosmetics Toxicology, 18: 503-509 p.
DAKNA, M., HE, Z., YU, W.C., MISCHAK, H., & KOLCH, W. 2009. Review: Technical, bioinformatical
and statistical aspects of liquid-chromatography-mass spectrometry (LC-MS) and capillary
electrophoresis-mass spectrometry (CE-MS) based clinical proteomics: A critical assessment. Journal of
Chromatography B, 877 (13): 1250-1258 p.
DALLE-DONNE, I., ROSSI, R., COLOMBO, R., GIUSTARINI, D., & MILZANI, A. 2006. Biomarkers of
oxidative damage in human disease. Clinical Chemistry, 52 (4): 601-623 p.
De CHAMPLAIN, J., WU, R., GIROUARD, H., KARAS, M., El MIDAOUI, A., LAPLANTE, M.A., & WU, L.
2004. Oxidative stress in hypertension. Clinical and Experimental Hypertension, 26 (7-8): 593-601 p.
DRAPER, H.H., CSALLANY, A.S., & HADLEY, M. 2000. Urinary aldehydes as indicators of lipid
peroxidation in vivo. Free Radical Biology & Medicine, 29 (11): 1071-1077 p.
DUCHEN, M.R. 2004. Mitochondria in health and disease: perspectives on a new mitochondrial
biology. Molecular Aspects of Medicine, 25 (6): 365-451 p.
ESTERBAUER, H., SCHAUR, R.J., & ZOLLNER, H. 1991. Chemistry and biochemistry of 4-
hydroxynonenal, malonaldehyde and related aldehydes. Free Radical Biology & Medicine, 11: 81-128 p.
EVANS, M.D., SAPARBAEV, M., & COOKE, M.S. 2010. DNA repair and the origins of urinary oxidized
2‟-deoxyribonucleosides. Mutagenesis, 25: 433-442p.
FAURE, H., MOSSEAU, M., CADET, J., GUIMIER, C., TRIPIER, M., HIDA, H., & FAVIER, A. 1998.
Urine 8-oxo-7,8-dihydroxyguanosine vs. 5-(hydroxymethyl) uracil as DNA oxidation marker in
adriamycin-treated patients. Free Radical Research, 28 (4): 377-382 p.

References
88
FERDINANDUSSE, S., MEISSNER, T., WANDERS, R.J., MAYATEPEK, E. 2002. Identification of the
peroxisomal beta-oxidation enzymes involved in the degradation of leuko-trienes. Biochemical and
Biophysical Research Communications, 293: 269-273 p.
FIDALEO, M. 2009. Peroxisomes and peroxisomal disorders: The main facts. Experimental and
Toxicology Pathology, doi: 10.1016/j.etp.2009.08.008.
GRAM, T.E., & GILETTE, J.R. 1971. Biotransformation of drugs. Fundamentals of Biochemical
Pharmacology, Pergamon press Ltd. New York: 571-609p.
GRIFFITHS, H.R., MOLLER, L., BARTOSZ, G., BAST, A., BERTONI-FREDDARI, C., COLLINS, A.,
COOKE, M., COOLEN, S., HAENEN, G., HOBERG, A., LOFT, S., LUNEC, J., OLINSKI, R., PARRY, J.,
POMPELLA, A., POULSEN, H., VERHAGEN, H., & ASTLEY, S.B. 2002. Biomarkers. Molecular
Aspects of Medicine, 23: 101-208 p.
GUéRAUD, F., PEIRO, G., BERNARD, H., ALARY, J., CRéMINON, C., DEBRAUWER, L.,
RATHAHAO, E., DRUMARE, M.F., CANLET, C., WAL, J.M., & BORIES, G. 2006. Enzyme
immunoassay for a urinary metabolite of 4-hydroxynonenal as a marker of lipid peroxidation. Free
Radical Biology & Medicine, 40: 54-62 p.
HABIG, W.H., PABST, M.J., & JAKOBY, W.B. 1974. Glutathione-s-transferase. The first enzymatic step
in mercapturic acid formation. Journal of Biological Chemistry, 249 (22): 7130-7139 p.
HALLIWELL, B., & GUTTERIDGE, J.M. 1990. Role of free radicals and catalytic metal ions in human
disease: an overview. Methods in Enzymology, 186: 1-85 p.
HALLIWELL, B. 1991. Reactive oxygen species in living systems: source, biochemistry, and role in
human disease. American Journal of Medicine, 91: 14-22 p.
HALLIWELL, B. 2000. Why and how should we measure oxidative DNA damage in nutritional studies?
How far have we come? American Journal of Clinical Nutrition, 72 (5): 1082-1087 p.
HALLIWELL, B & WHITEMAN, M. 2004. Measuring reactive species and oxidative damage in vivo and
in cell culture: how should you do it and what do the results mean? British Journal of Pharmacology, 142
(2): 231-255 p.

References
89
HARRI, M., KASAI, H., MORI, T., TORNAEUS, J., SAVELA, K., & PELTONEN, K. 2007. Analysis of 8-
hydroxy-2‟-deoxy-guanosine in urine using high-performance liquid chromatography-electrospray
tandem mass spectrometry. Journal of Chromatography B, 853: 242-2467 p.
HATEFI, Y. 1985. The mitochondrial electron transport and oxidative phosphorylation system. Annual
Review of Biochemistry, 54: 1015-1069p.
HAYASHI, I., MORISHITA, Y., IMAI, K., NAKAMURA, M., NAKACHI, K & HAYASHI, T. 2007. High-
throughput spectrophotometric assay of reactive oxygen species in serum. Mutation Research, 631: 55-
61 p.
HU, C.W., WU, M.T., CHAO, M.R., PAN, C.H., WANG, C.J., SWENBERG, J.A., & WU, K.Y. 2004.
Comparison of analyses of urinary 8-hydroxy-2'-deoxyguanosine by isotope-dilution liquid
chromatography with electrospray tandem mass spectrometry and by enzyme-linked immunosorbent
assay. Rapid Communications in Mass Spectrometry, 18: 505-510 p.
HUANG, H., HELZLSOUER, K.J., & APPEL, L.J. 2000. The effects of vitamin C and vitamin E on
oxidative DNA damage: results from a randomized controlled trial. Cancer Epidemiology, Biomarkers &
Prevention, 9 (7): 647-652 p.
JACKSON, A.L., & LOEB, L.A. 2001. The contribution of endogenous sources of DNA damage to the
multiple mutations in cancer. Mutation Research, 477: 7-21 p.
JENNER, P., & OLANOW, C.W. 1996. Oxidative stress and the pathogenesis of Parkinson‟s disease.
Neurology, 47: 161-170 p.
JOHANNSEN, D.L., & RAVUSSIN, E. 2009. The role of mitochondria in health and disease. Current
Opinion in Pharmacology, 9 (6): 780-786 p.
KAPLOWITZ, N. 1981. The importance and regulation of hepatic glutathione. The Yale Journal of
Biology and Medicine, 54: 497-502 p.
KARIHTALA, P., & SOINI, Y. 2007. Reactive oxygen species and antioxidant mechanisms in human
tissues and their relation to malignancies. Acta Pathologica, Microbiologica et. Immunologica
Scandinavica (Apmis), 115: 81-103 p.
KAWAI, K., LI, Y.S., & KASAI, H. 2007. Accurate measurement of 8-OHdG and 8-OH-Gua in mouse
DNA, urine and serum: effects of x-ray irradiation. Genes and Environment, 29 (3):107-114 p.
References
90
KOWALTOWSKI, A.J., De SOUZA-PINTO, N.C., CASTILHO, R.F., & VERCESI, A.E. 2009. Review
article: Mitochondria and reactive oxygen species. Free Radical Biology and Medicine, 47: 333-343 p.
KUIPER, H.C., MIRANDA, C.L., SOWELL, J.D., & STEVENS, J.F. 2008. Mercapturic acid conjugates
of 4-hydroxy-2-nonenal and 4-oxo-2-nonenal metabolites are in vivo markers of oxidative stress. The
Journal of Biological Chemistry, 283 (25): 17131-17138 p.
KUO, H., CHOU, S., HU, T., WU, F., & CHEN, D. 2007. Urinary 8-hydroxy-2‟-deoxyguanosine (8-
OHdG) and genetic polymorphisms in breast cancer patients. Mutation Research, 631: 62-68 p.
LANG, J., CELOTTO, C., & ESTERBAUER, H. 1985. Quantitative determination of the lipid
peroxidation product 4-hydroxynonenal by high-performance liquid chromatography. Analytical
Biochemistry, 150 (2): 369-378 p.
LECOUTEUR, D.G., MULLER, M., & YANG, M.C. 2002. Age-environment and gene-environment
interactions in the pathogenesis of Parkinson‟s disease. Reviews on Environmental Health, 17 (1): 51-64
p.
LENAZ, G. 1998. Role of mitochondria in oxidative stress and ageing. Biochimica et Biophysica Acta.,
1366: 53-67 p.
LIN, H., JENNER, A.M., ONG, C.N., HUANG, S.H., WHITEMAN, M., & HALLIWELL, B. 2004. A high-
throughput and sensitive methodology for the quantification of urinary 8-hydroxy-2‟-deoxy-guanosine:
measurement with gas chromatography-mass spectrometry after single solid-phase extraction.
Biochemistry Journal, 380: 541-548 p.
LISKA, D. 1998. The detoxification enzyme system. Alternative Medicine Review, 3 (3): 187 -198 p.
LISKA, D., LYON, M., & JONES, D.S. 2006. Detoxification and bio transformational imbalances.
Explore, 2 (2): 122-140 p.
LOFT, S., VISTISEN, K., EWERTZ, M., TJONNELAND, A., OVERVAD, K., & POULSEN, E. 1992.
Oxidative DNA damage estimated by 8-hydroxydeoxyguanosine excretion in humans: influence of
smoking, gender, and body mass index. Carcinogenesis, 13 (12): 2241-2247 p.
References
91
LOFT, S., SVOBODA, P., KASAI, H., TJONNELAND, A., VOGEL, U., MOLLER, P., OVERVAD, K., &
RAASCHOU-NIELSEN, O. 2006. Prospective study of 8-oxo-7,8-dihydro-2‟-deoxy-guanosine excretion
and the risk of lung cancer. Carcinogenesis, 27 (6): 1245 -1250 p.
LU, S.C. 2009. Regulation of glutathione synthesis. Molecular Aspects of Medicine, 30 (1-2): 42-59 p.
MA, H., WANG, J., ABDEL-RAHMAN, S.Z., BOOR, P.J., & KHAN, M.F. 2008. Oxidative DNA damage
and its repair in rat spleen following subchronic exposure to aniline. Toxicology and Applied
Pharmacology, 233: 247-253 p.
MARITIM, A.C., SANDERS, R.A., & WATKINS, J.B. III. 2003. Diabetes, oxidative stress and
antioxidants: A review. Journal of Biochemical Molecular Toxicology, 17 (1): 24-38 p.
MEI, S., YAO, Q., WU, C., & XU, G. 2005. Determination of urinary 8-hydroxy-2‟-deoxy-guanosine by
two approaches- capillary electrophoresis and GC/MS: An assay for in vivo oxidative DNA damage in
cancer patients. Journal of Chromatography B, 827 (1): 83-87 p.
NAKANO, M., KAWANISHI, Y., KAMOHARA, S., UCHIDA, Y., SHIOTA, M., INATOMI, Y., KOMORI, T.,
MIYAZAWA, K., GONDO, K., & YAMASAWA, I. 2003. Oxidative DNA damage (8-
hydroxydeoxyguanosine) and body iron status: A study on 2507 healthy people. Free Radical Biology &
Medicine, 35 (7): 826-832 p.
NOHL, H., GILLE, L., & STANIEK, K. 2005. Intracellular generation of reactive oxygen species by
mitochondria. Biochemical Pharmacology, 69 (5): 719-723 p.
NORRPA, H. 2004. Cytogenic biomarkers and genetic polymorphisms. Toxicology Letters, 149 (1-3):
309-334 p.
OLINSKI, R., GACKOWKI, D., ROZALSKI, R., FOKSINSKI, M., & BIALKOWSKI, K. 2003. Oxidative
DNA damage in cancer patients: a cause or a consequence of the disease develoment. Mutation
Research, 531 (1-2): 177-190 p.
PEIRO, G., ALARY, J., CRAVEDI, J.P., RATHAHOA, E., STEGHENS, J.P., & GUERAUD, F. 2005.
Dihydroxynonene mercapturic acid, a urinary metabolite of 4-hydroxynonenal, as a biomarker of lipid
peroxidation. BioFactors, 24: 89-96 p.
PEOPLES, M.C., & KARNES, H.T. 2005. Recent developments in analytical methodology for 8-
hydroxy-2‟-deoxy-guanosine and related compounds. Journal of Chromatography B, 827 (1): 5-15 p.

References
92
PERCIVAL, M. 1997. Phytonutrients and detoxification. Clinical Nutrition Insights, 5 (2): 1-4 p.
PETERS, F.T., DRUMMER, O.H., & MUSSHOFF, F. 2007. Validation of new methods. Forensic
Science International, 165: 216-224 p.
PILGER, A., IVANCSITS, S., GERMADNIK, D., & RUDIGER, H.W. 2002. Urinary excretion of 8-
hydroxy-2‟-deoxyguanosine measured by high-performance liquid chromatography with electrochemical
detection. Journal of Chromatography B, 778: 393-401 p.
PODMORE, I.D., COOPER, D., EVANS, M.D., WOOD, M., & LUNEC, J. 2000. Simultaneous
measurement of 8-oxo-2‟-deoxyguanosine and 8-oxo-2‟-deoxyadenosine by HPLC-MS/MS. Biochemical
and Biophysical Research Communications, 277: 764-770 p.
PRYOR, W.A., & GODBER, S.S. 1991. Non-invasive measures for oxidative stress status in humans.
Free Radical Biology and Medicine, 10: 177-184 p.
RATHAHAO, E., PEIRO, G., MARTINS, N., ALARY, J., GUERAUD, F., & DEBRAUWER, L. 2005.
Liquid chromatography-multistage tandem mass spectrometry for the quantification of dihydroxynonene
mercapturic acid (DHN-MA), a urinary end-metabolite of 4-hydroxynonenal. Analytical and Bioanalytical
Chemistry, 381: 1532-1539 p.
RENNER, T., FECHNER, T., & SCHERER, G. 2000. Fast quantification of the urinary marker of
oxidative stress 8-hydroxy-2-„-deoxyguanosine using solid-phase extraction and high-performance liquid
chromatography with triple-stage quadrupole mass detection. Journal of Chromatography B, 738: 311-
317 p.
ROSEN, G.M., POU, S., RAMOS, C.L., COHEN, M.S., & BRITIGAN, B.F. 1995. Free radicals and
phagocytic cells. The Faseb Journal, 9: 200-209 p.
SCHRADER, M., & FAHIMI, H.D. 2006. Peroxisomes and oxidative stress. Biochimica et Biophysica
Acta, 1763 (12): 1755-1766 p.
SIMIC, M.G. 1994. DNA markers of oxidative processes in vivo: Relevance to carcinogenesis and
anticarcinogenesis. Cancer Research, 54: 1918-1923 p.

References
93
SINGAL, P.K., PETKAU, A., GERRARD, J.M., HRUSHOVETZ, S., & FOERSTER, J. 1988. Free
radicals in health and disease. Molecular and Cellular Biochemistry, 84: 121-122 p.
SINGH, P.P., MAHADI, F., ROY, A., & SHARMA, P. 2009. Reactive oxygen species, reactive nitrogen
species and antioxidants in etiopathogenesis of diabetes mellitus type-2. Indian Journal of Clinical
Biochemistry, 24 (4): 324-342 p.
SONG, M. LI, Y., OOTSUYAMA, Y., KASAI, H., KAWAI, K., OHTA, M., EGUCHI, Y., YAMATO, H.,
MATSUMOTO, Y., YOSHIDA, R., & OGAWA, Y. 2009. Urea, the most abundant component in urine,
cross-reacts with a commercial 8-OHdG ELISA kit and contributes to overestimation of urinary 8-OHdG.
Free Radical Biology and Medicine, 47 (1): 41-46 p.
SPIES-MARTIN, D., SOMMERBURG, O., LANGHANS, C.D., & LEICHSENRING, M. 2002.
Measurement of 4-hydroxynonenal in small volume blood plasma samples: modification of gas
chromatographic-mass spectrometric method for clinical settings. Journal of Chromatography B, 774:
231-239 p.
SRIVASTAVA, S., DIXIT, B.L., CAI, J., SHARMA, S., HURST, H.E., BHATNAGAR, A., & SRIVASTAVA,
S.K. 2000. Metabolism of lipid peroxidation product, 4-hydroxynonenal (HNE) in rat erythrocytes: role of
aldose reductase. Free Radical Biology and Medicine, 29 (7): 642-651 p.
ST-PIERRE, J., BUCKINGHAM, J.A., ROEBUCK, S.J., & BRAND, M.D. 2002. Topology of superoxide
production from different sites in the mitochondrial electron transport chain. Journal of Biological
Chemistry, 277 (47): 44784 – 44790 p.
SUBRAMANI, S., KOLLER, A., & SNYDER, W.B. 2000. Import of peroxisomal matrix and membrane
proteins. Annual Review of Biochemistry, 69: 399-418 p.
TUKEY, J.W. 1977. Exploratory data analysis. Reading, MA: Addison-Wesley Publishing Co., 44.
TURRENS, J.F. 2003. Topical Review: Mitochondrial formation of reactive oxygen species. Journal of
Physiology, 533 (2): 335-344 p.
UCHIDA, K. 2003. Review: 4-hydroxy-2-nonenal: a product and mediator of oxidative stress. Progress
in Lipid Research, 1-26 p.
VANDER, A.J., SHERMAN, J.H., LUCIANO, D.S. 1994. Nonimmune metabolism of foreign chemicals.
Human Physiology the Mechanisms of Body Function, 738-740 p.

References
94
VAN DEN BOSCH, SCHUTGENS, R.B., WANDERS, R.J., & TAGER, J.M. 1992. Biochemistry of
peroxisomes. Annual Review of Biochemistry, 61: 157-197 p.
VEDEL, F., LALANNE, E., SABAR, M., CHETRIT, P., & De PAEPE, R. 1999. The mitochondrial
respiratory chain and ATP synthase complexes: Composition, structure and mutational studies. Plant
Physiology and Biochemistry, 37 (9): 629-643p.
Vӧ LKEL, W., ALVAREZ-SANCHEZ, R., WEICK, I., MALLY, A., DEKANT, W., & Pӓ HLER, A. 2005.
Glutathione conjugates of 4-hydroxy-2(E)-nonenal as biomarkers of hepatic oxidative stress-induced lipid
peroxidation in rats. Free Radical Biology & Medicine, 38: 1526-1536 p.
WEIMANN, A., BELLING, D., & POULSEN, H.E. 2001. Measurement of 8-oxo-2‟-deoxyguanosine in
DNA and human urine by high performance liquid chromatography-electrospray tandem mass
spectrometry. Free Radical Biology and Medicine, 30 (7): 757-764 p.
WEISIGER, R.A., & FRIDOVICH, I. 1973. Superoxide dismutase: organelle specificity. Journal of
Biological Chemistry, 248: 3582-3592p.
WILSON, R., LYALL, K., SMYTH, L., FERNIE, C.E., & RIEMERSMA, R.A. 2002. Dietary hydroxy fatty
acids are absorbed in humans: implications for the measurement of oxidative stress in vivo. Free Radical
Biology & Medicine, 32 (2): 162-168 p.
WISEMAN, H., & HALLIWELL, B. 1996. Damage to DNA by reactive oxygen and nitrogen species: role
in inflammatory disease and progression to cancer. Biochemistry Journal, 313: 17-29 p.
WITZUM, J & STEINBERG, D. 1991. Role of oxidized low-density lipoprotein in atherogenesis. The
Journal of Clinical Investigation, 88: 1785-1792 p.
ZAMEK-GLISZCZYNSKI, M.J., HOFFMASTER, K.A., NEZASA, K., TALLMAN, M.N., & BROUWER,
K.L.R. 2006. Integration of hepatic drug transporters and phase II metabolizing enzymes: Mechanisms
of hepatic excretion of sulphate, glucuronide and glutathione metabolites. European Journal of
Pharmaceutical Sciences, 27: 447-486 p.

95
Table A1: Raw data of the 409 SABPA participants
SABPA participant Ethnicity Gender
Creatinine (mmol/L)
8-OHdG (ng/mg creatinine)
ROS (Units)
1 African Female 14.18 32.2 75
2 African Female 10.41 10.9 84
3 African Male 2.51 11.8 99
4 African Female 12.27 15.6 71
5 African Male 5.41 11.2 79
6 African Female 2.83 7.7 150
7 African Male 6.29 10.2 90
8 African Female 11.51 *196.5 142
9 African Female 20.70 21.5 76
10 African Female 5.86 38.8 106
11 African Male 17.41 n.d. 93
12 African Female 12.27 24.4 157
13 African Female 4.17 21.0 115
14 African Female 6.72 7.1 85
15 African Female 14.12 7.3 115
16 African Female 6.52 2.2 129
17 African Male 15.04 15.6 69
18 African Male 20.43 23.1 85
19 African Female 3.72 12.8 132
20 African Female 4.87 6.5 n.d.
21 African Female 3.12 14.4 149
22 African Male 6.23 10.7 n.d
23 African Female 20.01 17.2 108
24 African Male 28.53 24.3 104
25 African Male 7.53 15.2 83
26 African Female 6.88 3.0 118
27 African Male 13.88 20.1 126
28 African Male 10.08 3.1 85
29 African Female 12.87 14.9 112
30 African Male 9.85 *65.5 108
31 African Female 21.13 32.2 129
32 African Female 20.98 56.5 90
33 African Male 5.37 13.8 69
34 African Female 11.96 32.0 92
35 African Female 13.04 7.5 109
36 African Female 2.56 19.3 97
37 African Female 3.13 8.0 104
38 African Female 9.32 29.4 54
39 African Female 2.34 37.6 110
40 African Female 7.03 10.8 96
41 African Male 6.33 3.1 65
42 African Male 11.04 13.0 115
43 African Female 14.92 34.5 101
44 African Female 7.52 12.9 136
45 African Male 11.54 8.5 89
46 African Female 17.64 29.3 92
47 African Female 12.48 42.1 114
APPENDIX A

Appendix A
96
48 African Female 3.61 1.4 122
49 African Male 6.39 12.6 91
50 African Female 13.66 10.4 93
51 African Female 6.58 15.6 112
52 African Female 19.74 29.1 104
53 African Female 4.31 3.8 116
54 African Female 10.37 11.7 74
55 African Female 4.59 30.9 135
56 African Male 19.38 27.1 78
57 African Male 10.00 6.2 99
58 African Female 4.12 6.0 99
59 African Female 8.00 21.8 102
60 African Male 8.79 6.0 89
61 African Female 14.22 5.7 80
62 African Male 17.96 12.5 73
63 African Male 6.04 43.9 113
64 African Female 12.32 17.9 90
65 African Female 2.26 14.2 119
66 African Male 7.39 15.6 80
67 African Male 8.42 16.6 56
68 African Female 12.50 20.4 128
69 African Male 6.18 8.1 49
70 African Male 12.01 *57.5 41
71 African Female 3.18 3.8 57
72 African Female 12.07 1.0 80
73 African Female 6.66 20.4 135
74 African Female 9.64 21.5 132
75 African Female 8.15 14.3 70
76 African Female 20.37 22.8 98
77 African Female 27.10 31.7 158
78 African Female 7.59 4.9 107
79 African Female 5.42 3.0 111
80 African Female 9.81 5.3 103
81 African Female 3.76 56.0 72
82 African Male 13.06 13.9 63
83 African Female 5.10 26.9 123
84 African Female 1.38 19.9 84
85 African Female 14.57 *75.9 67
86 African Male 7.45 17.6 92
87 African Female 3.91 43.9 124
88 African Female 7.36 26.2 107
89 African Male 6.46 2.1 76
90 African Male 12.03 12.1 91
91 African Male 5.06 17.9 92
92 African Male 7.16 22.9 85
93 African Male 12.03 3.5 102
94 African Male 7.73 1.5 99
95 African Male 7.73 28.1 65
96 African Male 12.23 14.8 103
97 African Male 5.07 3.0 87
98 African Male 11.70 5.3 96
99 African Male 17.09 17.9 113
100 African Male 14.24 12.7 89
101 African Male 8.89 *234.6 109
102 African Male 2.45 19.7 96

Appendix A
97
103 African Male 8.01 29.7 57
104 African Male 9.15 38.9 76
105 African Male 8.83 10.1 60
106 African Male 10.54 *120.1 96
107 African Male 8.20 14.6 71
108 African Female 2.90 26.0 88
109 African Female 4.33 24.5 81
110 African Female 7.60 *82.4 112
111 African Female 16.97 35.6 179
112 African Male 7.92 25.5 46
113 African Female 13.11 18.1 105
114 African Female 7.56 23.7 87
115 African Female 10.49 *82.4 109
116 African Female 17.80 56.6 97
117 African Female 4.35 *79.3 157
118 African Female 6.03 39.3 116
119 African Female 4.79 *97.4 66
120 African Female 4.90 6.6 n.d.
121 African Female 4.15 9.6 191
122 African Female 11.19 36.0 139
123 African Female 16.19 *80.9 114
124 African Male 9.00 16.7 86
125 African Male 8.45 7.6 108
126 African Male 3.42 8.5 101
127 African Male 10.31 14.0 89
128 African Female 9.83 *68.1 147
129 African Male 5.34 12.3 92
130 African Male 6.00 24.5 109
131 African Male 6.96 *62.9 81
132 African Male 11.75 15.4 93
133 African Male 9.45 32.0 84
134 African Male 6.51 8.5 83
135 African Male 31.42 45.8 109
136 African Male 10.00 6.0 88
137 African Female 10.98 31.9 126
138 African Female 9.67 36.1 93
139 African Male 19.90 7.1 84
140 African Female 19.71 0.5 98
141 African Female 9.46 n.d. 112
142 African Male 5.85 36.4 91
143 African Male 6.92 13.5 123
144 African Male 9.42 19.3 58
145 African Male 20.15 1.5 97
146 African Female 9.82 *168.5 113
147 African Female 7.56 19.2 103
148 African Female 7.47 11.5 86
149 African Male 9.82 13.6 81
150 African Male 16.50 *52.9 97
151 African Male 4.70 14.0 102
152 African Female 8.37 15.0 190
153 African Male 28.77 18.9 74
154 African Male 17.51 *101.4 81
155 African Male 11.24 34.0 69
156 African Male 8.58 10.6 72
157 African Male 9.74 11.7 127

Appendix A
98
158 African Female 3.98 36.7 n.d.
159 African Female 5.73 11.2 109
160 African Female 3.28 19.7 63
161 African Female 7.79 n.d. 111
162 African Female 16.43 30.3 128
163 African Male 5.18 n.d. 60
164 African Female 6.54 5.4 111
165 African Male 5.11 13.3 90
166 African Male 7.99 4.4 74
167 African Male 6.60 7.5 105
168 African Male 9.32 *56.1 78
169 African Male 5.98 *52.9 53
170 African Female 10.68 4.7 145
171 African Female 12.09 2.8 129
172 African Male 12.03 7.0 61
173 African Male 0.98 13.7 65
174 African Male 7.55 2.6 85
175 African Male 12.38 1.3 77
176 African Male 8.04 22.1 45
177 African Male 21.08 *286.7 69
178 African Female 11.52 0.5 115
179 African Male 3.66 52.3 82
180 African Female 1.88 n.d. 77
181 African Female 2.85 3.5 117
182 African Female 2.55 9.0 58
183 African Male 7.74 5.8 57
184 African Male 6.45 5.8 107
185 African Male 5.78 6.1 100
186 African Female 13.80 29.8 84
187 African Male 9.61 12.3 84
188 African Female 4.99 24.7 62
189 African Female 5.16 *81.3 94
190 African Female 11.29 n.d. 101
191 African Male 20.63 n.d. 94
192 African Male 14.23 38.3 51
193 African Male 9.27 10.2 80
194 African Male 16.18 14.9 65
195 African Male 12.73 15.4 74
196 African Male 10.83 4.2 77
197 African Male 5.78 11.2 115
198 African Male 5.57 *61.3 69
199 African Male 28.76 10.7 70
200 African Male 29.32 28.4 63
201 Caucasian Female n.d. n.d. n.d.
202 Caucasian Male 18.24 10.2 67
203 Caucasian Male 9.20 13.2 65
204 Caucasian Female 3.86 20.2 100
205 Caucasian Female 8.09 12.0 106
206 Caucasian Male 8.42 24.5 55
207 Caucasian Male 16.89 13.2 45
208 Caucasian Male 9.32 48.4 63
209 Caucasian Male 8.71 16.3 71
210 Caucasian Female 5.87 *129.3 100
211 Caucasian Female 14.12 24.0 78
212 Caucasian Male 17.60 25.5 58

Appendix A
99
213 Caucasian Female 14.37 37.0 67
214 Caucasian Female 4.20 13.7 103
215 Caucasian Female 3.30 15.7 99
216 Caucasian Male 7.48 14.2 72
217 Caucasian Male 17.65 14.3 80
218 Caucasian Male 6.72 105.8 40
219 Caucasian Male 8.17 61.7 55
220 Caucasian Female 13.33 34.9 142
221 Caucasian Male 8.09 9.0 64
222 Caucasian Female 6.51 29.7 73
223 Caucasian Male 12.30 9.6 70
224 Caucasian Male 23.50 3.3 76
225 Caucasian Male 3.67 11.6 71
226 Caucasian Female 5.32 16.2 119
227 Caucasian Female 9.12 25.4 113
228 Caucasian Female 8.42 45.6 137
229 Caucasian Female 9.03 4.2 149
230 Caucasian Female 7.23 3.7 129
231 Caucasian Female 5.02 20.0 87
232 Caucasian Female 2.16 *132.9 123
233 Caucasian Male 9.56 14.6 91
234 Caucasian Male 12.46 n.d. 63
235 Caucasian Male 13.44 62.9 61
236 Caucasian Female 1.61 60.1 96
237 Caucasian Female 2.90 42.9 98
238 Caucasian Female 17.12 n.d. 87
239 Caucasian Male 6.92 *334.0 116
240 Caucasian Male 12.76 66.6 82
241 Caucasian Female 4.22 66.2 130
242 Caucasian Male 6.41 18.8 67
243 Caucasian Female 11.41 41.4 63
244 Caucasian Female 2.74 41.5 109
245 Caucasian Female 8.14 8.0 85
246 Caucasian Female 7.11 15.4 250
247 Caucasian Female 3.47 26.4 80
248 Caucasian Female 12.30 *92.5 114
249 Caucasian Female 21.41 n.d. 160
250 Caucasian Female 7.59 7.6 88
251 Caucasian Female 8.72 22.7 73
252 Caucasian Female 8.22 18.1 130
253 Caucasian Male 6.66 *309.2 83
254 Caucasian Female 10.89 *186.3 218
255 Caucasian Female 9.59 17.4 116
256 Caucasian Female 7.38 14.2 81
257 Caucasian Female 8.64 35.4 105
258 Caucasian Male 10.44 46.7 87
259 Caucasian Female 8.99 15.8 149
260 Caucasian Female 6.91 12.2 85
261 Caucasian Female 2.80 56.4 114
262 Caucasian Female 4.19 28.2 113
263 Caucasian Female 3.80 75.9 119
264 Caucasian Female 3.46 30.6 104
265 Caucasian Female 9.72 17.1 85
266 Caucasian Female 1.56 15.2 120
267 Caucasian Female 4.21 82.2 78

Appendix A
100
268 Caucasian Female 6.42 34.8 99
269 Caucasian Female 7.32 23.5 68
270 Caucasian Male 1.48 68.4 55
271 Caucasian Female 2.09 39.6 124
272 Caucasian Female 3.26 17.6 113
273 Caucasian Female 6.40 45.2 131
274 Caucasian Male 11.68 *238.4 72
275 Caucasian Female 5.08 63.6 114
276 Caucasian Female 1.63 55.1 121
277 Caucasian Female 3.52 59.1 87
278 Caucasian Male 6.84 n.d. 78
279 Caucasian Female 5.59 61.7 136
280 Caucasian Male 8.44 8.2 60
281 Caucasian Female 5.50 22.2 258
282 Caucasian Female 5.07 45.5 100
283 Caucasian Female 11.12 31.2 89
284 Caucasian Female 3.82 45.4 90
285 Caucasian Female 10.67 62.1 82
286 Caucasian Female 3.41 3.3 123
287 Caucasian Female 3.33 17.9 140
288 Caucasian Female 3.21 *111.1 107
289 Caucasian Female 10.31 7.6 101
290 Caucasian Male 25.17 19.5 72
291 Caucasian Male 15.77 8.7 79
292 Caucasian Male 8.13 10.3 87
293 Caucasian Female 18.84 37.8 149
294 Caucasian Female 7.81 9.8 94
295 Caucasian Female 9.75 14.5 101
296 Caucasian Female 7.87 15.5 70
297 Caucasian Female 7.59 19.6 101
298 Caucasian Male 14.58 45.6 72
299 Caucasian Male 14.55 5.1 70
300 Caucasian Male 14.92 28.8 55
301 Caucasian Female 3.70 64.7 145
302 Caucasian Female 5.81 26.7 84
303 Caucasian Female 3.00 61.8 109
304 Caucasian Male 20.71 *566.2 68
305 Caucasian Male 6.05 n.d. 108
306 Caucasian Female 6.55 29.3 80
307 Caucasian Female 10.61 13.0 74
308 Caucasian Male 16.30 24.6 108
309 Caucasian Male 7.98 1.6 71
310 Caucasian Male 7.79 19.9 76
311 Caucasian Male 1.52 29.0 78
312 Caucasian Male 6.76 31.1 73
313 Caucasian Male 17.44 17.5 61
314 Caucasian Female 8.82 15.8 59
315 Caucasian Female 10.35 14.5 92
316 Caucasian Female 5.76 26.2 102
317 Caucasian Female 10.89 6.8 96
318 Caucasian Female 11.20 22.7 58
319 Caucasian Female 7.33 28.9 73
320 Caucasian Female 30.70 1.0 89
321 Caucasian Female 29.82 30.4 102
322 Caucasian Female 9.01 2.9 130

Appendix A
101
323 Caucasian Male 19.16 16.0 72
324 Caucasian Male 26.35 98.8 58
325 Caucasian Female 3.53 32.5 85
326 Caucasian Male 16.86 79.3 64
327 Caucasian Male 17.84 15.7 77
328 Caucasian Male 27.62 11.7 100
329 Caucasian Female 8.53 62.3 81
330 Caucasian Female 10.38 22.9 87
331 Caucasian Female 21.55 21.1 59
332 Caucasian Female 13.51 5.4 78
333 Caucasian Male 22.39 72.3 55
334 Caucasian Female 8.15 22.3 81
335 Caucasian Female 33.34 26.0 103
336 Caucasian Male 18.64 6.1 81
337 Caucasian Female 24.65 18.0 76
338 Caucasian Male 30.95 32.1 72
339 Caucasian Male 5.87 40.3 91
340 Caucasian Female 8.40 47.7 120
341 Caucasian Male 8.16 13.8 57
342 Caucasian Male 14.43 76.5 82
343 Caucasian Male 12.61 68.2 70
344 Caucasian Male 17.43 64.5 67
345 Caucasian Female 7.59 27.4 99
346 Caucasian Male 22.34 84.2 70
347 Caucasian Male 12.54 72.4 101
348 Caucasian Male 9.69 22.0 67
349 Caucasian Female 4.81 54.9 79
350 Caucasian Female 12.80 9.2 102
351 Caucasian Female 6.45 12.1 76
352 Caucasian Female 15.29 *187.1 89
353 Caucasian Male 15.39 67.8 66
354 Caucasian Female 14.27 83.3 84
355 Caucasian Male 18.11 37.3 98
356 Caucasian Female 9.38 n.d. 57
357 Caucasian Male 11.64 5.6 85
358 Caucasian Female 16.32 44.5 90
359 Caucasian Female 6.50 26.1 75
360 Caucasian Female 7.43 67.5 105
361 Caucasian Female 9.89 3.8 89
362 Caucasian Male 30.06 50.3 69
363 Caucasian Male 19.57 15.4 105
364 Caucasian Female 20.88 24.4 94
365 Caucasian Female 14.08 n.d. 83
366 Caucasian Male 18.62 31.4 91
367 Caucasian Female 12.53 15.3 95
368 Caucasian Female 16.71 n.d. 86
369 Caucasian Female 6.32 39.6 119
370 Caucasian Male 15.94 n.d 63
371 Caucasian Female 5.98 28.1 87
372 Caucasian Male 24.63 13.7 83
373 Caucasian Female 17.01 24.0 97
374 Caucasian Male 57.78 n.d. 106
375 Caucasian Male 18.39 61.4 64
376 Caucasian Male 19.41 35.1 75
377 Caucasian Male 14.37 n.d. 89

Appendix A
102
378 Caucasian Male 18.38 31.2 76
379 Caucasian Male 19.78 54.2 113
380 Caucasian Male 42.60 11.2 86
381 Caucasian Male 21.66 11.8 81
382 Caucasian Male 38.54 n.d. 70
383 Caucasian Male 31.34 5.2 81
384 Caucasian Male 22.13 9.5 82
385 Caucasian Male 17.00 12.4 87
386 Caucasian Male 17.64 18.2 52
387 Caucasian Male 18.59 43.2 93
388 Caucasian Male 14.57 n.d. 84
389 Caucasian Male 27.07 20.2 113
390 Caucasian Male 33.38 n.d. 92
391 Caucasian Male 8.94 59.7 73
392 Caucasian Male 14.15 47.5 83
393 Caucasian Male 32.96 5.5 81
394 Caucasian Male 29.44 74.8 87
395 Caucasian Male 34.02 12.0 104
396 Caucasian Male 17.17 9.6 84
397 Caucasian Male 23.35 24.9 96
398 Caucasian Male 23.98 0.9 77
399 Caucasian Male 21.37 15.6 64
400 Caucasian Male 20.89 34.4 51
401 Caucasian Male 20.58 30.2 71
402 Caucasian Male 17.43 29.0 92
403 Caucasian Male 21.54 *367.2 86
404 Caucasian Male 25.27 25.6 80
405 Caucasian Male 27.44 24.8 83
406 Caucasian Male 17.35 11.6 95
407 Caucasian Male 32.35 21.5 80
408 Caucasian Male 27.99 17.5 74
409 Caucasian Male 22.56 37.6 57
n.d. = not detected; * = outliers that were later removed from the data matrix before statistical
analysis were performed. The outliers were identified with Tukey’s method as described in
Section 6.2.