Mark Scheme (Results) Summer 2015 Pearson Edexcel … · Mark Scheme (Results) Summer 2015 Pearson...
33
Mark Scheme (Results) Summer 2015 Pearson Edexcel GCE in Geography (6GE01) Unit 1:Global Challenges
Transcript of Mark Scheme (Results) Summer 2015 Pearson Edexcel … · Mark Scheme (Results) Summer 2015 Pearson...

Mark Scheme (Results)
Summer 2015
Pearson Edexcel GCE in
Geography (6GE01)
Unit 1:Global Challenges

Edexcel and BTEC Qualifications Edexcel and BTEC qualifications are awarded by Pearson, the UK’s largest awarding body.
We provide a wide range of qualifications including academic, vocational, occupational and
specific programmes for employers. For further information visit our qualifications websites
at www.edexcel.com or www.btec.co.uk. Alternatively, you can get in touch with us using
the details on our contact us page at www.edexcel.com/contactus.
Pearson: helping people progress, everywhere
Pearson aspires to be the world’s leading learning company. Our aim is to help everyone
progress in their lives through education. We believe in every kind of learning, for all kinds
of people, wherever they are in the world. We’ve been involved in education for over 150
years, and by working across 70 countries, in 100 languages, we have built an international
reputation for our commitment to high standards and raising achievement through
innovation in education. Find out more about how we can help you and your students at:
www.pearson.com/uk
Summer 2015
Publications Code: US041598
All the material in this publication is copyright
© Pearson Education Ltd 2015
General Marking Guidance
All candidates must receive the same treatment. Examiners must mark the first candidate in exactly the same way as they
mark the last.
Mark schemes should be applied positively. Candidates must be rewarded for what they have shown they can do rather than
penalised for omissions.
Examiners should mark according to the mark scheme not according to their perception of where the grade boundaries may lie.
There is no ceiling on achievement. All marks on the mark scheme should be used appropriately.
All the marks on the mark scheme are designed to be awarded. Examiners should always award full marks if deserved, i.e. if the
answer matches the mark scheme. Examiners should also be prepared to award zero marks if the candidate’s response is not
worthy of credit according to the mark scheme.
Where some judgement is required, mark schemes will provide the principles by which marks will be awarded and
exemplification may be limited.
When examiners are in doubt regarding the application of the mark scheme to a candidate’s response, the team leader must be consulted.
Crossed out work should be marked UNLESS the candidate has
replaced it with an alternative response.

General Guidance on Marking
All candidates must receive the same treatment.
Examiners should look for qualities to reward rather than faults to penalise. This does NOT mean giving credit for incorrect or inadequate answers, but it does mean allowing candidates to be rewarded for answers showing correct application of
principles and knowledge.
Examiners should therefore read carefully and consider every response: even if it is not what is expected it may be worthy of credit.
Candidates must make their meaning clear to the examiner to gain the mark. Make sure that the answer makes sense. Do not give credit for correct
words/phrases which are put together in a meaningless manner. Answers must be in the correct context.
Crossed out work should be marked UNLESS the candidate has replaced it with an alternative response.
When examiners are in doubt regarding the application of the mark scheme to a
candidate’s response, the Team Leader must be consulted. Using the mark scheme
The mark scheme gives:
an idea of the types of response expected
how individual marks are to be awarded
the total mark for each question
examples of responses that should NOT receive credit.
1. / means that the responses are alternatives and either answer should
receive full credit. 2. ( ) means that a phrase/word is not essential for the award of the mark,
but helps the examiner to get the sense of the expected answer.
3. [ ] words inside square brackets are instructions or guidance for examiners.
4. Phrases/words in bold indicate that the meaning of the phrase or the actual word is essential to the answer.
5. ecf/TE/cq (error carried forward) means that a wrong answer given in an
earlier part of a question is used correctly in answer to a later part of the same question.

Quality of Written Communication
Questions which involve the writing of continuous prose will expect candidates to:
show clarity of expression
construct and present coherent arguments
demonstrate an effective use of grammar, punctuation and spelling. Full marks will be awarded if the candidate has demonstrated the above abilities.
Questions where QWC is likely to be particularly important are indicated “QWC”
in the mark scheme BUT this does not preclude others.
Question Number
Answer Mark
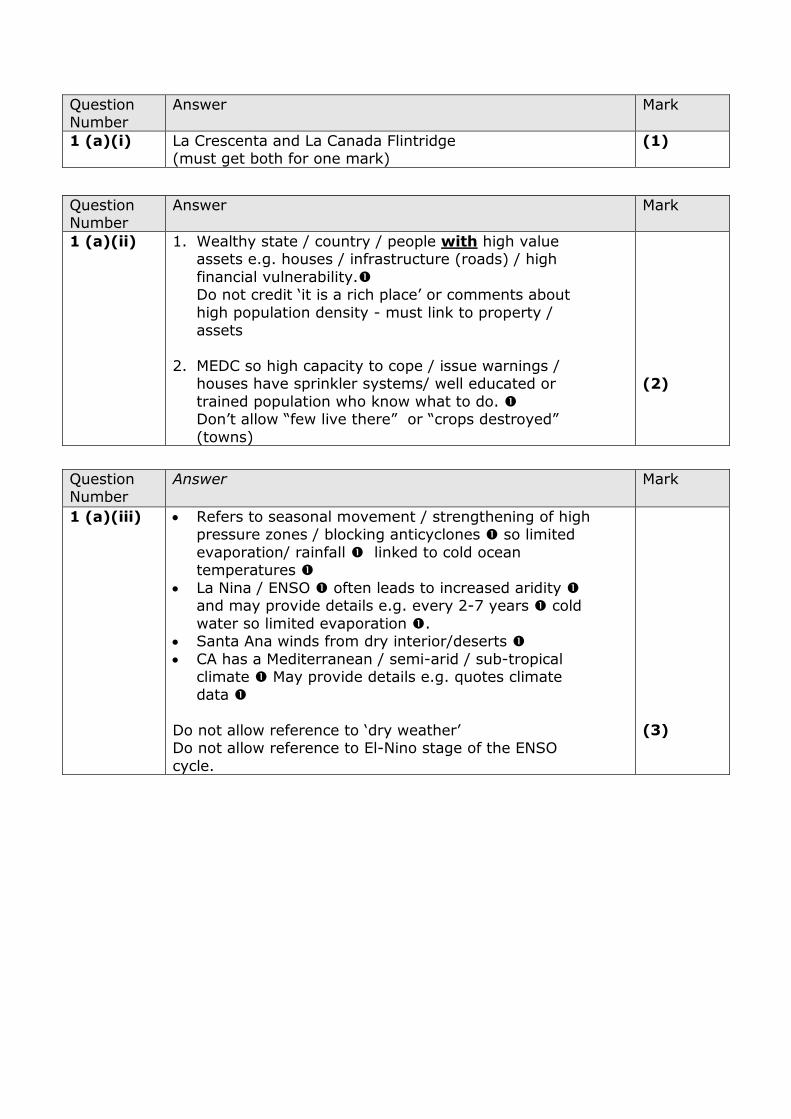
1 (a)(i) La Crescenta and La Canada Flintridge (must get both for one mark)
(1)
Question Number
Answer Mark
1 (a)(ii) 1. Wealthy state / country / people with high value assets e.g. houses / infrastructure (roads) / high
financial vulnerability. Do not credit ‘it is a rich place’ or comments about
high population density - must link to property / assets
2. MEDC so high capacity to cope / issue warnings / houses have sprinkler systems/ well educated or
trained population who know what to do. Don’t allow “few live there” or “crops destroyed”
(towns)
(2)
Question Number
Answer Mark
1 (a)(iii) Refers to seasonal movement / strengthening of high pressure zones / blocking anticyclones so limited
evaporation/ rainfall linked to cold ocean temperatures
La Nina / ENSO often leads to increased aridity and may provide details e.g. every 2-7 years cold
water so limited evaporation . Santa Ana winds from dry interior/deserts
CA has a Mediterranean / semi-arid / sub-tropical climate May provide details e.g. quotes climate
data
Do not allow reference to ‘dry weather’ Do not allow reference to El-Nino stage of the ENSO
cycle.
(3)
Question Number
Answer Mark
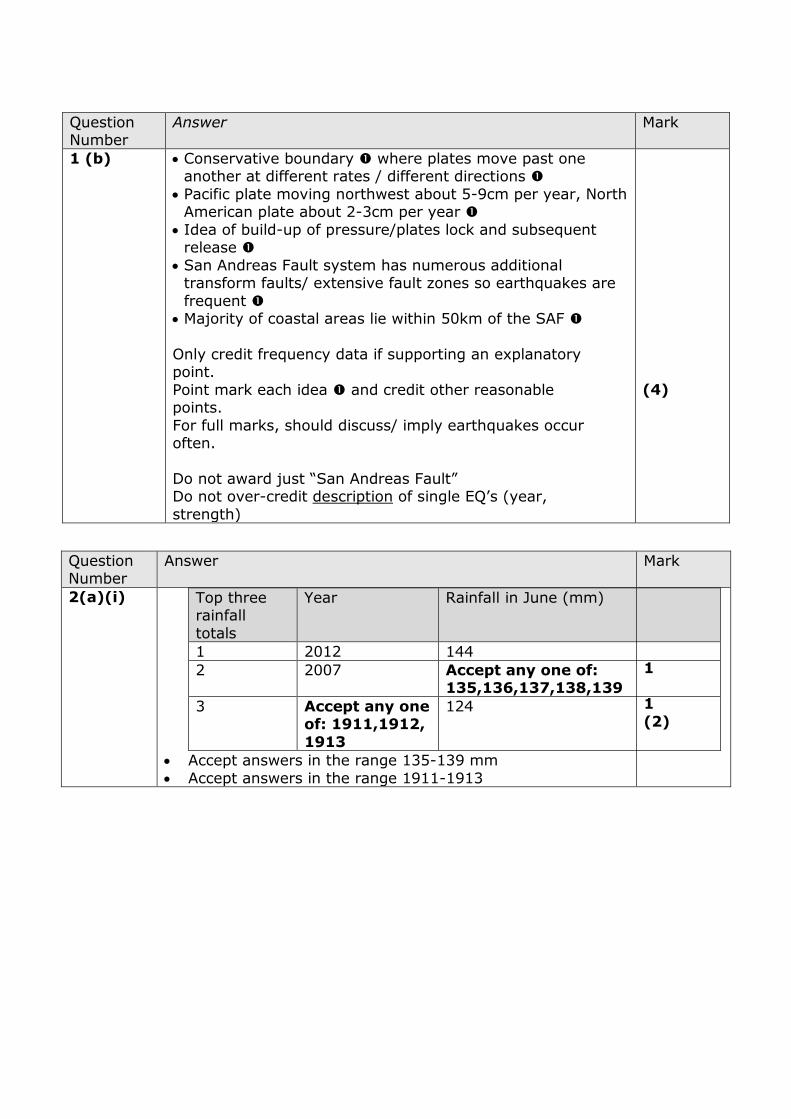
1 (b) Conservative boundary where plates move past one another at different rates / different directions
Pacific plate moving northwest about 5-9cm per year, North American plate about 2-3cm per year
Idea of build-up of pressure/plates lock and subsequent release
San Andreas Fault system has numerous additional transform faults/ extensive fault zones so earthquakes are
frequent Majority of coastal areas lie within 50km of the SAF
Only credit frequency data if supporting an explanatory point.
Point mark each idea and credit other reasonable points.
For full marks, should discuss/ imply earthquakes occur often.
Do not award just “San Andreas Fault” Do not over-credit description of single EQ’s (year,
strength)
(4)
Question Number
Answer Mark
2(a)(i) Top three rainfall
totals
Year Rainfall in June (mm)
1 2012 144
2 2007 Accept any one of: 135,136,137,138,139
3 Accept any one of: 1911,1912,
1913
124
Accept answers in the range 135-139 mm
Accept answers in the range 1911-1913
1
1
(2)
Question
Number
Answer Mark
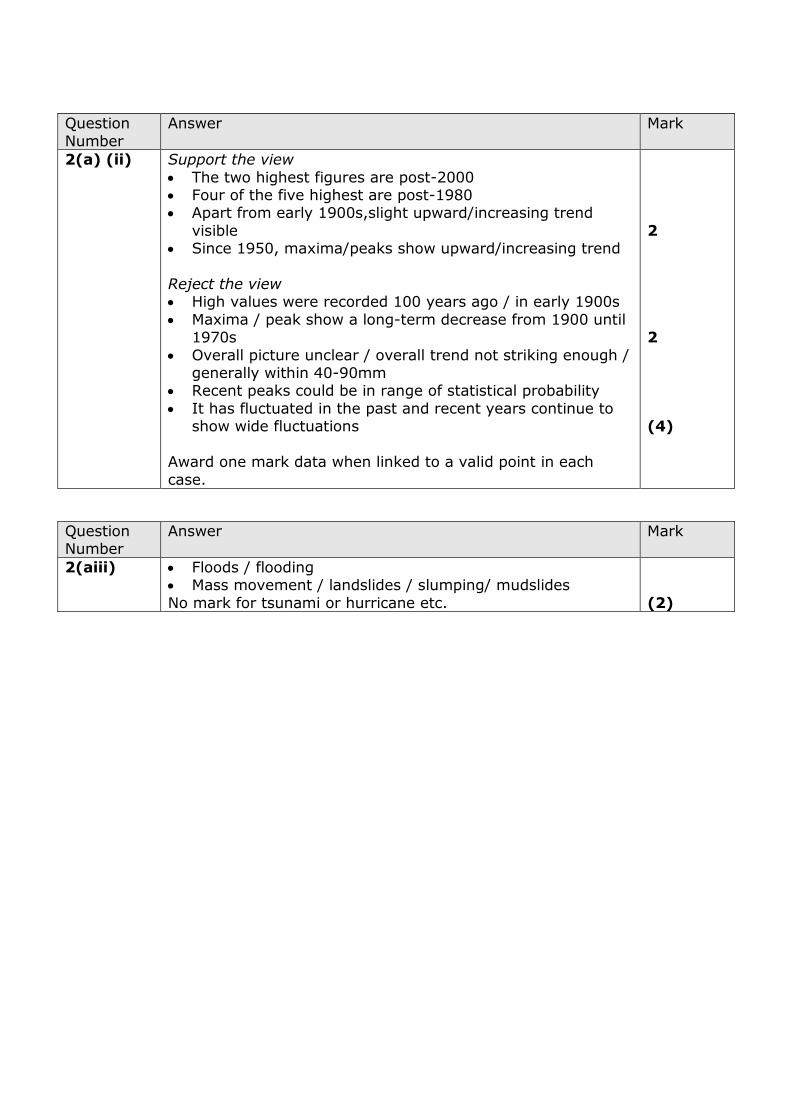
2(a) (ii) Support the view
The two highest figures are post-2000 Four of the five highest are post-1980 Apart from early 1900s,slight upward/increasing trend
visible Since 1950, maxima/peaks show upward/increasing trend
Reject the view High values were recorded 100 years ago / in early 1900s
Maxima / peak show a long-term decrease from 1900 until 1970s
Overall picture unclear / overall trend not striking enough / generally within 40-90mm
Recent peaks could be in range of statistical probability
It has fluctuated in the past and recent years continue to show wide fluctuations
Award one mark data when linked to a valid point in each
case.
2
2
(4)
Question Number
Answer Mark
2(aiii) Floods / flooding Mass movement / landslides / slumping/ mudslides
No mark for tsunami or hurricane etc.
(2)
Question Number
Answer Mark
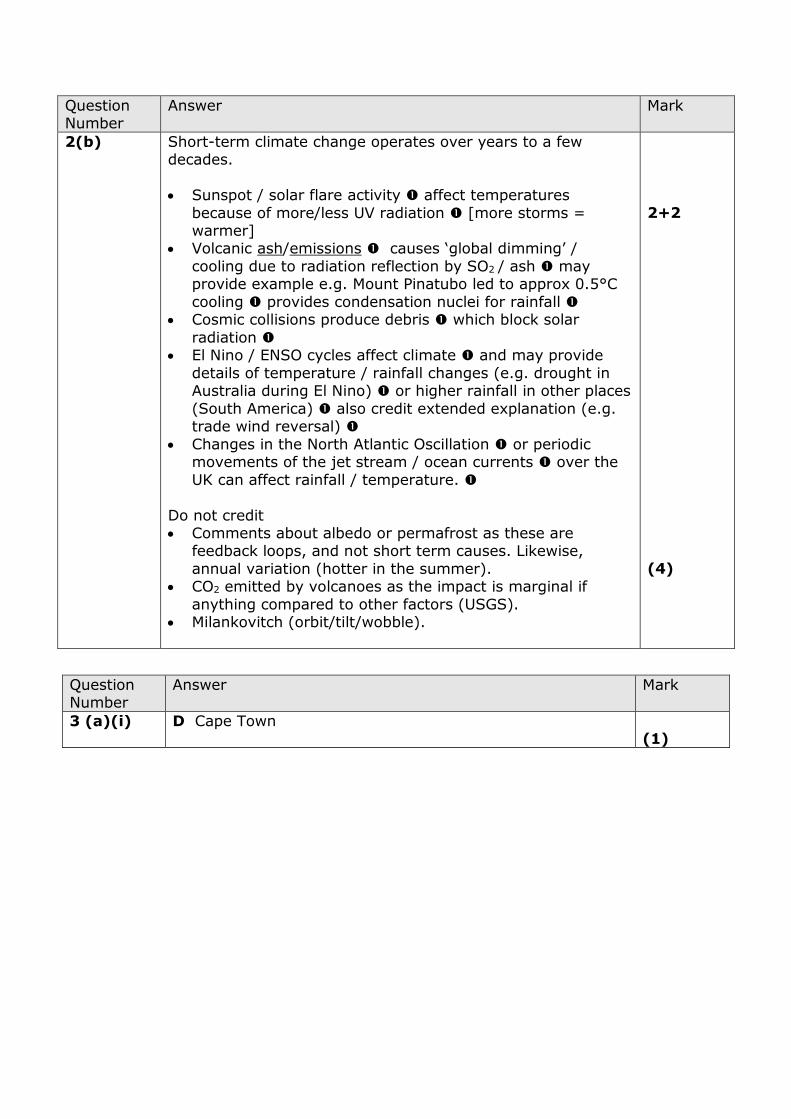
2(b) Short-term climate change operates over years to a few decades.
Sunspot / solar flare activity affect temperatures
because of more/less UV radiation [more storms = warmer]
Volcanic ash/emissions causes ‘global dimming’ /
cooling due to radiation reflection by SO2 / ash may provide example e.g. Mount Pinatubo led to approx 0.5°C
cooling provides condensation nuclei for rainfall Cosmic collisions produce debris which block solar
radiation El Nino / ENSO cycles affect climate and may provide
details of temperature / rainfall changes (e.g. drought in Australia during El Nino) or higher rainfall in other places
(South America) also credit extended explanation (e.g. trade wind reversal)
Changes in the North Atlantic Oscillation or periodic movements of the jet stream / ocean currents over the
UK can affect rainfall / temperature.
Do not credit Comments about albedo or permafrost as these are
feedback loops, and not short term causes. Likewise,
annual variation (hotter in the summer). CO2 emitted by volcanoes as the impact is marginal if
anything compared to other factors (USGS). Milankovitch (orbit/tilt/wobble).
2+2
(4)
Question Number
Answer Mark
3 (a)(i) D Cape Town (1)
Question
Number
Answer Mark
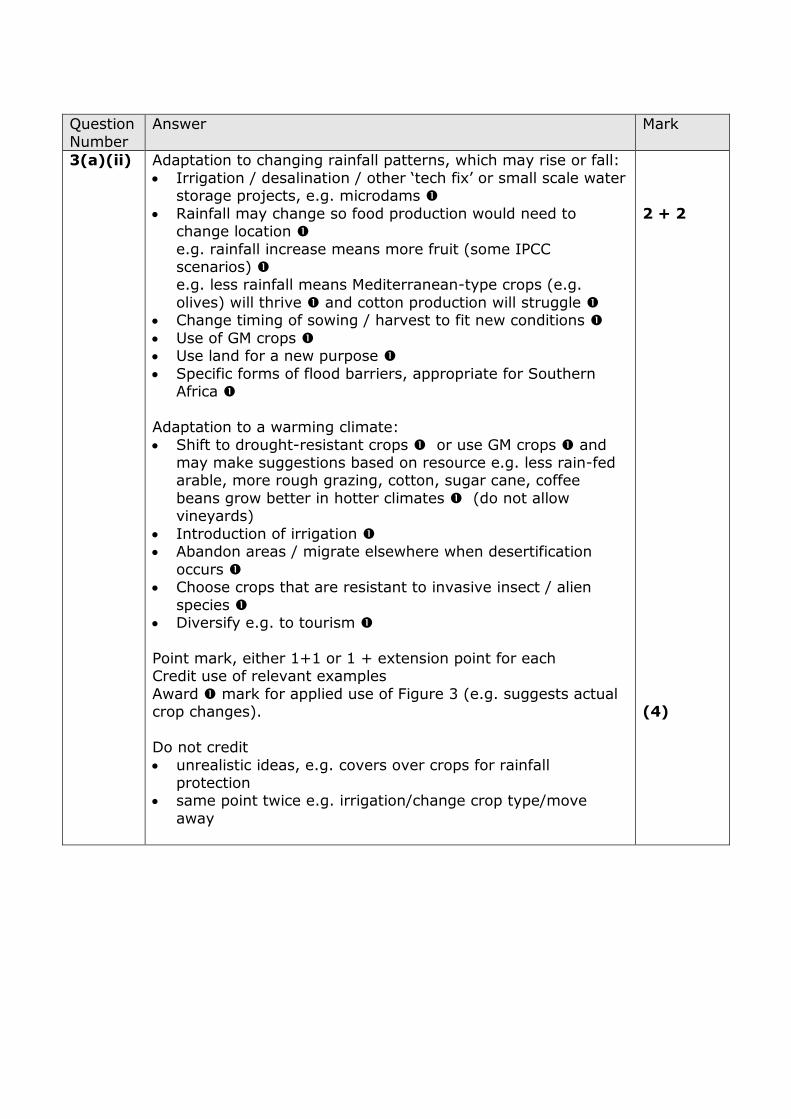
3(a)(ii) Adaptation to changing rainfall patterns, which may rise or fall:
Irrigation / desalination / other ‘tech fix’ or small scale water storage projects, e.g. microdams
Rainfall may change so food production would need to change location
e.g. rainfall increase means more fruit (some IPCC scenarios) e.g. less rainfall means Mediterranean-type crops (e.g.
olives) will thrive and cotton production will struggle Change timing of sowing / harvest to fit new conditions
Use of GM crops Use land for a new purpose
Specific forms of flood barriers, appropriate for Southern Africa
Adaptation to a warming climate:
Shift to drought-resistant crops or use GM crops and may make suggestions based on resource e.g. less rain-fed arable, more rough grazing, cotton, sugar cane, coffee
beans grow better in hotter climates (do not allow vineyards)
Introduction of irrigation Abandon areas / migrate elsewhere when desertification
occurs Choose crops that are resistant to invasive insect / alien
species Diversify e.g. to tourism
Point mark, either 1+1 or 1 + extension point for each Credit use of relevant examples
Award mark for applied use of Figure 3 (e.g. suggests actual crop changes).
Do not credit
unrealistic ideas, e.g. covers over crops for rainfall protection
same point twice e.g. irrigation/change crop type/move
away
2 + 2
(4)
Question Number
Answer Mark
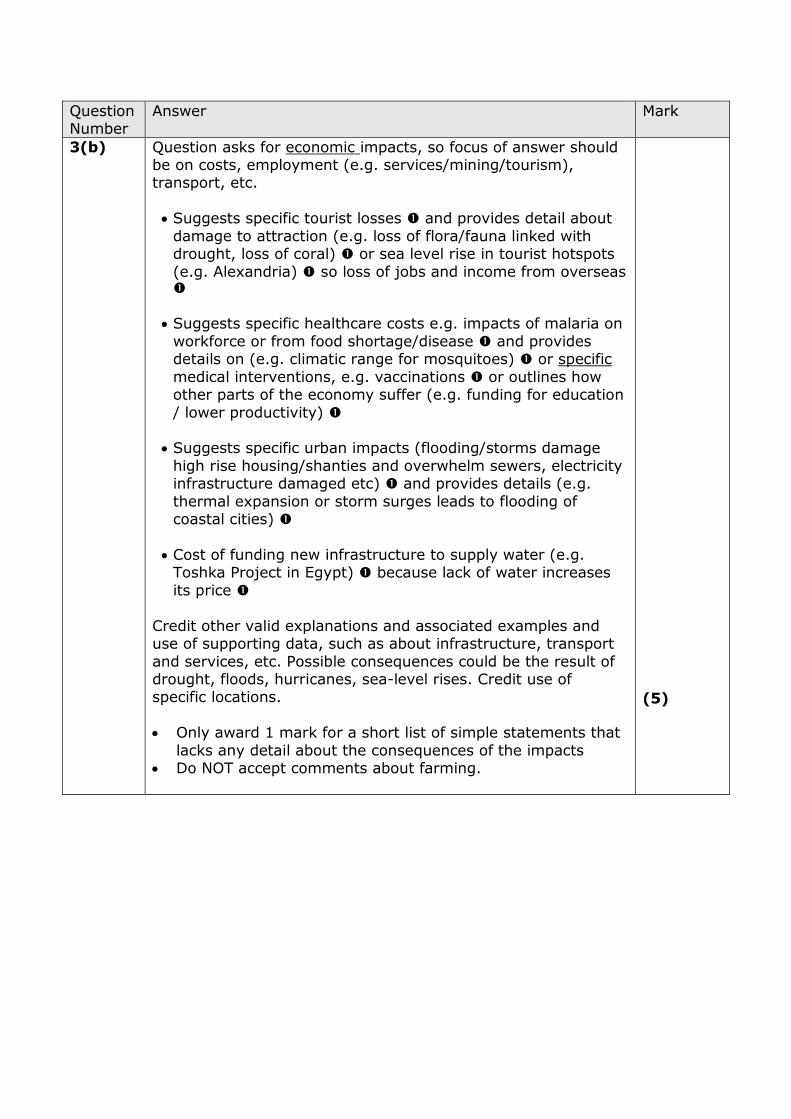
3(b) Question asks for economic impacts, so focus of answer should be on costs, employment (e.g. services/mining/tourism), transport, etc.
Suggests specific tourist losses and provides detail about
damage to attraction (e.g. loss of flora/fauna linked with drought, loss of coral) or sea level rise in tourist hotspots
(e.g. Alexandria) so loss of jobs and income from overseas
Suggests specific healthcare costs e.g. impacts of malaria on
workforce or from food shortage/disease and provides details on (e.g. climatic range for mosquitoes) or specific
medical interventions, e.g. vaccinations or outlines how other parts of the economy suffer (e.g. funding for education
/ lower productivity) Suggests specific urban impacts (flooding/storms damage
high rise housing/shanties and overwhelm sewers, electricity infrastructure damaged etc) and provides details (e.g.
thermal expansion or storm surges leads to flooding of coastal cities)
Cost of funding new infrastructure to supply water (e.g.
Toshka Project in Egypt) because lack of water increases
its price
Credit other valid explanations and associated examples and use of supporting data, such as about infrastructure, transport
and services, etc. Possible consequences could be the result of drought, floods, hurricanes, sea-level rises. Credit use of specific locations.
Only award 1 mark for a short list of simple statements that
lacks any detail about the consequences of the impacts Do NOT accept comments about farming.
(5)

Question
Number
Answer Mark
4 (a)(i) C Europe and the Americas
(1)
Question
Number
Answer Mark
4(a)(ii) Allow for definition of globalisation
Improves international links/ communications Enables sharing of money/ideas/strategies
Providing connectivity with foreign investors / TNCs changing subsistence farming to tertiary opportunities
Gives migrants the means to send remittances/ news Participation in social networks e.g. Facebook
Experience of global media e.g. Hollywood films/ football
Export new genres of music / film, e.g. African art Creates knowledge/demand for global products e.g. Coca
Cola Helps overcome physical constraints leapfrogging the
need for face:face transactions
May have other valid suggestions / associated examples / sensible extensions
Do not credit points simply lifted from resource e.g. “entrepreneurs, technology start-up companies and
investors” until used to answer the question.
Links can be made to economic, social or cultural globalisation
(4)
Question Number
Answer Mark
4 (b) C A reduction in long-distance journey times
(1)
Question Number
Answer Mark
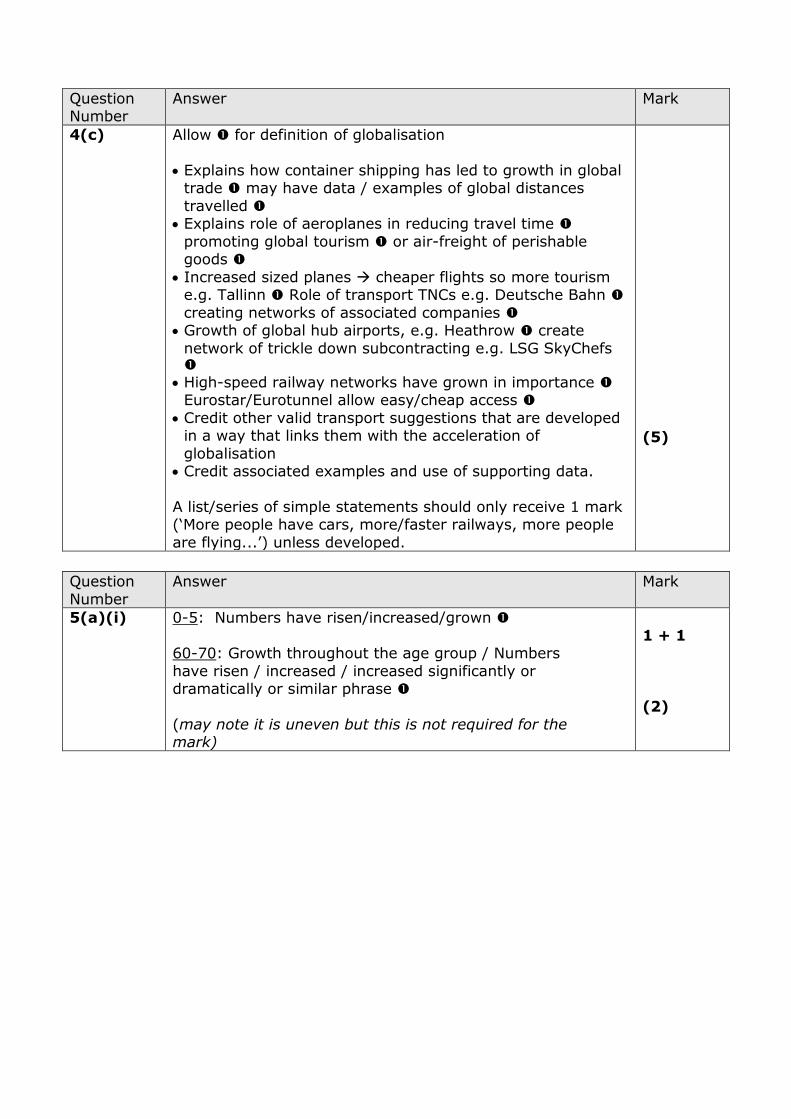
4(c) Allow for definition of globalisation
Explains how container shipping has led to growth in global
trade may have data / examples of global distances
travelled Explains role of aeroplanes in reducing travel time
promoting global tourism or air-freight of perishable goods
Increased sized planes cheaper flights so more tourism e.g. Tallinn Role of transport TNCs e.g. Deutsche Bahn
creating networks of associated companies Growth of global hub airports, e.g. Heathrow create
network of trickle down subcontracting e.g. LSG SkyChefs
High-speed railway networks have grown in importance Eurostar/Eurotunnel allow easy/cheap access
Credit other valid transport suggestions that are developed in a way that links them with the acceleration of
globalisation Credit associated examples and use of supporting data.
A list/series of simple statements should only receive 1 mark (‘More people have cars, more/faster railways, more people
are flying...’) unless developed.
(5)
Question
Number
Answer Mark
5(a)(i) 0-5: Numbers have risen/increased/grown
60-70: Growth throughout the age group / Numbers
have risen / increased / increased significantly or dramatically or similar phrase
(may note it is uneven but this is not required for the mark)
1 + 1
(2)

Question Number
Answer Mark
5(a)(ii) 0-5 Recent upsurge is ‘echo’ of high births 20-30 years
ago, now having children This is linked to high post-WW2 births
Migration of young Europeans has increased numbers of fertile people A8 enlargement in 2004 is a likely
cause Better maternity/paternity pay/leave
Availability of some free child care Increased availability / success rates of fertility
treatment so more women are able to conceive gives details e.g. women with cancer / obese /
epilepsy May suggest other valid social or economic reasons
why births were lower / are higher now
Do not allow
Non-UK ideas like improved infant mortality / vaccinations / children will care for elderly.
Comments about higher incomes or cost of living falling
so people can afford more children.
60-70 Improved healthcare due to free NHS (1948 onwards)
Gives a detail of improved lifestyle (less smoking, improved diet with 5 a day / free swimming) perhaps linked to government spending
Post-WW2 baby boom generation have reached retirement
Gives a detail of improved healthcare e.g. cancer screening
Fewer moving to Spain Credit other valid suggestions
Award 1 mark for a list without detail to support the
suggestions (‘better health, better medicine, more spending’). I mark per valid idea, or 1+1 for a developed/linked
point
(4)
Question
Number
Answer Mark
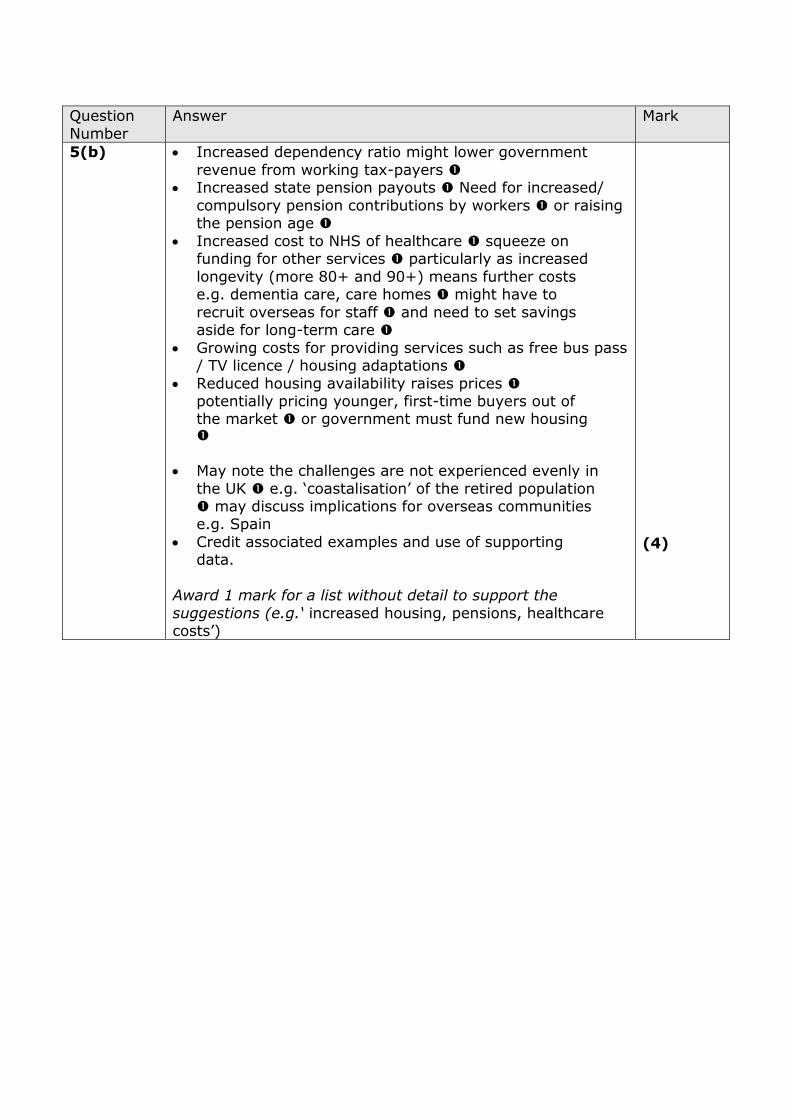
5(b) Increased dependency ratio might lower government
revenue from working tax-payers Increased state pension payouts Need for increased/
compulsory pension contributions by workers or raising the pension age
Increased cost to NHS of healthcare squeeze on funding for other services particularly as increased
longevity (more 80+ and 90+) means further costs e.g. dementia care, care homes might have to
recruit overseas for staff and need to set savings aside for long-term care
Growing costs for providing services such as free bus pass / TV licence / housing adaptations
Reduced housing availability raises prices potentially pricing younger, first-time buyers out of the market or government must fund new housing
May note the challenges are not experienced evenly in
the UK e.g. ‘coastalisation’ of the retired population may discuss implications for overseas communities e.g. Spain
Credit associated examples and use of supporting data.
Award 1 mark for a list without detail to support the
suggestions (e.g.‘ increased housing, pensions, healthcare costs’)
(4)
Question
Number
Answer Mark
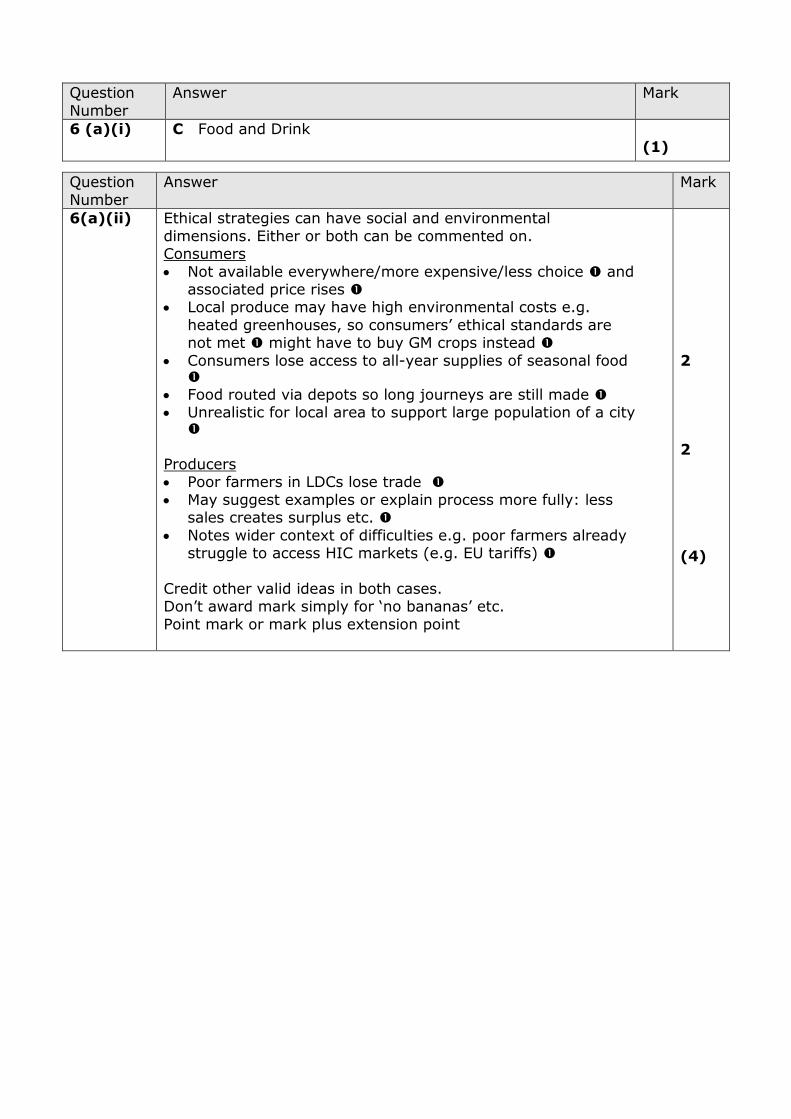
6 (a)(i) C Food and Drink
(1)
Question
Number
Answer Mark
6(a)(ii) Ethical strategies can have social and environmental
dimensions. Either or both can be commented on. Consumers
Not available everywhere/more expensive/less choice and associated price rises
Local produce may have high environmental costs e.g.
heated greenhouses, so consumers’ ethical standards are not met might have to buy GM crops instead
Consumers lose access to all-year supplies of seasonal food
Food routed via depots so long journeys are still made Unrealistic for local area to support large population of a city
Producers Poor farmers in LDCs lose trade
May suggest examples or explain process more fully: less sales creates surplus etc.
Notes wider context of difficulties e.g. poor farmers already struggle to access HIC markets (e.g. EU tariffs)
Credit other valid ideas in both cases. Don’t award mark simply for ‘no bananas’ etc.
Point mark or mark plus extension point
2
2
(4)
Question Number
Answer Mark
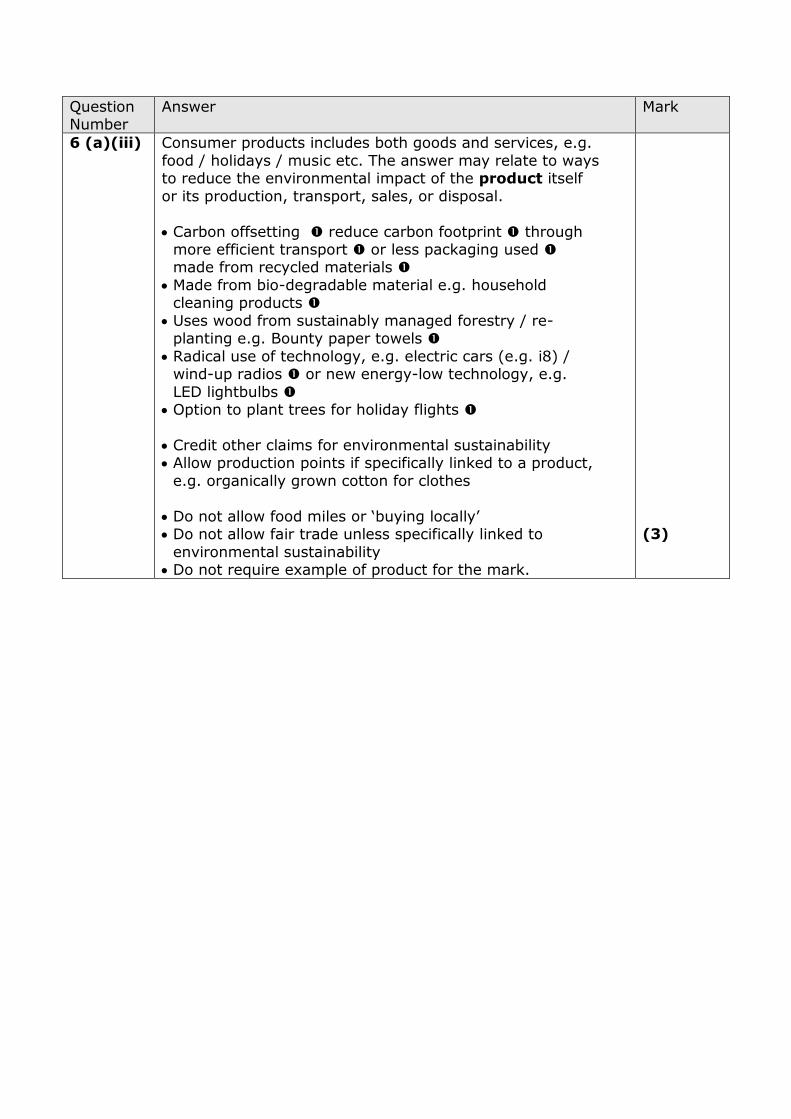
6 (a)(iii) Consumer products includes both goods and services, e.g.
food / holidays / music etc. The answer may relate to ways to reduce the environmental impact of the product itself
or its production, transport, sales, or disposal.
Carbon offsetting reduce carbon footprint through more efficient transport or less packaging used made from recycled materials
Made from bio-degradable material e.g. household cleaning products
Uses wood from sustainably managed forestry / re-planting e.g. Bounty paper towels
Radical use of technology, e.g. electric cars (e.g. i8) / wind-up radios or new energy-low technology, e.g.
LED lightbulbs Option to plant trees for holiday flights
Credit other claims for environmental sustainability Allow production points if specifically linked to a product,
e.g. organically grown cotton for clothes
Do not allow food miles or ‘buying locally’ Do not allow fair trade unless specifically linked to
environmental sustainability Do not require example of product for the mark.
(3)
Question Number
Answer Mark
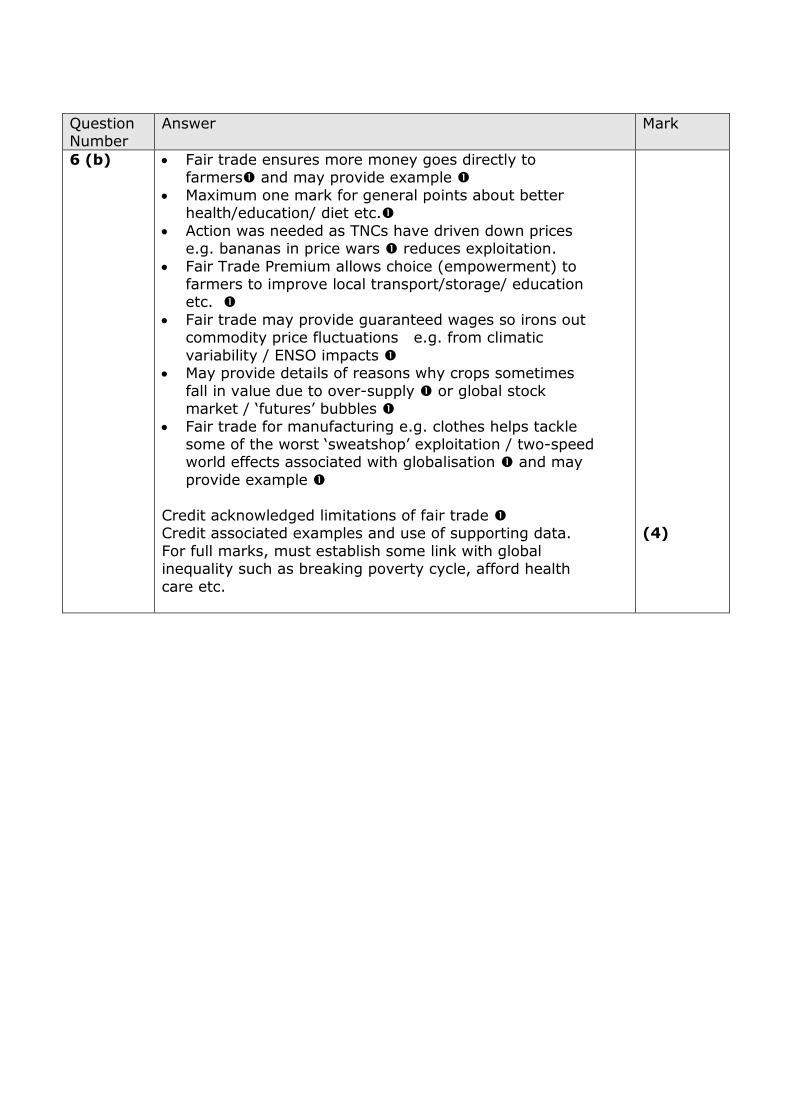
6 (b) Fair trade ensures more money goes directly to farmers and may provide example
Maximum one mark for general points about better health/education/ diet etc.
Action was needed as TNCs have driven down prices e.g. bananas in price wars reduces exploitation.
Fair Trade Premium allows choice (empowerment) to farmers to improve local transport/storage/ education etc.
Fair trade may provide guaranteed wages so irons out commodity price fluctuations e.g. from climatic
variability / ENSO impacts May provide details of reasons why crops sometimes
fall in value due to over-supply or global stock market / ‘futures’ bubbles
Fair trade for manufacturing e.g. clothes helps tackle some of the worst ‘sweatshop’ exploitation / two-speed world effects associated with globalisation and may
provide example
Credit acknowledged limitations of fair trade Credit associated examples and use of supporting data.
For full marks, must establish some link with global inequality such as breaking poverty cycle, afford health
care etc.
(4)
Question
Number
Indicative content
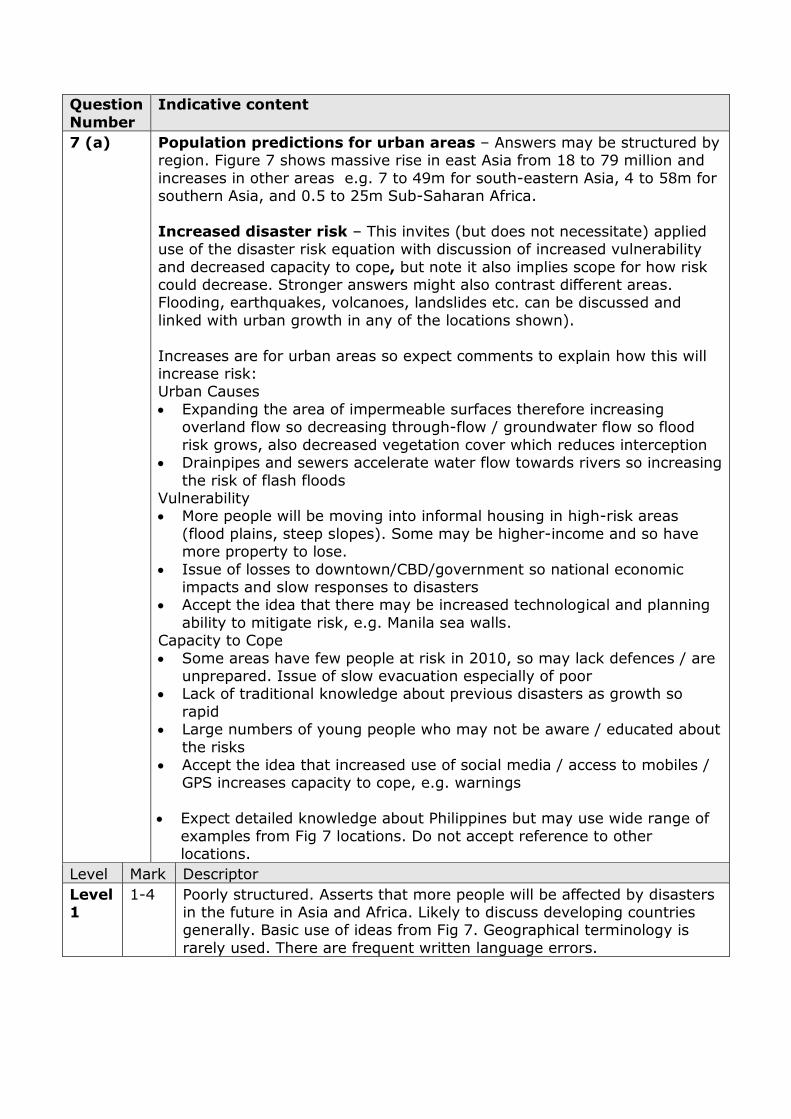
7 (a) Population predictions for urban areas – Answers may be structured by region. Figure 7 shows massive rise in east Asia from 18 to 79 million and
increases in other areas e.g. 7 to 49m for south-eastern Asia, 4 to 58m for southern Asia, and 0.5 to 25m Sub-Saharan Africa.
Increased disaster risk – This invites (but does not necessitate) applied use of the disaster risk equation with discussion of increased vulnerability
and decreased capacity to cope, but note it also implies scope for how risk could decrease. Stronger answers might also contrast different areas. Flooding, earthquakes, volcanoes, landslides etc. can be discussed and
linked with urban growth in any of the locations shown).
Increases are for urban areas so expect comments to explain how this will increase risk: Urban Causes
Expanding the area of impermeable surfaces therefore increasing overland flow so decreasing through-flow / groundwater flow so flood
risk grows, also decreased vegetation cover which reduces interception Drainpipes and sewers accelerate water flow towards rivers so increasing
the risk of flash floods Vulnerability More people will be moving into informal housing in high-risk areas
(flood plains, steep slopes). Some may be higher-income and so have more property to lose.
Issue of losses to downtown/CBD/government so national economic impacts and slow responses to disasters
Accept the idea that there may be increased technological and planning
ability to mitigate risk, e.g. Manila sea walls. Capacity to Cope
Some areas have few people at risk in 2010, so may lack defences / are unprepared. Issue of slow evacuation especially of poor
Lack of traditional knowledge about previous disasters as growth so
rapid Large numbers of young people who may not be aware / educated about
the risks Accept the idea that increased use of social media / access to mobiles /
GPS increases capacity to cope, e.g. warnings
Expect detailed knowledge about Philippines but may use wide range of
examples from Fig 7 locations. Do not accept reference to other locations.
Level Mark Descriptor
Level 1
1-4 Poorly structured. Asserts that more people will be affected by disasters in the future in Asia and Africa. Likely to discuss developing countries generally. Basic use of ideas from Fig 7. Geographical terminology is
rarely used. There are frequent written language errors.

Level 2
5-7 Some structure. Suggests how different urban growth rates and/or the consequences could affect disaster risk. Top of the band answers are
likely to use evidence from figure 7. Some geographical terminology is used. There are some written language errors. Max L2 with no reference to urban
Level 3
8-10 Well-structured answer that suggests a range of ways in which urban population growth has caused disaster risk to increase. May identify a
good range of disaster risks or suggest that there is likely to be an increase in the ability to mitigate the flood risk. Uses Figure 7 in detail. Appropriate geographical terms show understanding. Minor language
errors.

Question Number
Indicative content
7 (b) Different physical factors – natural factors and processes that lead to
flooding (either generally, or for chosen examples) include: Relief - steep sided valleys and faster overland flow, low-lying islands
like Maldives, Tuvalu, river delta areas, e.g. Bangladesh)
Geology and Vegetation – more overland flow and limited infiltration because of e.g. impermeable rock in Boscastle, interception by
vegetation, or saturated ground because of intense rainfall Latitude or location - e.g. UK in path of Atlantic depressions / Philippines
in hurricane belt / monsoon season in South Asia / storm surges at
coast, e.g. Bangladesh ENSO cycles – flooding for South America during El-Nino and SE Asia /
Australasia during La Nina Tsunamis caused by plate tectonic movement. GW increases sea temperatures contributing to more intense rainfall, as
well as coastal flooding because of thermal expansion There are many other possibilities.
Only credit human factors like urbanisation when clearly showing their
contribution relative to the physical factors. This is only likely with top L4 responses.
Global pattern of flood risk
The world-scale focus ideally requires broad global distributions to be identified, e.g. monsoon climate and changing rainfall patterns
(Pakistan, Bangladesh), hurricane/typhoon belt (Philippines), areas periodically affected by ENSO cycles, mid-latitude depressions affecting UK and western and Eastern Europe.
Focus might sometimes be inferred (e.g. for L3) even though examples could be on a national scale,
o i.e. coastlines, e.g. Bangladesh, Netherlands o i.e. large flood plains, e.g. Mekong, Indus, Mississippi
Specific examples could include frequent flooding in Philippines due to typhoons; flooding in California during El Nino years, or UK flooding due to mid-latitude depressions.
Level Mark Descriptor
Level 1 1-4 Little structure. Has one or two descriptive ideas that may relate to
rainfall, rivers and/or coasts. Factors might be generalised or inaccurate. Frequent written language errors.
Level 2 5-8 Some structure. Describes some physical factors that cause flooding but may not explain the processes. Uses place locations of where floods tend to occur. Some geographical terminology is used. Some
written language errors.
Level 3 9-12 Structured account. Explains physical processes/factors that cause flooding. Uses a range of locations to show floods happen globally.
Geographical terms show understanding. Written language errors are minor.
Level 4 13-15 Well structured. Explains range of physical factors showing good
understanding of process. May show awareness of other factors linked to physical processes. Exemplification clearly shows global
distribution of floods. Wide range of accurate geographical terms. Written language errors are rare.
Question Number
Indicative content
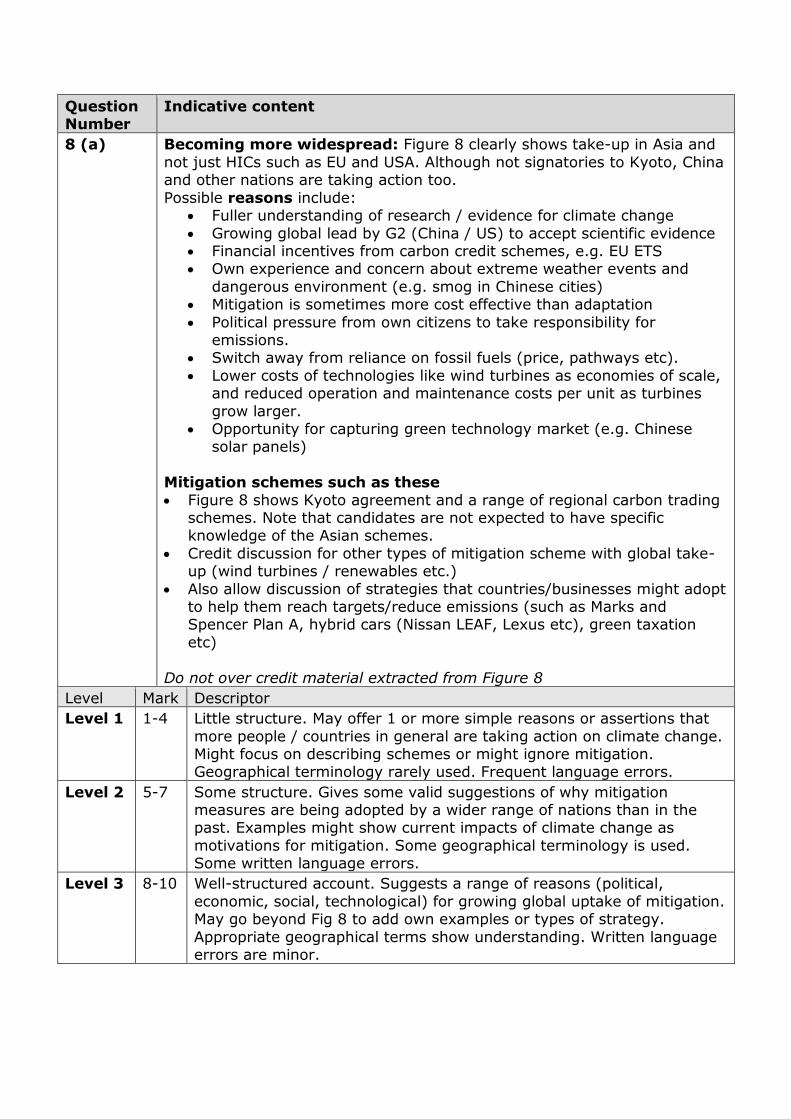
8 (a) Becoming more widespread: Figure 8 clearly shows take-up in Asia and
not just HICs such as EU and USA. Although not signatories to Kyoto, China and other nations are taking action too.
Possible reasons include: Fuller understanding of research / evidence for climate change
Growing global lead by G2 (China / US) to accept scientific evidence Financial incentives from carbon credit schemes, e.g. EU ETS Own experience and concern about extreme weather events and
dangerous environment (e.g. smog in Chinese cities) Mitigation is sometimes more cost effective than adaptation
Political pressure from own citizens to take responsibility for emissions.
Switch away from reliance on fossil fuels (price, pathways etc).
Lower costs of technologies like wind turbines as economies of scale, and reduced operation and maintenance costs per unit as turbines
grow larger. Opportunity for capturing green technology market (e.g. Chinese
solar panels)
Mitigation schemes such as these
Figure 8 shows Kyoto agreement and a range of regional carbon trading schemes. Note that candidates are not expected to have specific knowledge of the Asian schemes.
Credit discussion for other types of mitigation scheme with global take-up (wind turbines / renewables etc.)
Also allow discussion of strategies that countries/businesses might adopt to help them reach targets/reduce emissions (such as Marks and Spencer Plan A, hybrid cars (Nissan LEAF, Lexus etc), green taxation
etc)
Do not over credit material extracted from Figure 8
Level Mark Descriptor
Level 1 1-4 Little structure. May offer 1 or more simple reasons or assertions that
more people / countries in general are taking action on climate change. Might focus on describing schemes or might ignore mitigation. Geographical terminology rarely used. Frequent language errors.
Level 2 5-7 Some structure. Gives some valid suggestions of why mitigation measures are being adopted by a wider range of nations than in the past. Examples might show current impacts of climate change as
motivations for mitigation. Some geographical terminology is used. Some written language errors.
Level 3 8-10 Well-structured account. Suggests a range of reasons (political,
economic, social, technological) for growing global uptake of mitigation. May go beyond Fig 8 to add own examples or types of strategy.
Appropriate geographical terms show understanding. Written language errors are minor.
Question Number
Indicative content
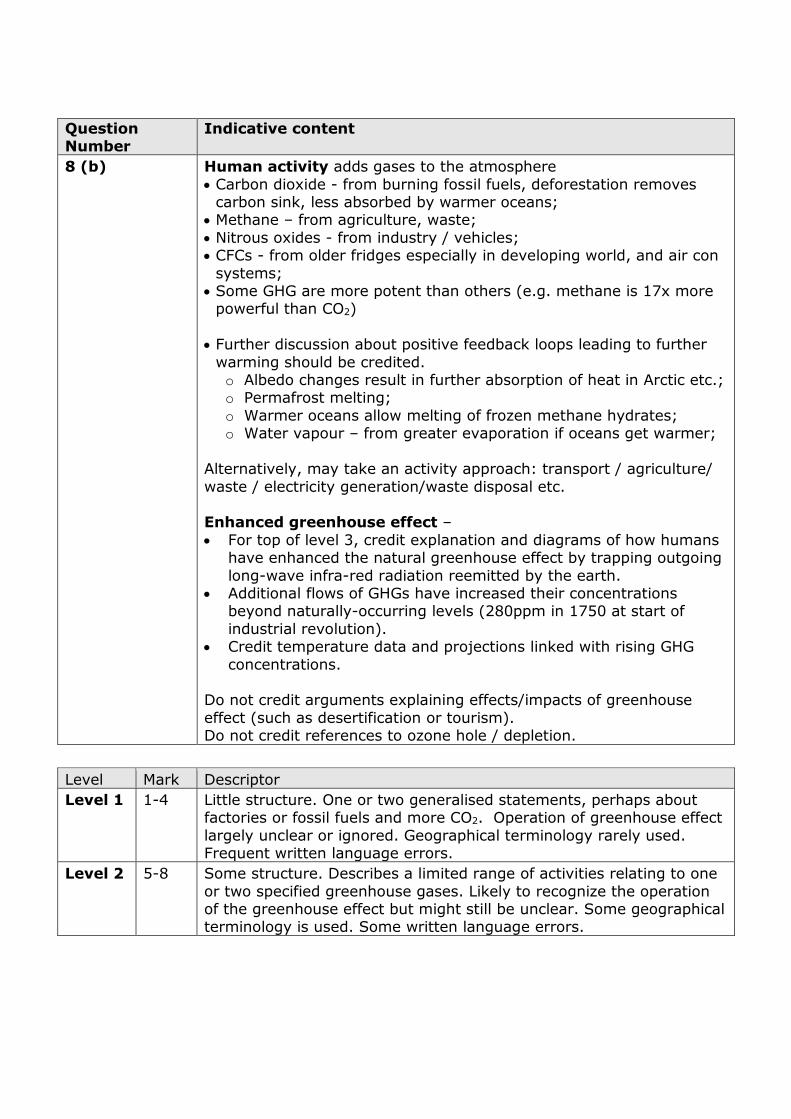
8 (b) Human activity adds gases to the atmosphere
Carbon dioxide - from burning fossil fuels, deforestation removes carbon sink, less absorbed by warmer oceans;
Methane – from agriculture, waste;
Nitrous oxides - from industry / vehicles; CFCs - from older fridges especially in developing world, and air con
systems; Some GHG are more potent than others (e.g. methane is 17x more
powerful than CO2)
Further discussion about positive feedback loops leading to further
warming should be credited. o Albedo changes result in further absorption of heat in Arctic etc.; o Permafrost melting;
o Warmer oceans allow melting of frozen methane hydrates; o Water vapour – from greater evaporation if oceans get warmer;
Alternatively, may take an activity approach: transport / agriculture/
waste / electricity generation/waste disposal etc. Enhanced greenhouse effect –
For top of level 3, credit explanation and diagrams of how humans have enhanced the natural greenhouse effect by trapping outgoing
long-wave infra-red radiation reemitted by the earth. Additional flows of GHGs have increased their concentrations
beyond naturally-occurring levels (280ppm in 1750 at start of
industrial revolution). Credit temperature data and projections linked with rising GHG
concentrations. Do not credit arguments explaining effects/impacts of greenhouse
effect (such as desertification or tourism). Do not credit references to ozone hole / depletion.
Level Mark Descriptor
Level 1 1-4 Little structure. One or two generalised statements, perhaps about factories or fossil fuels and more CO2. Operation of greenhouse effect
largely unclear or ignored. Geographical terminology rarely used. Frequent written language errors.
Level 2 5-8 Some structure. Describes a limited range of activities relating to one
or two specified greenhouse gases. Likely to recognize the operation of the greenhouse effect but might still be unclear. Some geographical terminology is used. Some written language errors.

Level 3 9-12 Structured account of a range of ways in which human activity
generates a range of greenhouse gases. At top of level likely to start explaining how these extra GHGs enhance the natural greenhouse
effect. Geographical terms to show understanding. Written language errors are minor.
Level 4 13-15 Well-structured account explains a wider range of activities covering a
range of GHGs. Clear explanation of the greenhouse effect and specific details of the ways it been enhanced, which may include feedback loops. Uses appropriate geographical terms and
exemplification to show understanding. Written language errors are rare.
Question number
Indicative content
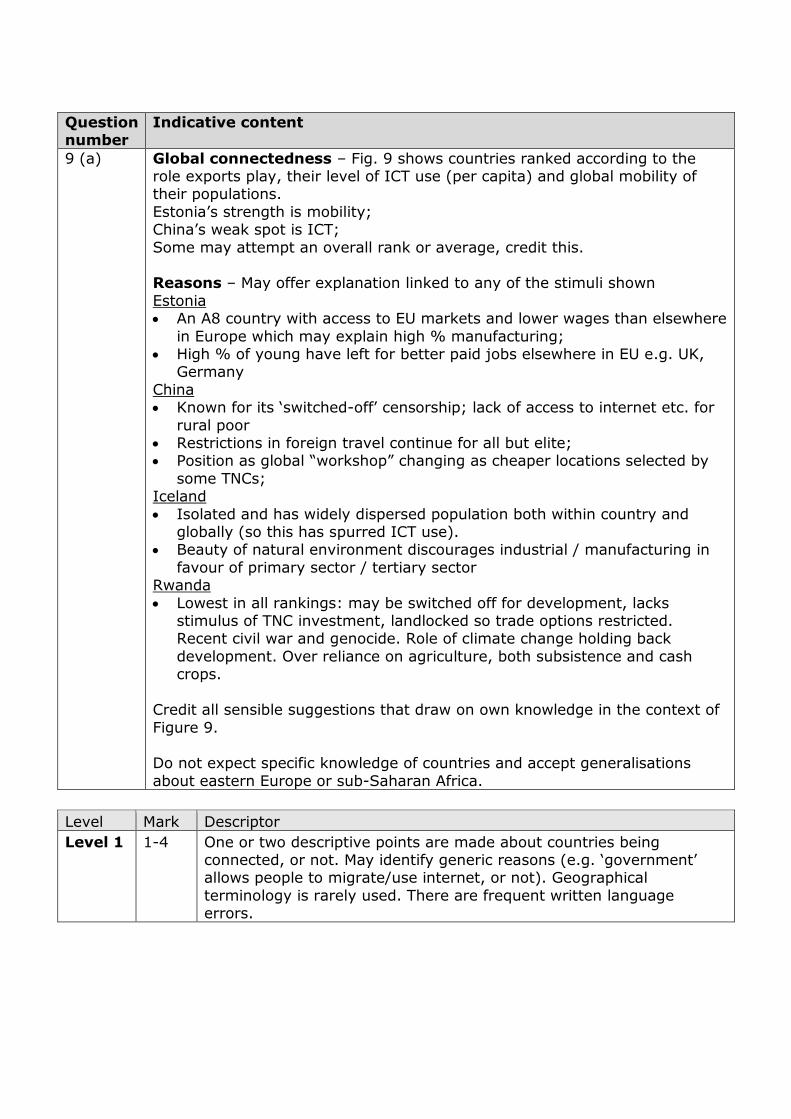
9 (a) Global connectedness – Fig. 9 shows countries ranked according to the role exports play, their level of ICT use (per capita) and global mobility of their populations.
Estonia’s strength is mobility; China’s weak spot is ICT;
Some may attempt an overall rank or average, credit this. Reasons – May offer explanation linked to any of the stimuli shown
Estonia An A8 country with access to EU markets and lower wages than elsewhere
in Europe which may explain high % manufacturing; High % of young have left for better paid jobs elsewhere in EU e.g. UK,
Germany
China Known for its ‘switched-off’ censorship; lack of access to internet etc. for
rural poor Restrictions in foreign travel continue for all but elite; Position as global “workshop” changing as cheaper locations selected by
some TNCs; Iceland
Isolated and has widely dispersed population both within country and globally (so this has spurred ICT use).
Beauty of natural environment discourages industrial / manufacturing in
favour of primary sector / tertiary sector Rwanda
Lowest in all rankings: may be switched off for development, lacks stimulus of TNC investment, landlocked so trade options restricted. Recent civil war and genocide. Role of climate change holding back
development. Over reliance on agriculture, both subsistence and cash crops.
Credit all sensible suggestions that draw on own knowledge in the context of
Figure 9. Do not expect specific knowledge of countries and accept generalisations
about eastern Europe or sub-Saharan Africa.
Level Mark Descriptor
Level 1 1-4 One or two descriptive points are made about countries being connected, or not. May identify generic reasons (e.g. ‘government’ allows people to migrate/use internet, or not). Geographical
terminology is rarely used. There are frequent written language errors.

Level 2 5-7 Some structure. Some discussion of reasons based on use of the data. Identifies how individual factors drawn from the index have impacted on level of “connectedness” for some of the countries in figure 9.
Some geographical terminology is used. There are some written language errors.
Level 3 8-10 Structured account. Analyses data either by country or index to
explain varying scores in figure 9. May also refer to other examples or own knowledge of ‘switched-on switched-off’ places. Appropriate
geographical terms show understanding. Written language errors are minor.
Question Number
Indicative content
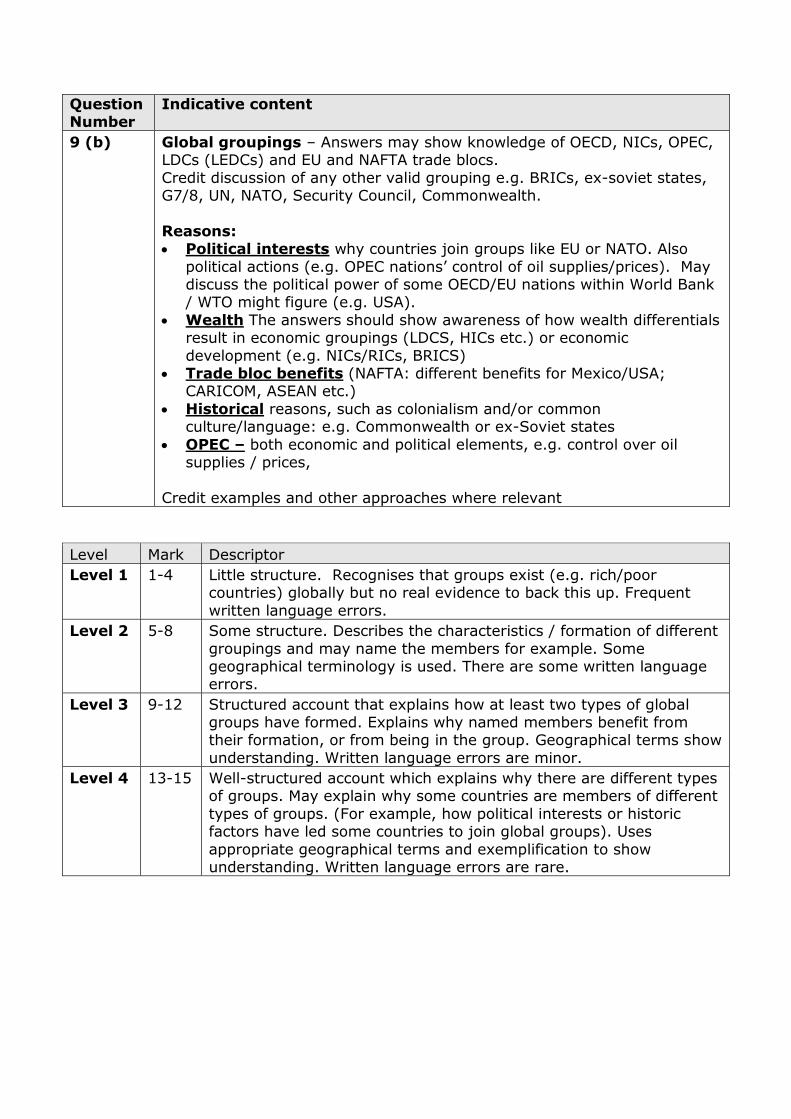
9 (b) Global groupings – Answers may show knowledge of OECD, NICs, OPEC, LDCs (LEDCs) and EU and NAFTA trade blocs.
Credit discussion of any other valid grouping e.g. BRICs, ex-soviet states, G7/8, UN, NATO, Security Council, Commonwealth.
Reasons: Political interests why countries join groups like EU or NATO. Also
political actions (e.g. OPEC nations’ control of oil supplies/prices). May discuss the political power of some OECD/EU nations within World Bank / WTO might figure (e.g. USA).
Wealth The answers should show awareness of how wealth differentials result in economic groupings (LDCS, HICs etc.) or economic
development (e.g. NICs/RICs, BRICS) Trade bloc benefits (NAFTA: different benefits for Mexico/USA;
CARICOM, ASEAN etc.)
Historical reasons, such as colonialism and/or common culture/language: e.g. Commonwealth or ex-Soviet states
OPEC – both economic and political elements, e.g. control over oil supplies / prices,
Credit examples and other approaches where relevant
Level Mark Descriptor
Level 1 1-4 Little structure. Recognises that groups exist (e.g. rich/poor countries) globally but no real evidence to back this up. Frequent
written language errors.
Level 2 5-8 Some structure. Describes the characteristics / formation of different
groupings and may name the members for example. Some geographical terminology is used. There are some written language errors.
Level 3 9-12 Structured account that explains how at least two types of global groups have formed. Explains why named members benefit from their formation, or from being in the group. Geographical terms show
understanding. Written language errors are minor.
Level 4 13-15 Well-structured account which explains why there are different types of groups. May explain why some countries are members of different
types of groups. (For example, how political interests or historic factors have led some countries to join global groups). Uses
appropriate geographical terms and exemplification to show understanding. Written language errors are rare.
Level Mark Descriptor
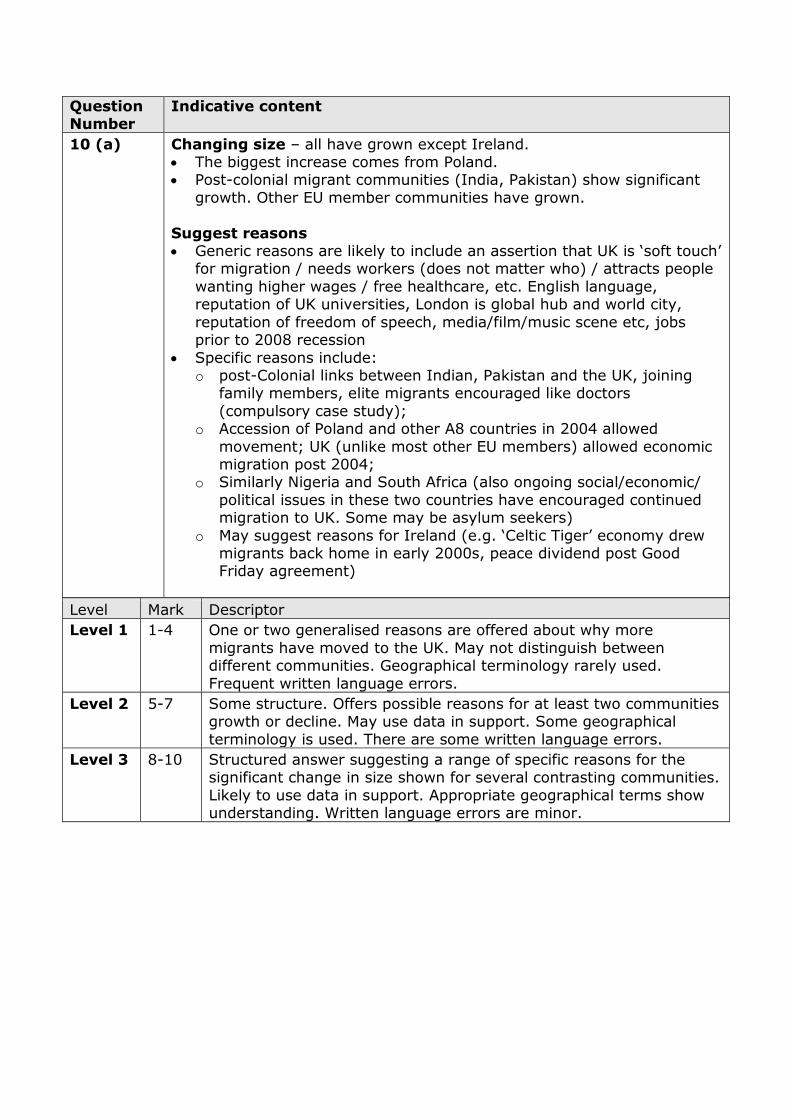
Level 1 1-4 One or two generalised reasons are offered about why more
migrants have moved to the UK. May not distinguish between different communities. Geographical terminology rarely used.
Frequent written language errors.
Level 2 5-7 Some structure. Offers possible reasons for at least two communities growth or decline. May use data in support. Some geographical
terminology is used. There are some written language errors.
Level 3 8-10 Structured answer suggesting a range of specific reasons for the significant change in size shown for several contrasting communities.
Likely to use data in support. Appropriate geographical terms show understanding. Written language errors are minor.
Question Number
Indicative content
10 (a) Changing size – all have grown except Ireland. The biggest increase comes from Poland. Post-colonial migrant communities (India, Pakistan) show significant
growth. Other EU member communities have grown.
Suggest reasons Generic reasons are likely to include an assertion that UK is ‘soft touch’
for migration / needs workers (does not matter who) / attracts people
wanting higher wages / free healthcare, etc. English language, reputation of UK universities, London is global hub and world city,
reputation of freedom of speech, media/film/music scene etc, jobs prior to 2008 recession
Specific reasons include: o post-Colonial links between Indian, Pakistan and the UK, joining
family members, elite migrants encouraged like doctors
(compulsory case study); o Accession of Poland and other A8 countries in 2004 allowed
movement; UK (unlike most other EU members) allowed economic migration post 2004;
o Similarly Nigeria and South Africa (also ongoing social/economic/
political issues in these two countries have encouraged continued migration to UK. Some may be asylum seekers)
o May suggest reasons for Ireland (e.g. ‘Celtic Tiger’ economy drew migrants back home in early 2000s, peace dividend post Good Friday agreement)
Question Number
Indicative content
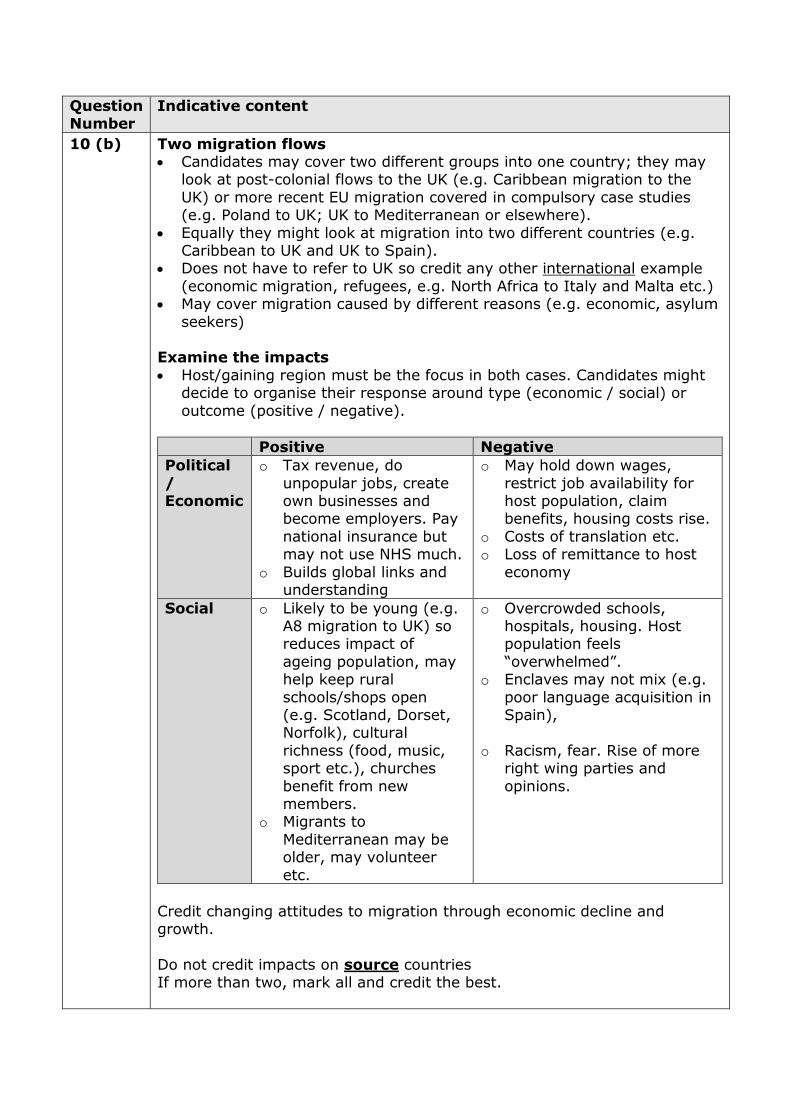
10 (b) Two migration flows Candidates may cover two different groups into one country; they may
look at post-colonial flows to the UK (e.g. Caribbean migration to the
UK) or more recent EU migration covered in compulsory case studies (e.g. Poland to UK; UK to Mediterranean or elsewhere).
Equally they might look at migration into two different countries (e.g. Caribbean to UK and UK to Spain).
Does not have to refer to UK so credit any other international example
(economic migration, refugees, e.g. North Africa to Italy and Malta etc.) May cover migration caused by different reasons (e.g. economic, asylum
seekers) Examine the impacts
Host/gaining region must be the focus in both cases. Candidates might decide to organise their response around type (economic / social) or
outcome (positive / negative).
Positive Negative
Political
/ Economic
o Tax revenue, do
unpopular jobs, create own businesses and become employers. Pay
national insurance but may not use NHS much.
o Builds global links and understanding
o May hold down wages,
restrict job availability for host population, claim benefits, housing costs rise.
o Costs of translation etc. o Loss of remittance to host
economy
Social o Likely to be young (e.g. A8 migration to UK) so reduces impact of
ageing population, may help keep rural
schools/shops open (e.g. Scotland, Dorset, Norfolk), cultural
richness (food, music, sport etc.), churches
benefit from new members.
o Migrants to
Mediterranean may be older, may volunteer
etc.
o Overcrowded schools, hospitals, housing. Host population feels
“overwhelmed”. o Enclaves may not mix (e.g.
poor language acquisition in Spain),
o Racism, fear. Rise of more right wing parties and
opinions.
Credit changing attitudes to migration through economic decline and growth.
Do not credit impacts on source countries If more than two, mark all and credit the best.

Level Mark Descriptor
Level 1 1-4 Limited identification of any recognisable migration(s) or their impacts. May assert arrival of Poles in UK has caused unspecified
conflicts. Geographical terminology is rarely used. There are frequent language errors.
Level 2 5-8 Some structure. Basic description of migration flows to the same or
different countries. A range of impacts is identified but lacks detail. Some geographical terminology used. Some written language errors.
Level 3 9-12 Structured account. Expect two different migration flows to be
examined, but allow max 10 if only one done in depth. Starts to show classification of impacts (by positive/negative,
economic/social). Provides supporting detail of impacts. Geographical terms show understanding. Written language errors are minor.
Level 4 13-15 Well-structured. Two migrations are examined in depth to clearly
show contrasting impacts. Good exemplification and supporting detail for both. May comment on relative scale of impact. Uses
appropriate geographical terms to show understanding. Written language errors are rare.

Pearson Education Limited. Registered company number 872828 with its registered office at 80 Strand, London, WC2R 0RL, United Kingdom