Mark Scheme (Results) January 2013 - LearnEconomicsOnline
18
Mark Scheme (Results) January 2013 GCE Economics (6EC02/01)
Transcript of Mark Scheme (Results) January 2013 - LearnEconomicsOnline

Mark Scheme (Results) January 2013 GCE Economics (6EC02/01)

Edexcel and BTEC Qualifications Edexcel and BTEC qualifications come from Pearson, the world’s leading learning company. We provide a wide range of qualifications including academic, vocational, occupational and specific programmes for employers. For further information, please visit our website at www.edexcel.com. Our website subject pages hold useful resources, support material and live feeds from our subject advisors giving you access to a portal of information. If you have any subject specific questions about this specification that require the help of a subject specialist, you may find our Ask The Expert email service helpful. www.edexcel.com/contactus Pearson: helping people progress, everywhere Our aim is to help everyone progress in their lives through education. We believe in every kind of learning, for all kinds of people, wherever they are in the world. We’ve been involved in education for over 150 years, and by working across 70 countries, in 100 languages, we have built an international reputation for our commitment to high standards and raising achievement through innovation in education. Find out more about how we can help you and your students at: www.pearson.com/uk Summer 2012 Publications Code US034385 All the material in this publication is copyright © Pearson Education Ltd 2012

General Marking Guidance
• All candidates must receive the same treatment. Examiners must mark the first candidate in exactly the same way as they mark the last.
• Mark schemes should be applied positively. Candidates must be rewarded for what they have shown they can do rather than penalised for omissions.
• Examiners should mark according to the mark scheme not according to their perception of where the grade boundaries may lie.
• There is no ceiling on achievement. All marks on the mark scheme should be used appropriately.
• All the marks on the mark scheme are designed to be awarded. Examiners should always award full marks if deserved, i.e. if the answer matches the mark scheme. Examiners should also be prepared to award zero marks if the candidate’s response is not worthy of credit according to the mark scheme.
• Where some judgement is required, mark schemes will provide the principles by which marks will be awarded and exemplification may be limited.
• When examiners are in doubt regarding the application of the mark scheme to a candidate’s response, the team leader must be consulted.
• Crossed out work should be marked UNLESS the candidate has replaced it with an alternative response.

Question Number
Answer Mark
1(a)(i) Up to 4 marks: • Consumption (1) • Investment (1) • Government Spending (1) • Exports minus Imports (1) • Award AD = C+I+G+X-M as a maximum
of 2 marks unless each component stated in full (i.e. 'consumption')
Reference to data (2)
(6)
Question Number
Answer Mark
1(a)(ii) Award two influences only Two factors identified (2 marks each) and linked to investment (2 marks each) Factors may include:
• business confidence or start of the recovery/fear of a recession/uncertainty
• interest rates • Willingness of banks to lend to business • Government incentives such as a reduction in
corporation tax or tax breaks for investment • level of aggregate demand/spare
capacity/unemployment/average incomes in the economy
• level of consumer confidence • rate of corporation tax • level of pre-tax profits made, or existing debt
owed by firms • economic conditions in export markets • exchange rate fluctuations • availability of new technology • the rate of inflation
(8)

Question Number
Answer Mark
1(a)(iii) KAA - 8 marks (4 marks for diagram, 4 marks for explanation and analysis) Diagram demonstrating effect on AD and/or AS (4); correct shifts in line(s) - shift in AD to the left and/or shift in AS to left (1), lines labelled (1), axes labelled (1), equilibria labelled (1). (Note: diagrams where a single shift is incorrect receive no marks. If one shift is correct and the other wrong then award up to 2 marks, assuming the rest of the diagram is labelled correctly) Up to 4 marks: Each effect identified (2) and explained (2)
• Change in unemployment • Fall in output • Change in price level or inflation • PPF moves inward • Loss of international competitiveness (2) and
worsening of the current account deficit (2) • Fall in productivity
NB: if no AS/AD diagram, award a maximum of 4 KAA marks Evaluation - 4 marks (1 x 4 or 2 x 2) factors might include:
• Long term or short term effects • Relative importance each effect • Size of the multiplier • Other factors are more important - ceteris
paribus might not hold • Investment is the smallest component of AD,
so effects might not be large • Effects depend on the level of spare
capacity/shape of the AS curve/elasticity of AD
• Effect on the price level may be cancelled out by decrease in AS as well as AD
• Different effects in different industries or parts of the country
(12)
Level Mark Descriptor Level 3 9-12 1 convincing effect with a correct AS/AD diagram and at least one
evaluative point Level 2 5-8 1 convincing effect with a correct AS/AD diagram but no
evaluative point; 1 or 2 less-convincing effect with an incorrect, incorrect or no AS/AD diagram, with some evaluation
Level 1 1-4 Identification of relevant effect, incorrect, incomplete or no AS/AD diagram, with or without brief evaluative keywords

Question Number
Answer Mark
1(b)(i) Up to 6 marks for the following: • Definition of multiplier (2): the number of times
a rise in national income exceeds the rise in injections that caused it / it measures the knock-on effects when an injection or withdrawal changes / the idea that one person's expenditure becomes another person's income.
• Withdrawals/leakages from the circular flow fall OR the marginal propensity to save/withdraw falls (2)
• Consumption is likely to rise OR the marginal propensity to consume is likely to rise (2)
• The size of the multiplier increases (2) Reference to Data (up to 2 marks): 'savings ratio has fallen (1) use of correct figures (1) e.g. it is forecast to fall (1) below 7% from 2011 onwards (1)
(8)

Question Number
Answer Mark
1(b)(ii)*
KAA 8 Up to 2 marks for: Definition OR diagram illustrating the output gap:
• A measure of the difference between actual and potential (or trend) growth/output/GDP (2)
• The potential output is where the economy is at full capacity whereas the actual level of real GDP is at the intersection of AD and AS below that (2)
• Appropriate diagram (AS/AD, PPF, or business cycle showing actual and potential growth/output/GDP (2)
e.g.

Up to 8 marks for: Two consequences identified (2 marks each) and explained (2 marks each) Award two consequences only Accept changes in:
• Unemployment • Real GDP • Real incomes/levels of consumption/ standard of
living • Confidence • Investment • Government budget balance • International competitiveness • Trade balance
NB Answers must relate to the post 2009 situation, i.e. be in the context of a negative output gap, although credit answers which discuss the positive consequences of a decrease in the size of the negative output gap. Do not credit answers which solely state that the size of the negative output gap has/will increased since 2009.
Data reference (2 marks): identification of a negative output gap (1), use of figures showing size of output gap (1), e.g. there was a negative output gap (1) of approx. 3% in late 2010 (1). Evaluation - 4 marks (1 x 4 or 2 x 2) factors might include:
• Magnitude of different consequences • Short term and long term consequences • Vicious cycle/spiral • Although the output gap is negative, it has been
decreasing in size since mid-2009 • Extract 1 predicts a continuing current account
deficit, rather than an improving balance • Forecast may be wrong
Quality of written communications will be assessed in this question based on the candidate’s ability:
• To present an argument and conclude on the basis of that argument
• To organise information clearly and coherently • To use economic vocabulary appropriately • To use grammar, spelling and punctuation
appropriately
(12)

Question Number
Answer Mark
1(c)(i) KAA (4 marks) • Budget deficit has increased (2) • Reference to data (up to 2 marks):
• Over 3 times as a % of GDP (2) • From approximately -2.5% (36.5% -
39%) to -9% (37.5% - 46.5%) of GDP (2)
• government tax receipts as a proportion of GDP rose from (or remained steady at) approximately 36.5% to 37.5% whereas government spending as a proportion of GDP rose even further from 39% - 46.5%. (2) (Candidates must refer to changes in both G and T for these 2 marks)
• Descriptive references to changes in the deficit/rates of increase from the data (1) e.g. the deficit peaked in 2009. (1)
(4)
Question Number
Answer Mark
1(c)(ii)* KAA 18 Up to 6 marks:
• Define economic growth (2) • Define budget deficit (2) • Identification of policy or policies to reduce a
budget deficit: o Decrease in spending (2) o Increase in taxation (2) o Reduce borrowing (2)
• Correctly labelled AD/AS diagram showing an AD (and possible AS) shift to the left as a result of a reduction in the budget deficit. Accept also circular flow of income diagram that demonstrates a reduction in the circular flow of income (2).
Identification and explanation of the effects of the policies - 12 marks (3 x 4 marks or 2 x 6 marks):
• Rising unemployment • Reduction in real output • Effect of reduced government investment on
long term growth/productive potential of
Level Mark Descriptor Level 3 9-12 2 convincing consequences with at least one evaluative point Level 2 5-8 2 convincing consequences with no connections, or 1 convincing
consequences with some good analysis but no evaluative point; 1 or 2 less-convincing consequences with some evaluation
Level 1 1-4 Identification of relevant consequences with or without brief evaluative keywords

economy • Deflationary effect • Improvement in the balance of payments on
current account as net exports rise • Environmental impact • Increasing inequality • Falling real incomes / standard of living • Falling real wages in public sector effect on
output • Decrease in HDI
Reward use of diagrams (maximum of 2 marks each if they develop analysis) Evaluation - 12 marks (2 x 6 marks or 3 x 4 marks):
• Reduction in transfer payments may reduce frictional/voluntary unemployment
• Time lags – (e.g. length of time for former claimants to find jobs)
• Short run and long run macroeconomic effects • Size of the multiplier effect • Shape of the AS curve • Effects depend on to what extent private
sector spending/employment can replace public sector spending/employment
• Effects depend on what taxes/government spending areas are changed
• Critical consideration of the effectiveness of policies
• Potential increase in black economy (cash in hand work)
Quality of written communications will be assessed in this question based on the candidate’s ability:
• To present an argument and conclude on the basis of that argument
• To organise information clearly and coherently
• To use economic vocabulary appropriately • To use grammar, spelling and punctuation
appropriately
(30)
Level Mark Descriptor Level 4 25-30 2 or 3 convincing effects with at least two evaluative points (an
evaluation points is worth up to a maximum of 6 marks Level 3 19-24 2 or 3 convincing effects with at least one evaluative point (mark
cap to 18 if no evaluation) Level 2 7-18 2 or 3 convincing effects with no evaluative point; 1 or 2 less-
convincing effects with some evaluation Level 1 1-6 Identification of relevant points with or without brief evaluative
keywords
Question Number
Answer Mark
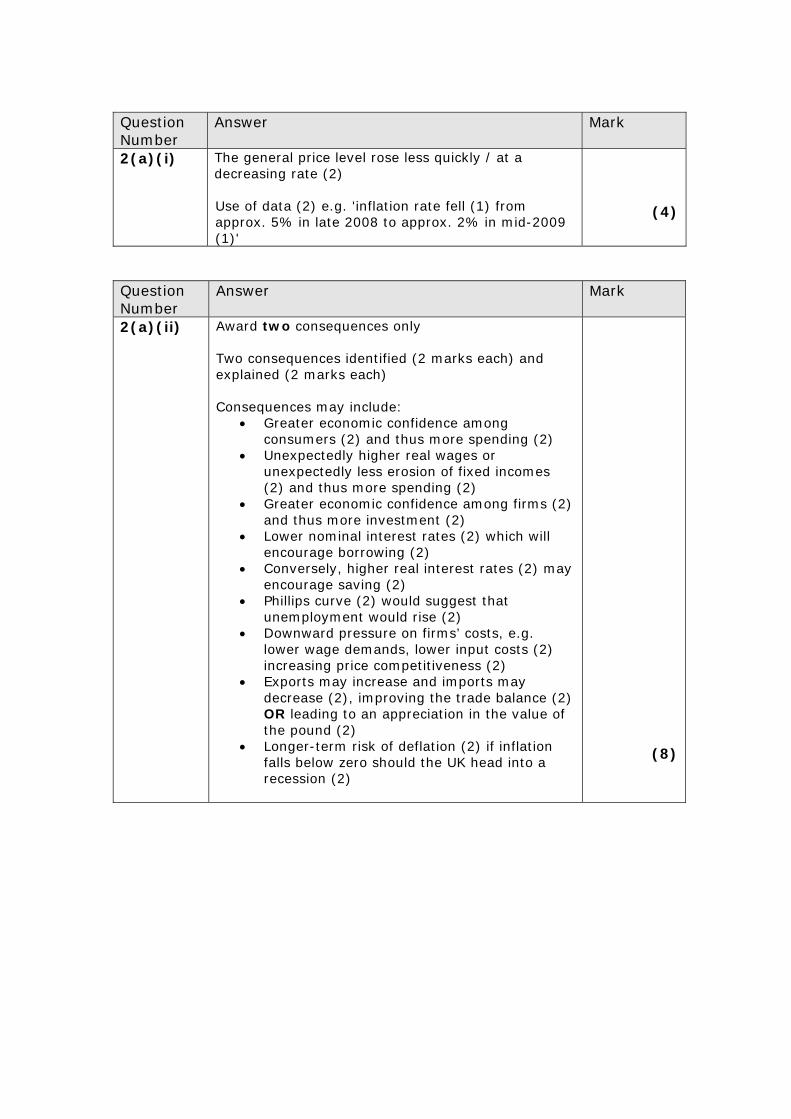
2(a)(i) The general price level rose less quickly / at a decreasing rate (2) Use of data (2) e.g. 'inflation rate fell (1) from approx. 5% in late 2008 to approx. 2% in mid-2009 (1)'
(4)
Question Number
Answer Mark
2(a)(ii) Award two consequences only Two consequences identified (2 marks each) and explained (2 marks each) Consequences may include:
• Greater economic confidence among consumers (2) and thus more spending (2)
• Unexpectedly higher real wages or unexpectedly less erosion of fixed incomes (2) and thus more spending (2)
• Greater economic confidence among firms (2) and thus more investment (2)
• Lower nominal interest rates (2) which will encourage borrowing (2)
• Conversely, higher real interest rates (2) may encourage saving (2)
• Phillips curve (2) would suggest that unemployment would rise (2)
• Downward pressure on firms’ costs, e.g. lower wage demands, lower input costs (2) increasing price competitiveness (2)
• Exports may increase and imports may decrease (2), improving the trade balance (2) OR leading to an appreciation in the value of the pound (2)
• Longer-term risk of deflation (2) if inflation falls below zero should the UK head into a recession (2)
(8)

Question Number
Answer Mark
2(a)(iii) KAA 8 marks Up to 4 marks for:
• Definition of monetary policy (2) • How the Monetary Policy Committee use
interest rates to meet the inflation target (2) Up to 8 marks for: Identify some criterion that might indicate success (2 marks each) and further explanation or reference to data (2 marks each) Award two criteria only
• Looking at Figure 1, out of tolerance but not out of control
• Inflation expected to be back around target by the end of 2012
• Recent inflation has been caused by cost push inflation outside the Bank of England’s control
• Lack of business/consumer confidence has reduced the effectiveness of monetary policy outside of the Bank of England's control
• Has been successful in helping the economy to recover from recession
• Looking at Figure 1 no deflation in 2009 / vicious cycle of deflation seems to have been avoided in 2009 / inflation has not fallen below the 1% floor Named target has been clear 2% inflation (tolerance +/- 1% point)
• Transparency and openness maintained (open letters to Chancellor from 2007)
• MPC remains operationally independent with control of interest rates and free of political interference
• Reduced inflationary expectations which is self-fulfilling to some extent
• Maintained financial stability in the banking sector
• Reward discussion of more recent problems Candidates may consider arguments for and against UK monetary policy being effective. The development of one point of view constitutes KAA and the alternative view is considered as evaluation. Evaluation - (1 x 4 marks or 2 x 2 marks). Factors might include:
• Looking at Figure 1 generally out of tolerance • Inflation rate as measured by RPI was even
more volatile • Very little control over cost push inflation • Interest rates and QE are only part of the
solution

• Financial stability to some extent has taken priority, and uncertainty of effect of Quantitative Easing
• Other factors such as weak unions have prevented the wage price spiral, not the operation of monetary policy
• Opportunity cost of pursuing interest rate/QE policy
• Time lags
(12)
Question Number
Answer Mark
2(b)(i) Up to 2 marks for each component • Health (1) life expectancy at birth (1) • Education (1) expected years of schooling of a
child of school-going age OR mean years of schooling of 25 year olds (1)
• Living standards/income (1) Gross National Income per capita PPP US dollars. (Accept Gross National Income per capita) (1)
Dimension Pre-2010
indicator 2010 onwards
indicator Health Life expectancy
at birth Life expectancy at birth
Education Adult literacy rate and school enrolment rates (for primary through university years)
Mean of years of schooling for adults aged 25 years and expected years of schooling for children of school entering age
Living standards / income
GDP per capita (PPP$)
GNI per capita (PPP$)
(6)
Level Mark Descriptor Level 3 9-12 2 convincing criteria with at least one evaluative point Level 2 5-8 2 convincing criteria with no further analysis or explanation, or 1
convincing criterion with some good analysis but no evaluative point; 1 or 2 less-convincing criterion with some evaluation
Level 1 1-4 Identification of relevant criterion with or without brief evaluative keywords

Question Number
Answer Mark
2(b)(ii) KAA 8 Award two difficulties only Two difficulties identified (2 marks each) and explained (2 marks each) Difficulties may include:
• Which index to use, e.g. GDP per capita, HDI etc.
• Inaccuracies/problems in information gathering / use of population samples/estimates etc.
• Differences in rankings between the two indices given in Figure 2 (e.g. Spain and UK)
• Problems of accuracy of measuring output due to shadow or underground economy
• The value of non-marketed output including work done in the home
• Inequality in the distribution of income and wealth
• Regional variation in income, health and education
• Leisure and working hours • Variation between current and future standards
of living caused by imbalances between consumption and investment
• Improvements in life expectancy/education aren’t accounted for in some measures (such as GDP per capita)
• Innovation and the development of new products
• Environmental considerations • Defence expenditure • Limitations of the purchasing power parity
adjustment • Local indirect taxes and tariffs cause differences
in the cost of living Reference to data (2) NB Do not award references to differences in population size or costs of living.
(8)

Question Number
Answer Mark
2(b)(iii)*
KAA - 8 marks (4 marks for diagram, 4 marks for explanation and analysis) Diagram demonstrating rightward shift of AD and/or AS (4); correct shifts in lines (1), lines labelled (1), axes labelled (1), equilibria labelled (1). (Note: diagrams where a single shift is incorrect receive no marks. If one shift is correct and the other wrong then award 2 marks assuming the rest of the diagram is labelled correctly) Up to 4 marks: Each effect identified (2) and explained (2)
• Price level should fall or remain the same if shifts cancel each other out, or rise if AD shifts only/more
• Real output should rise • Increase in productivity • Increase in competitiveness of UK goods and
services, leading to an improvement in the Balance of Payments on current account
• Reduction in unemployment / increased occupational mobility of labour
• Effects on the government budget position • Improvement in the UK's HDI
NB: if no AS/AD diagram, award a maximum of 4 KAA marks Evaluation - 4 marks (1 x 4 or 2 x 2)
• Spending might not affect quality of output – e.g. managerial expenses may absorb expenditure
• Effects depend on the type/level of education improved
• Time lag • The effects depends on the shape of the AS
curve • Reduction in government spending elsewhere
(opportunity cost) • Increase in taxation elsewhere may have an
effect on incentives • Other determinants of AD such as exchange
rates changing - ceteris paribus may not hold • Long run and short run effects • May have no effect on price level if shift in AD
cancels out the effect on AS Quality of written communications will be assessed in this question based on the candidate’s ability:
• To present an argument and conclude on the basis of that argument
• To organise information clearly and coherently • To use economic vocabulary appropriately
(12)
• To use grammar, spelling and punctuation appropriately
Question Number
Answer Mark
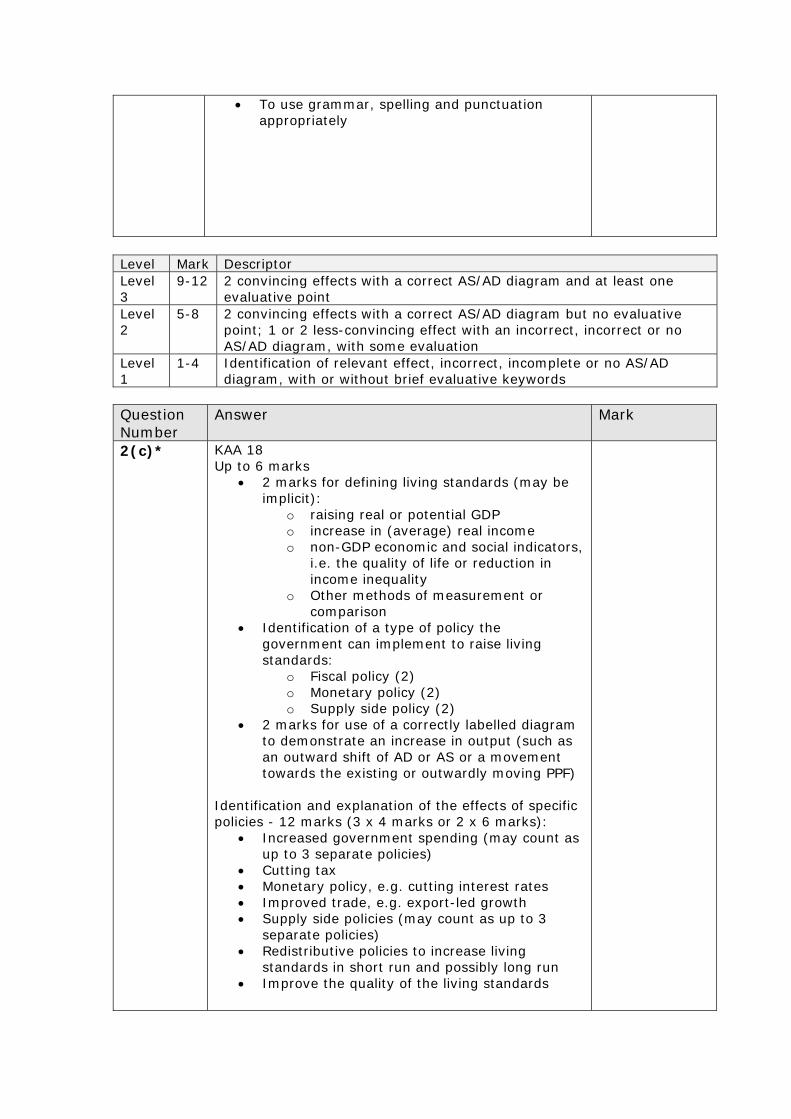
2(c)* KAA 18 Up to 6 marks
• 2 marks for defining living standards (may be implicit):
o raising real or potential GDP o increase in (average) real income o non-GDP economic and social indicators,
i.e. the quality of life or reduction in income inequality
o Other methods of measurement or comparison
• Identification of a type of policy the government can implement to raise living standards:
o Fiscal policy (2) o Monetary policy (2) o Supply side policy (2)
• 2 marks for use of a correctly labelled diagram to demonstrate an increase in output (such as an outward shift of AD or AS or a movement towards the existing or outwardly moving PPF)
Identification and explanation of the effects of specific policies - 12 marks (3 x 4 marks or 2 x 6 marks):
• Increased government spending (may count as up to 3 separate policies)
• Cutting tax • Monetary policy, e.g. cutting interest rates • Improved trade, e.g. export-led growth • Supply side policies (may count as up to 3
separate policies) • Redistributive policies to increase living
standards in short run and possibly long run • Improve the quality of the living standards
Level Mark Descriptor Level 3
9-12 2 convincing effects with a correct AS/AD diagram and at least one evaluative point
Level 2
5-8 2 convincing effects with a correct AS/AD diagram but no evaluative point; 1 or 2 less-convincing effect with an incorrect, incorrect or no AS/AD diagram, with some evaluation
Level 1
1-4 Identification of relevant effect, incorrect, incomplete or no AS/AD diagram, with or without brief evaluative keywords

Reward use of diagrams (maximum of 2 marks each if they develop analysis) Evaluation - 12 marks (2 x 6 marks or 3 x 4 marks) factors might include:
• Different approaches in developed and developing countries
• Comparison of Spain and UK, i.e. UK has a higher per capita income but lower HDI
• Depends on elasticity of AS when AD shifts • Supply side policies are ineffective when AD is
very low • Opportunity cost of government spending • Many economies are currently not in a position
to finance expansionary fiscal or supply side policies
• Time lag and implementation lags • Other things are not equal – e.g. depends on
global economic changes • Magnitude of multiplier effect • Other negative side effects of policies, e.g.
some policies may increase GDP but reduce living standards in terms of inequality/environment.
Quality of written communications will be assessed in this question based on the candidate’s ability:
• To present an argument and conclude on the basis of that argument
• To organise information clearly and coherently • To use economic vocabulary appropriately • To use grammar, spelling and punctuation
appropriately
(30)
Level Mark Descriptor Level 4 25-30 2 or 3 convincing policies with at least two evaluative points (an
evaluation points is worth up to a maximum of 6 marks Level 3 19-24 2 or 3 convincing policies with at least one evaluative point (mark
cap to 18 if no evaluation) Level 2 7-18 2 or 3 convincing policies with no evaluative point; 1 or 2 less-
convincing policies with some evaluation Level 1 1-6 Identification of relevant points with or without brief evaluative
keywords

Further copies of this publication are available from
Edexcel Publications, Adamsway, Mansfield, Notts, NG18 4FN
Telephone 01623 467467
Fax 01623 450481 Email [email protected]
Order Code US034385 January 2013
For more information on Edexcel qualifications, please visit our website www.edexcel.com
Pearson Education Limited. Registered company number 872828 with its registered office at Edinburgh Gate, Harlow, Essex CM20 2JE