
Mark Scheme (Results) January 2012...Mark Scheme (Results) January 2012 GCE Geography (6GE03) Paper...
22
Mark Scheme (Results) January 2012 GCE Geography (6GE03) Paper 01 CONTESTED PLANET
Transcript of Mark Scheme (Results) January 2012...Mark Scheme (Results) January 2012 GCE Geography (6GE03) Paper...

Mark Scheme (Results)
January 2012
GCE Geography (6GE03) Paper 01 CONTESTED PLANET

Edexcel and BTEC Qualifications
Edexcel and BTEC qualifications come from Pearson, the world’s leading learning company. We provide a wide range of qualifications including academic, vocational, occupational and specific programmes for employers. For further information, please call our GCE line on
0844 576 0025, our GCSE team on 0844 576 0027, or visit our qualifications website at www.edexcel.com. For information about our BTEC qualifications, please call 0844 576
0026, or visit our website at www.btec.co.uk. If you have any subject specific questions about this specification that require the help of a
subject specialist, you may find our Ask The Expert email service helpful.
Ask The Expert can be accessed online at the following link: http://www.edexcel.com/Aboutus/contact-us/
Alternatively, you can speak directly to a subject specialist at Pearson about Edexcel qualifications. Our dedicated Geography subject adviser Jonathan Wolton will be able to help you on 020 7190 4165.
Pearson: helping people progress, everywhere
Our aim is to help everyone progress in their lives through education. We believe in every
kind of learning, for all kinds of people, wherever they are in the world. We’ve been
involved in education for over 150 years, and by working across 70 countries, in 100
languages, we have built an international reputation for raising achievement through
innovation in education. Find out more about how we can help you and your students at:
www.pearson.com/uk
January 2012
Publications Code UA030494
All the material in this publication is copyright
© Pearson Education Ltd 2012

Question Number
Question
1a Explain the classification of the selected energy resources shown (10)
Indicative content
Figure 1 is a triangular graph without a numerical scale (therefore precision not
possible). The four energy resources shown contrast as one is a fossil fuel, one renewable (wind) and the other two recyclable (to different degrees). Candidates are expected to provide reasons for the soc/eco/env positioning of the energy
types but many will also question the position. The may refer to the contrasting views of different ‘players’ as part of their answer.
They occupy their respective positions because: • Nuclear power produces no emissions (S02, CO2) and is seen by some as
environmentally friendly (could argue that due to waste and life-cycle emissions the position is wrong); socially nuclear is opposed by some on safety grounds ( Fukushima, Chernobyl); economically it is costly to build and to deal with waste
and decommissioning e.g. UK nuclear. • Coal is a ‘dirty’ fuel as it is generally not very energy efficient per unit of CO2
produced + emits acid rain causing gases; it is a cheap fuel due to its abundance; increasingly (at least in the developed world) it is perceived as a dirty ‘fuel of the past’. Health concerns, mining safety for social.
• Wind power is green in terms of emissions, but there are social / environmental NIMBY issues if the turbines are onshore (much less opposition offshore); wind is
still relatively expensive and is often subsidised to make it competitive. • Biofuels are in theory green / carbon neutral but some might argue that over the
full life-cycle of transport and processing they are much less so; they are cheap
and can compete with oil but there are issues with taking up land that could grow crops to feed people.
Expect some mention of all 4 energy resources, but only an overall soc/eco/env balance. Credit other acceptable explanations. Max 7 if only 1 or 2 energy resources are referred to.
NB: The key example in Figure 1 incorrectly indicates that coal’s social acceptability is
HIGH on Figure 1, whereas it is LOW on Figure 1. Accept explanations based on HIGH social acceptability of coal (providing many jobs, low risk / known technology, low cost keeps bills down) as well as LOW. Reward quality of explanation; there is no ‘correct’
view especially for social and environmental aspects.
Level Mark Descriptor
Level 1 1-4 Partial response in terms of eco/soc/env and energy resources; generalised comments lacking explanation. Structure is poor or
absent. Geographical terminology is rarely used with accuracy. There are frequent grammar, punctuation and spelling errors.
Level 2 5-7 Response with some range, details and explanations; may be
unbalanced. Structure is satisfactory. Geographical terminology is used with some accuracy. There are some grammar, punctuation and
spelling errors.
Level 3 8-10 Balanced with a range of comments which explain, and may question, the classification of the energy resources. May use examples.
Structure is good. Explanations are always clear. Geographical terminology is used with accuracy. Grammar, punctuation and spelling errors are rare

Question Number
Question
1b Using named examples, evaluate the economic and political impacts of disruption to energy supply pathways. (15)
Indicative content
Energy supply pathways include any movement of fossil fuels or electricity from supplier to consumer.
This includes pipelines for oil and gas, e.g. across Europe and Central Asia, or Alaska as well as offshore to onshore. Also electricity grids and transboundary grids such as the UK
interconnectors to France and Belgium. It also includes shipping routes for oil, coal, uranium and LNG. Pathways can also be internal, such as the disruption caused by the
fuel price protests in the UK in 2000. Disruptions can occur for a number of reasons such as accidents, e.g. the 2010 Gulf oil spill (and possible knock-on effects for wider offshore drilling), natural hazards e.g.
hurricane Katrina, Japanese tsunami; political and economic decisions such as the Ukraine / Russia disputes in 2006 and 2009, terrorist attacks and piracy especially at
choke points. The current Iran situation and the Straits of Hormuz might be referred to. Price hikes such as the 1973 oil crisis or recently in Nigeria can also effectively disrupt supplies.
Impacts include: Economic
• Oil price has spikes contributing to rising costs and even recession. • Increased costs for industry, which leads to inflation and rising prices. People
spend proportionately more on energy and less on other goods. Fuel / energy
poverty. • Slow down in development, e.g. in South Africa and India due to lack of electricity
supply (poor long term planning); deterring investment. • The need to develop alternative routes, e.g. the Nabucco and Nord-stream
pipelines.
Political • People may take to the streets if they feel they cannot get, or afford, energy, e.g.
fuel protests in UK 2000 • Undermining of the authority of governments. • Escalating conflict (diplomatic or actual) over energy suppliers, e.g. Russia and
Ukraine. • Pressing need to search for new sources e.g. new pipelines, domestic resources
which could increase conflict (ANWR, biofuels, wind) • Some might argue that because of the risks, energy prices are kept artificially low
by subsidies e.g. in India, the Middle East.
Better answers may make judgments about how serious the impacts are e.g. political –v- economic, or when disruptions are local/ internal –v-international.
Credit other impacts and examples.

Level Mark Descriptor
Level 1 1-4 One or two sensationalist impacts with factually unsound support. Structure is poor or absent. Explanations are over-simplified and lack
clarity. Geographical terminology is rarely used with accuracy. There are frequent grammar, punctuation and spelling errors.
Level 2 5-8 Some impacts, but unbalanced and lacking in detail and use of examples. Structure is satisfactory. Political and economic not clear, or
one only. Explanations are clear, but there are areas of less clarity. Geographical terminology is used with some accuracy. There are some grammar, punctuation and spelling errors.
Level 3 9-12 A range of impacts, both economic and political implied but unbalanced. Implies evaluation; some examples. Structure is good. Explanations are
always clear. Geographical terminology is used with accuracy. Grammar, punctuation and spelling errors are rare.
Level 4 13-15
Sound evaluation of impacts using examples to support; balanced between political and economic. Carefully structured. Explanations are always clear. Geographical terminology is used with accuracy.
Grammar, punctuation and spelling errors are very rare.
Question Number
Question
2a Suggest reasons for the changes to water supply quality between 1990 and 2008. (10)
Indicative content
Figure 2 shows 4 sets of data for 3 regions – SSA appears twice, as
‘all’ and ‘urban’. The left hand side of each graph shows data for 1990 and the right for 2008, with the trend in between.
Note that the starting points in 1990 are very different, as are the trends.
• LAC: highest levels of piped water in 1990, rising by 12% by 2008 suggesting an improving water supply situation with 4/5ths of people now with piped supply. Reasons: relatively
developed region with advancing economy; improvements being made to megacities (slum schemes) and spread of formal
water network. • E Asia: Dramatic improvement in piped water from 55% to
83% (+28%) and dramatic decline in unimproved. Reasons:
likely to be related to the ‘rise of China’ and the benefits of economic growth and planned urbanisation; some might relate
to population control growth, i.e. one child policy making it easier to improve water supply. Infrastructure investment e.g.
South North transfer. • SSA: no improvement in piped water to speak of, but a 10%
gain in improved water supply: Reasons: the work of NGOs
and self-help (WaterAid); poverty might be cited as a reason for the limited overall progress. Many people are rural and
therefore rely on rivers and ponds. • SSA Urban: dramatic decline in piped water, so falling water
quality overall. Reasons: rapid, unplanned urbanisation in
megacities, poverty, lack of government action and reliance on (expensive) water vendors.
There will be other acceptable reasons which should be credited. Max 7 if only two bars are discussed.

Level Mark Descriptor
Level 1 1-4 Descriptive response with a few general reasons given; unbalanced and focused on one or two parts of Figure. Structure is poor or
absent. Geographical terminology is rarely used with accuracy. There are frequent grammar, punctuation and spelling errors.
Level 2 5-7 Range of reasons given but of variable quality / depth; some balance
but may tend to repeat. Structure is satisfactory. Geographical terminology is used with some accuracy. There are some grammar,
punctuation and spelling errors.
Level 3 8-10 Range of different reasons for the trends with some detail. May use examples, e.g. of megacities. Structure is good. Explanations are
always clear. Geographical terminology is used with accuracy. Grammar, punctuation and spelling errors are rare
Question Question
2b Evaluate the consequences, for different players, of an increasing gap between water supply and demand. (15)
Indicative content
Players refers to users of water i.e. consumers in the developed and developing world, water companies, governments, businesses –possibly
even the environment. Candidates might take a developed or developing world approach, or both. Note that consequences can be positive or
negative. The ‘gap’ implies rising demand and static, or even falling, supply, and therefore increasing pressure on water supplies.
• For people in the developed world the result is likely to be rising costs and possibly restrictions on supply, especially where use is
considered a luxury, e.g. swimming pools; short term hose-pipe bans and longer term policies such as metering or conservation gardening etc.
• Some consumers might be insulated by technology, e.g. desalinisation plants in the Middle East.
• For developing world consumers the consequences could be spiralling costs and severe shortages, i.e. a water crisis in locations
such as India or parts of Africa. Farmers could suffer direct losses. Costs from water vendors in urban area.
• Increased demand for NGOs to step in and try to improve water
supplies for the most in need. • Increased conflict between governments if transboundary issues
are involved plus increased pressure to spend vast sums of money to ensure supply, e.g. in China. There are lots of possible examples here.
• Some might argue that water companies are likely to do well even if supply and demand do not match as they can charge more
and supply less. Be flexible as there are a wide range of possible players that could be mentioned. Some might take a winners and losers approach.
Better answers should make an evaluation / judgment about the consequences. This could be that the consequences will be worse for some
players than others, or that a type of consequence will be worse e.g. the social impacts on health, or that some regions will be worse hit. Beneficial consequences to some players –v- negative ones to others.

Level Mark Descriptor
Level 1 1-4 A few impacts linked to some generalised players with little depth.
Structure is poor or absent. Explanations are over-simplified and lack clarity. Geographical terminology is rarely used with accuracy. There are
frequent grammar, punctuation and spelling errors.
Level 2 5-8 Some range of players and consequences but less detail and likely to be
narrow. Structure is satisfactory. Explanations are clear, but there are areas of less clarity. Geographical terminology is used with some accuracy. There are some grammar, punctuation and spelling errors.
Level 3 9-12 Covers a range of players and consequences in some detail; attempt to use examples; implied evaluation. Structure is good. Explanations are
always clear. Geographical terminology is used with accuracy. Grammar, punctuation and spelling errors are rare.
Level 4 13-15
Genuine evaluation with reference to a range of players and detailed consequences. Likely to be supported by examples and at the top end addresses the ‘increasing’ gap. Carefully structured. Explanations are
always clear. Geographical terminology is used with accuracy. Grammar, punctuation and spelling errors are very rare.
Question
Number
Question
3a Explain how physical factors influence the distribution of
biodiversity shown (10)
Indicative content
The map shows plant species diversity; many candidates will simply refer to ‘biodiversity’ and not focus on plants specifically and this is acceptable. If examples of marine ecosystems are used, accept this if
it makes sense in the context of the map. Expect some description to appear within the explanations. Be wary of ‘at the top / in the middle’
style answers as there are some named places and latitude on the map. Answers could be structured by factors influencing biodiversity or by
the level of biodiversity. • Limiting factors: extreme regions where limiting factors
restrict growth, i.e. extreme cold, aridity and lack of sunlight in Antarctic, the Arctic, Tibetan plateau and extreme aridity in central Australia. Species need to be specially adapted to
survive in the hostile environment. • Perfect conditions for growth: essentially close to the
equator where heat, light and moisture are always available and seasonality is minimal; conditions maximise biomass and
stratification producing a wide range of niches and continual growth. Some might see coasts (e.g. Australia) as having better conditions due to rainfall.
• Endemism: unique species have evolved on islands in Indonesia, PNG and Philippines so levels exceed 5000 species
10,000 km2 • Altitude: rapid change in temp / rainfall over short distance
produces many different ecosystems all with different species.
• Size and age – e.g. how long an area has been undisturbed; other factors may be mentioned.
Answers should focus on physical factors, as the pattern is the natural one.

Level Mark Descriptor
Level 1 1-4 A few generalised ideas on one or two factors poorly related to the map; may drift into human factors. Structure is poor or absent. Geographical terminology is rarely used with accuracy. There are
frequent grammar, punctuation and spelling errors.
Level 2 5-7 Some explanations for some of the distribution with a reasonable understanding of some physical factors. Structure is satisfactory.
Geographical terminology is used with some accuracy. There are some grammar, punctuation and spelling errors.
Level 3 8-10 A range of explanations linked to Figure 3 with a good understanding
of the physical factors which influence biodiversity. Structure is good. Explanations are always clear. Geographical terminology is used with
accuracy. Grammar, punctuation and spelling errors are rare
Question
Number
Question
3b With reference to a named global ecosystem, assess the global
and local value of its goods and services (15)
Indicative content
Global ecosystems include coral reefs, any type of forest or grassland,
and oceans. There should be some reference to a chosen biome rather than simply one location. There should be a clear separation of goods
and services, but some candidates may refer to regulating and provisioning services (goods) which is equally acceptable, or the MEA provisioning (goods), regulating, cultural and supporting services.
Goods might tend to be seen as more locally important, whereas services might be more global, but it will depend on the ecosystem
chosen. Services might include:
• Flood control / coastal protection
• Carbon sequestration • Climate regulation
• Cultural / aesthetic services (linked to tourism) Goods could be:
• Food (hunting, fishing) • Building materials, timber • Genetic material for crops / medicines
• Cultural goods Be wary of goods that involve the destruction of the ecosystem in
question, e.g. HEP dams, mining etc as these actually value land not the ecosystem which is destroyed. Expect specific links to the chosen ecosystem plus an assessment of
importance at both local and global scales Better answers should assess local and global value i.e. which is more
important? This could be achieved by arguing for local or global, or goods versus services, for instance.
Max 12 for one location e.g. Galapagos. If more than one global ecosystem / biome, credit the best.

Level Mark Descriptor
Level 1 1-4 Description of one or two goods and services; may not be clear on
either. Structure is poor or absent. Explanations are over-simplified and lack clarity. Geographical terminology is rarely used with accuracy. There
are frequent grammar, punctuation and spelling errors.
Level 2 5-8 Outlines some goods and/or services but limited on local/ global and
lacks meaningful assessment. Structure is satisfactory. Explanations are clear, but there are areas of less clarity. Geographical terminology is used with some accuracy. There are some grammar, punctuation and
spelling errors.
Level 3 9-12 Explains a range of goods and services and links to local and global value
with some implied assessment; clear on the global ecosystem chosen. Structure is good. Explanations are always clear. Geographical
terminology is used with accuracy. Grammar, punctuation and spelling errors are rare.
Level 4 13-
15
Sound assessment of goods and services and value at both scales, well
supported by examples. Carefully structured. Explanations are always clear. Geographical terminology is used with accuracy. Grammar,
punctuation and spelling errors are very rare.

Question Number
Question
4a Using Figure 4 and your own knowledge, explain the advantages and disadvantages of inward investment for developing countries.
(10)
Indicative content
Figure 4 shows inward investment by 5 countries (the BRICs plus South Korea) into 5 sub-Saharan African countries. Responses should focus on the adv / disadv of this investment but should also use other examples.
Answers could be structured using soc/eco/env or similar structures. • A general observation might be that few of the countries are politically stable and
political and economic pressure from a BRIC may not improve matters. • The investors in general may be viewed as neo-colonial
• The people may feel their country is being sold to the highest bidder; alternatively the jobs and investment by ‘new’ countries may be viewed more positively than that from the EU/USA.
• Credit reference to the providers of the investment if they are developing countries i.e. China, Brazil & India.
Fig 4 Advantages Disadvantages
Farmland,
Sudan
Bringing un/under used land into
production; jobs
Exports of food from a food
insecure region could be seen as unethical; may refer to ‘land grabs’.
Flower growing, Ethiopia
Fairly high value export; likely to provide many processing jobs (as it does in Kenya)
Land could be used for food Profits go to India Exploitation of workers, low wages
Copper and
Cobalt, DRC
Very large investment that DRC probably could not afford on its
own. Technical mining expertise
brought
Very valuable raw materials leaving the country with minimal
processing; China gains the value-added
Jobs may go to Chinese migrants (they often do)
Agr research, Ghana
Might be seen as more positive and less exploitative than the others as research could benefit
Ghana; state owned may see less profit motivated than private
Motives might be questioned
Gas, Nigeria
Royalties and some income It is a joint-venture and some
technology transfer is likely.
Exporting the country’s energy wealth; little profit and few jobs;
Rivers State / Ogoni people may be mentioned
For L3 it is not necessary to comment on every investment but some range is required, i.e. 3 of the investments or more; it is possible to make similar points about different
investments. Good candidates are likely to come to a conclusion.

Level Mark Descriptor
Level 1 1-4 Unbalanced and a few general comments, most likely on
disadvantages. Structure is poor or absent. Geographical terminology is rarely used with accuracy. There are frequent
grammar, punctuation and spelling errors.
Level 2 5-7 Some range of explanations with some disadvantages and advantages but may be unbalanced, with some details. Structure is
satisfactory. Geographical terminology is used with some accuracy. There are some grammar, punctuation and spelling errors.
Level 3 8-10 Good range of explanations and balance between advantages and
disadvantages with some detail; likely to move towards an overview and uses own knowledge. Structure is good. Explanations are always
clear. Geographical terminology is used with accuracy. Grammar, punctuation and spelling errors are rare
Question Number
Question
4b Assess the global environmental and geopolitical implications of the rise of the BRICs (Brazil, Russia, India and China) (15)
Indicative content
Accept discussion of the 4 BRICS, plus some candidates may see the question from the
point of view of implications for the developed world as their power slides (there is no requirement for this). There should be some global element, i.e. an overview of discussion of specific global
problems, e.g. carbon emissions. Implications could be positive or negative.
Geopolitical Environmental
• Increasingly regional world, i.e. multi-polar spheres replace today’s
uni-polar world; possible rise in regional tensions, e.g. China and India. Unstable multi-polar world.
• Shifts in military balance of power e.g. Chinese expansion in Pacific.
• Changes of membership within global IGOs such as the UN or World Bank to reflect shifts in
power • G8 power giving way to G20 or G2
possibly linked to debt/ economic crisis.
• A bi-polar USA / China world might be argued for
• Renewed leadership on global environmental problems.
• Falling costs of renewable and environmental technologies due to innovation in the BRICs Increased
pressure on a wide range of resources as consumption in the
BRICs rises. • Increasing carbon emissions and
therefore global warming
• Possible resource crises, e.g. water, rising demand for land / food.
Better answers should provide an assessment / judgment; this could be in the form of
whether geopolitical or environmental implications are likely to be more significant; alternatively it could be in terms of ‘winners’ and ‘losers’ e.g. China –v- USA/ EU.
Another possibility is to argue the differing seriousness of specific implications. Max 10 for only 1 country is mentioned.

Level Mark Descriptor
Level 1 1-4 Unbalanced; generalised comments on one or two issues, e.g. global warming. Structure is poor or absent. Explanations are over-simplified
and lack clarity. Geographical terminology is rarely used with accuracy. There are frequent grammar, punctuation and spelling errors.
Level 2 5-8 Some range of issues: geopolitical and environmental not clear, or one only: lacking in detail. Structure is satisfactory. Explanations are
clear, but there are areas of less clarity. Geographical terminology is used with some accuracy. There are some grammar, punctuation and
spelling errors.
Level 3 9-12 A range of geopolitical and environmental issues implied with some
details, some link to global scale and implied assessment. Structure is good. Explanations are always clear. Geographical terminology is used with accuracy. Grammar, punctuation and spelling errors are rare.
Level 4 13-15 Sound assessment of a range of geopolitical and environmental implications which is balanced. Carefully structured. Explanations are
always clear. Geographical terminology is used with accuracy. Grammar, punctuation and spelling errors are very rare.
Question Number
Question
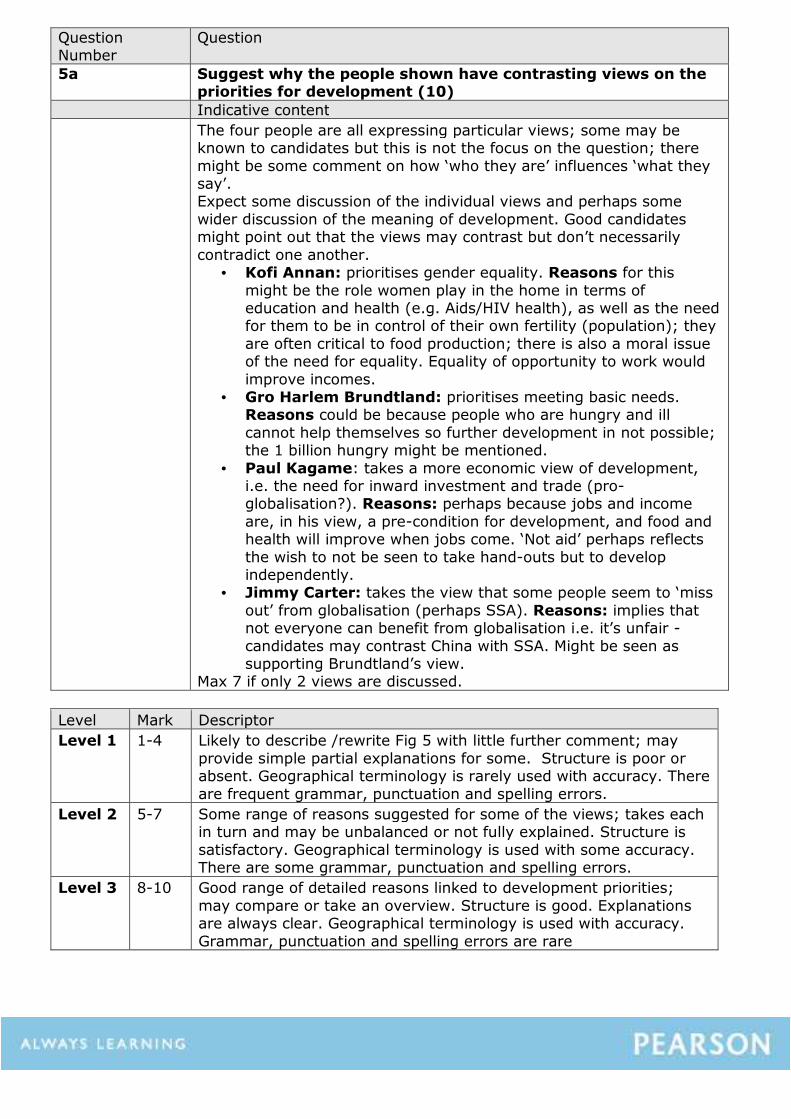
5a Suggest why the people shown have contrasting views on the priorities for development (10)
Indicative content
The four people are all expressing particular views; some may be known to candidates but this is not the focus on the question; there
might be some comment on how ‘who they are’ influences ‘what they say’. Expect some discussion of the individual views and perhaps some
wider discussion of the meaning of development. Good candidates might point out that the views may contrast but don’t necessarily
contradict one another. • Kofi Annan: prioritises gender equality. Reasons for this
might be the role women play in the home in terms of education and health (e.g. Aids/HIV health), as well as the need for them to be in control of their own fertility (population); they
are often critical to food production; there is also a moral issue of the need for equality. Equality of opportunity to work would
improve incomes. • Gro Harlem Brundtland: prioritises meeting basic needs.
Reasons could be because people who are hungry and ill
cannot help themselves so further development in not possible; the 1 billion hungry might be mentioned.
• Paul Kagame: takes a more economic view of development, i.e. the need for inward investment and trade (pro-globalisation?). Reasons: perhaps because jobs and income
are, in his view, a pre-condition for development, and food and health will improve when jobs come. ‘Not aid’ perhaps reflects
the wish to not be seen to take hand-outs but to develop independently.
• Jimmy Carter: takes the view that some people seem to ‘miss
out’ from globalisation (perhaps SSA). Reasons: implies that not everyone can benefit from globalisation i.e. it’s unfair -
candidates may contrast China with SSA. Might be seen as supporting Brundtland’s view.
Max 7 if only 2 views are discussed.
Level Mark Descriptor
Level 1 1-4 Likely to describe /rewrite Fig 5 with little further comment; may
provide simple partial explanations for some. Structure is poor or absent. Geographical terminology is rarely used with accuracy. There
are frequent grammar, punctuation and spelling errors.
Level 2 5-7 Some range of reasons suggested for some of the views; takes each in turn and may be unbalanced or not fully explained. Structure is
satisfactory. Geographical terminology is used with some accuracy. There are some grammar, punctuation and spelling errors.
Level 3 8-10 Good range of detailed reasons linked to development priorities;
may compare or take an overview. Structure is good. Explanations are always clear. Geographical terminology is used with accuracy.
Grammar, punctuation and spelling errors are rare

Question Number
Question
5b Using named examples, examine the extent to which the development gap occurs within countries as well as globally.
(15)
Indicative content
Answers should consider both the global gap and local / national scale
gaps. The global gap might be discussed by considering wealth or HDI at a global scale, i.e. the North –South divide; better candidates are
likely to see more subtle patterns involving NICs and perhaps Sub-Saharan Africa.
Within country / more local scale ‘gaps’ might focus on very localised differences but also on gaps which are essentially national in scale:
• Urban differences in megacities, contrasting recent slums with areas of middle class and elite housing.
• Urban versus rural contrasts, e.g. in China or India; core versus periphery concepts
• Geographical divides within countries, i.e. north-south, coastal
versus interior • Gaps based on gender
• Gaps based on caste, race or religion All of these localised gaps are present in the spec. Examples could be
from countries at any level of development.
Credit candidates that argue that sometimes these local gaps have been successfully reduced, e.g. Kerala, or self-help housing schemes in the developing world, or China’s efforts to develop its interior.
Better answers should examine the extent of the development gap at
the two scales. Evaluative comments could take the form of arguing that there is no gap at a global scale, but more of a continuum. Could argue the gap in now between LDCs and the rest of the world. Local
gaps could be argued as more significant (or less) or particular differences e.g. gender or race as especially important.

Level Mark Descriptor
Level 1
1-4 Generalised statements relating to the north-south divide / other ‘gaps’, with little or no support. Structure is poor or absent. Explanations are
over-simplified and lack clarity. Geographical terminology is rarely used with accuracy. There are frequent grammar, punctuation and spelling errors.
Level 2
5-8 Some ‘gaps’ outlined in a descriptive account; likely to be unbalanced and lacking examples; scale may be unclear. Structure is satisfactory.
Explanations are clear, but there are areas of less clarity. Geographical terminology is used with some accuracy. There are some grammar,
punctuation and spelling errors.
Level
3
9-12 Some examination of development gaps, with some details but examples
are not fully developed. Structure is good. Explanations are always clear. Geographical terminology is used with accuracy. Grammar, punctuation and spelling errors are rare.
Level 4
13-15
Sound examination of the extent to which local / country gaps exist within a global framework; detailed exemplification. Carefully structured.
Explanations are always clear. Geographical terminology is used with accuracy. Grammar, punctuation and spelling errors are very rare.
SECTION B
Question
Number
Question
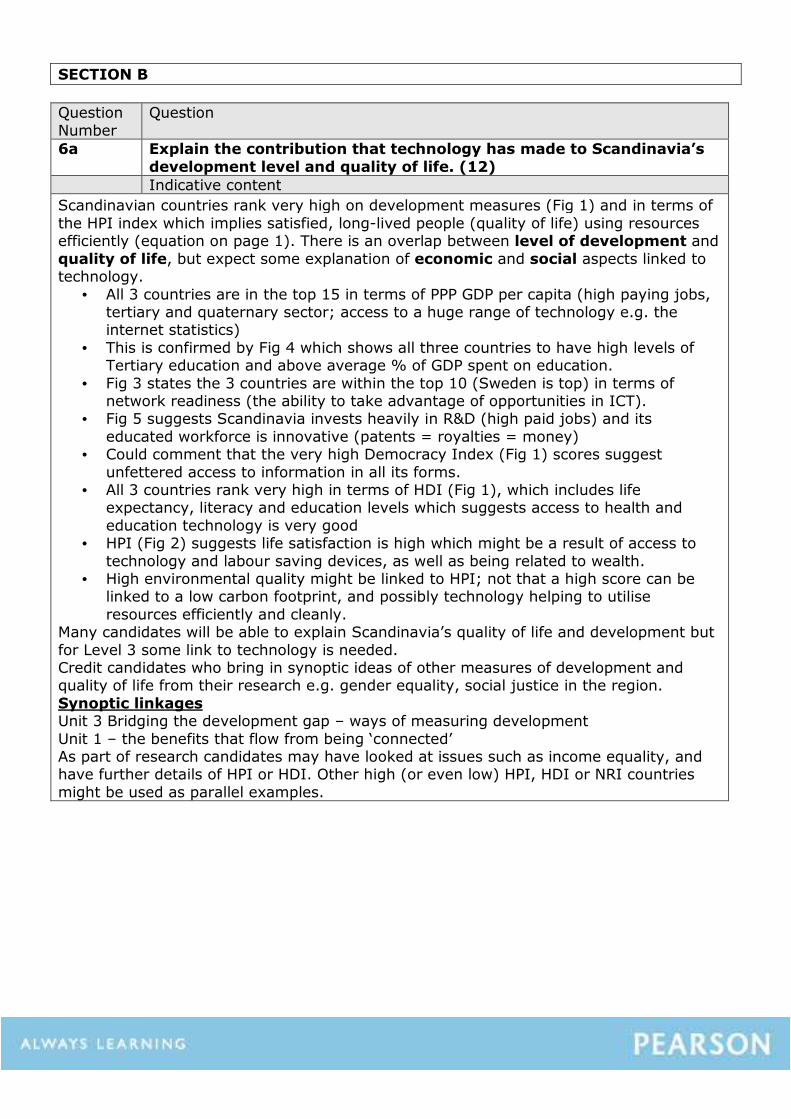
6a Explain the contribution that technology has made to Scandinavia’s
development level and quality of life. (12)
Indicative content
Scandinavian countries rank very high on development measures (Fig 1) and in terms of
the HPI index which implies satisfied, long-lived people (quality of life) using resources efficiently (equation on page 1). There is an overlap between level of development and
quality of life, but expect some explanation of economic and social aspects linked to technology.
• All 3 countries are in the top 15 in terms of PPP GDP per capita (high paying jobs, tertiary and quaternary sector; access to a huge range of technology e.g. the internet statistics)
• This is confirmed by Fig 4 which shows all three countries to have high levels of Tertiary education and above average % of GDP spent on education.
• Fig 3 states the 3 countries are within the top 10 (Sweden is top) in terms of network readiness (the ability to take advantage of opportunities in ICT).
• Fig 5 suggests Scandinavia invests heavily in R&D (high paid jobs) and its
educated workforce is innovative (patents = royalties = money) • Could comment that the very high Democracy Index (Fig 1) scores suggest
unfettered access to information in all its forms. • All 3 countries rank very high in terms of HDI (Fig 1), which includes life
expectancy, literacy and education levels which suggests access to health and
education technology is very good • HPI (Fig 2) suggests life satisfaction is high which might be a result of access to
technology and labour saving devices, as well as being related to wealth. • High environmental quality might be linked to HPI; not that a high score can be
linked to a low carbon footprint, and possibly technology helping to utilise
resources efficiently and cleanly. Many candidates will be able to explain Scandinavia’s quality of life and development but
for Level 3 some link to technology is needed. Credit candidates who bring in synoptic ideas of other measures of development and quality of life from their research e.g. gender equality, social justice in the region.
Synoptic linkages Unit 3 Bridging the development gap – ways of measuring development
Unit 1 – the benefits that flow from being ‘connected’ As part of research candidates may have looked at issues such as income equality, and have further details of HPI or HDI. Other high (or even low) HPI, HDI or NRI countries
might be used as parallel examples.

Level Mark Descriptor
Level 1 1-4 A few general comments relating to high quality of life or development in Scandinavia; patchy use of resources. Structure is poor or absent. Explanations are over-simplified and lack clarity. Geographical
terminology is rarely used with accuracy. There are frequent grammar, punctuation and spelling errors.
Level 2 5-8 Some explanation of high quality of life / development level using the resources; limited link to the role of technology. Structure is satisfactory.
Explanations are clear, but there are areas of less clarity. Geographical terminology is used with some accuracy. There are some grammar, punctuation and spelling errors.
Level 3 9-12 Sound explanation of high quality of life and development level linking to the role of technology (possibly other factors). Structure is good.
Explanations are always clear. Synoptic. Geographical terminology is used with accuracy. Grammar, punctuation and spelling errors are very
rare.

Question Number
Question
6b Assess the extent to which Scandinavia has minimised the environmental costs of using technology and resources. (14)
Indicative content
Costs should focus on environmental, but accept wider social or economic if broadly linked to environmental issues. Do not expect a differentiation between technology and
resources to be made. Candidates should recognise that there are significant differences across the region and
the countries cannot always be lumped together. Evidence in favour of a ‘green Scandinavia’ includes:
• Early adopters of carbon taxes; some candidates might link to the synoptic idea of ‘polluter pays’ or have found that there are many exemptions in some countries, so all is perhaps not quite as ‘green’ as it seems.
• Reliance on fossil fuels is low in Sweden and Norway and renewables are high in all countries, although the mix is different; View 3 supports this.
• All three countries tax petrol and diesel heavily which could be seen as taxing pollution (or raising revenue, as the UK Gov is often accused of); there is some evidence in Fig 10 that car ownership in Demark and Norway is much lower than
GDP would suggest which may suggest green taxes work. • Norway and Sweden do seem to have decoupled carbon emissions and GDP (Fig 9)
to produce highly efficient economies compared to others in Europe. • Sweden had exceeded its Kyoto target by 7% by 2010. • Fig 12 suggests that at least some Scandinavian companies are at the forefront of
renewable energy and in the case of Volvo, have long-standing concerns about the negative consequences of technology.
On the other hand: • Fig 6 shows that overall ecofootprints are very high; Norway has a low footprint
for its wealth but a very high fishing footprint, plus it is an exporter of oil and gas
(an exporter of pollution?); in total ecofootprint terms Denmark comes out poorly in relation to its GDP (intensive farming).
• Sweden’s nuclear power use may be questioned by some, plus Denmark uses a very similar % of fossil fuels to the average for Europe (Fig 7).
• Kyoto progress has been mixed (Fig 11); by 2010 Denmark was only ½ way to its
(very challenging) 2012 target; Norway had increased emissions by 2010 to 10% above its 1% target.
Expect and summary / overview from some candidates i.e. how far has the region managed to minimise environmental costs, or is it really just very similar to other countries / regions?
Synoptic linkages Research information e.g. of carbon decoupling or specific examples of renewable
energy. Unit 3 energy – types of energy resource and the impacts of technologies. Unit 1 managing climate change.

Level Mark Descriptor
Level
1
1-4 A few lift offs from the resources with generalised and inaccurate
statements relating to environmental issues. Structure is poor or absent. Explanations are over-simplified and lack clarity. Geographical
terminology is rarely used with accuracy. There are frequent grammar, punctuation and spelling errors.
Level 2
5-7 A focus on environmental issues, but likely to be an uncritical selection of resource information to prove ‘greenness’. Structure is satisfactory. Explanations are clear, but there are areas of less clarity. Geographical
terminology is used with some accuracy. There are some grammar, punctuation and spelling errors.
Level 3
8-11 Recognises the differences between countries and uses the resources effectively; linked to minimising environmental costs and some implied
assessment. Structure is good. Some reference to wider links. Explanations are always clear. Geographical terminology is used with accuracy. Grammar, punctuation and spelling errors are rare.
Level 4
12-14
Sound assessment of minimising environmental costs, which recognises national differences to carefully weigh a range of evidence. Likely to
provide an overview. Carefully structured. Strong synoptic links. Explanations are always clear. Geographical terminology is used with
accuracy. Grammar, punctuation and spelling errors are very rare.

Question Number
Question: Study Figure 13.
6c Evaluate the contribution that the technologies shown might make in reducing ecological footprints in Scandinavia and beyond. (14)
Indicative content
The 3 technologies focus on capturing carbon, changing modes of transport and making energy less carbon intensive. There is also an eco-footprint graph which shows that
Scandinavia was making good progress reducing footprints between 1996 and 2003 but that they increased up to 2005 (some candidates might link this to View 2). The three
future scenarios shown in Fig 13 might be used as a structure. • CCS is a new technology, pioneered by Norway but yet to be up-scaled worldwide
(there are several trial plants); the Sleipner system prevents pollution being released as
a by-product of oil production but the Mongstad plant would capture combustion emissions which is the ultimate goal of CCS. View 1 undermines the economics of CCS
to some extent and some candidates might argue that it is a class techno-fix where an attitudinal fix is really what is required, i.e. use less, conserve more. Some might argue it’s actually ‘business as usual’
• Copenhagen is clearly a very green city from a transport perspective with huge investment in cycling; the technology is a mix of simple mechanical and complex
electronics (the traffic light) and is about changing behaviour and lifestyles; can this be applied in other cities which are bigger, hillier and much poorer? Copenhagen’s metro is a major investment for a city of only ~1 million. These schemes might be seen as
sustainable rather than radical as they operate in many other locations. • GoBiGas might be seen as the more radical approach, or an extension of existing
technologies; it aims to replace fossil fuels with forestry waste (it could be more or less carbon neutral over the long term) and tie power generation into district heating / CHP to increase efficiency by using waste heat; retrofitting district heating is costly and
difficult. View 5 sets GoBiGas in a broader Swedish context which might be interpreted as showing the Swedes were early adopters of environmental sustainability.
Better answers will separate Scandinavia from elsewhere, and should discuss whether these technologies can be applied outside these very developed countries (see View 4) – ‘beyond’ in the question. Credit candidates who, in addition to Fig 13, bring in other
examples of technology. Note that Figure 6 shows the carbon part of the ecological footprint; candidates could argue
that the 3 schemes would have minimal impact on the overall ecological footprint. Synoptic linkages Research on CCS is likely to appear.
There are obvious parallel examples in London, Curitiba, Amsterdam and many others. Unit 3 energy security

Level Mark Descriptor
Level 1 1-4 Descriptive and narrow response; may focus on 1 technology and be overly reliant on the resources. Structure is poor or absent. Explanations
are over-simplified and lack clarity. Geographical terminology is rarely used with accuracy. There are frequent grammar, punctuation and spelling errors.
Level 2 5-7 Response that explains the green credentials of the technologies using information in the resources. Structure is satisfactory. Explanations are
clear, but there are areas of less clarity. Geographical terminology is used with some accuracy. There are some grammar, punctuation and
spelling errors.
Level 3 8-11 Some evaluation in an answer that compares aspects of the three
technologies and has some detail; likely to focus on Scandinavia only. At the top end may refer to the 3 futures. Structure is good. Some reference to wider links. Explanations are always clear. Geographical
terminology is used with accuracy. Grammar, punctuation and spelling errors are rare. Max 10 if 2 technologies only.
Level 4 12-14 Sound evaluation which links to the futures graph, Scandinavia and beyond. Carefully structured. Strong synoptic links. Explanations are
always clear. Geographical terminology is used with accuracy. Grammar, punctuation and spelling errors are very rare.

Further copies of this publication are available from Edexcel Publications, Adamsway, Mansfield, Notts, NG18 4FN
Telephone 01623 467467
Fax 01623 450481 Email [email protected]
Order Code UA030494 January 2012
For more information on Edexcel qualifications, please visit www.edexcel.com/quals
Pearson Education Limited. Registered company number 872828 with its registered office at Edinburgh Gate, Harlow, Essex CM20 2JE