
Mark Pervan - AME Research
18
1 1 AME Iron Ore Update Q1 2017
-
Upload
informa-australia -
Category
Business
-
view
125 -
download
2
Transcript of Mark Pervan - AME Research

11
AME Iron Ore UpdateQ1 2017

22
Global Commodity Sector Performances
We believe commodity markets bottomed in Q116after a substantial five-year decline
0
100
200
300
400
500
600
700
800
900
02 03 04 05 06 07 08 09 10 11 12 13 14 15 16 17
Precious Energy Bulks Ags Industrial
Source: AME

33
Global Commodity Sector Performances
Source: AME
0
100
200
300
400
500
600
700
800
900
02 03 04 05 06 07 08 09 10 11 12 13 14 15 16 17
Energy Bulks Industrial
We believe commodity markets bottomed in Q116particularly for the industrial commodities - energy, bulks and base metals

44
China Growth
China has managed a soft landingAfter substantially cooling the economy over the past 5 years
0
2
4
6
8
10
12
14
16
18
20
00 01 02 03 04 05 06 07 08 09 10 11 12 13 14 15 16 17
Yo
Y %
China IP China GDP
Source: AME

55
0
2
4
6
8
10
12
14
16
18
20
00 01 02 03 04 05 06 07 08 09 10 11 12 13 14 15 16 17
Yo
Y %
China IP China GDP
0
500
1,000
1,500
2,000
2,500
RM
B B
illio
n
China New Loans (RHS)
China Growth
China can re-ignite growth quicklyNew loans jumped sharply post the GFC and in 2016 to stabilise the economy
Source: AME

66Source: AME
China Property Prices & New Loans
Funds are quickly channelled into growth sectors like propertybut when conditions get overbought, tightening measures are triggered to cool the sectors
0
500
1,000
1,500
2,000
2,500
-8
-4
0
4
8
12
16
07 08 09 10 11 12 13 14 15 16 17
RM
B B
illio
n
Yo
Y %
Real Estate Prices China New Loans (RHS)

77Source: AME
China Property Prices & Steel Price
China property market is steels biggest end-userSteel prices have rallied with strong gains in property, and now look vulnerable to correction
-60
-30
0
30
60
90
-8
-4
0
4
8
12
16
07 08 09 10 11 12 13 14 15 16 17
Yo
Y %
Yo
Y %
Real Estate Prices China Rebar Price (RHS)

88
Iron Ore & Steel Prices
Steel prices have surprisingly outperformed iron oresuggests iron ore prices won’t fall as far
1,500
2,000
2,500
3,000
3,500
4,000
4,500
5,000
5,500
6,000
0
50
100
150
200
250
07 08 09 10 11 12 13 14 15 16 17
RM
B/t
on
ne
US
D/t
on
ne
Iron Ore Price China Rebar Price (RHS)
Source: AME

99
-10
0
10
20
30
40
11 12 13 14 15 16 17
Yo
Y %
Real Estate Infrastructure Manufacturing
Source: AME
China FAI Breakdown
Fresh funds are being channelled into infrastructurethis should cushion the downside for steel from slowing property demand

1010
-10
0
10
20
30
40
11 12 13 14 15 16 17
Yo
Y %
Real Estate Infrastructure Manufacturing
0
500
1,000
1,500
2,000
2,500
RM
B B
illio
n
China New Loans (RHS)
Source: AME
China FAI Breakdown
Fresh funds are being channelled into infrastructurethis should cushion the downside for steel from slowing property demand
1111Source: AME
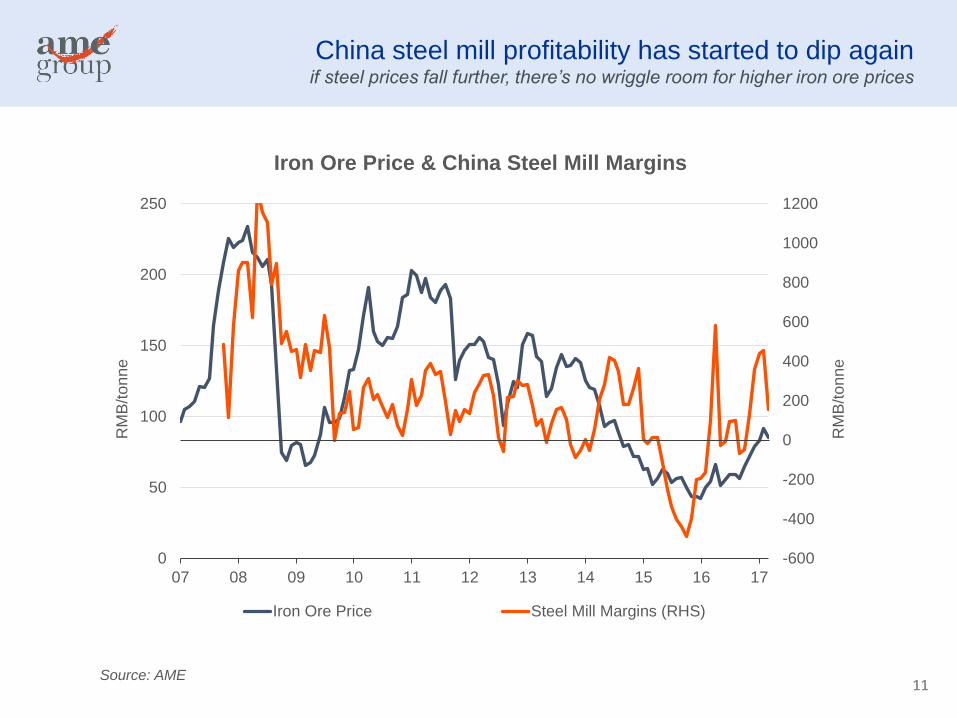
Iron Ore Price & China Steel Mill Margins
China steel mill profitability has started to dip againif steel prices fall further, there’s no wriggle room for higher iron ore prices
-600
-400
-200
0
200
400
600
800
1000
1200
0
50
100
150
200
250
07 08 09 10 11 12 13 14 15 16 17
RM
B/t
on
ne
RM
B/t
on
ne
Iron Ore Price Steel Mill Margins (RHS)

1212
2013 & 2016 Global Iron Ore Cost Curve (CFR China)
Source: AME
0
10
20
30
40
50
60
70
80
90
100
0 200 400 600 800 1000 1200 1400
US
D/to
nne
Cumulative Production (Mt)
2013
2016
Iron ore industry costs have fallen substantially in the past 3 yearsin the absence of weaker oil prices and currencies further costs declines will be hard one

1313
2016 Global Iron Ore Cost Curve (CFR China)
There’s been substantial price volatility in the past 12 monthsAllowing higher cost Chinese supply to remain operating
Source: AME
0
10
20
30
40
50
60
70
80
90
100
0 200 400 600 800 1000 1200 1400
US
D/to
nne
Cumulative Production (Mt)
12 month price range
1414
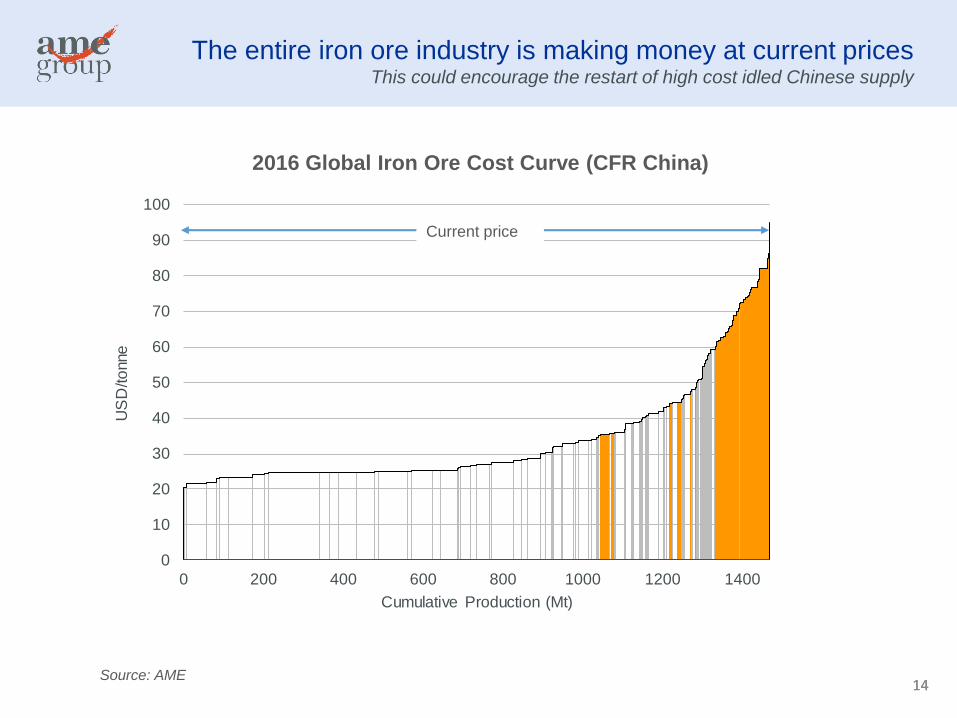
2016 Global Iron Ore Cost Curve (CFR China)
The entire iron ore industry is making money at current prices This could encourage the restart of high cost idled Chinese supply
Source: AME
0
10
20
30
40
50
60
70
80
90
100
0 200 400 600 800 1000 1200 1400
US
D/to
nne
Cumulative Production (Mt)
Current price

1515
2016 Global Iron Ore Cost Curve (CFR China)
Prices need to revert back to the 90th percentileImplying a price range of US$60-75/tonne over the next 12 months
Source: AME
0
10
20
30
40
50
60
70
80
90
100
0 200 400 600 800 1000 1200 1400
US
D/to
nne
Cumulative Production (Mt)
Current price
AME 12mth price forecast range

1616
Thank you

17
For further details, please visit our website at www.amegroup.com
Hong Kong
t: +852 2846 8220
London
t: +44 20 3752 7277
Sydney
t: +61 2 9262 2264
Toronto
t: +1 646 736 7887
Contact details and important notices
Forward looking information
Certain statements and graphics contained in this presentation may contain forward-looking information within the meaning of various securities
laws. Such forward-looking information are identified by words such as "estimates", "intends", "expects", "believes", "may", "will" and included,
without limitation, statements regarding the company's plan of business operations, production levels and costs, potential contractual arrangements
and the delivery of equipment, receipt of working capital, anticipated revenues, mineral reserve and mineral resource estimates, and projected
expenditures. There can be no assurance that such statements will prove to be accurate; actual results and future events could differ materially
from such statements. Factors that could cause actual results to differ materially include, among others, metal prices, risks inherent in the mining
industry, financing risks, labour risks, uncertainty of mineral reserve and resource estimates, equipment and supply risks, regulatory risks and
environmental concerns. Most of these factors are outside the control of the company. Investors are cautioned not to put undue reliance on
forward-looking information. Except as otherwise required by applicable securities statutes or regulation, the company expressly disclaims any
intent or obligation to update publicly forward-looking information, whether as a result of new information, future events or otherwise.
Copyright @AME Group 2016
Copyright @ AME Group 2015

1818
China’s One Belt, One Road (OBOR)
Belt and Road’ strategy will take natural resources from the westand use excess capacity to sell refined product into the east
Moscow
Rotterdam
Venice
AthensIstanbul
Tehran
Nairobi
Colombo
Kolkata
Jakarta
Fuzhou
Xi’anDushanbe
New
Supply
New
Demand