Mark Matsuura - Photovoltaic Distributed Generation … · what [s in it for the utility? • New...
18
Marc M. Matsuura Sr. Smart Grid Program Manager, GridSTART Hawaii Natural Energy Institute School of Ocean & Earth Science & Technology University of Hawaii at Manoa 1680 East-West Road, POST 109 Honolulu, Hawaii 96822 Photovoltaic Distributed Generation Hawaii Case Study Solutions to Facilitate Successful RE Integration on the Distribution System Asia Clean Energy Forum June 5, 2018 Manila, Philippines
Transcript of Mark Matsuura - Photovoltaic Distributed Generation … · what [s in it for the utility? • New...

Marc M. MatsuuraSr. Smart Grid Program Manager, GridSTART
Hawaii Natural Energy InstituteSchool of Ocean & Earth Science & Technology
University of Hawaii at Manoa1680 East-West Road, POST 109
Honolulu, Hawaii 96822
Photovoltaic Distributed GenerationHawaii Case Study
Solutions to Facilitate Successful RE Integration on the Distribution System
Asia Clean Energy ForumJune 5, 2018
Manila, Philippines

2
New Regulatory Compact• Government policy set to drive clean energy action
– Renewable & Energy Efficiency Portfolio Standards
– Net Energy Metering & Feed-in Tariffs
• Financially sound utility needed to implement the policy– Why?
– RE projects must be “bankable” (utility is contract counter-party)
• But, these policies reduce energy sales for the utility … so what’s in it for the utility?
• New regulatory compact aligns utility’s business interest – Utility rates “decoupled” from energy sales (utility ensured to recover
it’s costs even if sales declining)
– Investment in grid renewal encouraged (utility earns on CapEx)
Hawaii State Capitol Hawaiian Electric offices

Installed PV Capacity - HECO Companies(2005 to 3/2018)
½ Peak Load
37% of total RE
3

Oʻahu
Molokaʻi
Maui
HawaiʻiLanaʻi37%
19%
41%
54%
% Renewable
Energy
Kauaʻi Island Utility CooperativeSystem Peak: 78 MW
65.6 MW PV / 7 MW Biomass / 9 MW Hydro
Installed PV: 84% of System Peak
41.7% RE in 2016
Maui ElectricMaui System Peak: 202 MW
100 MW PV / 72 MW Wind
Installed PV & Wind:
85% of Sys. Peak
34.2% RE in 2017
Lana’i System Peak: 5.1 MW
2.53 MW PV (50% of Sys. Peak)
Moloka’i System Peak: 5.6 MW
2.3 MW PV (41% of Sys. Peak)
Hawaiian ElectricSystem Peak: 1,206 MW
512 MW PV / 99 MW Wind / 69 MW WTE
Installed PV & Wind:
50% of System Peak
20.8% RE in 2017
Hawaii Electric LightSystem Peak: 192 MW
92 MW PV / 30 MW Wind /
38 MW Geothermal / 16 MW Hydro
Installed PV & Wind:
64% of System Peak
56.6% RE in 2017
Kaua’i
80% of state population
Hawai‘i Electric Systems –4 Electric Utilities; 6 Separate Grids; % Renewable Energy
4

Distributed PV Circuit Penetrations
5
Average Penetration: ~110% Gross Min Daytime Load*
*GMDL = Net min load + 75% of installed PV capacity
DGPV capacity = 50% peak load13% Energy
Wind capacity = 36% peak load21% Energy

Why is DG PV So Popular in Hawaii
Federal Incentives30% of the cost of Solar systems with no cap. Extended to 2019(Ramps down through 2020 to 26%, then in 2021 to 22%)
Average Price of Residential Electricity (EIA)
State Mar-181 North Dakota 9.65
2 Washington 9.65
3 Louisiana 9.79
4 Idaho 9.99
5 Nebraska 10.25.
.
46 New Hampshire 19.93
47 Rhode Island 20.22
48 Connecticut 21.04
49 Alaska 21.47
50 Massachusetts 22.49
51 Hawaii 32.05
U.S. Average 12.996
State Incentives35% of the actual cost or $5,000 per system, whichever is less. No expiration date
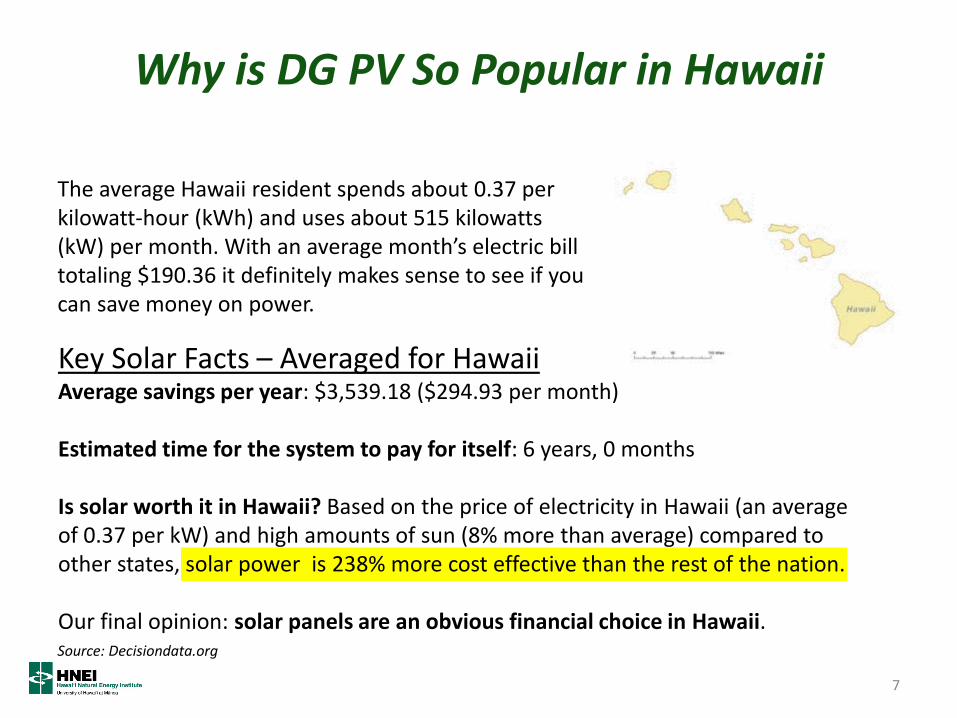
Key Solar Facts – Averaged for HawaiiAverage savings per year: $3,539.18 ($294.93 per month)
Estimated time for the system to pay for itself: 6 years, 0 months
Is solar worth it in Hawaii? Based on the price of electricity in Hawaii (an average of 0.37 per kW) and high amounts of sun (8% more than average) compared to other states, solar power is 238% more cost effective than the rest of the nation.
Our final opinion: solar panels are an obvious financial choice in Hawaii.
Why is DG PV So Popular in Hawaii
Source: Decisiondata.org
7
The average Hawaii resident spends about 0.37 per kilowatt-hour (kWh) and uses about 515 kilowatts (kW) per month. With an average month’s electric bill totaling $190.36 it definitely makes sense to see if you can save money on power.

DG PV Programs
x
x
8
Customer Grid-Supply Plus (CGS Plus) systems must include grid support technology to manage grid reliability and allow the utility to remotely monitor system performance, technical compliance and, if necessary, control for grid stability.
Smart Export customers with a renewable system and battery energy storage system have the option to export energy to the grid from 4 p.m. – 9 a.m. Systems must include grid support technology to manage grid reliability and system performance.
Customer Self-Supply (CSS) is intended only for private rooftop solar installations that are designed to not export any electricity to the grid. Customers are not compensated for any export of energy.
Customer Grid-Supply (CGS) participants receive a PUC-approved credit for electricity sent to the grid and are billed at the retail rate for electricity they use from the grid. The program remains open until the installed capacity has been reached.
Net Energy Metering (NEM) is closed to new applicants.
Standard Interconnection Agreement (SIA) is designed for larger customers who wish to offset their electricity bill with on-site generation.
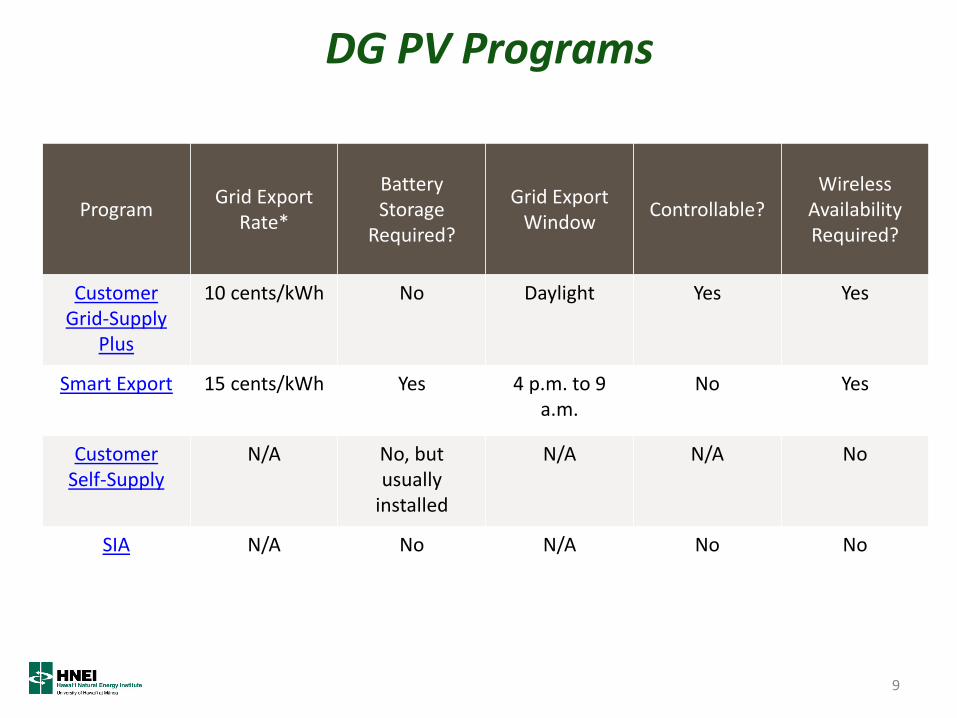
DG PV Programs
9
ProgramGrid Export
Rate*
Battery Storage
Required?
Grid Export Window
Controllable?Wireless
Availability Required?
Customer Grid-Supply
Plus
10 cents/kWh No Daylight Yes Yes
Smart Export 15 cents/kWh Yes 4 p.m. to 9 a.m.
No Yes
Customer Self-Supply
N/A No, but usually
installed
N/A N/A No
SIA N/A No N/A No No

Qualified Inverter Lists
10
https://www.hawaiianelectric.com/Documents/clean_energy_hawaii/list_of_advanced_legacy_equipment.pdf

Evolution of Circuit Penetration Limits(Why is the utility being a roadblock?)
“How much distributed generation can you add before you need to do an expensive Interconnection Requirements Study?”
• 15% of Peak Load– Utility “Rule-of-Thumb” for synchronous generation
• Historically, utilities only measured circuit peaks for planning
• 30% of minimum daytime load (MDL)– The actual issue is the generation at minimum load
• 120% of MDL– “Typical” distribution circuit modeling showed no issues until the
circuit penetration levels reached 120% of the MDL where transient over voltages (TOV) were a concern.
11

Evolution of Circuit Penetration Limits(Why is the utility being a roadblock?)
• 250% of MDL– Modeling studies determined TOV levels were acceptable if new
inverters could trip within 1-cycle if its terminal voltage reached 120% pu voltage. TOV trip requirement added to interconnection Requirements
• Individual Hosting Capacity Limit– Based only on steady-state power flows (Thermal and Voltage limits)
and flicker limits.
– Actual inverter testing determined that TOV was not an issue if inverters met the TOV requirements
– “Advanced” Inverter capabilities are now required to expand Hosting Capacity Limits
– Load Tap Changer settings need to be reviewed with distribution voltage monitoring
– Emergency configurations need to be assessed 12

940 Applications Executed in the first quarter of 201813

14
Rule 14
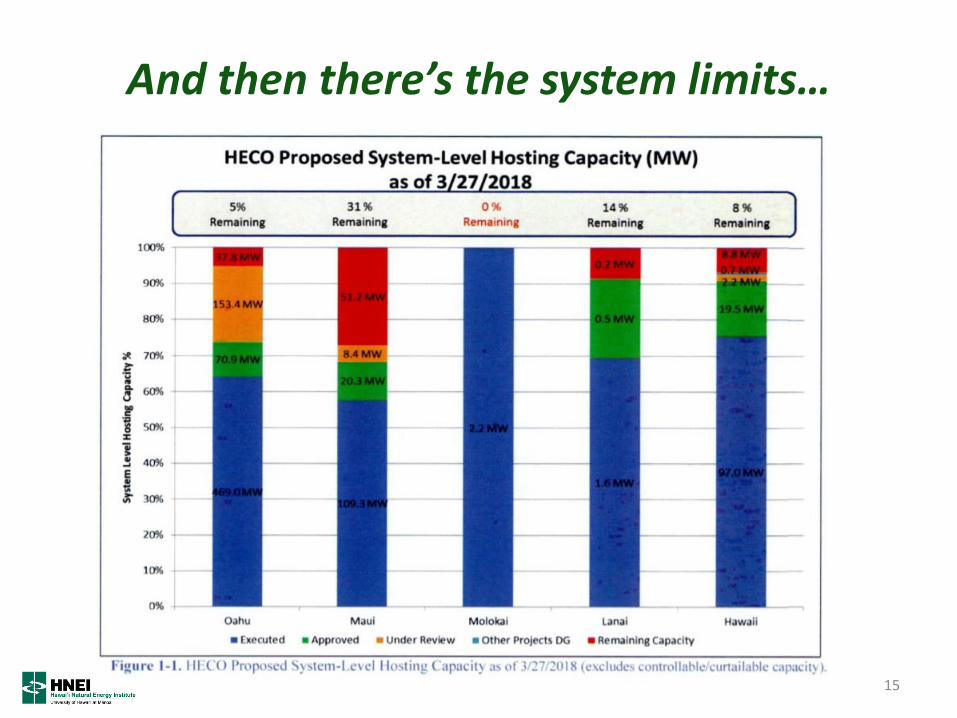
And then there’s the system limits…
15

Is This a Limit?
16

Key Messages
• Hawai‘i has made great strides in the integration of distributed PV
• Those strides came through a combination of significant subsidies and solving real technical and process roadblocks
• Policy facilitates change
• Change takes time and needs to be monitoredto match technical capabilities and right size subsidies and energy mix.
17

Mahalo!(Thank you)
For more information, contact:
Marc MatsuuraSr. Smart Grid Program Manger
Office: (808) 956-7050
E-mail: [email protected]
Hawaii Natural Energy Institute
School of Ocean & Earth Science & Technology
University of Hawaii at Manoa
1680 East-West Road, POST 109
Honolulu, Hawaii 96822
Website: www.hnei.hawaii.edu
Grid System Technologies Advanced Research Team