
Mark cochrane
10
2010/6/8 1 Trade Fairs in Asia: Results of the 6 th annual survey Prepared by Business Strategies Group Ltd. 4 th June 2010 Report background • Prepared by BSG since 2004 • Published jointly with UFI • Draws on BSG’s exhibition database developing since 2001 • Covers 15 key markets in Asia • Focuses on B2B exhibitions >2,000 sqm • Excludes B2C events 4th June 2010 v1.0 2
-
Upload
manch-communications-pvt-ltd -
Category
Business
-
view
524 -
download
2
description
Presentation gave by Mark Cochrane on An overview of Asia’s Exhibition Industry and India’s role in it during Expo Summit 2010, held on 4-5 June 2010, New Delhi, India.
Transcript of Mark cochrane

2010/6/8
1
Trade Fairs in Asia:
Results of the 6th annual survey
Prepared by Business Strategies Group Ltd.
4th June 2010
Report background
• Prepared by BSG since 2004
• Published jointly with UFI
• Draws on BSG’s exhibition database developing since 2001
• Covers 15 key markets in Asia
• Focuses on B2B exhibitions >2,000 sqm
• Excludes B2C events
4th June 2010 v1.0 2
2010/6/8
2
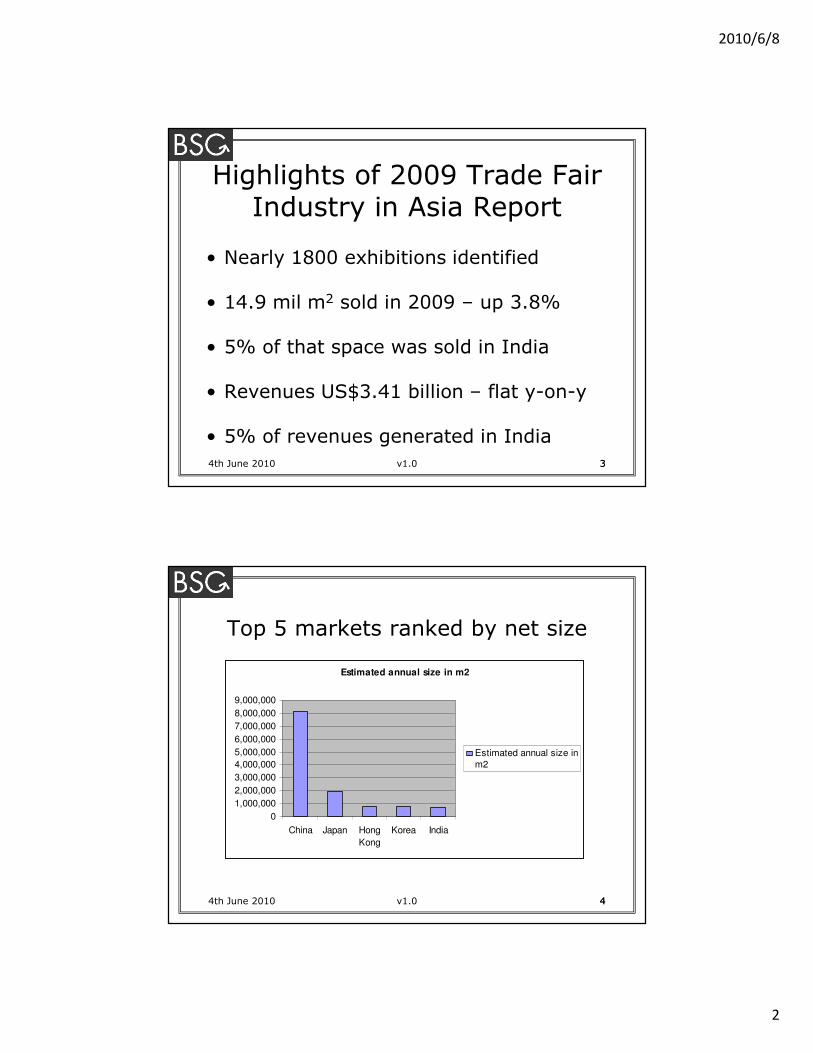
Highlights of 2009 Trade Fair Industry in Asia Report
• Nearly 1800 exhibitions identified
• 14.9 mil m2 sold in 2009 – up 3.8%
• 5% of that space was sold in India
• Revenues US$3.41 billion – flat y-on-y
• 5% of revenues generated in India
4th June 2010 v1.0 33
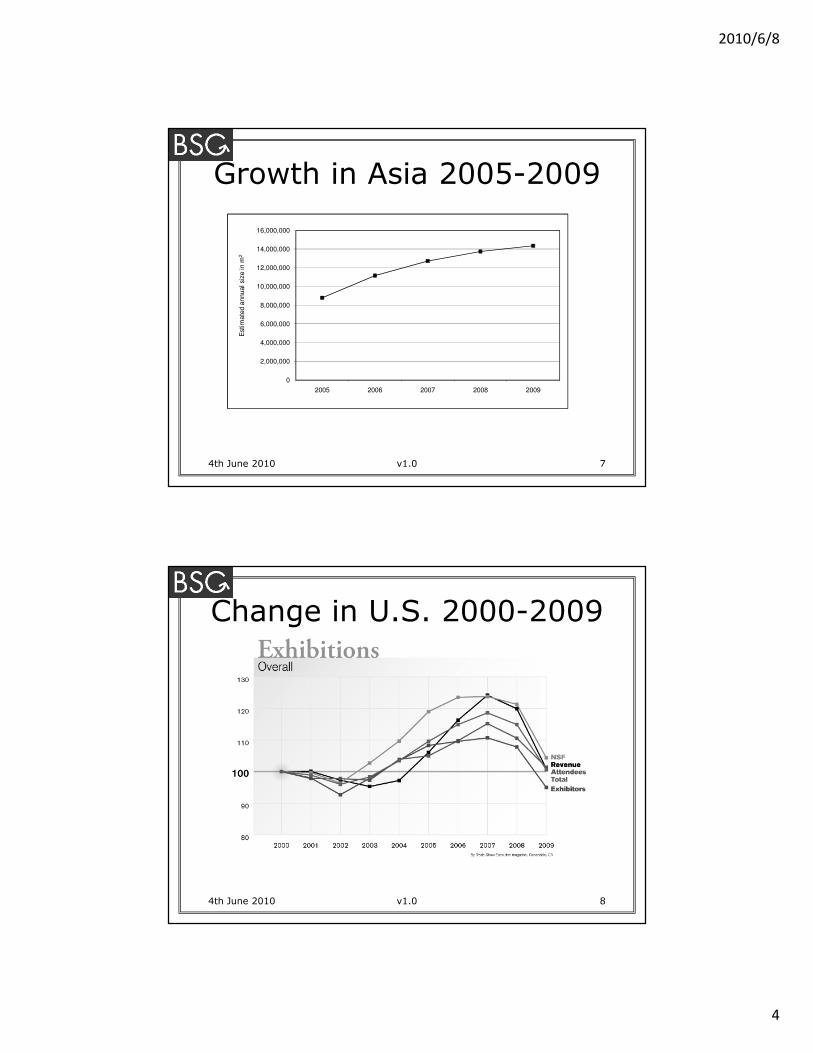
Top 5 markets ranked by net size
4th June 2010 v1.0 44
Estimated annual size in m2
0
1,000,000
2,000,000
3,000,000
4,000,000
5,000,000
6,000,000
7,000,000
8,000,000
9,000,000
China Japan Hong
Kong
Korea India
Estimated annual size inm2

2010/6/8
3
Top 5 y-on-y change in net size
4th June 2010 v1.0 5
Estimated size 2008 vs. 2009 in % change
0%5%
10%15%20%25%30%35%40%45%50%
Mac
au
China
Malay
sia
Korea
Taiwan
Estimated size 2008 vs.2009 in % change
Change in net size: ’09 vs. ‘05
4th June 2010 v1.0 6
Top 5 exhibition space sold % change
0%
20%
40%
60%
80%
100%
120%
140%
Vietn
amChin
a
Thaila
nd
Pak
ista
n
Hong
Kong
Estimated size 2005 vs.
2009 in % change
2010/6/8
4
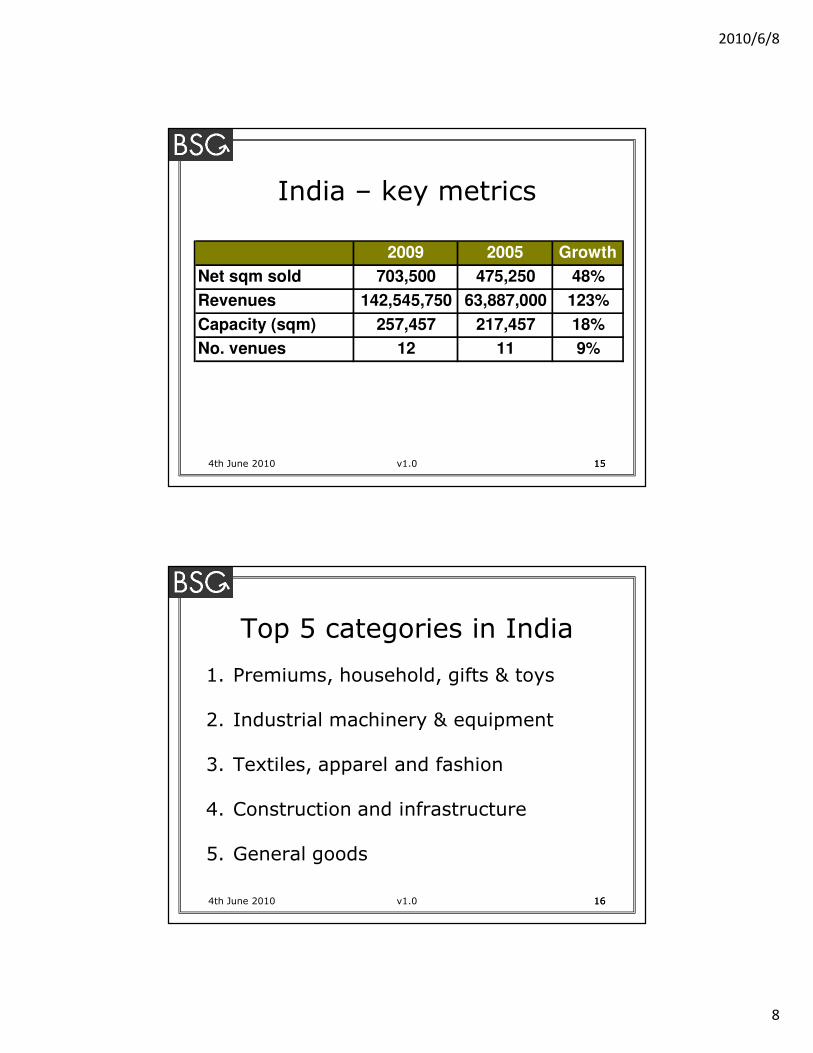
Growth in Asia 2005-2009
4th June 2010 v1.0 7
0
2,000,000
4,000,000
6,000,000
8,000,000
10,000,000
12,000,000
14,000,000
16,000,000
2005 2006 2007 2008 2009
Est
imate
d a
nnual si
ze in m
2
Change in U.S. 2000-2009
4th June 2010 v1.0 8

2010/6/8
5
94th June 2010 v1.0
Markets ranked by revenues
4th June 2010 v1.0 1010
Top 5 markets by revenues 2009
0
200,000,000
400,000,000
600,000,000
800,000,000
1,000,000,000
1,200,000,000
China
Japa
n
Hong K
ong
Korea
Austra
lia
Estimated annualisedrevenues (US$)

2010/6/8
6
Markets ranked by capacity
4th June 2010 v1.0 1111
Top 5 markets by capacity
0
500,000
1,000,0001,500,000
2,000,0002,500,0003,000,000
3,500,000
4,000,0004,500,000
China
Japa
n
India
Kor
ea
Thaila
nd
2010 Total gross indoor
size in m2
Capacity in China
4th June 2010 v1.0 1212
0
1,000,000
2,000,000
3,000,000
4,000,000
5,000,000
6,000,000
7,000,000
2004 2005 2006 2007 2008 2009 2010 2011
Rest
China

2010/6/8
7
10 largest exhibition centres in Asia
4th June 2010 v1.0 1313
Region City Exhibition Centre
1 China Guangzhou Chinese Export Commodities Fair Ground - Pazhou complex
2 China Shanghai Shanghai New International Expo Centre (SNIEC)
3 China Guangzhou Chinese Export Commodities Fair Ground - Liuhua complex
4 Thailand Bangkok IMPACT
5 China Yiwu Yiwu International Expo Centre6 China Chengdu New International Convention and Exhibition Center (Century City)
7 China Shenyang Shenyang Exhibition Center8 China Shenzhen Shenzhen Convention & Exhibition Center
9 China Beijing New China International Exhibition Center (NCIEC)10 Singapore Singapore Singapore Expo
Top 5 industries by space sales
4th June 2010 v1.0 1414
Industry Estimated annual size in %
1 Engineering, Industrial, Manufacturing, Machines, Instruments, Hardware 10.4%
2 Furniture, Interior design 10.2%
3 General 8.7%
4 Food and Beverage, Hospitality 6.5%
5 Textiles, Apparel, Fashion 6.1%
2010/6/8
8
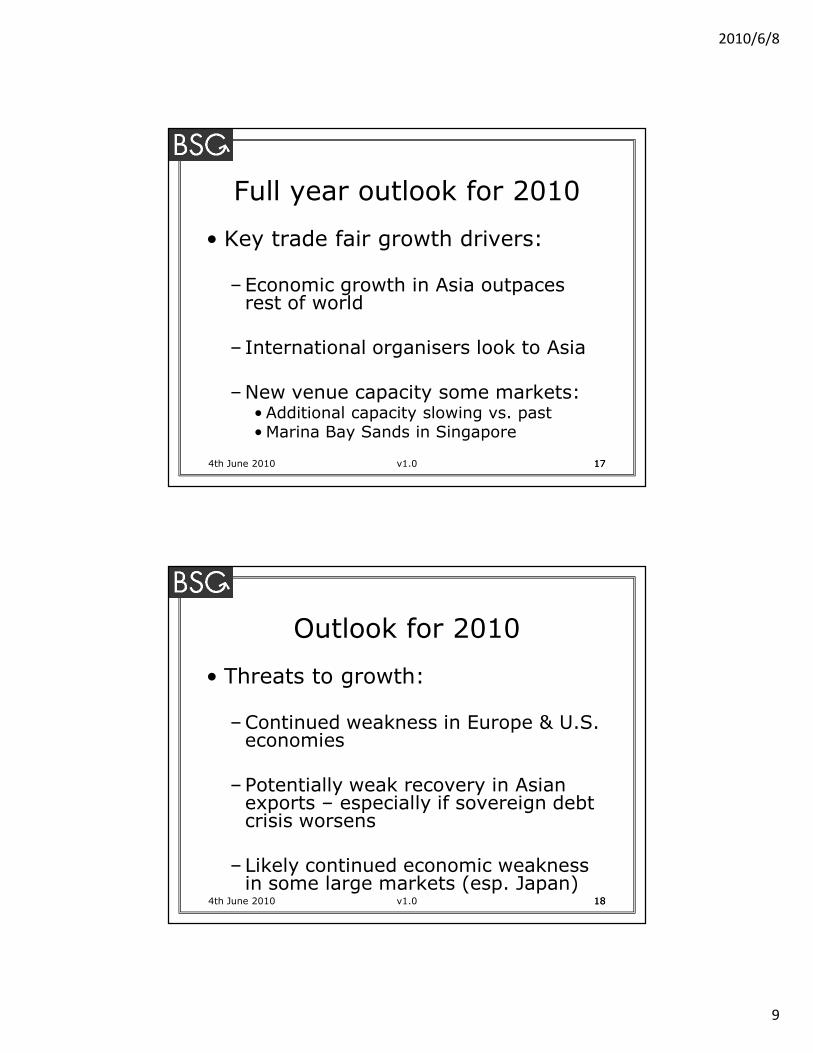
India – key metrics
4th June 2010 v1.0 1515
2009 2005 Growth
Net sqm sold 703,500 475,250 48%
Revenues 142,545,750 63,887,000 123%
Capacity (sqm) 257,457 217,457 18%
No. venues 12 11 9%
Top 5 categories in India
1. Premiums, household, gifts & toys
2. Industrial machinery & equipment
3. Textiles, apparel and fashion
4. Construction and infrastructure
5. General goods
4th June 2010 v1.0 1616
2010/6/8
9
Full year outlook for 2010
• Key trade fair growth drivers:
–Economic growth in Asia outpaces rest of world
– International organisers look to Asia
–New venue capacity some markets:• Additional capacity slowing vs. past• Marina Bay Sands in Singapore
4th June 2010 v1.0 1717
Outlook for 2010
• Threats to growth:
–Continued weakness in Europe & U.S. economies
–Potentially weak recovery in Asian exports – especially if sovereign debt crisis worsens
–Likely continued economic weakness in some large markets (esp. Japan)
4th June 2010 v1.0 1818

2010/6/8
10
Outlook for 2010
• Strong economic growth in key markets to drive industry:– India 8.8%, China 10%
• Hong Kong, Korea, Taiwan to return to solid GDP growth expected to be 4%-6%
• BSG’s initial forecast for trade fair growth is higher than 2009
4th June 2010 v1.0 1919
Thank you
We would be pleased to take your questions and comments
at this time.


![Cochrane DatabaseofSystematicReviews274872/UQ274872...[Intervention Review] Anticholinergic therapy for acute asthma in children Laurel Teoh1,2, Christopher J Cates3, Mark Hurwitz4,](https://static.fdocuments.in/doc/165x107/60e0c8b95acfb6261b617366/cochrane-databaseofsystematicreviews-274872uq274872-intervention-review-anticholinergic.jpg)


