Maritza Alonzo Macias To cite this version
139
HAL Id: tel-01066753 https://tel.archives-ouvertes.fr/tel-01066753 Submitted on 22 Sep 2014 HAL is a multi-disciplinary open access archive for the deposit and dissemination of sci- entific research documents, whether they are pub- lished or not. The documents may come from teaching and research institutions in France or abroad, or from public or private research centers. L’archive ouverte pluridisciplinaire HAL, est destinée au dépôt et à la diffusion de documents scientifiques de niveau recherche, publiés ou non, émanant des établissements d’enseignement et de recherche français ou étrangers, des laboratoires publics ou privés. Comparatives studies of different drying process of strawberry hot air drying freeze-drying and swell-drying : application on the biological compounds preservation Maritza Alonzo Macias To cite this version: Maritza Alonzo Macias. Comparatives studies of different drying process of strawberry hot air dry- ing freeze-drying and swell-drying : application on the biological compounds preservation. Other. Université de La Rochelle, 2013. English. NNT : 2013LAROS398. tel-01066753
Transcript of Maritza Alonzo Macias To cite this version

HAL Id: tel-01066753https://tel.archives-ouvertes.fr/tel-01066753
Submitted on 22 Sep 2014
HAL is a multi-disciplinary open accessarchive for the deposit and dissemination of sci-entific research documents, whether they are pub-lished or not. The documents may come fromteaching and research institutions in France orabroad, or from public or private research centers.
L’archive ouverte pluridisciplinaire HAL, estdestinée au dépôt et à la diffusion de documentsscientifiques de niveau recherche, publiés ou non,émanant des établissements d’enseignement et derecherche français ou étrangers, des laboratoirespublics ou privés.
Comparatives studies of different drying process ofstrawberry hot air drying freeze-drying and
swell-drying : application on the biological compoundspreservation
Maritza Alonzo Macias
To cite this version:Maritza Alonzo Macias. Comparatives studies of different drying process of strawberry hot air dry-ing freeze-drying and swell-drying : application on the biological compounds preservation. Other.Université de La Rochelle, 2013. English. �NNT : 2013LAROS398�. �tel-01066753�

!"#$%&'())%*+"$',(%'-('+*+-*&)./0"1'2'
' ' ' ' ' ' ' '
34567'
'8&"%'&+)19*%'-1':%(;1';1''
<=>37?@';1'AB?!CD7@6C37'<7'AE'@=>47AA7''
'<*FG*,-*91'2'H$9*1';1F'8%&G$;$F'C9;"F)%*1-F'6&")19"1',(%'
I(%*)J('EA=!K='IE>LE6'
'A1'MN'#(*'OPMQ'R'A('@&G.1--1''
'
S!"#$%&'()*+,-,"./%&'$%'$.001-%2"&'+-)(%&&#&'$%'&1(3,4%'$%'0-,.&%'+,-',.-'(3,#$5'67)+3.6.&,".)2'%"',#")/,+)-.&,".)2'.2&",2",21%'8',++6.(,".)2'9'6,'+-1&%-/,".)2'$%&'
()2"%2#&':.)6)4.;#%&'T'
'
<*%1G)1"%F';1')./F1'2'8%&U1FF1"%V'W(%*#'EAAEX'1)'<%V'Y&F$'H1%(%;&'I=!37YE!='HEC3Z!'
'Y"%[2'
@(,,&%)1"%' X1).*'EA=?C'\'' 8%&U1FF1"%]'H$9*1';1F'8%&G$;$F]'?9*^1%F*)$';1'D(-19G*1991F]'X%(9G1'
@(,,&%)1"%' X(%*;'K7@@=?_'\' 8%&U1FF1"%]'H$9*1';1F'8%&G$;$F]'?9*^1%F*)$';1'X/F]'I(%&G'
7`(#*9()1"%' W(%*#'EAAEX'\'' 8%&U1FF1"%]'H$9*1';1F'8%&G$;$F]'?9*^1%F*)$';1'A('@&G.1--1]'X%(9G1'
7`(#*9()1"%' E9(+1%)(]'>E@<E<=@aIE@3L!7K'\'' <&G)1"%]'6G*19G1F';1F'(-*#19)F]'bEFF*F)(9)'8%&U1FF&%c'C9F)*)")&'31G9&-d:*G&'[';1'7F)";*&F'6",1%*&%1F';1'I&9)1%%1[]'I1`*0"1'
7`(#*9()1"%' 6(9;%('31%1F*)('IE@3L!'<7A'>EI8='eE@eE\'' <&G)1"%'19'H$9*1';1'8%&G$;$F'e*&)1G.9&-&:*0"1F]'b8%&U1FF&%')*)"-(%c'C9F)*)")&'31G9&-d:*G&'[';1'7F)";*&F'6",1%*&%1F';1'I&9)1%%1[]'I1`*0"1'
7`(#*9()1"%' Y&F$'H1%(%;&''I=!37YE!=aHEC3Z!'\'' <&G)1"%]'6G*19G1F';1F'(-*#19)F]'b8%&U1FF&%')*)"-(%c'C9F)*)")&'31G9&-d:*G&'[';1'7F)";*&F'6",1%*&%1F';1'I&9)1%%1[]'I1`*0"1'
7`(#*9()1"%' 6(+(.'I=?!C@'\'' I(*)%1';1'>&9U$%19G1F]'<&G)1"%'19'H$9*1';1F'8%&G$;$F]'?9*^1%F*)$';1'K(:(J*:]'7:[,)1'
!<,*.2,"%#-' D(G-(^'6=e=ACW'\'' =-)0%&&%#-5'>12.%'$%&'=-)(1$1&5'?2./%-&."1'$%'@,'A)(3%66%5'B-,2(%'
'
?!CD7@6C37'<7'AE'@=>47AA7'
?X@'8f-1'6G*19G1'1)')1G.9&-&:*1
7)'
C!63C3?3='37>!=AgHC>='h'<7'763?<C=6'6?87@C=@76'<7'I=!37@@7h'
E99$1'OPMQ' ' '

Acknowledgments
I am sincerely grateful to Pr. ALLAF Karim and Dr. Gerardo MONTEJANO GAITÁN for
their guidance, kindness, encouragement and providing financial assistance. I am
especially thankful with Pr. Karim, I will always have a great respect for everything
that you have done for me. Besides working, I am also proud to be a member of your
big research group. My days in France were not only for schooling, I have learnt a lot
on and off Lab. Thanks for the opportunity that you provided me. Warm thanks to Dr.
Sabah MOUNIR and Dr. Anaberta CARDADOR-MARTÍNEZ for having relevantly
mentoring and supervising my experimental and fundamental work.
I also thank Pr. Fethi ALOUI, Pr. Farid ZERROUQ, Pr. Karim ALLAF, Dr. José Gerardo
MONTEJANO-GAITÁN, Dr. Sabah MOUNIR, Dr. Anaberta CARDADOR-MARTÍNEZ, Dr.
Sandra Teresita MARTÍN DEL CAMPO BARBA, and Pr. Vaclav SOBOLIK for serving on
my graduate advisory committee and for their valuable time in reviewing this
dissertation.
For the financial support, thanks to “Consejo Nacional de Ciencia y Tecnología”
(CONACyT–Mexico), “Programme de Coopération Post-Gradué France-Mexique”
(PCP - CLAVE: PCP/06/09) and to Mrs. Vicenta BLASCO from ABCAR-DIC PROCESS SAS
for technical contribution.
This gratitude is extend to my colleagues and friends of both Universities, Ismail,
Quang, Alice, Thu-Ha, Ikbal, Phu-to, Mohamed Ngem, Valerian, Alioune, Victor,
Priscila, Leticia. And, a special grateful to Carmelita by the shared experiences and
time this process.
Finally, I want to grateful all my friends from Mexico and France, for their support,
Beatriz, Isabel, Gabriela, Alondra, Diana, Vicenta, Tamara, Nabil, Victor, Karhell de
Brigit.
Maritza Alonzo Macías
March, 2013
1

Abstract
The aim of this study was to evaluate the effect of hot air drying (HAD), freeze-drying
(FD) and swell drying (SD, which is a coupling of hot air drying to instant controlled
pressure drop, DIC) on the strawberry (Fragaria var. Camarosa) to compare and to
contrast its quality in terms of drying and rehydration kinetics, bioactive compounds
and its antioxidant activity, and texture parameters as crunchy and crispy features.
The obtained results shown that SD method helped to reduce the drying time
leading to a low-cost processing compared with classical hot air drying and freeze-
drying. SD globally preserved the strawberry’s nutritional value and bioactive
compounds, increasing their availability. Moreover, a strong correlation between
antioxidant activity and total anthocyanin content was established in SD
strawberries. On the other hand, the swell-dried strawberries showed an interesting
macro and micro-structure. They presented a high expansion ratios and significant
crispness provoked by the micro-alveolation phenomenon induced as consequence
of the instant decompression process in the DIC treatment. Moreover, it was
possible to instrumentaly measure the crispy/crunchy features of the final dried
samples. By assessing such crispy and healthy contents of fruit “snacking”, it was
possible to modify, control, and optimize DIC operating parameters. And, it can be
designed according to the industrial or consumer needs.
2

Résumé :
La présente étude concerne l’évaluation de l’impact du séchage par air chaud (HAD),
lyophilisation (FD) et « swell drying » (SD), procédé couplant le séchage par air chaud
avec le procédé de Détente Instantanée Contrôlée (DIC), sur les fraises (Fragaria var.
Camarosa). Il s’agit de comparer et de contraster les performances des procédés et
la qualité du produit fini séché en termes des cinétiques de séchage et de
réhydratation, de contenus en molécules bioactives et activité antioxydante, et des
paramètres caractéristiques de texture comme croquant et croustillant. Les résultats
obtenus ont montré que le procédé de SD comparé aux procédés classiques de
séchage et de lyophilisation, réduit d’une façon importante le temps de séchage
ainsi que les coûts d’opération. D’autre part, SD conserve la qualité nutritionnelle
des fraises en gardant leur contenu en composants bioactifs et en augmentant leur
disponibilité. De plus, une corrélation importante entre la capacité antioxydante et
le contenu total d’anthocyanes a été établie. D’autre part, les fraises séchées par SD
ont montré une très intéressante macro et micro-structure. Les produits ont
présenté une haute expansion et une croustillance significative dû au phénomène de
micro-alvéolation par décompression instantanée par DIC. D’ailleurs, il a été possible
de mesurer les caractéristiques instrumentales de croustillance/croquance des
échantillons finaux séchés. Grâce à la possibilité de modifier, contrôler et optimiser
les paramètres opératoires du procédé DIC, il a été possible d’obtenir un produit du
type « snack » croustillant avec une très haute valeur nutritionnelle.
3

Table of Contents
PART I Literature review .............................................................................. 13
CHAPTER I.1 Strawberry assessment.................................................................................................. 14
I.1.1 Strawberry............................................................................................................14
I.1.1.1 Definition and plant varieties .......................................................................................................... 14
I.1.1.2 Nutritional composition .................................................................................................................. 16
I.1.2 Worldwide production .............................................................................................16
I.1.3 Phytochemicals in strawberry ..................................................................................20
I.1.3.1 Phenolic compounds in strawberry ................................................................................................. 20
I.1.3.2 Anthocyanins ................................................................................................................................... 22
I.1.3.3 Antioxidant activity ......................................................................................................................... 24
I.1.4 Strawberry and health effects..................................................................................26
I.1.5 Preserving processes of strawberry ..........................................................................26
CHAPTER I.2 Dehydration of Strawberry ............................................................................................. 28
I.2.1 High temperature dehydration .................................................................................29
I.2.1.1 Drying phenomena in strawberry ................................................................................................... 29
I.2.2 Conventional drying methods for strawberries ...........................................................31
I.2.2.1 Hot air drying ................................................................................................................................... 31
I.2.2.2 Freeze-drying................................................................................................................................... 32
I.2.3 Innovative drying methods......................................................................................33
I.2.3.1 Instant controlled pressure drop, DIC ............................................................................................. 33
I.2.3.1.1 DIC reactor and treatment ........................................................................................ 34
I.2.3.1.2 Swell-drying ............................................................................................................... 36
I.2.4 Applications of dried strawberry ...............................................................................37
CHAPTER I.3 Quality assessments ...................................................................................................... 39
I.3.1 Mathematical Modeling of dehydration and rehydration kinetics ...................................39
I.3.2 Texture analysis.....................................................................................................42
CHAPTER I.4 General objectives.......................................................................................................... 47
PART II Materials and Methods ..................................................................... 48
CHAPTER II.1 Materials ......................................................................................................................... 49
II.1.1 Chemicals and reagents ..........................................................................................49
CHAPTER II.2 Methods........................................................................................................................... 50
II.2.1 Treatment Drying Methods ......................................................................................50
II.2.1.1 Hot air drying, HAD ......................................................................................................................... 50
II.2.1.2 Freeze-drying, FD ............................................................................................................................ 50
4
II.2.1.3 Swell-drying, SD ............................................................................................................................... 50
II.2.2 Assessment Methods ..............................................................................................51
II.2.2.1 Water Moisture Content ................................................................................................................. 51
II.2.2.2 Drying Kinetics ................................................................................................................................. 52
II.2.2.3 Rehydration Kinetics ....................................................................................................................... 52
II.2.2.4 Modeling of Drying and Rehydration Kinetics ................................................................................. 52
II.2.2.5 Water Holding Capacity................................................................................................................... 53
II.2.2.6 Samples extraction .......................................................................................................................... 53
II.2.2.6.1 Total phenolic content .............................................................................................. 53
II.2.2.6.2 Flavonoid content ..................................................................................................... 54
II.2.2.6.3 Total anthocyanin content ........................................................................................ 54
II.2.2.6.4 Determination of anthocyanins by HPLC .................................................................. 55
II.2.2.6.5 Determination of antioxidant capacity by DPPH method ......................................... 55
II.2.2.7 Puncture Test .................................................................................................................................. 55
II.2.2.8 Fundamental Approach to Analyze the Force-Time Curve ............................................................. 56
II.2.2.9 Expansion ratios .............................................................................................................................. 58
II.2.2.10 Scanning Electronic Microscopy ...................................................................................................... 59
II.2.3 DIC Experimental Design ........................................................................................59
PART III Results .............................................................................................. 62
CHAPTER III.1 Comparative study of various drying processes at physical and chemical
properties of strawberries (Fragaria var. Camarosa).................................................... 63
CHAPTER III.2 Comparative study of the effects of drying methods on antioxidant activity
of dried strawberry (Fragaria var. Camarosa) ............................................................... 79
CHAPTER III.3 Texture and structure analysis of drying strawberry (Fragaria var. Camarosa)
by instant controlled pressure drop............................................................................... 99
PART IV Conclusions and Perspectives........................................................ 122
CHAPTER IV.1 Conclusions................................................................................................................... 123
CHAPTER IV.2 Perspectives ................................................................................................................. 124
PART V References ...................................................................................... 126
5
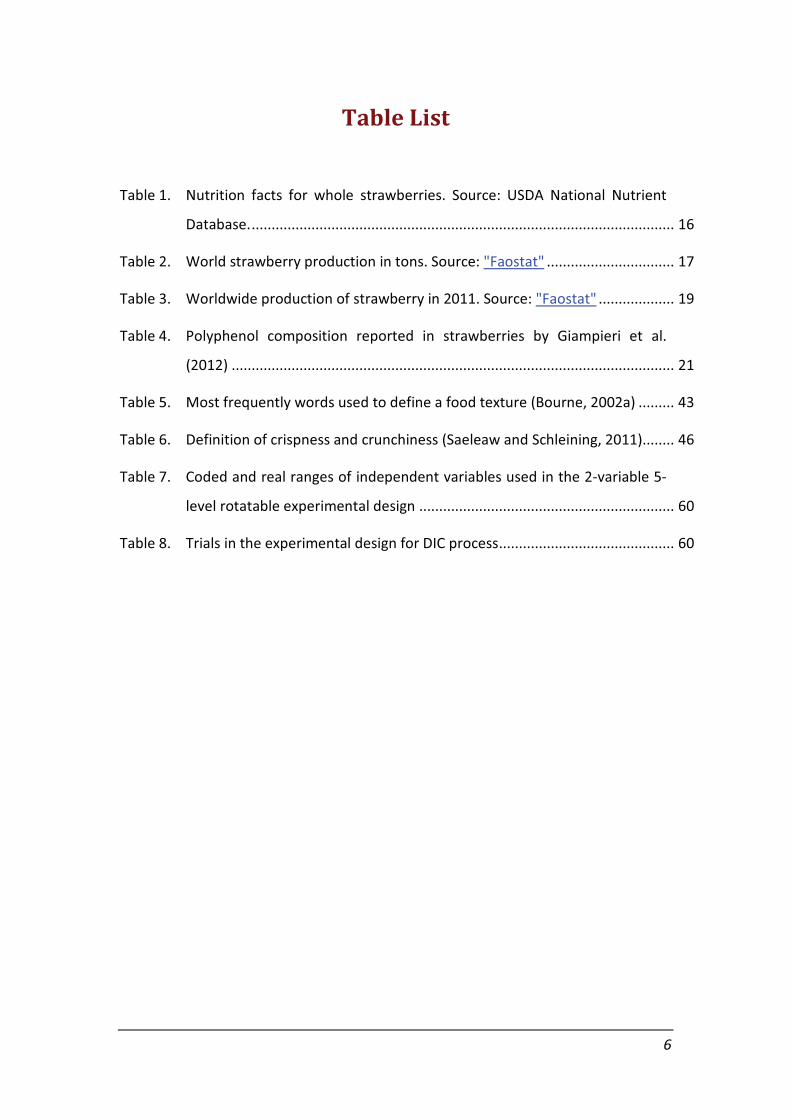
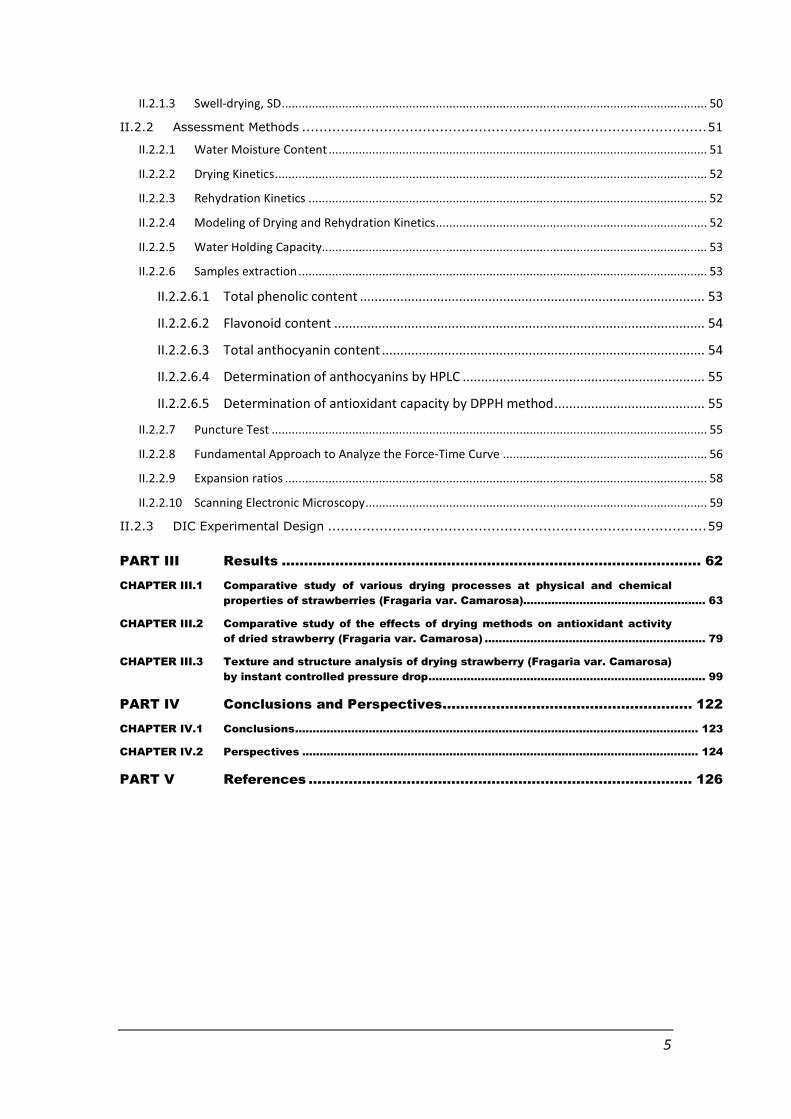
Table List
Table 1. Nutrition facts for whole strawberries. Source: USDA National Nutrient
Database. .......................................................................................................... 16
Table 2. World strawberry production in tons. Source: "Faostat" ................................ 17
Table 3. Worldwide production of strawberry in 2011. Source: "Faostat" ................... 19
Table 4. Polyphenol composition reported in strawberries by Giampieri et al.
(2012) ............................................................................................................... 21
Table 5. Most frequently words used to define a food texture (Bourne, 2002a) ......... 43
Table 6. Definition of crispness and crunchiness (Saeleaw and Schleining, 2011)........ 46
Table 7. Coded and real ranges of independent variables used in the 2-variable 5-
level rotatable experimental design ................................................................ 60
Table 8. Trials in the experimental design for DIC process ............................................ 60
6

Figures List
Figure 1. Typical strawberry in fresh form (Camarosa variety). .................................... 14
Figure 2. Typical strawberry shapes. Source: “CSC” ...................................................... 15
Figure 3. World strawberry production in 2011. Source: "Faostat" ................................. 18
Figure 4. Mean strawberry production in United States. Source: "USDA" ................... 18
Figure 5. Classification of dietary phytochemicals by Liu (2004). ................................. 23
Figure 6. Structure of mean anthocyanins in strawberry. Left) Pelargonidin 3-
glucoside, and Right) Cyanidin 3-glucoside ................................................... 24
Figure 7. Four physical transfer phenomena occurred during drying process. 1:
External heat transfer by conduction or convection. 2: Internal heat
transfer by conduction. 3: Internal mass transfer by diffusion. 4: External
mass transport from product surface to surrounding air. Drying process
can be intensified by increasing Pp (vapor partial pressure at the
exchange surface of the product) being higher than the Pa (vapor partial
pressure of external air). ................................................................................ 30
Figure 8. Schematic diagram of the DIC reactor: (1) Processing vessel; (2) Vacuum
tank; (3) Quick motion valve; (4) Steam generator; (5) Air compressor (6)
Vacuum pump. ............................................................................................... 34
Figure 9. Schematic time-pressure profiles of a DIC process: (A) vacuum
establishment; (B) steam injection; (C) pressure and time treatment; (D)
instant controlled pressure drop towards vacuum and (E) atmospheric
pressure establishment. ................................................................................. 35
Figure 10. Definition of crispness and crunchiness ........................................................ 45
Figure 11. Strawberry raw material. ............................................................................... 49
Figure 12. Scheme of treatment and assessment methods adopted for strawberry
dried samples. ................................................................................................ 51
7
Figure 13. Schematic diagram of puncture test. ............................................................. 56
Figure 14. Left) Theoretical force-deformation curves obtained by puncture test:
crunchy behavior: maximum penetration force, Fmax (N); maximum
penetration distance, Xmax (mm) and total work, Wmax, (J). Right)
Theoretical force-deformation curves obtained by puncture test: crispy
behavior: the penetration distance for each micro-rupture peak, !X
(mm); the individual force drops for each micro-rupture peak (!F, N) and
the average work for micro-ruptures, wrupture (J). .......................................... 56
Figure 15. Real force-deformation curve recorded by puncture test: crunchy and
crispy behavior. .............................................................................................. 57
8
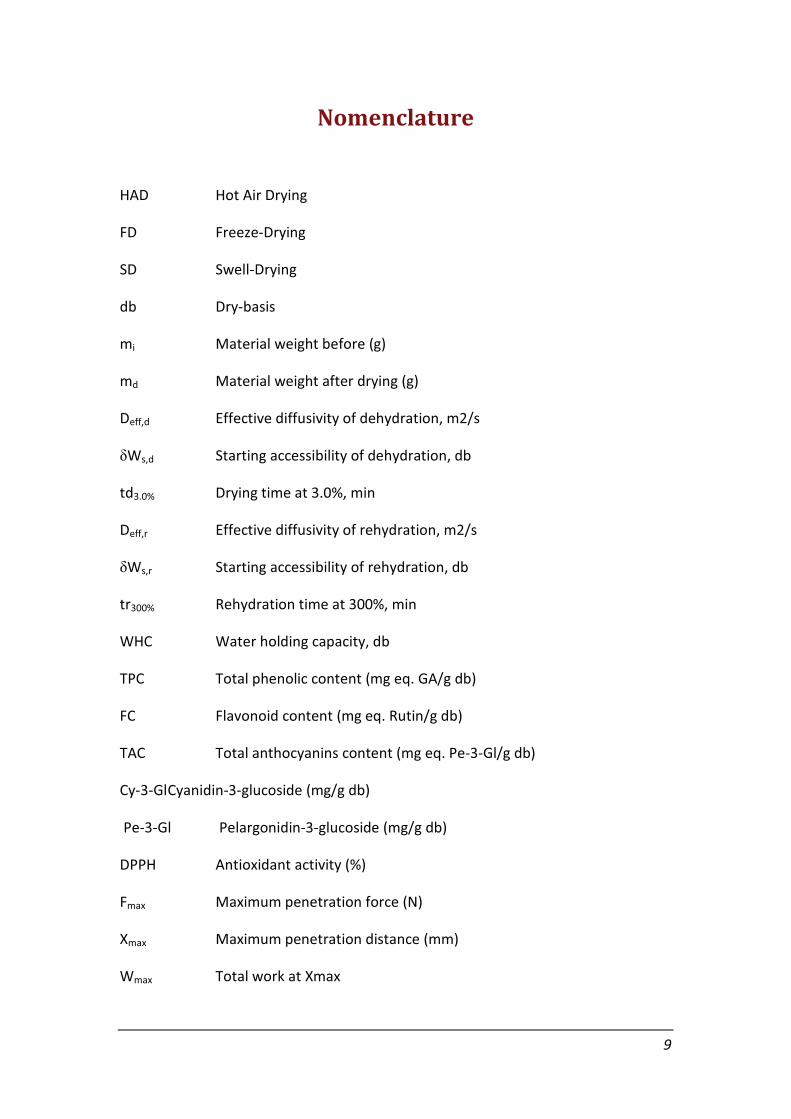
Nomenclature
HAD Hot Air Drying
FD Freeze-Drying
SD Swell-Drying
db Dry-basis
mi Material weight before (g)
md Material weight after drying (g)
Deff,d Effective diffusivity of dehydration, m2/s
!Ws,d Starting accessibility of dehydration, db
td3.0% Drying time at 3.0%, min
Deff,r Effective diffusivity of rehydration, m2/s
!Ws,r Starting accessibility of rehydration, db
tr300% Rehydration time at 300%, min
WHC Water holding capacity, db
TPC Total phenolic content (mg eq. GA/g db)
FC Flavonoid content (mg eq. Rutin/g db)
TAC Total anthocyanins content (mg eq. Pe-3-Gl/g db)
Cy-3-Gl Cyanidin-3-glucoside (mg/g db)
Pe-3-Gl Pelargonidin-3-glucoside (mg/g db)
DPPH Antioxidant activity (%)
Fmax Maximum penetration force (N)
Xmax Maximum penetration distance (mm)
Wmax Total work at Xmax
9

<F> Average puncturing force (N)
n Total number of peaks
N Spatial frequency of structural micro-ruptures (m-1)
f Average micro-ruptures force (N)
wrupture Average work for micro-ruptures
"X Penetration distance for each micro-rupture peak (mm)
"F Individual force drops for each micro-rupture peak (N)
#absolute Absolute expansion ratio
#relative Relative expansion ratio
$intrinsic Density intrinsic (g/cm3)
$specific Density specific (g/cm3)
$sand Density of sand (g/cm3)
msample mass of sample (g)
msand mass of sand (g)
ms,1 mass initial of sand (g)
ms,2 mass final of sand (g)
10

Introduction
Strawberry is universally recognized as having a basic chemical composition that
accentuates their sweet taste, fruity aroma, and healthy properties that are enjoyed
by societies throughout the world. It is a good source of essential vitamins and
minerals, and has diverse phytochemical compositions that relate to consumer
satisfaction and health (da Silva et al., 2007). The chemical composition strawberry
can be highly variable depending on the cultivar, growing location, ripeness stage,
and harvest and storage conditions.
Around the world, it is consumed “in natura” or in processed form, such as jams,
juices, and jellies by their sweet taste and potential benefits to the health (Giampieri
et al., 2012). Mainly, strawberry contains phenolic compounds and anthocyanins,
two large and heterogeneous groups of biologically active molecules, they are
known by their antioxidant activities (Panico et al., 2009). Phenolic compounds
present in strawberries are ellagic and p-coumaric acid; flavonoids as quercetin,
kaempferol and myricetin. Anthocyanins are a group of phenolic compounds
responsible for the red-blue color of many fruits and vegetables. Pelargonidin 3-
glucoside, cyaniding 3-glucoside and pelargonidin 3-rutinoside are the main
anthocyanins found in strawberries, which are responsible for their bright red color
(Böhm, 1994; Crecente-Campo et al., 2012). Moreover, several researchers have
demonstrated that strawberry have a greater antioxidant capacity (2-to 11-fold)
than apples, peaches, grapes, … (Wang et al., 1996; Scalzo et al., 2005). And, by its
antioxidant activity, they are important in the prevention of certain types of cancers,
as well as, anti-inflammatory functions, cardiovascular, obesity and other chronic
diseases (Crecente-Campo et al., 2012).
Unfortunately, strawberry postharvest life is relatively short, due to their highly
fragile structure and their high rates of respiration (Modise, 2008). At the same time,
it is highly susceptible to bruises and fungal attacks (Blanda et al., 2009). This
problem affects also its bioactive compounds and antioxidant activity.
11
Hence, to extent the shelf-life strawberry and preserve its bioactive activity, large
range of unit operations have been proposed and used to preserve it. New
operations such swell-drying (instant controlled pressure drop, DIC-assisted hot air
drying) is proposed. DIC is a high temperature short time (HTST) treatment followed
by an abrupt pressure drop towards a vacuum implying an autovaporization of small
amount of water from the products.
Therefore, the swell-drying products have a controlled texture expansion to improve
the quality product and the physical properties. This texture change results in higher
porosity, as well as the increases of the specific surface area and reduces the
diffusion resistance of moisture during the final dehydration step (Mounir et al.,
2012). Moreover, this structural change provides a versatile function in the dried
foods, producing the "snacking". But it could be considered as a highly-functional
snack, due to its preservation of vitamins, bioactive compounds, color and flavor.
And, it is proposed that crunchiness and crispiness are the textural attributes that
better describe the snack quality and even freshness. Both, crunch and crisp features
are studied by instrumental methods, as puncture test. This method can provide
important information about the functionality of fruit snack and it can be supported
by microstructure analysis.
In consequence, this study is structured as follows. In the first section, the literature
review is presented. The results section is divided in three chapters, each one
presents a paper published, except the last, it is in revision by the journal.
12

PART I
LITERATURE REVIEW
13

CHAPTER I.1
STRAWBERRY ASSESSMENT
I.1.1 Strawberry
The popularity and worldwide demand for fresh and processed strawberries have
made them one of the most extensively researched berries in the world. The quality
of fresh strawberries as a function of their chemical composition and organoleptic
attributes is an important area of study (Zhao, 2007). Color, texture, odor and the
balance between sweetness and sourness have been identified as important
determinants of overall quality of strawberry fruit (Montero et al., 1996). And,
numerous studies have indicated that strawberry’s quality is the most important
factor that influence for consumer acceptance (Montero et al., 1996; Cordenunsi et
al., 2003; da Silva et al., 2007; Hancock et al., 2008; Giampieri et al., 2012; Holzwarth
et al., 2012).
I.1.1.1 Definition and plant varieties
The strawberry (Fragaria x ananassa Duch.), a member of the rose family, is not
really a berry, but an achene or “false” fruit. A strawberry consists of many tiny
individual fruits embedded in fleshy scarlet receptacle. The brownish or whitish
specks, commonly considered seeds, are the true fruits, known as achenes. Each
achene surrounds a tiny seed. These berry components make strawberries relatively
high in fiber (Harris, 2007). In Figure 1 a typical fresh strawberry is shown.
Figure 1. Typical strawberry in fresh form (Camarosa variety).
14

Nowadays, over 600 different strawberry varieties are in the worldwide (Source:
“USDA”). They are stem from five or six original wild species. The strawberry
varieties are so different in shape, color and taste. Typically, the larger the berry, the
more water it contains, the smaller the berry, the greater the intensity of flavor
(Figure 2). Also, all of them are available in the commercial market.
In United States, there are over 100 varieties offered by over 40 different companies.
Specifically, the state of California has several strawberry varieties in commercial
production, each with its own characteristics, advantages and harvest time. And the
University of California developed 55.1% of varieties used for the total state acreage
in 2011 (Source: “CSC”).
Figure 2. Typical strawberry shapes. Source: “CSC”
Some varieties of strawberry patented by the University of California patented are
Aromas, Camarosa, Camino Real, Capitola, Carlsbad, Chandler, Diamante, Fern,
Gaviota, Irvine, Oso Grande, Pacific, Seascape, Selva and Ventana. Descriptions of
some of them are as follows (Source: “CSC” and “NCCIA”):
o Aromas. It is large and firm fruit. It has a great flavor with good color
and a bright sheen.
o Camino Real. It is firm and has a dark red fruit with a long shelf life
and good flavor.
15
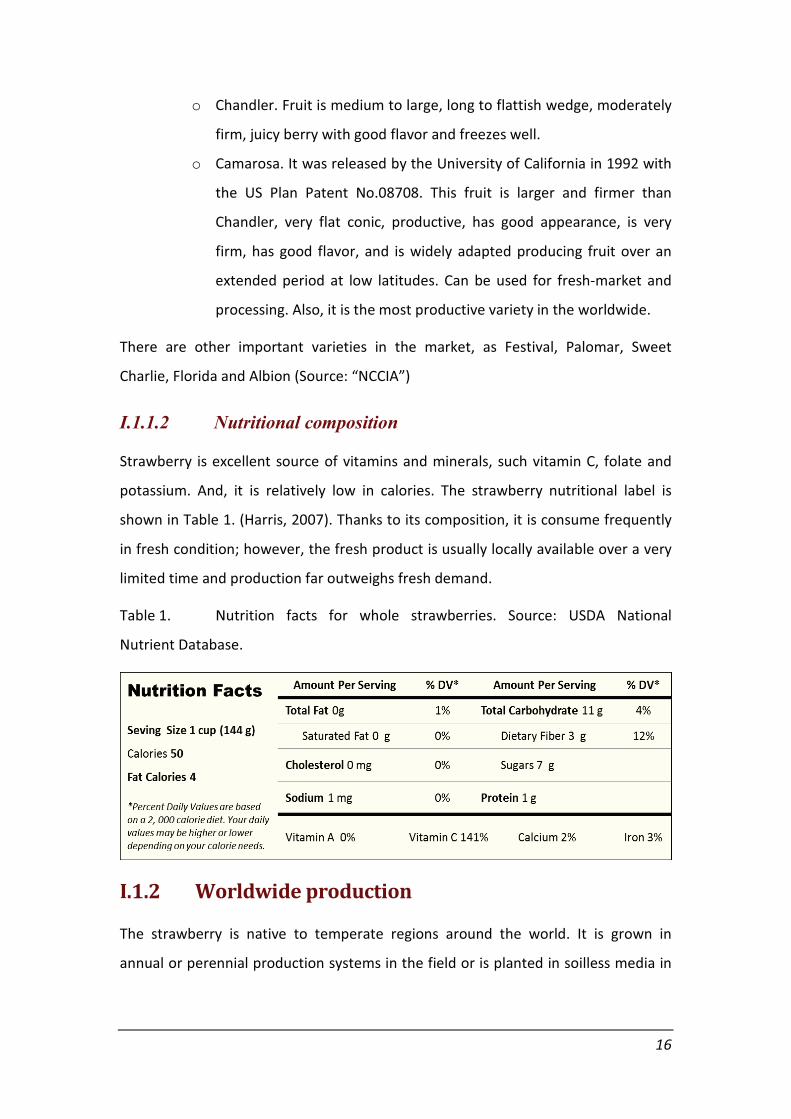
o Chandler. Fruit is medium to large, long to flattish wedge, moderately
firm, juicy berry with good flavor and freezes well.
o Camarosa. It was released by the University of California in 1992 with
the US Plan Patent No.08708. This fruit is larger and firmer than
Chandler, very flat conic, productive, has good appearance, is very
firm, has good flavor, and is widely adapted producing fruit over an
extended period at low latitudes. Can be used for fresh-market and
processing. Also, it is the most productive variety in the worldwide.
There are other important varieties in the market, as Festival, Palomar, Sweet
Charlie, Florida and Albion (Source: “NCCIA”)
I.1.1.2 Nutritional composition
Strawberry is excellent source of vitamins and minerals, such vitamin C, folate and
potassium. And, it is relatively low in calories. The strawberry nutritional label is
shown in Table 1. (Harris, 2007). Thanks to its composition, it is consume frequently
in fresh condition; however, the fresh product is usually locally available over a very
limited time and production far outweighs fresh demand.
Table 1. Nutrition facts for whole strawberries. Source: USDA National
Nutrient Database.
I.1.2 Worldwide production
The strawberry is native to temperate regions around the world. It is grown in
annual or perennial production systems in the field or is planted in soilless media in
16
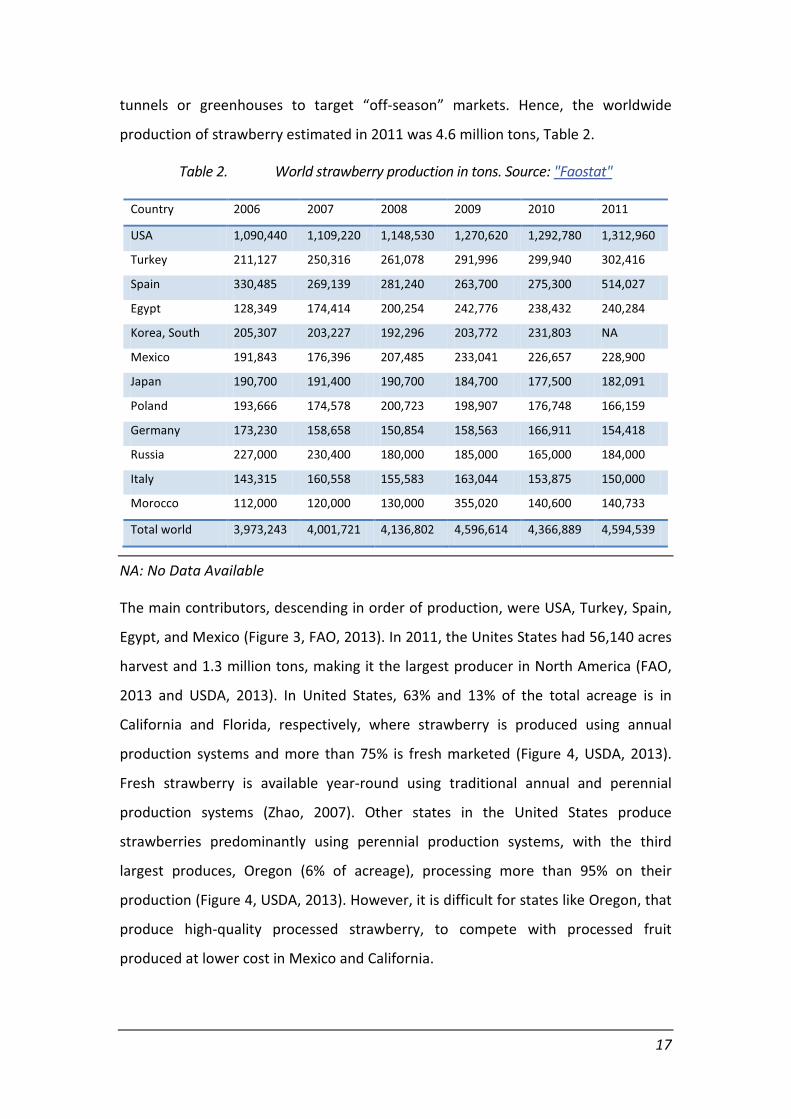
tunnels or greenhouses to target “off-season” markets. Hence, the worldwide
production of strawberry estimated in 2011 was 4.6 million tons, Table 2.
Table 2. World strawberry production in tons. Source: "Faostat"
Country 2006 2007 2008 2009 2010 2011
USA 1,090,440 1,109,220 1,148,530 1,270,620 1,292,780 1,312,960
Turkey 211,127 250,316 261,078 291,996 299,940 302,416
Spain 330,485 269,139 281,240 263,700 275,300 514,027
Egypt 128,349 174,414 200,254 242,776 238,432 240,284
Korea, South 205,307 203,227 192,296 203,772 231,803 NA
Mexico 191,843 176,396 207,485 233,041 226,657 228,900
Japan 190,700 191,400 190,700 184,700 177,500 182,091
Poland 193,666 174,578 200,723 198,907 176,748 166,159
Germany 173,230 158,658 150,854 158,563 166,911 154,418
Russia 227,000 230,400 180,000 185,000 165,000 184,000
Italy 143,315 160,558 155,583 163,044 153,875 150,000
Morocco 112,000 120,000 130,000 355,020 140,600 140,733
Total world 3,973,243 4,001,721 4,136,802 4,596,614 4,366,889 4,594,539
NA: No Data Available
The main contributors, descending in order of production, were USA, Turkey, Spain,
Egypt, and Mexico (Figure 3, FAO, 2013). In 2011, the Unites States had 56,140 acres
harvest and 1.3 million tons, making it the largest producer in North America (FAO,
2013 and USDA, 2013). In United States, 63% and 13% of the total acreage is in
California and Florida, respectively, where strawberry is produced using annual
production systems and more than 75% is fresh marketed (Figure 4, USDA, 2013).
Fresh strawberry is available year-round using traditional annual and perennial
production systems (Zhao, 2007). Other states in the United States produce
strawberries predominantly using perennial production systems, with the third
largest produces, Oregon (6% of acreage), processing more than 95% on their
production (Figure 4, USDA, 2013). However, it is difficult for states like Oregon, that
produce high-quality processed strawberry, to compete with processed fruit
produced at lower cost in Mexico and California.
17

Figure 3. World strawberry production in 2011. Source: "Faostat"
The most common commercial varieties in California are the Camarosa, Diamante,
Chandler, and Selva. Proprietary and other varieties, representing about 32% of
acreage, are bred and grown for individual shipping companies, and are not available
to the public (Harris, 2007).
Figure 4. Mean strawberry production in United States. Source: "USDA"
According the Food and Agriculture Organizations of the United Nations (FAO, 2013),
in 2011 Mexico produced 228,900 tons of strawberries on 17,243 acres using annual
production systems (Table 2). Mexico typically exports about 30,000 tons/year, of
which 70% is processed and 30% is fresh. Most of the exports are to the United
States, but fruit is also shipped to Canada, Japan, and Europe (SIAP, 2013).
18
The strawberry’s production in Turkey has increased considerably over the last 10
years (Table 2). Indeed, Turkey is the mean country of Middle East that produced
more than 70% of strawberry (Table 3). The production of this fruit in Turkey is
mostly on small family farms. Other strawberry-producing countries in this region
were Iran (21%), Israel (3%), Lebanon, Palestine, Cyprus, and Jordan (FAO, 2013).
On the other hand, 84% of the total acreage in Africa was accounted by Egypt and
Morocco (Table 3). There was also some strawberry production in South Africa,
Tunisia, and Zimbabwe. The Californian cultivars in annual production systems were
the mean used in most areas of this region. And, Egypt exported mainly to the
United Kingdom.
Concerning to South America, strawberries were planted in Chile (28% of the total
acreage), Peru (27%), Columbia (15%), Venezuela, Brazil (9%), Paraguay (6%), and
Ecuador (4%). About 50% to 70% of the strawberries were shipped fresh, while 30%
to 50% were shipped frozen. There was also some strawberry production in Central
America, mainly in Guatemala and Costa Rica (Table 3). And, the Californian cultivars
in the annual production systems were common.
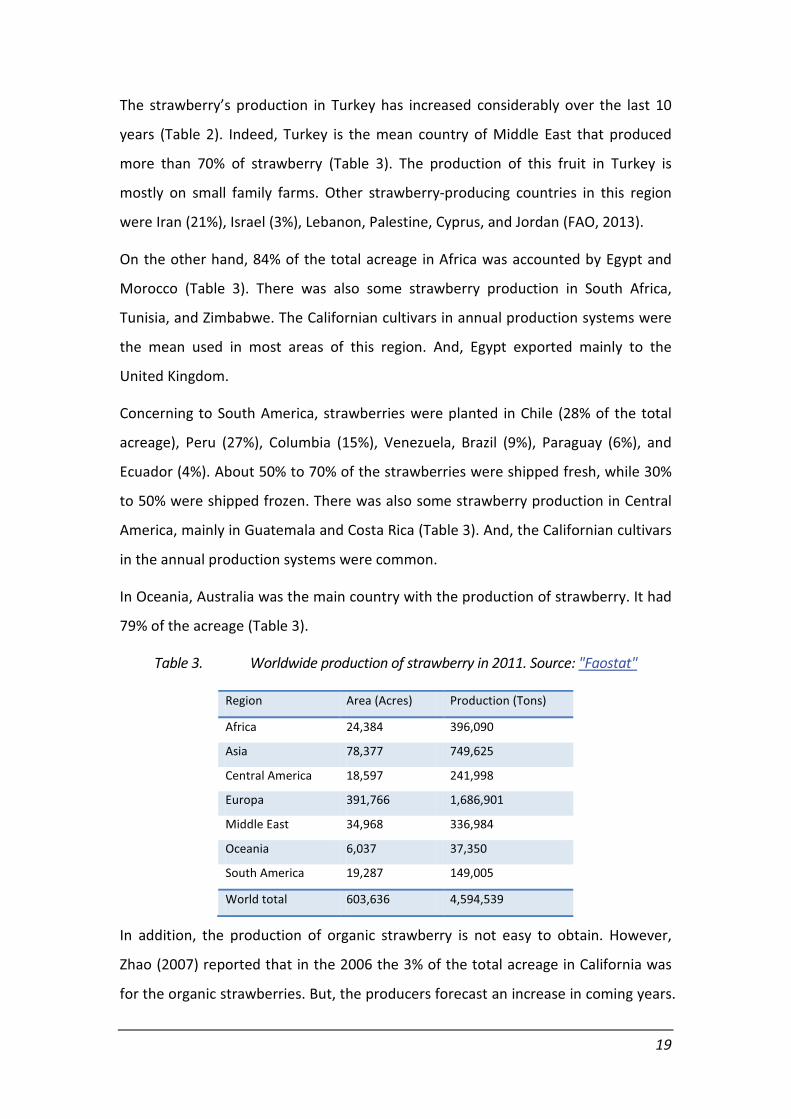
In Oceania, Australia was the main country with the production of strawberry. It had
79% of the acreage (Table 3).
Table 3. Worldwide production of strawberry in 2011. Source: "Faostat"
Region Area (Acres) Production (Tons)
Africa 24,384 396,090
Asia 78,377 749,625
Central America 18,597 241,998
Europa 391,766 1,686,901
Middle East 34,968 336,984
Oceania 6,037 37,350
South America 19,287 149,005
World total 603,636 4,594,539
In addition, the production of organic strawberry is not easy to obtain. However,
Zhao (2007) reported that in the 2006 the 3% of the total acreage in California was
for the organic strawberries. But, the producers forecast an increase in coming years.
19

Otherwise, fresh strawberries are most commonly shipped in clamshell containers.
Strawberries are processed as individually quick frozen (IQF), bulk frozen, sliced and
sugared, freeze-dried, pureed, or juice/concentrate (Harris, 2007).
I.1.3 Phytochemicals in strawberry
The “phyto-” of the word phytochemicals is derived from the Greek word phyto,
which means plant. Therefore, literally phyto-chemicals are “plant chemicals”. And,
they are defined as bioactive non-nutrient plant compounds in fruits, vegetables,
grains, and other plant foods that have been linked to reducing the risk of major
chronic diseases (Liu, 2004). These phytochemicals can be divided into several
categories including carotenoids, phenolics, alkaloids, nitrogen-containing
compounds, and organosulfur compounds (Figure 5). One of the largest categories of
phytochemicals is phenolic compounds. The structure of phenolic compounds
contains aromatic ring(s) bearing hydroxyl group(s) and can range from simple
molecules to very large oligomers (Seeram et al., 2006). Moreover, phenolic
compounds are plant metabolites that are very sensitive and vulnerable to change
because they are easily oxidized (Herrera and Luque de Castro, 2005). And, they are
found in many fruits and vegetables but are specially abundant in berry fruits
(Seeram et al., 2006).
I.1.3.1 Phenolic compounds in strawberry
Phenolic compounds in strawberry are represented by the flavonoids (mainly
anthocyanins and flavonols; however, flavanols providing a minor contribution),
followed by hydrolyzable tannins (ellagitannins and gallotannins) and phenolic acids
(hydroxybenzoic acids and hydroxycinnamic acids), with condensed tannins
(proanthocyanidins) being the minor constituents (Giampieri et al., 2012). However,
strawberry’s phenolic content varies with the cultivar, growing conditions, degree of
ripeness, and handling after harvest (Hannum, 2004). Variability in the data is also
due to methodological differences, since there is a lack of agreement on what is the
appropriate method to analyze these compounds. All of these factors make it
difficult to compare the results of different research studies (Zhao, 2007).
20
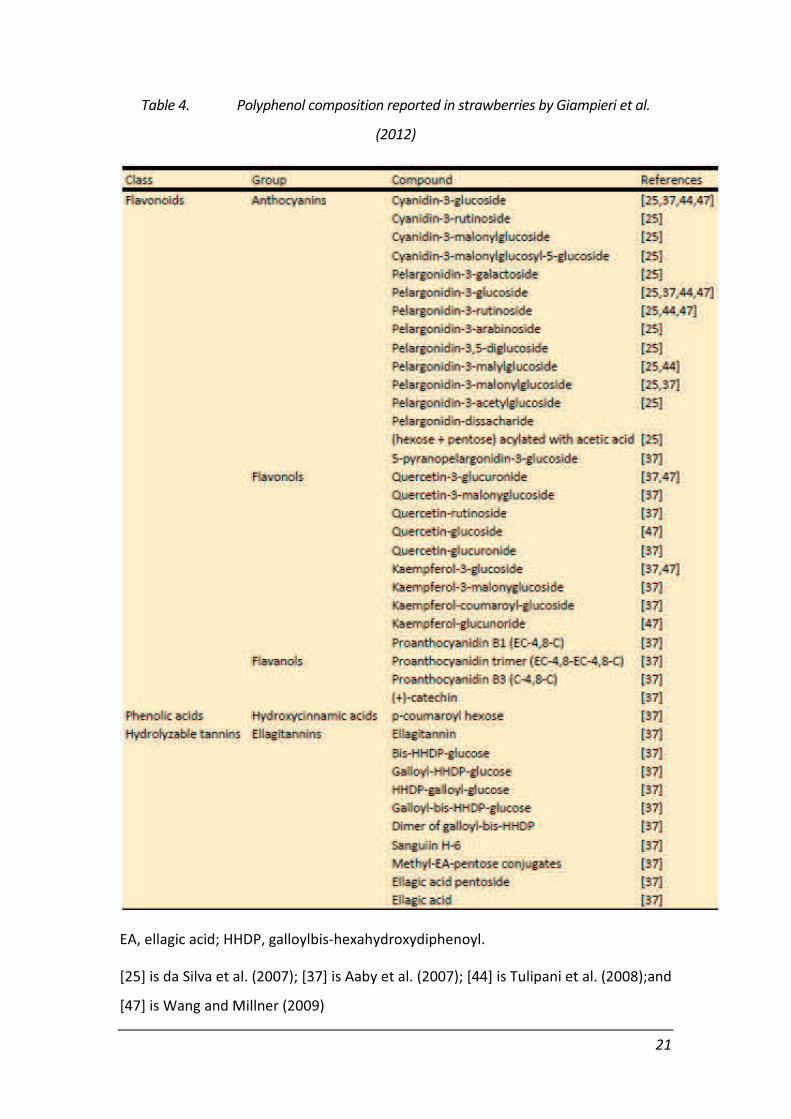
Table 4. Polyphenol composition reported in strawberries by Giampieri et al.
(2012)
EA, ellagic acid; HHDP, galloylbis-hexahydroxydiphenoyl.
[25] is da Silva et al. (2007); [37] is Aaby et al. (2007); [44] is Tulipani et al. (2008);and
[47] is Wang and Millner (2009)
21

The Folin Ciocalteu (FC) reagent is the common method for determining the amount
of total phenolics in berries, with the total amount of phenolics expressed as gallic
acid equivalents. Even though, this method has several limitations, such as
differential responses of various groups of phenolics to the FC reagent and
interference from nonphenolic compounds with reducing capacity, it is a simple
assay to perform and has been widely used (Montero et al., 1996; Kähkönen et al.,
1999; Zhao, 2007; de Oliveira et al., 2009).
Giampieri et al. (2012), gathered the main polyphenol composition in strawberries
reported by different studies (Table 4).
I.1.3.2 Anthocyanins
The anthocyanins group is responsible for cyanic colors ranging from salmon pink
through red and violet to dark blue of most flowers, fruits, and leaves angiosperms
(Quideau, 2006). In the case of strawberry and other berries, the anthocyanins give
to berries their red and blue hues and also, they act as potent antioxidants (Mazza,
2007). Hence, the anthocyanin composition in strawberry has been the object of
various studies, but is still not fully characterized regarding minor pigments (da Silva
et al., 2007). However, anthocyanins in strawberries are the best known
polyphenolic compounds and quantitatively the most important (Giampieri et al.,
2012). More than 25 different anthocyanin pigments have been described in
strawberries of different varieties and selections (da Silva et al., 2007). However,
pelargonidin-3-glucoside (Pe3Gl) is the major anthocyanin in strawberries
independent from genetic and environmental factors, and the presence of cyanidin-
3-glucoside (Cy3Gl) seems to be constant in strawberries, although only in smaller
proportions, Figure 6 (Hannum, 2004; Tulipani et al., 2008). The concentration of
both, Pe3Gl and Cy3Gl are in function of the strawberry cultivar. da Silva et al. (2007)
analyzed five different cultivars of strawberry (i.e. Eris, Oso Grande, Carisma,
Tudnew and Camarosa) and found that the total anthocyanin content ranged
between 200 and 600 mg/kg, with Pe3Gl constituting 77-90% of the anthocyanins in
the strawberry extracts followed by Cy3Gl (3-10%) and the Camarosa cultivar
presented the highest values.
22
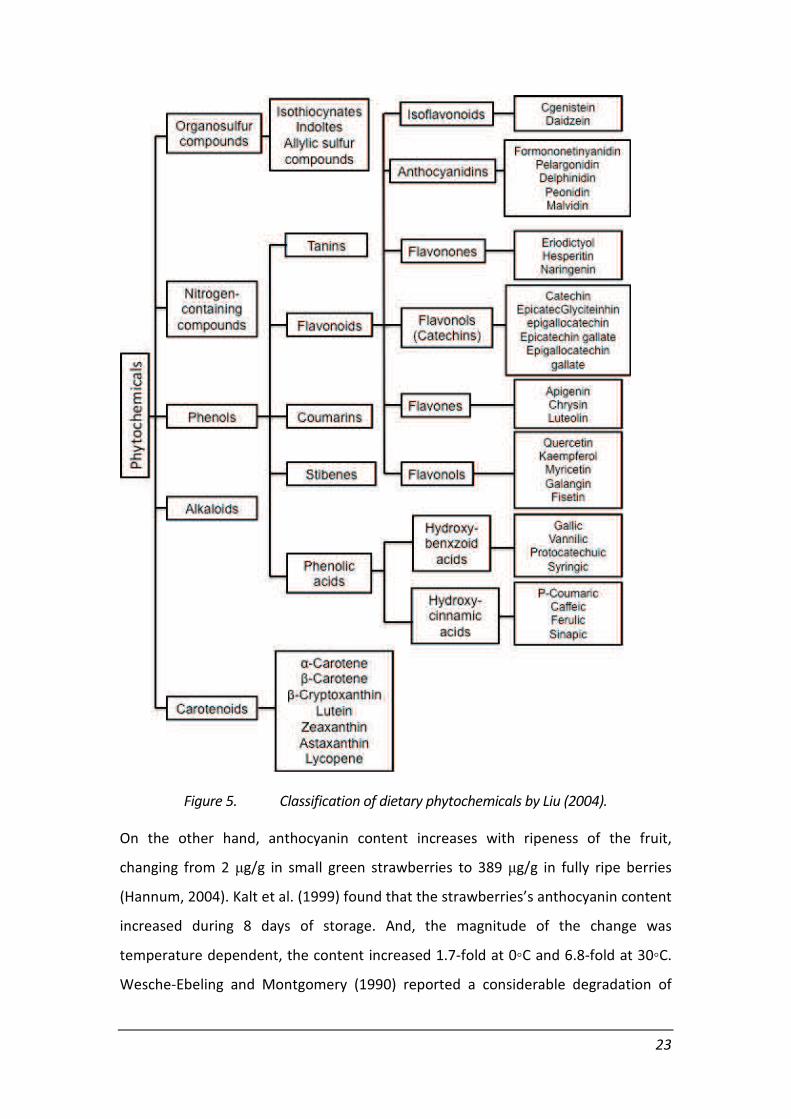
Figure 5. Classification of dietary phytochemicals by Liu (2004).
On the other hand, anthocyanin content increases with ripeness of the fruit,
changing from 2 %g/g in small green strawberries to 389 %g/g in fully ripe berries
(Hannum, 2004). Kalt et al. (1999) found that the strawberries’s anthocyanin content
increased during 8 days of storage. And, the magnitude of the change was
temperature dependent, the content increased 1.7-fold at 0&C and 6.8-fold at 30&C.
Wesche-Ebeling and Montgomery (1990) reported a considerable degradation of
23

anthocyanins in processed strawberries due to oxidative enzymes. Hence,
anthocyanins’ stability depends on their structure as well as on the matrix and
composition of the medium. Temperature, pH, light, oxygen and ascorbic acid highly
affect the half-life of anthocyanins (Hartmann et al., 2008). Anthocyanins also
condense with other phenolic compounds to form oligo- and polymers (Fernandez-
Panchon et al., 2008). Moreover, the anthocyanins’ changes during processing and
storage are visible to the naked eye, especially in the case of strawberry products
which are characterized by fast browning (Hartmann et al., 2008).
Figure 6. Structure of mean anthocyanins in strawberry. Left) Pelargonidin 3-
glucoside, and Right) Cyanidin 3-glucoside
I.1.3.3 Antioxidant activity
The antioxidant power of fruit is closely correlated to the presence of efficient
oxygen radical scavengers, such vitamin C and phenolic compounds (Giampieri et al.,
2012). Several researchers have demonstrated that strawberry have a greater
antioxidant capacity (2-to 11-fold) than apples, peaches, grapes, .… (Wang et al.,
1996; Scalzo et al., 2005). In a study by Halvorsen et al. (2006) over 1,000 foods and
beverage were analyzed for determine its antioxidant capacity and found that
strawberry was ranked third in total antioxidant capacity (TAC) per serving. Only
blackberries and walnuts were found to be higher in antioxidant capacity.
Otherwise, TCA is strongly influenced by the individual contribution of different
phytochemical compounds in fruit. It means that there is a linear relationship of
phenolics and anthocyanins and antioxidant capacity (Zhao, 2007). The study
24
realized by Tulipani et al. (2008), where different strawberries cultivars were
analyzed, demonstrated that vitamin C was the responsible for more than 30% of the
TAC of strawberry extracts, followed by anthocyanins (25-40%), and the rest was
composed mainly by ellagic acid derivatives and flavonols.
On the other hand, there are several methods to analyze the TAC in fruits; however
the mainly assays reported and used in strawberry by different researches are as
follows:
a. ORAC assay, than can be performed using either phycoerythrin (PE) or
fluorescein (FL) as fluorescent probe. It must be taken into account that ORAC-
FL renders values four times higher with respect to ORAC-PE (Fernandez-
Panchon et al., 2008).
b. ABTS [2,2-azino-bis(3-ethylbenzthiazoline-6-sulphonic acid)]. In this assay, ABTS
is converted to its radical cation by addition of sodium persulfate. This radical
cation is blue in color and absorbs light at 734 nm. The ABTS radical cation is
reactive towards most antioxidants including phenolics, thiols and Vitamin C.
During this reaction, the blue ABTS radical cation is converted back to its
colorless neutral form. The reaction may be monitored spectrophotometrically.
This assay is often referred to as the Trolox equivalent antioxidant capacity
(TEAC) assay. The reactivity of the various antioxidants tested is compared to
that of Trolox, which is a water-soluble analog of vitamin E (Re et al., 1999).
c. FRAP reagent (ferric reducing antioxidant power). Ferric to ferrous ion reduction
at low pH causes a colored ferrous-tripyridyltriazine complex to form. FRAP
values are obtained by comparing the absorbance change at 593 nm in test
reaction mixtures with those containing ferrous ions in known concentration
(Benzie and Strain, 1996).
d. DPPH (2,2-diphenyl-1-picrylhydrazyl) radical scavenging as a free radical. The
scavenging capacity of DPPH is evaluated as its percent of discoloration and
expressed as antiradical activity (% ARA) (Oomah et al., 2005)
In addition, is important take into account that different values can be obtained for
TAC of strawberry due to internal factors as the maturity degree or the genotypic
variety, or external factors as the geographical area and the climate where the
25

strawberry was cultivated, inclusive the laboratory where the method was
performed (Fernandez-Panchon et al., 2008).
I.1.4 Strawberry and health effects
The hypothesis that dietary antioxidants lower the risk of chronic disease was
developed from epidemiological studies. These studies have consistently shown that
consumption of whole foods, such as fruits, vegetables, and whole grains, is strongly
associated with reduced risk of chronic diseases, especially cancer and
cardiovascular disease (Liu, 2004).
In the case of strawberry, in recent years, numerous studies have proven that its
wide variety of phytochemicals is bioactive. For example, anthocyanins display a
wide range of biological activities, including antioxidant, anti-inflammatory,
antimicrobial and anti-carcinogenic activities; improvement of vision; induction of
apoptosis; and neuroprotective effects (Mazza, 2007)
Likewise, the individual components of strawberry have demonstrated inhibition of
LDL oxidation and lipid peroxidation (Hannum, 2004). And, because of the
antioxidant power of the phenolic compounds in strawberries, consumption of this
fruit may well have the potential to lower risk of heart disease (Giampieri et al.,
2012).
Also, animal studies have indicated that the antioxidant activity of strawberries has
the potential to provide benefits to the aging brain (Fernandes et al., 2012).
Now, it is reasonable to believe that strawberry helps contribute to health benefit,
based on what we know about their bioactive components.
I.1.5 Preserving processes of strawberry
Like other fruits, strawberries can be consumed ‘‘in natura’’, which turns out to be
advantageous to consumers since there are no nutritional losses due to processing.
On the other side, the preference for fresh fruits is challenging because they have a
very short shelf-life, due to their sensitivity to fungal attack and excessive texture
softening caused by the natural ripening process (Cordenunsi et al., 2005).
26

Therefore, the strawberry can be preserved by freezing and drying processes such as
freeze, osmotic, microwave, and air drying (Ratti, 2001; Shishehgarha et al., 2002; El-
Beltagy et al., 2007; Modise, 2008). Besides, it could consume fresh or in many other
forms such as juice, concentrate jam, and jelly and dried rehydrated with yoghurt
and bakery products (Harris, 2007).
27

CHAPTER I.2
DEHYDRATION OF STRAWBERRY
Dehydration is the oldest method to preserve the food. And, the mean objective of
drying is to remove water until the water activity is low enough to prevent growth of
microorganisms and increase the shelf life of product. However, the drying process
not only decreases the water content of the product, but also affects other physical
and chemical properties; which will change the shape, crispness, hardness, aroma,
flavor and nutritive value of the fresh product.
High-temperature dehydration includes two different unit operations: heat transfer
from a heat source to the food material, and mass transfer from the food material to
the surrounding media (Fellows, 2000). When high temperature is involved,
evaporation of water occurs at normal pressure, while in freeze-drying, temperature
and pressure are low and sublimation of water (Hammami and René, 1997; Fellows,
2000).
Strawberry drying must consider the effect of temperature on all factors that
determine the nature of the fruit, such as phenol content, soluble fiber content,
vitamins, etc. (Ioannou and Ghoul, 2012). The use of high temperatures can produce
a harmful effect in the product instead of maintaining the qualities for which these
products are especially appreciated (Hung and Duy, 2012).
Even though, drying is not the principal preservation or processing method used in
strawberry, it is one of the more suitable alternatives to maintain specific functional
components such as dietary fiber, pigment, and low molecular weight carbohydrates
(Alvarez et al., 1995). Therefore, drying process should be used with special care in
strawberry to avoid chemical changes that may lead to the loss of these important
functional components (Ioannou and Ghoul, 2012). And also, it should be carried out
at low temperatures to produce a low-rate water removal to prevent hardening and
sugar crystallization (Doymaz, 2008).
28
I.2.1 High temperature dehydration
As mentioned above, the high-temperature dehydration process is very complex.
However, it is comprehend and studied as a combination of two unit operations
acting simultaneously: heat transfer and water mass transfer. Heat is normally
produced by a combustion source; an indirect heat exchanger transferring energy to
an air stream that conducts it to water in the product. Water evaporates and the
water vapor produced is then removed from the product surface and out of the drier
by the air stream (Schierbaum, 1965; Fellows, 2000). The heat transferred to the
product and the water transferred from the product to the air stream are affected
by the air, water content, relative humidity, and dry bulb and wet bulb temperatures
(Krokida et al., 1997; Chua et al., 2003; Doymaz, 2008)
I.2.1.1 Drying phenomena in strawberry
When sliced strawberries are placed in a drier, the process does not follow a lineal
behavior. Water is removed in different stages due to it depends on the structure,
the presence of seeds, and the nature of the skin and epicuticular waxes of the
strawberry. The four physical mechanisms of transfer presented in the strawberry
are adapted by Mounir and Allaf (2009), Figure 7.
1) External heat transfer: heat is transported from an air stream flowing over or
through the material to the strawberry surface. This process occurs because of
the temperature gradient and is controlled by a heat transfer coefficient that
depends mainly on air speed and flow.
2) Internal heat transfer: by conduction, the heat is transmitted within the
strawberry. And, this mechanism depends on the fruit type, water content, and
temperature gradient inside the fruit. Hence, in these two processes, the
question is to bring the necessary energy to transform water into vapor.
3) Internal water transfer: it is carried out either in liquid form or in vapor phase,
by various process including capillarity; molecular diffusivity; the driving forces
are the gradients of respectively the water content and the partially pressure.
The nature of vegetables structure should not naturally support these water
transfer processes. Indeed, generally "trapped" within the cell, water must
29
firstly cross the cytoplasmic membrane, get to the cellular wall, diffuse through
the structure, and reach the external surface to be, subsequently, able to
separate from the product. These processes play a very important role and the
resistance of the structure to this transfer often seems to be the principal
restrictive factor of the operation kinetics.
4) External water transfer: The water transport is generally in vapor form and it is
taken to the surface towards outside in order to maintain the possible greatest
gradient of humidity, principal driving force of dehydration. At the starting
moment, this transport is instant and depending of the interface surface.
Afterward, it is normally limited by the intern diffusion.
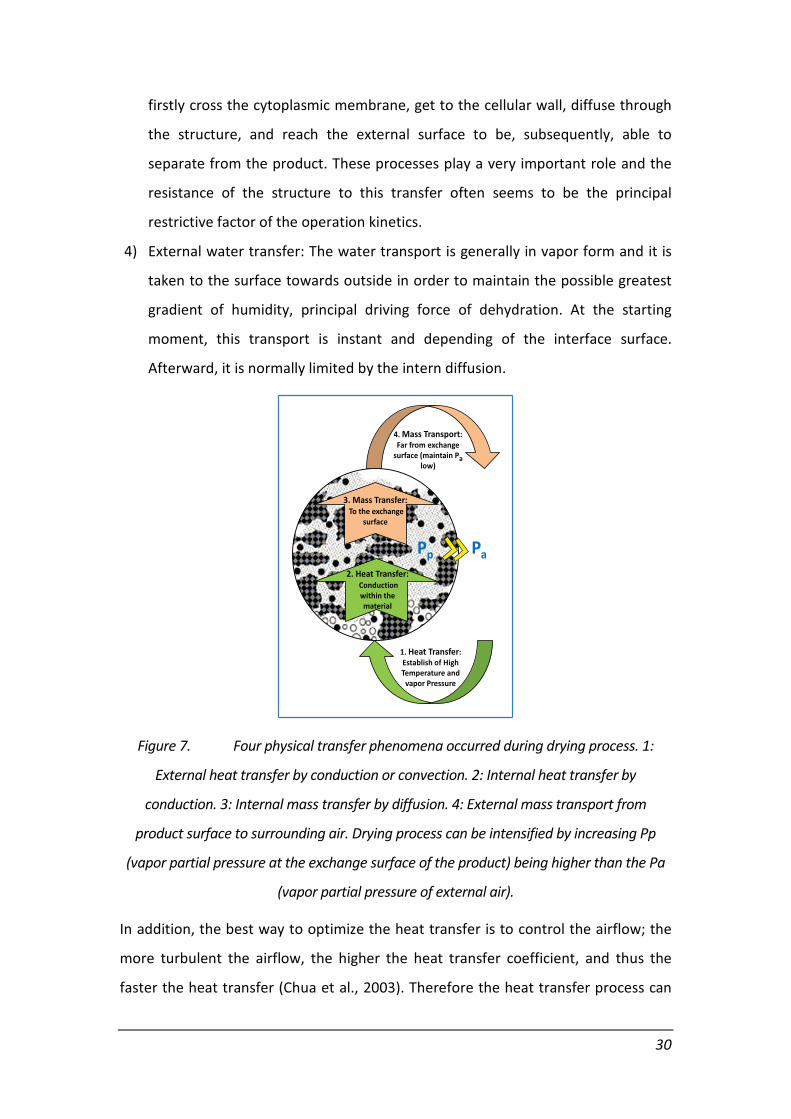
Figure 7. Four physical transfer phenomena occurred during drying process. 1:
External heat transfer by conduction or convection. 2: Internal heat transfer by
conduction. 3: Internal mass transfer by diffusion. 4: External mass transport from
product surface to surrounding air. Drying process can be intensified by increasing Pp
(vapor partial pressure at the exchange surface of the product) being higher than the Pa
(vapor partial pressure of external air).
In addition, the best way to optimize the heat transfer is to control the airflow; the
more turbulent the airflow, the higher the heat transfer coefficient, and thus the
faster the heat transfer (Chua et al., 2003). Therefore the heat transfer process can
1. Heat Transfer:
Establish of High
Temperature and
vapor Pressure
2. Heat Transfer:
Conduction
within the
material
3. Mass Transfer:
To the exchange
surface
4. Mass Transport:
Far from exchange
surface (maintain Pa
low)
Pp Pa
30
be controlled in a well-designed drier by controlling the air temperature, the airflow
speed and the nature of the flow, the way the air contacts the product, and the
residence time of the product in the drier, since the temperature on the product
surface is part of the driving force in the heating process.
And, with the exception of freeze-drying, where the total volume of cells and tissue
remains almost constant throughout the drying process, all other drying methods
involving heat treatments have a very heterogeneous drying process, where the
control of water removal is very important to control shrinkage and other damage
produced by the process (Marques et al., 2006; Guiné and Barroca, 2012). Hence,
drying conditions and fruit transformation greatly affect product quality (Marques et
al., 2009).
Furthermore, for the dehydration of fruits, some pretreatments are used to enhance
the drying rate, thus allowing shorter processing times for better product quality,
including texture and color, and less damage to valued compounds (vitamins,
phenols, etc.). Some of these pretreatments include mechanical or chemical skin
perforation and partial water removal with osmotic solutions (Doymaz, 2008; Blanda
et al., 2009; Watanabe et al., 2011). All these pre-treatments produce a shorter
drying time with a higher drying rate.
I.2.2 Conventional drying methods for strawberries
In this group, sun drying and all mechanical dehydrators that use a heated air stream
are included. However, only hot air drying and freeze-drying are described for this
section.
I.2.2.1 Hot air drying
Hot air drying is one of most widely used technology for food preservation. This unit
operation is applied to reduce the water content of products such as fruits,
vegetables, agricultural and herbal products, etc. after harvest (Di Scala et al., 2011;
Toontom et al., 2012). A mechanical device is used to carry out this kind of drying.
The strawberry may be either static or moving and hot air is conducted in different
directions. The variables of this system can be well controlled, including the feeding
31
rate, air velocity, air humidity inside the apparatus, air recirculation conditions, and
final moisture content in the product (Arora et al., 2006; Doymaz, 2008).
On the other hand, this operation is characterized by the contact of hot air with
humid material, being convection the principal phenomenon. Also, it presents some
advantages as inexpensive process, simple method, and control of operating
conditions. However, it gives to the product a significant aromatic and nutritional
degradation, shrinkage, and loss of rehydration potential (Marques et al., 2006).
Hung and Duy (2012) reported that the beetroot phenolic compounds in hot air
dried samples were 13 times lower than freeze-drying samples. Doymaz (2008)
demonstrated that the strawberries pre-treated with alkaline ethyl oleate solution
and increasing air temperature of hot-air drier helped to increase the drying rate and
consequently, to decrease drying time. Also, rehydration of pre-treated samples was
much faster than untreated samples. Like this study, sometimes, chemical pre-
treatments are necessary to accelerate the hot air drying process. But the problem
with the fruit shrinkage is persistent with this method. Maskan (2001) found that the
shrinkage of hot air dried kiwifruit was 85%.
I.2.2.2 Freeze-drying
Freeze-drying is considered as the reference process for manufacturing high-quality
dehydrated products. This drying process involves a preliminary freezing of the
products followed by placing them under reduced pressure (< 300 Pa) with a
sufficient heat supply to sublimate ice (2800 J per gram of ice) (Shukla, 2011).
Preliminary freezing of the product stiffens its structure and subsequently prevents
solute and liquid motion during freeze-drying. During the formation of ice crystals,
they grow and create a uniform network throughout the product that after
sublimation yields a dense, spread and homogeneous porous matrix (Hammami and
René, 1997). By the sublimation phenomenon (direct change from ice to vapor)
freezing water is removed from the strawberry and it helps to explain the capacity of
the freeze-dried fruit to rehydrate almost instantaneously (Shukla, 2011).
This operation offers a great fruit nutritional quality, texture, flavor and color, and a
product with high porosity. And, it avoids the undesirable shrinkage. Unfortunately,
32

it has a high operating cost, long drying time and high vacuum level (Marques et al.,
2006). Also, the poor quality and/or alterations of freeze-dried products that are
sometimes encountered are generally linked to the quality of the raw material
(nature and degree of ripeness) and to processing conditions (operating pressure,
heating temperature, freezing rate, freeze-drying process control).
Compared to classical dehydration techniques, the main advantages of the freeze-
drying process are: the preservation of most of the initial raw material properties
such as shape, appearance, taste, color, flavor, texture, biological activity, etc. and
the high rehydration capacity of the freeze-dried product.
In a study reported by Meda and Ratti (2005) the freeze-dried strawberries had a
better nutritional quality and its rehydration capacity was quickly, less than 2 min
were necessary to fully rehydrate the slices. In terms of the fruit color that freeze-
drying method offers, Guiné and Barroca (2012) found that chroma of dried pumpkin
decreased significantly with freeze-drying while the hue angle was maintained
constant when is compared with the fresh vegetable. And, Hung and Duy (2012)
shown that the total phenolic and flavonoid contents in vegetables as carrot, taro,
tomato, red beetroot and eggplant, were significantly higher by freeze-drying
method than the conventional heat-drying method.
I.2.3 Innovative drying methods
Major technical innovations in strawberry dehydration include sugar infusion and
impregnation under high or low pressure, microwave dehydration under vacuum
and pulsed-mode microwave applications (Suthanthangjai et al., 2005; Oey et al.,
2008; Patras et al., 2009; Ioannou and Ghoul, 2012). Nowadays is possible to add at
this list the technology of instant controlled pressure drop (détente instantanée
controlee, DIC), which is distinguish by its ability to handle the widest range of food
products, regardless of their sensitivity to heat.
I.2.3.1 Instant controlled pressure drop, DIC
Instant controlled pressure drop was developed, defined and studied by Allaf and
Vidal (1988). And since then, many kind of products have been treated and
33

processed, such apple, onions, cranberries, potatoes, mushrooms, tea, tomato,
mango, etc. (Mounir et al., 2012). DIC technology was emerged following the
theoretical works on “puffing” or expansion process, dating back to the middle 20th
century. Utilization of puffing process was limited to the treatment of cereals and it
was not adapted to heat-sensitive products such fruits and vegetables (Mounir et al.,
2011). But, DIC treatment is based on the fundamental studies concerning the
thermodynamics of instantaneity (Allaf, 2012). DIC is a thermo-mechanical
processing induced by subjecting the product to an abrupt transition from a high
steam pressure to close to a vacuum (Ben Amor and Allaf, 2009). Hence, DIC is
perfectly adapted to texture-sensitive products such as strawberries.
I.2.3.1.1 DIC reactor and treatment
Several papers have described the experimental set-up of DIC (Maache-Rezzoug et
al., 1998); (Louka and Allaf, 2004); (Haddad and Allaf, 2007); (Ben Amor and Allaf,
2009); (Berka-Zougali et al., 2010) and (Mounir et al., 2012). Briefly, the reactor is
composed by three main elements, (Figure 8):
Figure 8. Schematic diagram of the DIC reactor: (1) Processing vessel; (2) Vacuum
tank; (3) Quick motion valve; (4) Steam generator; (5) Air compressor (6) Vacuum pump.
A processing vessel; where the samples are placed and treated
A vacuum tank, whose volume is more than 100 times greater than that of the
processing vessel;
!"#$$%&
'$%(
')*#+,,-./&
!+,,+0
Air
compressor
5
!"6 ')*#')
1
Steam
generator
4
3
!"#$$%&
1".2
2
34
An instantaneous valve, which ensures a full connection between (1) and (2) in less
than 0.1 s
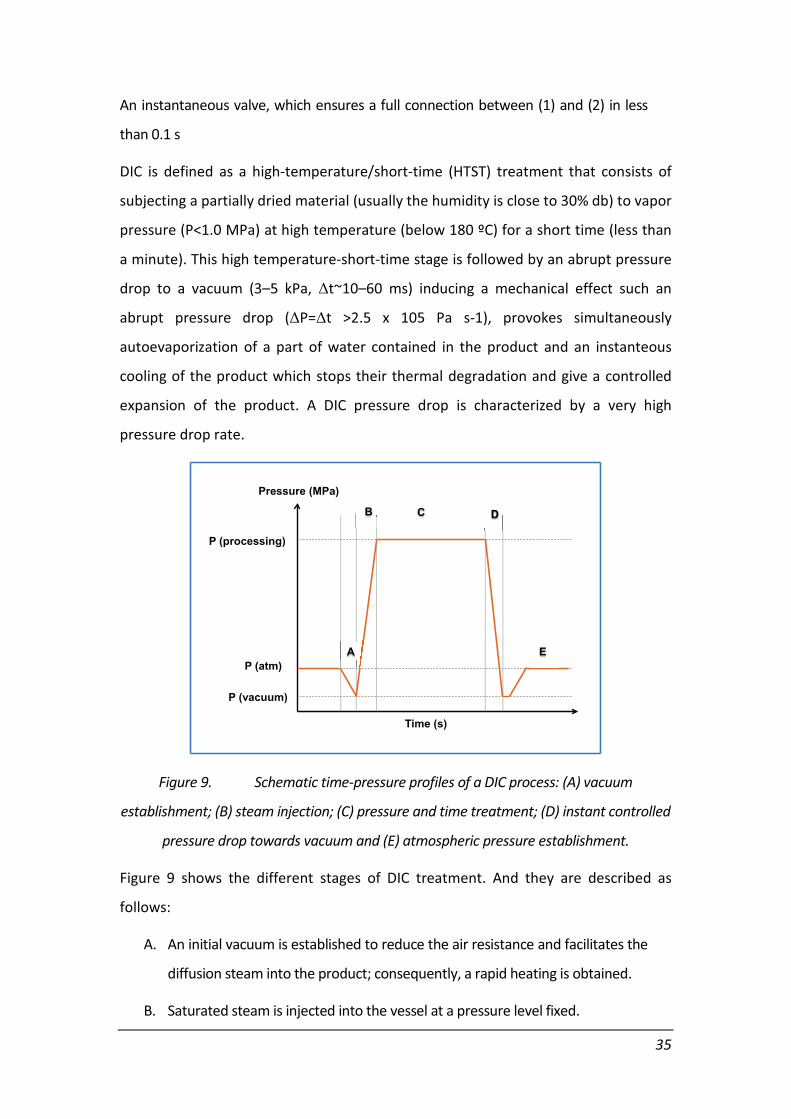
DIC is defined as a high-temperature/short-time (HTST) treatment that consists of
subjecting a partially dried material (usually the humidity is close to 30% db) to vapor
pressure (P<1.0 MPa) at high temperature (below 180 ºC) for a short time (less than
a minute). This high temperature-short-time stage is followed by an abrupt pressure
drop to a vacuum (3–5 kPa, "t~10–60 ms) inducing a mechanical effect such an
abrupt pressure drop ("P="t >2.5 x 10⁵ Pa s-1), provokes simultaneously
autoevaporization of a part of water contained in the product and an instanteous
cooling of the product which stops their thermal degradation and give a controlled
expansion of the product. A DIC pressure drop is characterized by a very high
pressure drop rate.
Figure 9. Schematic time-pressure profiles of a DIC process: (A) vacuum
establishment; (B) steam injection; (C) pressure and time treatment; (D) instant controlled
pressure drop towards vacuum and (E) atmospheric pressure establishment.
Figure 9 shows the different stages of DIC treatment. And they are described as
follows:
A. An initial vacuum is established to reduce the air resistance and facilitates the
diffusion steam into the product; consequently, a rapid heating is obtained.
B. Saturated steam is injected into the vessel at a pressure level fixed.
P (vacuum)
P (atm)
Pressure (MPa)
P (processing)
Time (s)
A
B C D
E
35

C. Pressure and time conditions are given according to the product treatment.
An experimental design is used to obtain these conditions.
D. The pressurization is followed by an abrupt decompression towards vacuum.
E. After the vacuum phase, atmospheric air is injected to return to atmospheric
pressure for sample recovery.
In addition, it is possible to control the parameters involved in the DIC process to
obtain a good end product quality in terms of its expansion ratio, porosity, color,
aroma, flavor, etc. (Allaf, 2012).
The process parameters to control are classified in intrinsic and operating process
parameters. The first group gathers, shape and size of the raw material, initial water
content, specific heat, thermal conductivity, effective diffusivity, and rheological
characteristics such as elasticity, viscosity, glass transition, etc. The second group is
referred to initial pressure and temperature, total pressure, partial pressure of
vapor, initial vacuum pressure, pressure drop rate, thermal processing time, minimal
temperature of the product, temperature drop rate, volume ratio of the vacuum
tank to the processing vessel, intrinsic density or filling ratio, quantity and apparent
volume of the product to be processed, etc. (Mounir et al., 2012).
Therefore, as DIC technology needs products partially dried (water content around
30% db) to the treatment, the solution proposed was assisted it by hot air drying
process, forming the swell-drying process (Mounir et al., 2011).
I.2.3.1.2 Swell-drying
As was mentioned, the swell-drying (SD) involves coupling hot air drying to a DIC
texturing process. This new process could greatly intensify the conditions given by
hot air drying, such air flux, temperature, speed and humidity. And the texturing
operations should be proposed as a further intensification to improve both the
performance of hot air drying as well as the quality of the final (Mounir et al., 2012).
Hence, DIC within SD could help to texturize the strawberry and give it an attractive
alternative with the following potential advantages (Albitar et al., 2011; Mounir et al.,
2011; Allaf, 2012):
36
1. DIC expansion remedy the shrinkage problem presented by usual
drying, due to the highly porous structure and a greater specific
surface area given by DIC process.
2. Preservation of flavor, color and bioactive compounds.
3. It can help in the modernization of the food drying industry, due to it
is an operation more effective with less consume of energy, and
induces perfect decontamination of the product.
4. Price value of final product will be increased because of its high
quality similar even better than freeze-dried.
5. Handling processing cost will be reduced.
6. And, it is considered as a sustainable technology because gives an
added value to agro resources.
Some important works reference the effect of swell drying in the fruits and
vegetables. A study by Albitar et al. (2011) demonstrated that the onions treated by
SD process improved in terms of kinetics and quality of the end product. And, similar
results were reported for the apples, their vitamins were preserved and the thermal
degradations were so weak with SD (Mounir et al., 2011).
I.2.4 Applications of dried strawberry
Dried strawberry has many applications. It can be used as a food by itself or an
ingredient in other food. Some of its uses are classified as follows:
Snack foods. In recent years, use a fruit as snack is an innovation with very good
acceptance by consumers. These products contain wild or cultivated strawberry or
another berry and are popular due to their health benefits associated with their
antioxidant activity, scavenging of free radicals, and high content on soluble dietary
fiber (Potter et al., 2013). Also, these snacks may include other ingredients besides
dried fruit and cereals, including honey or dried yogurt.
Breakfast cereals. The consume of cereal in the breakfast is very popular. Hence, the
addition of strawberry or another berry to breakfast cereals has a double benefit;
because of the soluble dietary fiber from berry complement very well the insoluble
37
fiber of cereals. In this case, the moisture dried fruit has to be controlled to prevent
the cereal humectation. Also, when low-moisture fruit is used, the fruit texture may
not be acceptable at the moment the cereal is mixed with milk or juice. In some
cases, berries are laminated after drying so they will have a better texture, but
normally they are softened by the addition of water vapor or some type of oil.
Formulated foods. Using the dried strawberry as food ingredient is very popular. It
can be an ingredient of ice cream, toppings, fruit pieces in pastries and cookies,
yogurt, snacks, and pressed for fruit leathers (Harris, 2007). However, in some of
these products, a second heat treatment could damage the dried fruit chemical
quality (Ioannou and Ghoul, 2012). So, it is better to use dried fruits that are
protected against deterioration of these compounds.
A statistical study reported by Minte (2010) pointed that nine of ten British adults
eat snacks between meals, nearly half of them on a daily basis. There are in total an
estimated 13 billion at home snacking occasions a year and 6.4 billion occasions on
the go. Therefore, as snacking has become part of the day-to-day of our lives,
especially for children, it is necessary to work so hard in snacks confection with a
positive health benefit.
In this case, swell-drying performance could be a valuable solution for preserving
and modifying the structure of strawberry, offering a snack fruit with beneficial
effects in human health. In addition, it could have a good acceptance by consumers
and food industry.
38

CHAPTER I.3
QUALITY ASSESSMENTS
Quality is the summary of all characteristics of dried product that are important to
the food industry and the consumer needs. In order to determine the quality dried
strawberry; several parameters need to be examined. These parameters are
dehydration and rehydration kinetics; textural characteristics, expansion ratios,
water content, water holding capacity. Only the kinetics and textural analyses are
described in this section.
I.3.1 Mathematical Modeling of dehydration and
rehydration kinetics
To study the modeling of dehydration and rehydration in strawberry, the modeling
proposed by Mounir and Allaf (2009) to expanded biomaterials that involving various
exchange surfaces and different internal diffusion processes was adopted.
For this section, the four physical mechanisms of transfer in the drying phenomenon
are taken into account. They were explained in the last chapter (Chapter I.2.1.A). It
continues as follows:
By assuming that external heat and mass transfers do not limit the whole operation
through adequate technical conditions of air flow (i.e. temperature, moisture
content and velocity), only internal transfers may intervene as limiting processes (Al
Haddad et al., 2008). Also, it is assumed that, within the product the internal mass
transfer must be much more accelerated than heat transfer by conduction, due to
the values of mass and thermal diffusivities are already known. In such conditions, as
drying kinetics are controlled by mass transfer of water within the strawberry, the
model proposed by Mounir and Allaf (2009) is adopted. It is traduced by ALLAF
(1982) as similar Fick diffusion, equation 1:
!"!# ($"%%%%& ' $#%%%%%&) = '()**+%& ,!"!#- Equation 1
39

Where, $w is the apparent density of water material (kg/m3); $m is the apparent
density of dry material (kg/m3); 'w is the absolute velocity of water flow within the
porous medium (m/s); vw is the absolute velocity of solid medium (m/s), and Deff is
the effective diffusivity of water within the solid medium (m2/s).
As DIC produces a swelling, the shrinkage phenomena is neglected and it is assumed
that $m=constante and vw=0:
!"."%%%%& = '()**+%&!" Equation 2
Using the balance mass, the second Fick law is obtained:
/!0/1 = +%& 2 ()**+%&!" Equation 3
Where, t is time
However, D_eff considerably varies versus the system temperature and porosity, it is
assumed constant, only through the hypothesis of both structural and thermal
homogeneities:
/!0/1 = ()**+%& 2 +%&!" Equation 4
And by assuming a unidirectional flow:
/!0/1 = ()** /
3!"/43 Equation 5
The provided solutions to this diffusion equation closely depend on the initial and
boundary conditions. Using Fick’s second law, a number of mathematical solutions
have been proposed; however, the Crank’s solution for a solid matrix was adopted,
(Crank, 1975):
56 '556 '57
= 89:;4< ('=:3>)
:?7 Equation 6
Where W, W! and W1 are the amounts of water content (dry basis) in the solid
matrix. W is at time t, W! is at equilibrium of water content t ( !"#$%&#'1 is at the
40

starting of pure diffusion time. W1 is the value of W at the time t1 chosen as the
beginning of the diffusion model gotten only for long time experiments. The
difference between Wo (theoretical value of W gotten by extrapolating the diffusion
model) and the experimental one Wi, at t=0, corresponds to the amount of water
available on the surface and extracted from it in a very short time. By modifying
matrix structure, improving porosity, the values of W! and Wo vary depending on
and characterizing DIC treatment:
56 '556 '57
= 89: ;4<('=:1)6
7
=8
@3 ;4<AB
CDEFFGHIJC +
8
9@3 ;4<AKB
CDEFFGHIJC
+8
25@3 ;4<A3LB
CDEFFGHIJC +
8
49@3 ;4<AHKB
CDEFFGHIJC + M
Equation 7
Ai and qi are Crank’ coefficients and they are solved according to Fick’s number ()):
>: ()** 1NO3 Equation 8
Where dp is the characteristic length (m).
By limiting equation 8 to its first term, it could be expressed as:
56 '556 '5P
= 9;4<('Q1) Equation 9
Where, k is selected according to the product shape. In this case, an infinite plate is
the best adaptable to sliced strawberries
The logarithmic representation of equation 9 as a straight line leads to determine
Deff from the slope k:
RS(T) = RS ,56 '556 '5P- = Q1 Equation 10
Where k corresponds to:
41

Q =@3()**
4NO3 Equation 11
And the effective diffusivity is:
()** =4NO3@3 Q Equation 12
As the experimental data used for the empirical model exclude the points close to
t=0; the extrapolation of the model obtained allowed that the W0 to be determined
as, generally, different from the initial humidity content Wi.
The difference "Ws between Wi and W0 expresses the humidity quickly removed
from the surface, independently from diffusion processes. This quantity has been
defined as “starting accessibility of water.
U5V = 5: '5P Equation 13
Hence, the values considered to evaluate the drying kinetics of strawberry are
effective diffusivity (DWXX,Y), the starting accessibility (U5V,I) and the time to get the
lowest water content (1I)
In the case of rehydration kinetics, similar argument is applied. The parameters are
rehydration effective diffusivity (DWXX,Z), rehydration starting accessibility (U5V,[) and
the rehydratation time (1[).
I.3.2 Texture analysis
The consumers’ appreciation has become one of the main criteria in their food
choice, as well as nutrition and flavor (Bourne, 2002a). The contribution of texture to
the consumer´s appreciation of a food product has been studied nearly 40 years.
Therefore, texture has been defined as the response of the tactile senses to physical
stimuli that result from contact between some part of the body and the food. The
tactile sense (touch) is the primary method for sensing texture but kinesthetic (sense
of movement and position) and sometimes sight (degree of slump, rate of flow), and
sound (associated with crisp, crunchy and crackly textures) are also used to evaluate
texture (Bourne, 2002a).
42

The vocabulary used to describe the texture of any kind of food has been really
controversial because it depends not only of the foodstuffs characteristics, but also
the culture and the language are implicated (Table 5).
Table 5. Most frequently words used to define a food texture (Bourne, 2002a)
In the early studies on the awareness of food texture, the importance of crispness
was high-lighted (Roudaut et al., 2002). For instance, word association tests, in which
consumers were asked to generate attributes related to a list of specific foods,
showed that the term “crisp” was mentioned more often than any other attribute
(Szczesniak, 1988; Rohm, 1990). However, this term “crisp”, was confused and
sometimes used as a synonym of the term “crunch”.
The sensations ‘‘crisp’’ and ‘‘crunch’’ are difficult to describe especially when
different food products are involved. For both wet and dry crisp products the
sensations crispness and crunchiness are found to be related to the same type of
product properties, i.e. hard, brittle and producing a typical sound at fracturing
(Luyten et al., 2004).
In many texture studies, panelists as well as consumers found it very difficult to
define crispy and crunchy terms and needed constant probing. However, all insisted
that they could perceive a difference between the two, but then struggled to
describe this difference, indicating that it was only slight (Fillion and Kilcast, 2002).
43

In brief, crispy and crunchy are words that are used to describe products that break
rather than deform, and the way in which they fracture under the application of a
force (Saeleaw and Schleining, 2011). The experimentation of these definitions are
shown in Table 6.
Under these definitions and consider that potential changes in the texture of fruit
are produced during dehydration process. The fruit texture can become crisp, crunch,
brittle, firm, dry, hard, crumbly, etc. All of these changes are based on the nature of
the fruit and the drying process applied.
Thus, to understand better these dried product features, particularly the crunchy
and crispy behavior, it is necessary to measure them using sensory or instrumental
methods.
In sensory methods, consumers are able to describe the differences between crisp
and crunch by judging the sound (Roudaut et al., 2002). However, sensory studies
are often difficult to compare because of the confusion between concept, the
procedures implemented and the difficulties inherent to multi-cultural studies.
For instrumental methods, there has been a great interest in developing
instrumental techniques to assess crispness/crunchiness. Instrumental techniques
present some advantages, especially in industrial environments where quick and
easy-to-use methods are in great demand and economically more profitable
(Saeleaw and Schleining, 2011). Moreover, as crispness feature is described as a
concept that involves kinesthetic and auditory components; mechanical and acoustic
measurements have been developed to interpreter its behavior better (Bourne,
2002b). Additionally, an accurate method for determining texture in dried products
is of vital importance to the food scientist and industry.
Hence, within the mechanical methods most commonly used to measure the
product crispness, are the puncture tests, due to that they simulate the incisors
impact and biting. In this case, a cylindrical or conical probe of small diameter
plunges in the specimen at constant and rather low speed. This test has specially
been employed for the characterization of foamed products and the probe is
expected to fracture separately the different cell walls constituting the product
44
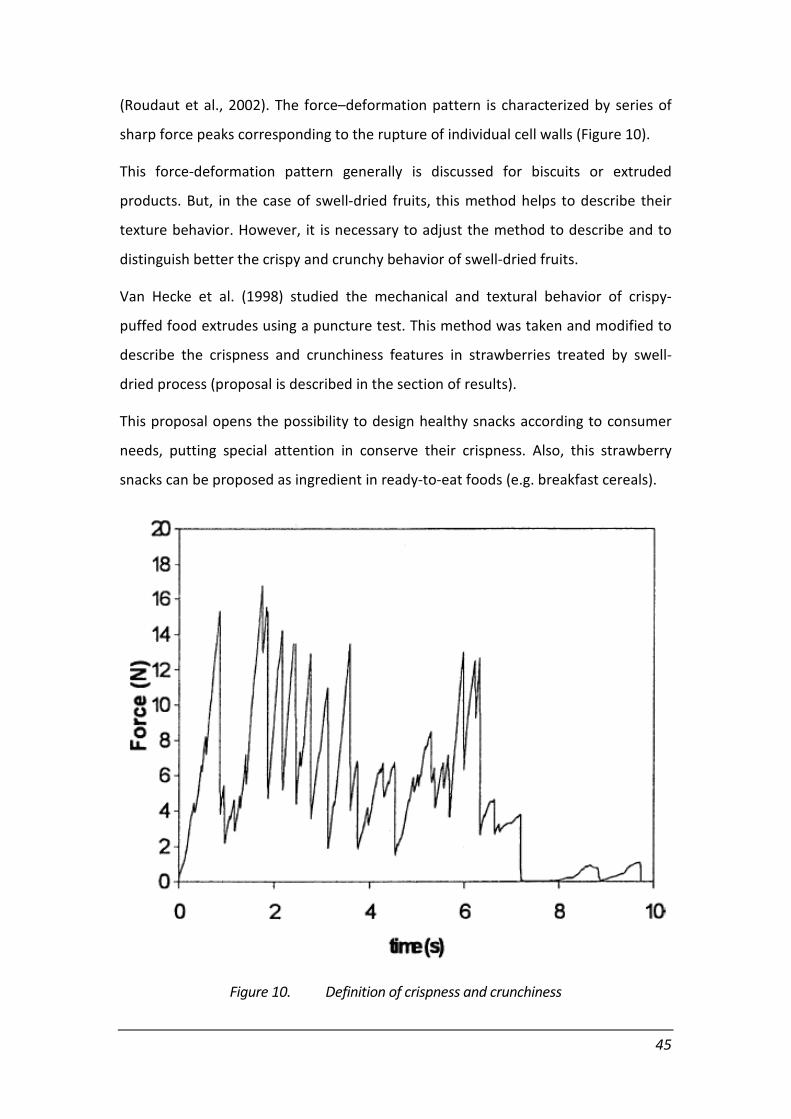
(Roudaut et al., 2002). The force–deformation pattern is characterized by series of
sharp force peaks corresponding to the rupture of individual cell walls (Figure 10).
This force-deformation pattern generally is discussed for biscuits or extruded
products. But, in the case of swell-dried fruits, this method helps to describe their
texture behavior. However, it is necessary to adjust the method to describe and to
distinguish better the crispy and crunchy behavior of swell-dried fruits.
Van Hecke et al. (1998) studied the mechanical and textural behavior of crispy-
puffed food extrudes using a puncture test. This method was taken and modified to
describe the crispness and crunchiness features in strawberries treated by swell-
dried process (proposal is described in the section of results).
This proposal opens the possibility to design healthy snacks according to consumer
needs, putting special attention in conserve their crispness. Also, this strawberry
snacks can be proposed as ingredient in ready-to-eat foods (e.g. breakfast cereals).
Figure 10. Definition of crispness and crunchiness
45
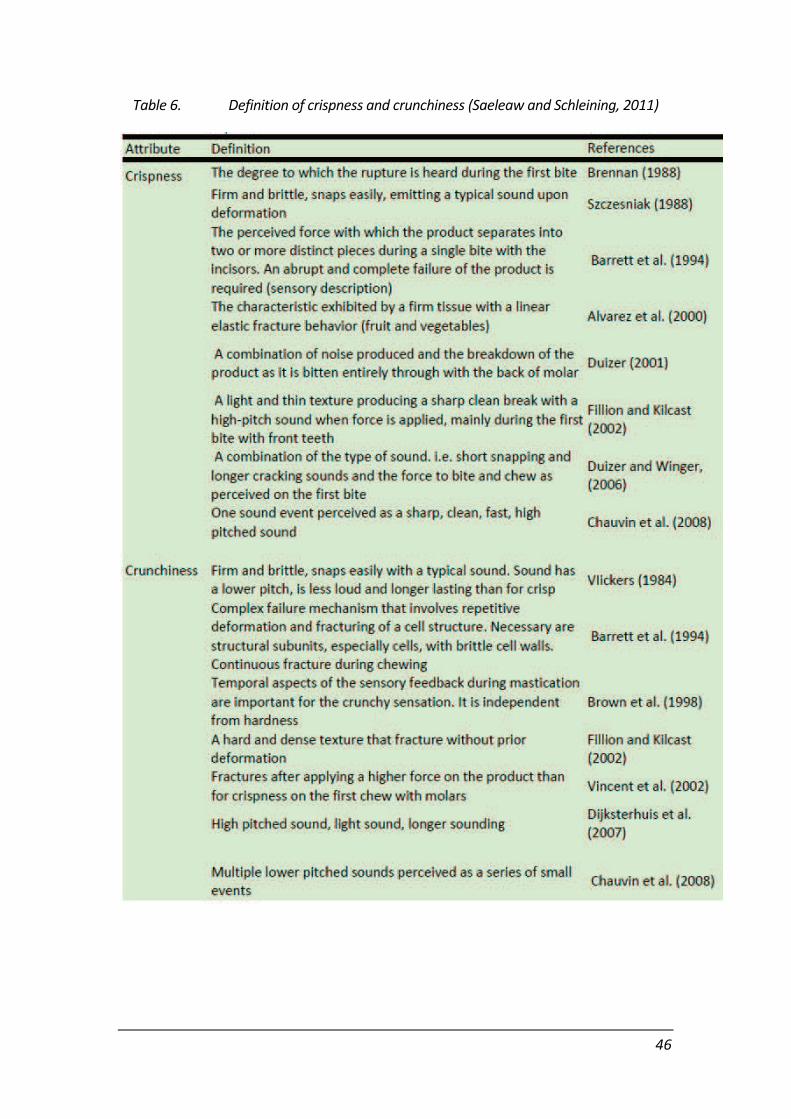
Table 6. Definition of crispness and crunchiness (Saeleaw and Schleining, 2011)
46
CHAPTER I.4
GENERAL OBJECTIVES
The aim of this study was to compare various drying methods; hot air drying (HAD),
freeze-drying (FD) and swell drying (SD, instant controlled pressure drop DIC-assisted
hot air drying). A comparative study was carried out to evaluate the effect of three
drying methods on strawberry (Fragaria var. Camarosa), in terms of
Drying kinetics (drying time, starting accessibility and effective water
diffusivity)
Rehydration kinetics (rehydration time, starting accessibility and effective
water diffusivity)
Water Holding Capacity (WHC)
Bioactive compounds, including total phenolic content, flavonoid content and
total anthocyanin content
The antioxidant activity
Two types of texture (i.e. crunchy and crispy features)
Microstructure impact
47

PART II
MATERIALS AND METHODS
48
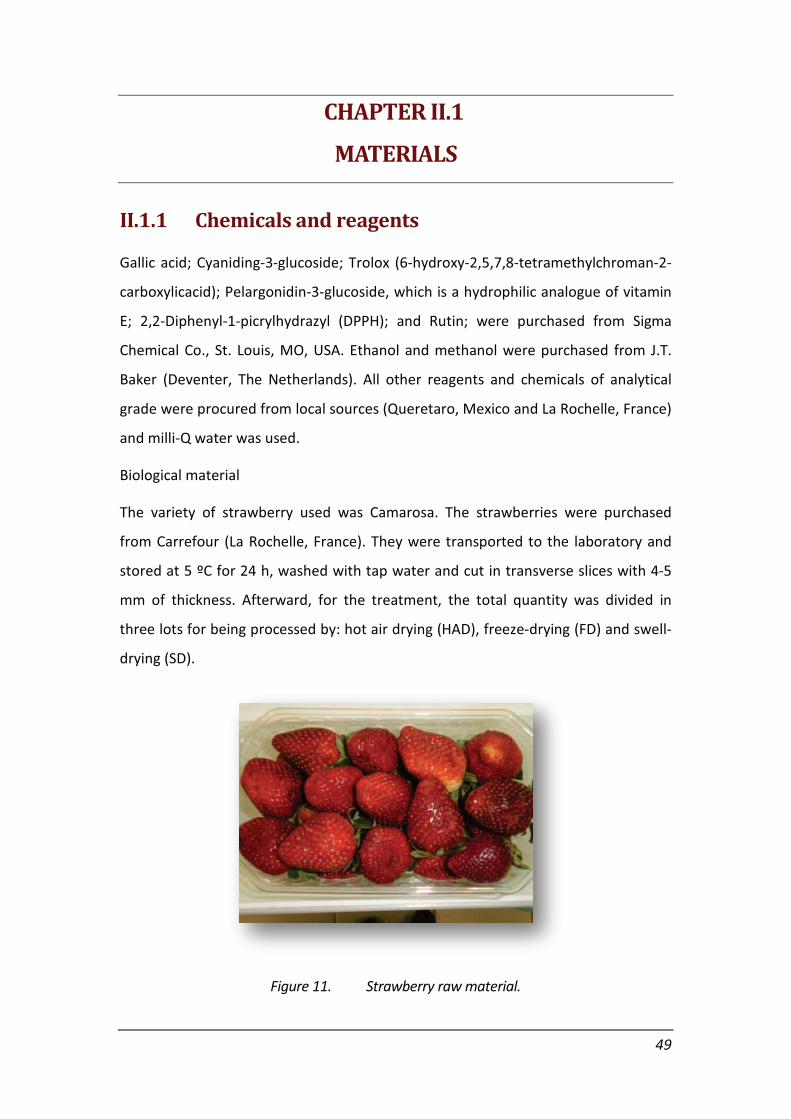
CHAPTER II.1
MATERIALS
II.1.1 Chemicals and reagents
Gallic acid; Cyaniding-3-glucoside; Trolox (6-hydroxy-2,5,7,8-tetramethylchroman-2-
carboxylicacid); Pelargonidin-3-glucoside, which is a hydrophilic analogue of vitamin
E; 2,2-Diphenyl-1-picrylhydrazyl (DPPH); and Rutin; were purchased from Sigma
Chemical Co., St. Louis, MO, USA. Ethanol and methanol were purchased from J.T.
Baker (Deventer, The Netherlands). All other reagents and chemicals of analytical
grade were procured from local sources (Queretaro, Mexico and La Rochelle, France)
and milli-Q water was used.
Biological material
The variety of strawberry used was Camarosa. The strawberries were purchased
from Carrefour (La Rochelle, France). They were transported to the laboratory and
stored at 5 ºC for 24 h, washed with tap water and cut in transverse slices with 4-5
mm of thickness. Afterward, for the treatment, the total quantity was divided in
three lots for being processed by: hot air drying (HAD), freeze-drying (FD) and swell-
drying (SD).
Figure 11. Strawberry raw material.
49

CHAPTER II.2
METHODS
II.2.1 Treatment Drying Methods
II.2.1.1 Hot air drying, HAD
The slices of strawberries were dried in a hot air drier (Memmert: Universal Oven
UNB Model 800) at 50 °C. The initial vapor pressure in the air was 265 Pa and an air
flux of 1.2 m/s. Slices were dried until attaining 3.0% of water content dry basis (db),
around 24 h. Afterward, the samples were analyzed and recorded as HAD.
II.2.1.2 Freeze-drying, FD
A freeze-drying equipment (model: RP2V, Serail, France) was used for drying the
batch of strawberries sliced. The conditions were divided in three steps: external
freezing (at -20 °C/2 h), sublimation (-20 °C, 0.66 Pa/12 h) and desorption (25 °C,
0.66 Pa/12 h). Subsequently, the samples were analyzed and recorded as FD.
II.2.1.3 Swell-drying, SD
As swell drying is a DIC-assisted hot air drying. The batch of sliced strawberries was
partially hot air dried at the same conditions described in HAD method (50 °C with
265 Pa as the initial vapor pressure in the air, and an air flux of 1.2 m/s) until 18% db.
This first step needed about 8 h. Subsequently, the slices were placed in airtight bags
and stored in a cold chamber at 5 ºC by 24 h to homogenize their water content
(18% db). Afterward, the partially hot air dried strawberries were treated by DIC
equipment (ABCAR-DIC Process, La Rochelle, France) according to the experimental
design (Table 8). Finally, after DIC treatment, a traditional convective hot air drying
at 50 °C was performed for approximately 1 h to get at 3.0% db as final water
content. These samples were analyzed and recorded as SD.
50
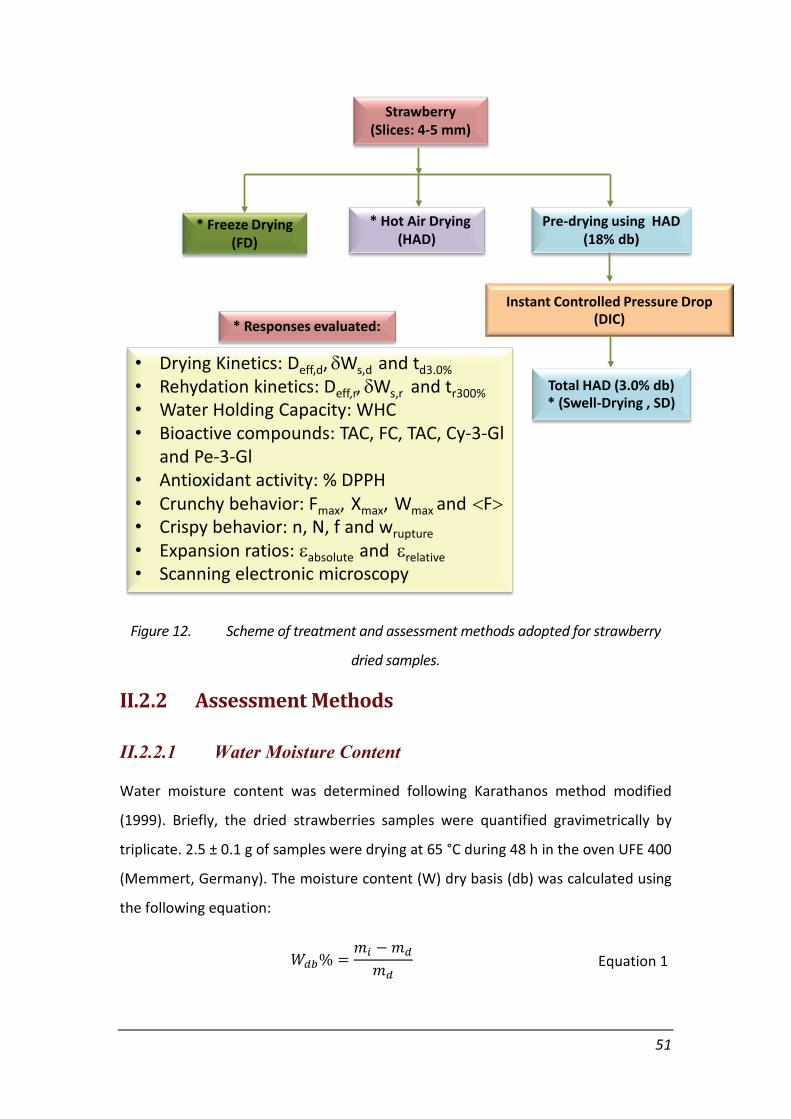
Figure 12. Scheme of treatment and assessment methods adopted for strawberry
dried samples.
II.2.2 Assessment Methods
II.2.2.1 Water Moisture Content
Water moisture content was determined following Karathanos method modified
(1999). Briefly, the dried strawberries samples were quantified gravimetrically by
triplicate. 2.5 ± 0.1 g of samples were drying at 65 °C during 48 h in the oven UFE 400
(Memmert, Germany). The moisture content (W) dry basis (db) was calculated using
the following equation:
5I\% =]: ']I]I
Equation 1
Strawberry
(Slices: 4-5 mm)
* Freeze Drying
(FD)
* Hot Air Drying
(HAD)
Pre-drying using HAD
(18% db)
* Responses evaluated:
Instant Controlled Pressure Drop
(DIC)
Total HAD (3.0% db)
* (Swell-Drying , SD)
• Drying Kinetics: Deff,d, "Ws,d and td3.0% • Rehydation kinetics: Deff,r, "Ws,r and tr300% • Water Holding Capacity: WHC • Bioactive compounds: TAC, FC, TAC, Cy-3-Gl
and Pe-3-Gl • Antioxidant activity: % DPPH • Crunchy behavior: Fmax, Xmax, Wmax and #F$ • Crispy behavior: n, N, f and wrupture • Expansion ratios: %absolute and %relative • Scanning electronic microscopy
51

Where, mi and md (g) were the material weight before and after drying, respectively.
II.2.2.2 Drying Kinetics
Drying kinetics were performed for HAD and SD samples. Approximately, 3.00 ± 0.05
g of each sample was used. They were placed in the hot air oven (Memmert:
Universal Oven UNB Model 800) at 65 ºC and weight loss was recorded using an
electronic balance (model EP2102, Ohaus, US). The weight loss was recorded every 5
minutes as interval time during the first 30 minutes, subsequently after 45, 60, 90,
120 minutes, after 120 minutes the weight loss was recorded every hour until
equilibrium water content was attained (change on weigh less than 0.01 g).
II.2.2.3 Rehydration Kinetics
The rehydration rate of HAD, FD and SD samples was evaluated. About 0.50 ± 0.02 g
of sample was placed in the clip handle tea strainers and submerged in distilled
water (at 20 ± 0.05 ºC). At specific time intervals (0, 0.5, 2, 4, 6, 8, 10, 15, 30, 45, 60,
90, 120, 150 and 180 min) samples were taken out of the water, blotted with tissue
paper to remove superficial water and reweighted. Weight was recorded using an
electronic balance AR2140 (OHAUS, China).
II.2.2.4 Modeling of Drying and Rehydration Kinetics
The model of Mounir and Allaf (2009) was adopted to study the drying kinetics. It
consists in three stages: initial surface interaction, diffusion phase and paradoxical
phase. The experimental results used for the mass diffusion model exclude the ones
close to t=0 as well as the ones implying the paradoxical phase (long time stage).
They allow the effective diffusivity (Deff,d) of water within the porous medium to be
evaluated. By extrapolating this diffusion model towards t=0, Wo was calculated as
the theoretical value of water content db issued from diffusion process. It is usually
different from the initial humidity content Wi. The difference between Wi and Wo is
defined as the starting accessibility (!Ws,d=Wi-Wo). It reflects the water quickly
removed from the surface, independently from diffusion process. Adding to this
phenomenon, the drying time to get at 3.0% db of water content (td3.0%) was
calculated also.
52

For the rehydration kinetics, a similar model has been applied. Evaluated response
parameters were the values of rehydration time to get at water content of 300 % db
(tr300%), the starting accessibility (!Ws,r) revealing the water immediately held at
the surface and the effective diffusivity of rehydration (Deff,r).
II.2.2.5 Water Holding Capacity
The water holding capacity (WHC) for the different dried samples (i.e. HAD, FD and
eleven SD samples) was determined using the centrifuge technique. Two grams of
the sample in powder were mixed with 20 mL distilled water, placed in 30 mL plastic
centrifuge tubes and set at room temperature (20 ± 2°C) by 45 min prior to the test
run. The tubes were centrifuged (Centrifuge Model Sigma 3K15) at 3000 rpm for 35
min. After centrifugation, the extra supernatant from the centrifuged sample was
drained and the sample was reweighted. The samples were then dried in hot air
oven at 65 ºC by 48 h to determine their water content. WHC was calculated as the
amount of water (g) absorbed by 100 g of dry basis.
II.2.2.6 Samples extraction
The extraction of HAD, FD and eleven SD strawberry samples were prepared. 0.5 g of
each sample were weighted in a 30 mL centrifuge tube, and 10 mL of acidified
methanol (1.0 % HCl in methanol, v/v) were added and agitated for 2 h at room
temperature in darkness. The sample suspensions were centrifuged at 6000 rpm for
10 min at 4 °C and the supernatants were stored at -20 °C until analysis, the
operation was performed in duplicate.
II.2.2.6.1 Total phenolic content
Total phenolic content was estimated by using the Folin-Ciocalteu colorimetric
method (Singleton et al., 1999). Briefly, 0.02 mL of the extracts was oxidized with 0.1
mL of 0.5 N Folin-Ciocalteu reagent, and then the reaction was neutralized with 0.3
mL sodium carbonate solution (20%). The absorbance values were obtained by the
resulting blue color measured at 760 nm with a Spectrophotometer (UV-Vis Double
Beam UVD-3500, Labomed, Inc. USA) after incubation for 2 h at 25 °C. Quantification
53

was achieved on the basis of a standard curve of Gallic acid from 0 to 500 %g/mL.
Results were expressed as mg of Gallic acid per g of dry weight (mg eq. GA/g db).
II.2.2.6.2 Flavonoid content
The spectrophotometric assay for the quantitative determination of flavonoid
content was determined according to Oomah et al. (2005). Briefly, the method
consisted of mixing 50 %L of the methanolic extract with 180 %L of distilled water and
20 %L of a solution of 10 g/L 2-aminoethyldiphenylborate in a 96-well microtitration
flat-bottom plate. The absorbance of the solution was monitored at 404 nm with a
spectrophotometer (xMark Microplate Spectrophotometer, BioRad, Japan). Extract
absorption was compared with a Rutin standard at different concentrations ranging
from 0 to 200 %g/mL. Flavonoids content was expressed as mg Rutin per g of dry
weight (mg eq. Rutin/g db).
II.2.2.6.3 Total anthocyanin content
0.2 mL of extract was diluted with 1.8 mL acidified methanol (1.0 % HCl in methanol)
and absorbance was taken at 250 nm (Spectro UV-Vis Double Beam. UVD-3500
Labomed, Inc. USA). An acid pH was used to take the anthocyanins to the flavylium
ion form, which exhibits coloration, thus to be able to quantify them by
spectrophotometry. Total anthocyanins concentration (TAC) was calculated as
pelargonidin-3-glucoside according to the Equation 2 (Abdel-Aal and Hucl, 1999):
^_` = ,9a- ,bcd
1000- (e5) , 1
fg]<d; h;ijk1-10l Equation 2
Where:
TAC: concentration of total anthocyanin content per sample were expressed as mg
pelargonidin-3-glucoside equivalent per g of dry weight (mg eq. Pe-3-Gl/g db)
A: absorbance reading,
#: molar absorptivity (pelargonidin-3-glucoside = 15,600 L/ (mol cm)),
Vol: total volume of anthocyanin extract, and
MW: molecular weight of pelargonidin-3-glucoside = 433.2 g/mol
54

II.2.2.6.4 Determination of anthocyanins by HPLC
Strawberry extracts were filtered through a 0.45 %M nylon membrane-filter. HPLC
analysis was performed using an Agilent 1200 HPLC system (Agilent Technology 1200
series, Palo Alto, CA), equipped with quaternary pumps, autosampler and a diode
array detector. Anthocyanin separation were performed using an Eclipse XDB-C18
column (5 %M, 4.6 mm · 150 mm) at 28 ºC. Mobile phases were constituted of 1.0 %
methanol acidified (A) and 5.0 % formic acid (B) at a flow rate of 1 mL/min. The
gradient condition started with 20 % A, linearly increased to 85 % A at 10 min, finally
it decreased to 20 % A at 15 min. Calibration curves (0-1 mg/mL) were realized to
quantify cyanidin-3-glucoside (Cy-3-Gl, mg/g db) and pelargonidin-3-glucoside (Pe-3-
Gl, mg/g db).
II.2.2.6.5 Determination of antioxidant capacity by DPPH method
Measurement of antioxidant capacity was carried out using 2,2-Diphenyl-1-
picrylhydrazyl (DPPH) as a free radical. Reduction of DPPH by an antioxidant or a free
radical produces decreased absorbance at 515 nm. 20 %L of the extract were mixed
with 200 %L DPPH (125 %M in 80 % methanol). After 90 min, the plate was read at
520 nm in a spectrophotometer and the antioxidant capacity was calculated as a
percentage of DPPH discoloration according to Burda and Oleszek (2001). The
analysis was performed in triplicate.
II.2.2.7 Puncture Test
To measure the mechanical properties of the macro-structure of dried strawberry
slices (i.e. HAD, FD and SD batches), a puncture test was performed with an INSTRON
(Model 5543, USA). The probe used was a stainless steel needle with 1 mm in
diameter (Petrotest, VICAT needles ISO 6873-EN26873), moving at a constant speed
of 1 mm/s. The analysis consisted in recording the force required to penetrate the
dried samples by puncturing the middle of the sliced strawberries. The penetration
in the dried fruit was until 2 mm for HAD and 3 mm for FD and SD samples (Figure
13). Five measures were repeated by each batch (i.e. HAD, FD and the eleven SD
samples).
55

Figure 13. Schematic diagram of puncture test.
II.2.2.8 Fundamental Approach to Analyze the Force-Time Curve
The obtained data by force-displacement curves were analyzed in two parts (Figure
14). The first was for descripting the crunchy behavior parameters (Figure 14, Left)
and the second was for the crispy behavior (Figure 14, Right). In this analysis the
method reported by Van Hecke et al. (1998) was used also, with slight modifications.
Figure 14. Left) Theoretical force-deformation curves obtained by puncture test:
crunchy behavior: maximum penetration force, Fmax (N); maximum penetration distance,
Xmax (mm) and total work, Wmax, (J). Right) Theoretical force-deformation curves obtained
by puncture test: crispy behavior: the penetration distance for each micro-rupture peak,
!X (mm); the individual force drops for each micro-rupture peak (!F, N) and the average
work for micro-ruptures, wrupture (J).
! =1 mm Dried strawberry
Rupture point
Xmax
Wmax WWWWWWWWWWWmaxmaxmaxmaxmaxmaxmaxmaxmax
Deformation (mm)
Fo
rce
(N
)
Fmax
!F
Deformation (mm)
Forc
e (
N)
!x !!!!
wruptures
56

Figure 15. Real force-deformation curve recorded by puncture test: crunchy and
crispy behavior.
Various force and work parameters were determined to respectively and separately
define the crunchy and crispness properties.
Descripting parameters of Crunchy (Croquant) behavior:
Maximum penetration force (N): F#mn
Maximum penetration distance
(mm): X#mn
Total work (J): W = o pN4q
P Equation 3
Total work at Xmax (J): W#mn = o pN4qrst
P Equation 4
Average puncturing force (N): upv =W#mnX#mn
Equation 5
Descripting parameters of Crispy (Croustillant) behavior:
Total number of peaks: w
0
1
2
3
4
5
6
7
0 0.5 1 1.5 2 2.5 3 3.5
Forc
e (
N)
Deformation (mm)
Rupture point
Xmax
Wmax
!x
Micro-rupture
!F
Fmax
57

Spatial frequency of structural micro-ruptures (m-1
): N =w
X#mn Equation 6
Average of micro-rupture force (N): f = uxFv =yxF
w Equation 7
Average work for micro-ruptures (J): w[zOGz[) = uxp.x{2
v Equation 8
=1
2uxpv. ux{v =
1
2|.{#mnw =
|2S
Where, !X is the penetration distance for each micro-rupture peak (mm) and !F is
the individual force drops for each micro-rupture peak (N). All of these parameters
(i.e. Xmax, Wmax, #F$, N, f, wrupture, !X and !F) were calculated until Fmax was reached
(Figure 15). The final values were the arithmetic mean of five measurements.
II.2.2.9 Expansion ratios
For the porous materials we studied, two expansion ratios were normally defined:
the absolute expansion ratio #_absolute and the relative expansion ratio #_relative.
The first #_absolute is the ratio of the apparent volume of the product and the
volume of the solid itself. The second #_relative reflects the increase of volume after
processing (FD and SD) compared with the HAD. The absolute and the relative
expansion ratios are in function of the product´s densities $_intrinsic and $_specific
(g/m3), which were calculated for each sample as follows:
Absolute expansion
ratio: am\V}~zG) =
!:�G[:�V:�!VO)�:*:� Equation 9
Relative expansion ratio: a[)~mG:�) =!VO)�:*:� c| �9( <�cN��1
!VO)�:*:� c| �( c� p( <�cN��1 Equation 10
Where, the intrinsic density is the density of solid properly said. To measure the
intrinsic density ($intrinsic, g/m3) of each sample (HAD, FD and SD), a gas
Pycnometer Micromeritics AccuPyc 1330 (USA) with helium was used.
In the cases of food dried samples, Archimedes method is not possible to be adopted
for measuring the specific (apparent) density because of possible interaction
58
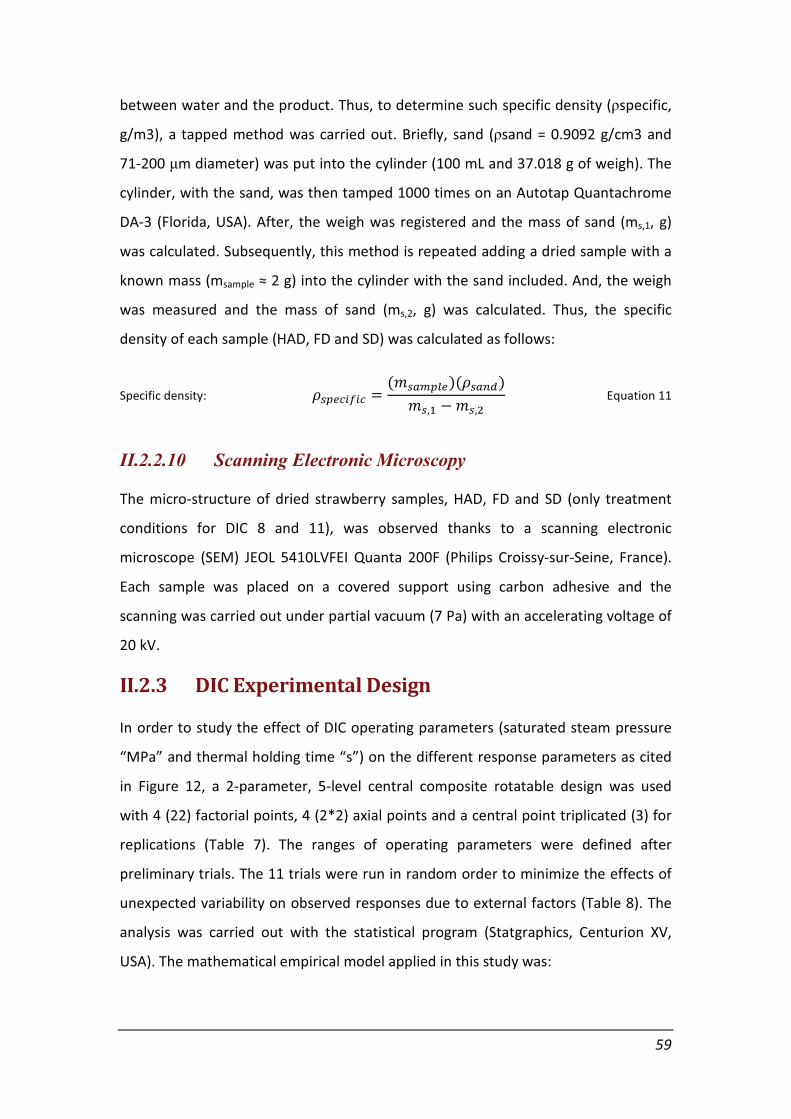
between water and the product. Thus, to determine such specific density ($specific,
g/m3), a tapped method was carried out. Briefly, sand ($sand = 0.9092 g/cm3 and
71-200 %m diameter) was put into the cylinder (100 mL and 37.018 g of weigh). The
cylinder, with the sand, was then tamped 1000 times on an Autotap Quantachrome
DA-3 (Florida, USA). After, the weigh was registered and the mass of sand (ms,1, g)
was calculated. Subsequently, this method is repeated adding a dried sample with a
known mass (msample (#)#*+#,%-.#-/0#123,%&04#5,-/#-/0#6$%&#,%137&0&8#9%&"#-/0#50,*/#
was measured and the mass of sand (ms,2, g) was calculated. Thus, the specific
density of each sample (HAD, FD and SD) was calculated as follows:
Specific density: !VO)�:*:� =(]Vm#O~))(!Vm�I)
]V,7 ']V,3 Equation 11
II.2.2.10 Scanning Electronic Microscopy
The micro-structure of dried strawberry samples, HAD, FD and SD (only treatment
conditions for DIC 8 and 11), was observed thanks to a scanning electronic
microscope (SEM) JEOL 5410LVFEI Quanta 200F (Philips Croissy-sur-Seine, France).
Each sample was placed on a covered support using carbon adhesive and the
scanning was carried out under partial vacuum (7 Pa) with an accelerating voltage of
20 kV.
II.2.3 DIC Experimental Design
In order to study the effect of DIC operating parameters (saturated steam pressure
“MPa” and thermal holding time “s”) on the different response parameters as cited
in Figure 12, a 2-parameter, 5-level central composite rotatable design was used
with 4 (22) factorial points, 4 (2*2) axial points and a central point triplicated (3) for
replications (Table 7). The ranges of operating parameters were defined after
preliminary trials. The 11 trials were run in random order to minimize the effects of
unexpected variability on observed responses due to external factors (Table 8). The
analysis was carried out with the statistical program (Statgraphics, Centurion XV,
USA). The mathematical empirical model applied in this study was:
59

T = �P + 8�:�:�
:?7+ 8�::�:3
�
:?7+ 88�:��:��
�
�?3
�A7
:?7+ a Equation 12
Where:
Y is the response; :i, :ii, :ij are the regression coefficients; Xi and Xj are the
independent variables; ; is the random error; and i and j are the indices of the
factors.
To understand better, the results were expressed by:
& The analysis of variance (ANOVA) was used to determine significant
differences between independent variables (p < 0.05).
& Pareto chart was inserted to identify the impact of variables on
various responses. The vertical line in the Pareto chart determines the
effects that are statistically significant at the 95 % confidence level.
The standardized effect is the estimated effect divided by its standard
error. Hence, a low standardized effect can mean either a low effect
of the parameter or a large experimental error.
& Surface response methodology plots are used to optimize the various
responses.
& General trends to analyze various responses behavior in front of
variable changes.
& Empirical model coefficients to determine the regression model for
each response and R² to accurate fitting models to real data.
Table 7. Coded and real ranges of independent variables used in the 2-variable 5-
level rotatable experimental design
Factor/ Coded Level -' -1 0 1 +'
Processing pressure (MPa) 0.10 0.19 0.35 0.53 0.60
Processing time (s) 10 13 20 27 30
'=����; ' is the axial distance and k is the number of experiments of orthogonal design. In this case,
k=2 and '=1.4142.
Table 8. Trials in the experimental design for DIC process
60
DIC
Run 1 2 3 4 5 6 7 8 9 10 11
Processing pressure (MPa) 0.60 0.35 0.35 0.53 0.53 0.35 0.17 0.17 0.10 0.35 0.35
Processing time (s) 20 30 20 27 13 20 13 27 20 10 20
61
PART III
RESULTS
62
CHAPTER III.1
COMPARATIVE STUDY OF VARIOUS DRYING
PROCESSES AT PHYSICAL AND CHEMICAL
PROPERTIES OF STRAWBERRIES (FRAGARIA VAR.
CAMAROSA)
63
Procedia Engineering 42 (2012) 297-312
www.elsevier.com/locate/procedia
20th International Congress of Chemical and Process Engineering CHISA 2012 25 – 29 August 2012, Prague, Czech Republic
Comparative study of various drying processes at physical and
chemical properties of strawberries (Fragaria var. camarosa)
Alonzo-Macías Maritzaa,c, Mounir. Sabaha,b, Cardador-Martínez Anabertac, Montejano-Gaitán José Gerardoc and Allaf Karima1
aUniversity of La Rochelle, Intensification of Transfer Phenomena on Industrial Eco-Processes, Laboratory Engineering Science for Environment
LaSIE FRE 3474 CNRS, 17042La Rochelle, France bZagazig University, Faculty of Agriculture, Department of Food Science, Zagazig, Egypt
cInstituto Tecnológico y de Estudios Superiores de Monterrey. Campus Querétaro. Cátedra de Biotecnología Agroalimentaria. Epigmenio González
500 Fracc. San Pablo 76130 Querétaro, Qro.Mexico
Abstract
The objective of this work was to study and compare different drying processes of strawberry. The impact of DIC as texturing process within a swell drying operation was quantified when inserted before the second stage of hot air drying (swell drying SD). The obtained results showed that DIC treatment has a great impact on drying kinetics and performances compared to those of classical hot air drying. The drying of DIC-textured strawberry was accelerated even under low temperature (soft conditions). That can be explained by the direct impact of swelling on diffusivity and starting accessibility. Indeed, the mechanical effect of pressure drop leads to a great expansion of the structure, while the short thermal treatment time can preserve the quality. Thus, the new modified texture makes the trapped water accessible for improving the diffusion especially in the second stage of drying after the shrinkage of product, as well as in the rehydration process; the water holding capacity can be much higher. So the necessary time to reach the optimum final water content for the storage is shorter in case of DIC-swell dried strawberry compared to the classical hot air dried products. © 2012 Published by Elsevier Ltd. Selection under responsibility of the Congress Scientific Committee (Petr Kluson) Keywords: Instant Controlled Pressure Drop, capsicum; drying kinetics; rehydration kinetics; water holding capacity
1* Corresponding author. Tel.: +33 546 45 87 66; fax: +33 546 45 86 16 E-mail address: [email protected].
1877-7058 © 2012 Published by Elsevier Ltd. doi:10.1016/j.proeng.2012.07418

2 Alonzo-Macías, et al/ Procedia Engineering 42 (2012) 297-312
1. Introduction
Strawberry is one of the most delicate and highly perishable fruits, due to respiration, weight loss and susceptibility to fungal contamination. At the same time, they are sensitive to chemical and microbial deterioration during post-harvest storage and handling, therefore, they have a rather limited shelf life in a fresh form [1]. Hence, large range of unit operations have been proposed and used to preserve it. New operations such as swell-drying and freezing of partially dried products were defined combined to Instant Controlled Pressure Drop (DIC).
DIC is a high temperature short time (HTST) treatment followed by an abrupt pressure drop towards a vacuum implying an autovaporization of small amount of water from the products. It hence induces an instant cooling of treated products preventing their thermal degradation. Such a cooling gotten by abruptly dropping the pressure from high saturated steam level (from 0.1 up to 0.6 MPa to about 5 kPa with a rate of ΔP/Δt>0.5 MPa s-1) [2,3] allows the product to cross the glass transition border. Thus the new swelled/expanded texture obtained after DIC treatment can be maintained. Thus, DIC treatment has two effects: the thermal effect as a result of the short-time/high-temperature induced by saturated steam; and the mechanical effect, which is induced by the difference between the high pressure inside the product and the surrounding vacuum. DIC enhances many unit operations such as drying; freezing and even extraction may not only maintain valuable compounds found in fresh products but can also improve both of their availability and activity. Likewise, DIC process has been used to swell-dry, decontaminate, and texture various fruits and vegetables; it ensures a high quality by improving the kinetics and the capacity of both dehydration and rehydration processes as well as the possibility of preserving and even increasing the organoleptic content and the availability of bioactive compounds such as antioxidant activity [4-6]. Moreover, dried products could be directly consumed as snacking or in many other powder forms to produce high quality puree, jam, ice-cream, baby foods, breakfast cereals, possibly rehydrated with yoghurt and bakery products [7].
The aim of this study was to compare various drying techniques; Hot Air Drying (HAD), Freeze Drying (FD), and Swell drying (SD); coupling the traditional hot air drying to DIC treatment. A comparative study was conducted to evaluate the different drying techniques in terms of drying kinetics (drying time starting accessibility, effective water diffusivity), rehydration kinetics (rehydration time, starting accessibility, effective water diffusivity), and water holding capacity of dried strawberries (Fragaria Var. Camarosa).
2. Materials and Methods
2.1. Materials
The strawberries (Fragaria Var. Camarosa) were purchased from a popular local market of La Rochelle city, France. They were transported to the laboratory and stored at 5ºC for 24 h.
2.2. Methods
2.2.1. Sample Preparation
Strawberries were selected, cleaned and washed with potable water; they were subsequently cut with a hand knife into 4-5 slices. For the treatment, they were divided in three lots for being processed by: hot air HAD, freeze-drying FD and swell drying SD.
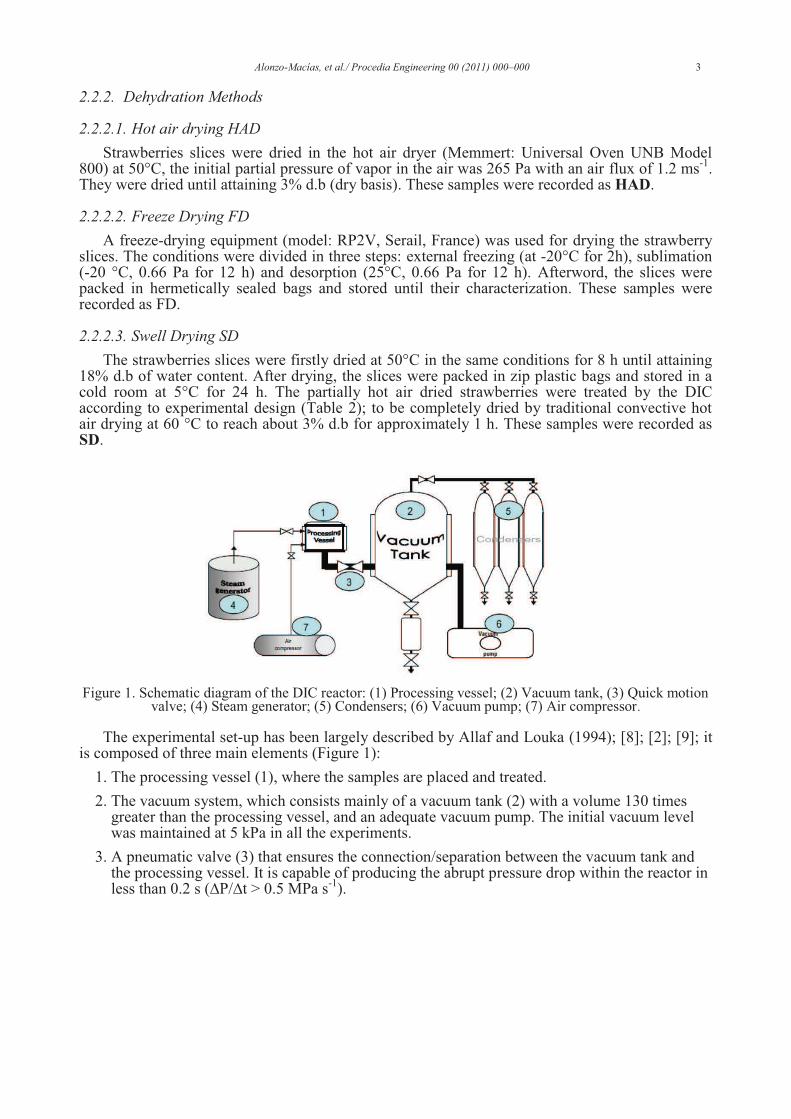
Alonzo-Macías, et al./ Procedia Engineering 00 (2011) 000–000 3
2.2.2. Dehydration Methods
2.2.2.1. Hot air drying HAD
Strawberries slices were dried in the hot air dryer (Memmert: Universal Oven UNB Model 800) at 50°C, the initial partial pressure of vapor in the air was 265 Pa with an air flux of 1.2 ms-1. They were dried until attaining 3% d.b (dry basis). These samples were recorded as HAD.
2.2.2.2. Freeze Drying FD
A freeze-drying equipment (model: RP2V, Serail, France) was used for drying the strawberry slices. The conditions were divided in three steps: external freezing (at -20°C for 2h), sublimation (-20 °C, 0.66 Pa for 12 h) and desorption (25°C, 0.66 Pa for 12 h). Afterword, the slices were packed in hermetically sealed bags and stored until their characterization. These samples were recorded as FD.
2.2.2.3. Swell Drying SD
The strawberries slices were firstly dried at 50°C in the same conditions for 8 h until attaining 18% d.b of water content. After drying, the slices were packed in zip plastic bags and stored in a cold room at 5°C for 24 h. The partially hot air dried strawberries were treated by the DIC according to experimental design (Table 2); to be completely dried by traditional convective hot air drying at 60 °C to reach about 3% d.b for approximately 1 h. These samples were recorded as SD.
Figure 1. Schematic diagram of the DIC reactor: (1) Processing vessel; (2) Vacuum tank, (3) Quick motion valve; (4) Steam generator; (5) Condensers; (6) Vacuum pump; (7) Air compressor.
The experimental set-up has been largely described by Allaf and Louka (1994); [8]; [2]; [9]; it is composed of three main elements (Figure 1):
1. The processing vessel (1), where the samples are placed and treated.
2. The vacuum system, which consists mainly of a vacuum tank (2) with a volume 130 times greater than the processing vessel, and an adequate vacuum pump. The initial vacuum level was maintained at 5 kPa in all the experiments.
3. A pneumatic valve (3) that ensures the connection/separation between the vacuum tank and the processing vessel. It is capable of producing the abrupt pressure drop within the reactor in less than 0.2 s (DP/Dt > 0.5 MPa s-1).
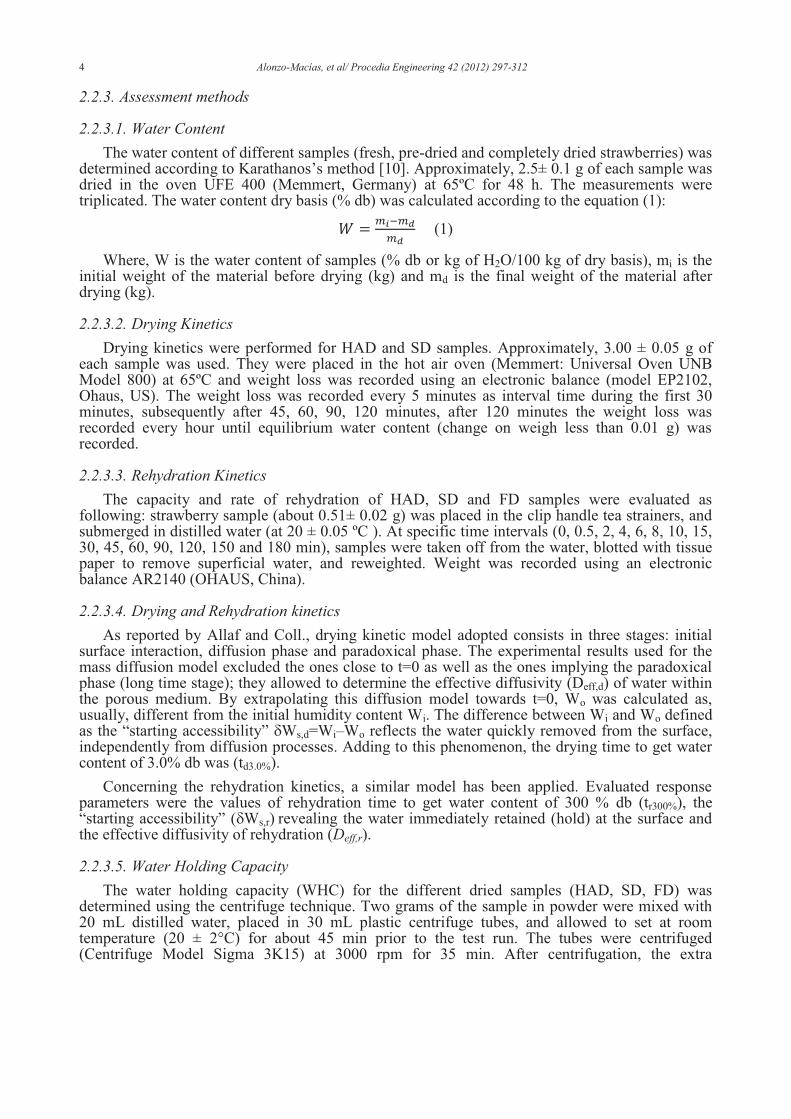
4 Alonzo-Macías, et al/ Procedia Engineering 42 (2012) 297-312
2.2.3. Assessment methods
2.2.3.1. Water Content
The water content of different samples (fresh, pre-dried and completely dried strawberries) was determined according to Karathanos’s method [10]. Approximately, 2.5± 0.1 g of each sample was dried in the oven UFE 400 (Memmert, Germany) at 65ºC for 48 h. The measurements were triplicated. The water content dry basis (% db) was calculated according to the equation (1):
(1)
Where, W is the water content of samples (% db or kg of H2O/100 kg of dry basis), mi is the initial weight of the material before drying (kg) and md is the final weight of the material after drying (kg).
2.2.3.2. Drying Kinetics
Drying kinetics were performed for HAD and SD samples. Approximately, 3.00 ± 0.05 g of each sample was used. They were placed in the hot air oven (Memmert: Universal Oven UNB Model 800) at 65ºC and weight loss was recorded using an electronic balance (model EP2102, Ohaus, US). The weight loss was recorded every 5 minutes as interval time during the first 30 minutes, subsequently after 45, 60, 90, 120 minutes, after 120 minutes the weight loss was recorded every hour until equilibrium water content (change on weigh less than 0.01 g) was recorded.
2.2.3.3. Rehydration Kinetics
The capacity and rate of rehydration of HAD, SD and FD samples were evaluated as following: strawberry sample (about 0.51± 0.02 g) was placed in the clip handle tea strainers, and submerged in distilled water (at 20 ± 0.05 ºC ). At specific time intervals (0, 0.5, 2, 4, 6, 8, 10, 15, 30, 45, 60, 90, 120, 150 and 180 min), samples were taken off from the water, blotted with tissue paper to remove superficial water, and reweighted. Weight was recorded using an electronic balance AR2140 (OHAUS, China).
2.2.3.4. Drying and Rehydration kinetics
As reported by Allaf and Coll., drying kinetic model adopted consists in three stages: initial surface interaction, diffusion phase and paradoxical phase. The experimental results used for the mass diffusion model excluded the ones close to t=0 as well as the ones implying the paradoxical phase (long time stage); they allowed to determine the effective diffusivity (Deff,d) of water within the porous medium. By extrapolating this diffusion model towards t=0, Wo was calculated as, usually, different from the initial humidity content Wi. The difference between Wi and Wo defined as the “starting accessibility” dWs,d=Wi–Wo reflects the water quickly removed from the surface, independently from diffusion processes. Adding to this phenomenon, the drying time to get water content of 3.0% db was (td3.0%).
Concerning the rehydration kinetics, a similar model has been applied. Evaluated response parameters were the values of rehydration time to get water content of 300 % db (tr300%), the “starting accessibility” (dWs,r) revealing the water immediately retained (hold) at the surface and the effective diffusivity of rehydration (Deff,r).
2.2.3.5. Water Holding Capacity
The water holding capacity (WHC) for the different dried samples (HAD, SD, FD) was determined using the centrifuge technique. Two grams of the sample in powder were mixed with 20 mL distilled water, placed in 30 mL plastic centrifuge tubes, and allowed to set at room temperature (20 ± 2°C) for about 45 min prior to the test run. The tubes were centrifuged (Centrifuge Model Sigma 3K15) at 3000 rpm for 35 min. After centrifugation, the extra
Alonzo-Macías, et al./ Procedia Engineering 00 (2011) 000–000 5
supernatant from the centrifuged sample was drained and the sample was reweighted. The samples were then dried in hot air oven at 65 ºC for 48 h for water content determination. WHC was calculated as the amount of water (g) absorbed by 100 g of dry basis.
2.2.4. Experimental Design
In order to study the effect of DIC operating parameters (saturated steam pressure “MPa” and thermal holding time “s”) on the different response parameters (effective water diffusivity, starting accessibility, the needed time to attain reach a specific water content for both drying and rehydration, and water holding capacity); a 2-parameter, 5-level central composite rotatable design (Table 2) was used with 4 factorial points and 4 axial points while the central point was triplicated. The ranges of operating parameters were defined after preliminary trials (Table 1). The 11 runs were achieved in random to minimize the effects of unexpected variability due to external factors. The analysis was carried out with the statistical program (Statgraphics, Centurion XV, USA). The mathematical empirical model applied in this study is:
Where Y is the response, βi, βii, βij are the regression coefficients, χi are the independent variables, ε is random error, i and j are the indices of the factors.
Results were expressed by:
· Surface response methodology plots to optimize the responses,
· The analysis of variance (ANOVA) to determine significant differences between independent variables (P 0.05),
· Pareto charts to identify the impact of variables on responses,
· General trends to analyze responses behavior in front of variable changes,
· Empirical model coefficients to determine the models of each response, and R² to accurate fitting models to real data.
Table 1.Coded levels for independent variables used in developing experimental data.
Coded levels -a -1 0 1 +a
Saturated steam pressure P (MPa)
0.10 0.17 0.35 0.53 0.60
Processing time t (s) 10 13 20 27 30
a (axial distance)= ; N is the number of experiments of orthogonal design, i.e. of the factorial design. In this case a = 1.4142
Table 2. Experimental design used in DIC treatment for SD.
Run 1 2 3 4 5 6 7 8 9 10 11
Pressure P (MPa) 0.6 0.35 0.35 0.53 0.53 0.35 0.17 0.17 0.10 0.35 0.35
Time t (s) 20 30 20 27 13 20 13 27 20 10 20
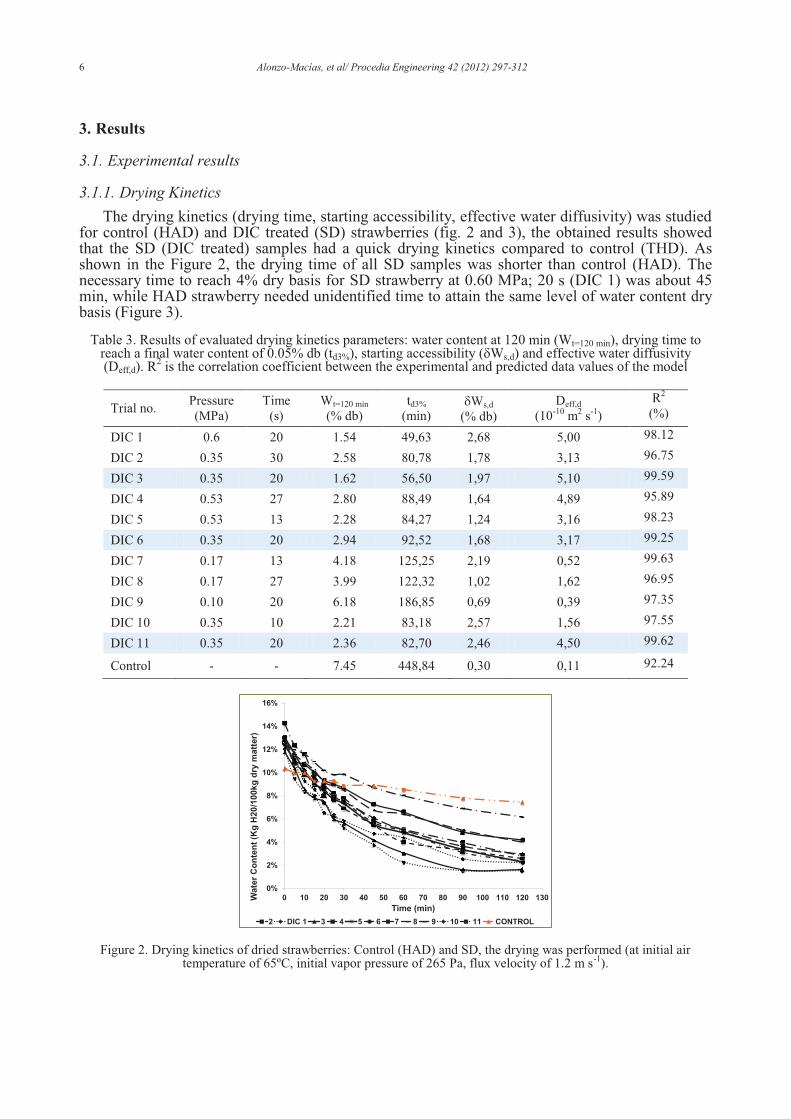
6 Alonzo-Macías, et al/ Procedia Engineering 42 (2012) 297-312
3. Results
3.1. Experimental results
3.1.1. Drying Kinetics
The drying kinetics (drying time, starting accessibility, effective water diffusivity) was studied for control (HAD) and DIC treated (SD) strawberries (fig. 2 and 3), the obtained results showed that the SD (DIC treated) samples had a quick drying kinetics compared to control (THD). As shown in the Figure 2, the drying time of all SD samples was shorter than control (HAD). The necessary time to reach 4% dry basis for SD strawberry at 0.60 MPa; 20 s (DIC 1) was about 45 min, while HAD strawberry needed unidentified time to attain the same level of water content dry basis (Figure 3).
Table 3. Results of evaluated drying kinetics parameters: water content at 120 min (Wt=120 min), drying time to reach a final water content of 0.05% db (td3%), starting accessibility (dWs,d) and effective water diffusivity (Deff,d). R
2 is the correlation coefficient between the experimental and predicted data values of the model
Trial no. Pressure (MPa)
Time (s)
Wt=120 min (% db)
td3% (min)
dWs,d (% db)
Deff,d (10-10 m2 s-1)
R2 (%)
DIC 1 0.6 20 1.54 49,63 2,68 5,00 98.12
DIC 2 0.35 30 2.58 80,78 1,78 3,13 96.75
DIC 3 0.35 20 1.62 56,50 1,97 5,10 99.59
DIC 4 0.53 27 2.80 88,49 1,64 4,89 95.89
DIC 5 0.53 13 2.28 84,27 1,24 3,16 98.23
DIC 6 0.35 20 2.94 92,52 1,68 3,17 99.25
DIC 7 0.17 13 4.18 125,25 2,19 0,52 99.63
DIC 8 0.17 27 3.99 122,32 1,02 1,62 96.95
DIC 9 0.10 20 6.18 186,85 0,69 0,39 97.35
DIC 10 0.35 10 2.21 83,18 2,57 1,56 97.55
DIC 11 0.35 20 2.36 82,70 2,46 4,50 99.62
Control - - 7.45 448,84 0,30 0,11 92.24
Figure 2. Drying kinetics of dried strawberries: Control (HAD) and SD, the drying was performed (at initial air temperature of 65ºC, initial vapor pressure of 265 Pa, flux velocity of 1.2 m s-1).
0%
2%
4%
6%
8%
10%
12%
14%
16%
0 10 20 30 40 50 60 70 80 90 100 110 120 130Wate
r C
on
ten
t (K
g H
20
/100
kg
dry
matt
er)
Time (min)
2 DIC 1 3 4 5 6 7 8 9 10 11 CONTROL
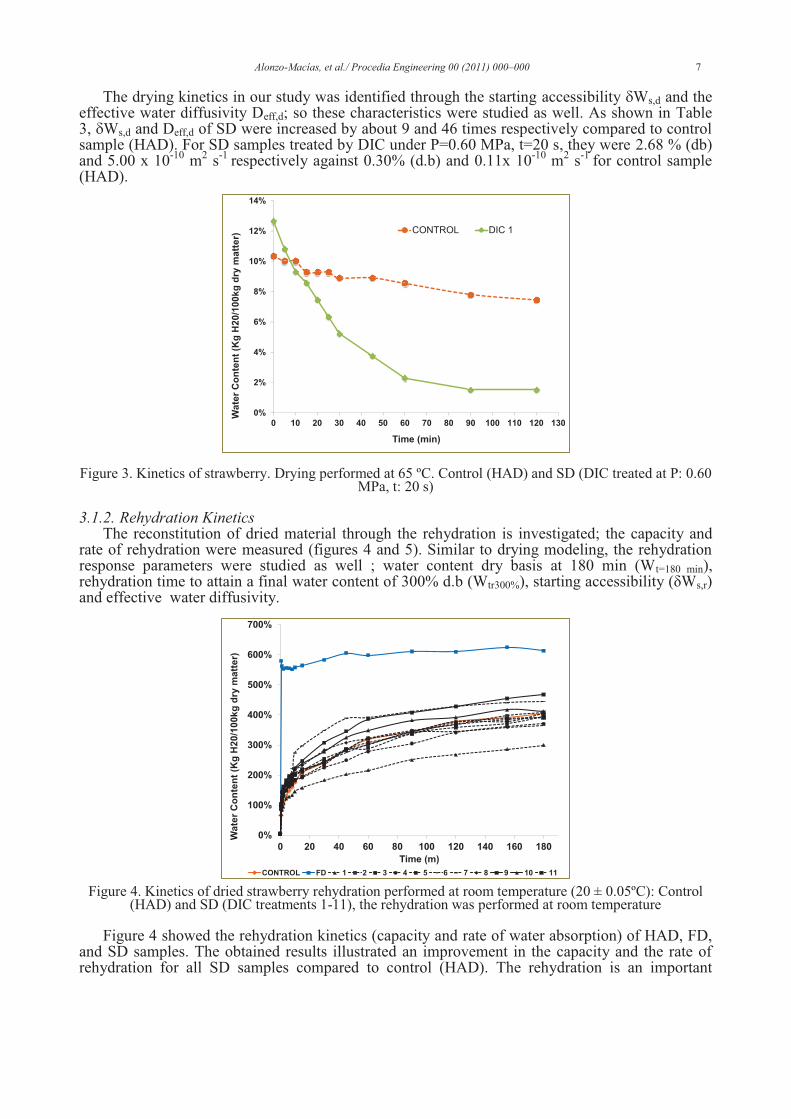
Alonzo-Macías, et al./ Procedia Engineering 00 (2011) 000–000 7
The drying kinetics in our study was identified through the starting accessibility dWs,d and the effective water diffusivity Deff,d; so these characteristics were studied as well. As shown in Table 3, dWs,d and Deff,d of SD were increased by about 9 and 46 times respectively compared to control sample (HAD). For SD samples treated by DIC under P=0.60 MPa, t=20 s, they were 2.68 % (db) and 5.00 x 10⁻¹⁰ m2 s-1 respectively against 0.30% (d.b) and 0.11x 10⁻¹⁰ m2 s-1 for control sample (HAD).
Figure 3. Kinetics of strawberry. Drying performed at 65 ºC. Control (HAD) and SD (DIC treated at P: 0.60 MPa, t: 20 s)
3.1.2. Rehydration Kinetics The reconstitution of dried material through the rehydration is investigated; the capacity and
rate of rehydration were measured (figures 4 and 5). Similar to drying modeling, the rehydration response parameters were studied as well ; water content dry basis at 180 min (Wt=180 min), rehydration time to attain a final water content of 300% d.b (Wtr300%), starting accessibility (δWs,r) and effective water diffusivity.
Figure 4. Kinetics of dried strawberry rehydration performed at room temperature (20 ± 0.05ºC): Control (HAD) and SD (DIC treatments 1-11), the rehydration was performed at room temperature
Figure 4 showed the rehydration kinetics (capacity and rate of water absorption) of HAD, FD, and SD samples. The obtained results illustrated an improvement in the capacity and the rate of rehydration for all SD samples compared to control (HAD). The rehydration is an important
0%
2%
4%
6%
8%
10%
12%
14%
0 10 20 30 40 50 60 70 80 90 100 110 120 130
Wate
r C
on
ten
t (K
g H
20/1
00kg
dry
matt
er)
Time (min)
CONTROL DIC 1
0%
100%
200%
300%
400%
500%
600%
700%
0 20 40 60 80 100 120 140 160 180
Wa
ter
Co
nte
nt
(Kg
H2
0/1
00
kg
dry
ma
tte
r)
Time (m)
CONTROL FD 1 2 3 4 5 6 7 8 9 10 11

8 Alonzo-Macías, et al/ Procedia Engineering 42 (2012) 297-312
characteristic of dried food, normally affected by drying technique and drying conditions as well. Our results showed that the behavior of dried product during rehydration is drying technique dependent. The SD samples showed high capacity with rapid rate of water uptake compared to control (HAD), however the FD samples had the highest capacity and rate of water absorption compared to both SD and HAD samples.
During the first five minutes of rehydration time (total time: 180 min), SD samples had a high water uptake (200% d.b) compared to HAD as control (100% db), while the FD samples were found with 550% d.b with rapid rate of water uptake (Figure 5).The DIC1-SD strawberries treated under saturated steam pressure of P: 0.60 MPa for t: 20s were found to get the highest rehydration kinetics.
Figure 5. Rehydration kinetics of dried strawberries: Control (HAD) and SD (DIC point 1; P: 0.60 MPa, t: 20 s) the rehydration was performed at room temperature (20 ± 0.05ºC).
Table 4. Water Holding Capacity (WHC) and compute dehydration kinetic parameter: Wt=180 min (water content at 180 min), tr300% (rehydration time to attain a final water content of 300% db), δWs,r (starting accessibility) and (Deff,r) effective water diffusivity. R2 is the correlation coefficient between the experimental and predicted data values of the model.
Trial no.
Pressure (MPa)
Time (s)
WHC (% db)
Wt=180 min
(% db)
tr300% (min)
δWs,r (% db)
Deff,r (10-10 m2
s-1)
R2 (%)
DIC 1 0.6 20 108,16% 299.81 193,57 39,89% 2,77 97.96
DIC 2 0.35 30 228,51% 407.67 66,53 59,95% 2,84 98.37
DIC 3 0.35 20 162,94% 392.06 58,40 41,97% 4,03 98.43
DIC 4 0.53 27 84,55% 370.60 85,66 39,37% 4,74 97.62
DIC 5 0.53 13 230,03% 390.75 65,01 48,60% 3,37 98.23
DIC 6 0.35 20 204,29% 365.00 61,63 74,85% 4,65 99.25
DIC 7 0.17 13 134,78% 444.32 34,41 23,00% 1,19 94.90
DIC 8 0.17 27 133,33% 403.18 60,16 29,50% 2,52 95.89
DIC 9 0.1 20 222,63% 467.73 40,24 45,28% 1,02 98.26
DIC 10 0.35 10 235,97% 411.12 44,89 69,59% 2,13 99.36
DIC 11 0.35 20 157,56% 394.79 65,96 71,67% 4,53 98.95
Control - - 288,97 613.5 55,48 10,81% 0,67 98.48
FD 0.6 20 190,44 403.97 37,59 592,94% 2,42 91.19
0%
100%
200%
300%
400%
500%
600%
700%
0 20 40 60 80 100 120 140 160 180
Wate
r C
on
ten
t (K
g H
20/1
00kg
dry
matt
er)
Time (min)
CONTROL (HAD) FD DIC 1

Alonzo-Macías, et al./ Procedia Engineering 00 (2011) 000–000 9
The starting accessibility δWs,r and effective water diffusivity Deff,r revealing the kinectis of rehydration of dried strawberries were increased by 662% and 676% respectively compared to control sample (HAD). SD samples treated by DIC under P=0.35 MPa, t=20 s had δWs,r and Deff,r of 71.67%% (d.b) and 4.53 x 10⁻¹⁰ m2 s-1 respectively against 10.81%% (d.b) and 0.67 x 10⁻¹⁰ m2 s-
1 for HAD as control. It worth to mention here that, although the rehydration of freeze dried FD samples were found with δWs,r higher than SD samples, one cannot assume FD rehydration as a diffusion phenomenon; it should be only based on a superficial exchange phenomena Deff,r of FD was incomparable in our study.
3.2. Correlation terms
The different response parameters concerning both of drying and rehydration kinetics were: δWs,d: Drying Stating accessibility, % d.b Deff,d: Effective water diffusivity during drying, m2 s-1 td3%: Dehydration time to attain water content of 3% d.b δWs,r: Rehydration Stating accessibility % d.b Deff,r: Effective water diffusivity during rehydration, m2 s-1 tr300%: Rehydration time to attain a final water content of 300% d.b WHC: Water Holding Capacity (% d.b) Table 5. Correlations between drying and rehydration response parameters, and Water Holding Capacity (WHC).
δWs,d Deff td3% δWs,r Deff tr300% WHC
δWs,d 1,00 0,50 -0,74 0,42 0,32 0,42 -0,46
Deff 0,50 1,00 -0,66 0,32 0,84 0,62 -0,54
td3% -0,74 -0,66 1,00 -0,60 -0,64 -0,28 0,56
δWs,r 0,42 0,32 -0,60 1,00 -0,01 -0,22 0,04
Deff 0,32 0,84 -0,64 -0,01 1,00 0,26 -0,43
tr300% 0,42 0,62 -0,28 -0,22 0,26 1,00 -0,46
WHC -0,46 -0,54 0,56 0,04 -0,43 -0,46 1,00
Normal correlations could be identified; they mainly concerned effective water diffusivity Deff,d and drying time and starting accessibility δWs,d. Water Holding Capacity WHC was correlated with effective water diffusivity during rehydration Deff,d; both revealing deep behavior. However, it was not correlated with starting accessibility δWs,r, which normally linked to the only exchange surface.
3.3. RSM analysis
3.3.1. Drying operation
3.3.1.1. Drying time
The estimated drying time to attain 3% db as final water content from 10% db for HAD and SD samples was calculated from the Fick’s diffusional model. As observed in Table 3, the rapid drying operation was achieved for SD sample (treated by DIC) under P: 0.60 MPa, t: 20s), with time decreasing (compared to control) from 448.84 to 49.63 min.
Erreur ! Source du renvoi introuvable. illustrates the impact of operating parameters (saturated steam pressure, thermal holding time, with constant initial water content) of DIC treatment on the necessary time of drying to obtain final water content of 3% dry basis for SD samples. We observed that the most influencing parameters was the saturated steam pressure, the

10 Alonzo-Macías, et al/ Procedia Engineering 42 (2012) 297-312
higher the saturated steam pressure, the shorter the drying time, while the impact of thermal holding time was insignificant and stable as a result of nearby treatment.
Figure 6. Effects of DIC operating parameters; Pressure (MPa) and time (s) on the drying time (td0.03%) of SD Strawberries: (left) Pareto Chart and (right) response surface.
3.3.1.2. Starting accessibility
Concerning the starting accessibility, there was no significant effect of neither saturated steam pressure nor thermal treatment time (results none shown). However, the mean starting accessibility value for the DIC treated sample was much higher than those of freeze dried samples (1.81% against 0.30% respectively).
3.3.1.3. Effective water diffusivity
As the drying is a water removal process, so the diffusion of water and starting accessibility during the drying were studied as well. Figure 7Erreur ! Source du renvoi introuvable. illustrated the impact of DIC operating parameters (saturated steam pressure and thermal holding time with constant initial water content) on effective water diffusivity during drying. The obtained results showed that both saturated steam pressure and thermal processing time had significant impacts on effective water diffusivity; the higher the saturated steam pressure, the higher the effective water diffusivity within the product under intensified drying conditions.
Figure 7. Effects of DIC operating parameters; Pressure (MPa) and time (s) on the starting effective water diffusivity (Deff,d ) of SD Strawberries: (left) Pareto Chart and (right) response surface
3.3.2. Rehydration operation
3.3.2.1. Rehydration time
A comparative study of rehydration kinetics (the capacity and the rate of water uptake during a given time) was performed to compare the behavior of samples dried by different drying techniques (HAD, SD, and, FD), the operating parameters of DIC treatment were evaluated as well but only for SD samples.
P
PP
TT
T
PT
Saturated steam pressure (MPa)
Tim
e o
f d
eh
yd
rati
on
P
TT
PP
T
PT
Saturated steam pressure (MPa)
Dif
fusi
vit
y
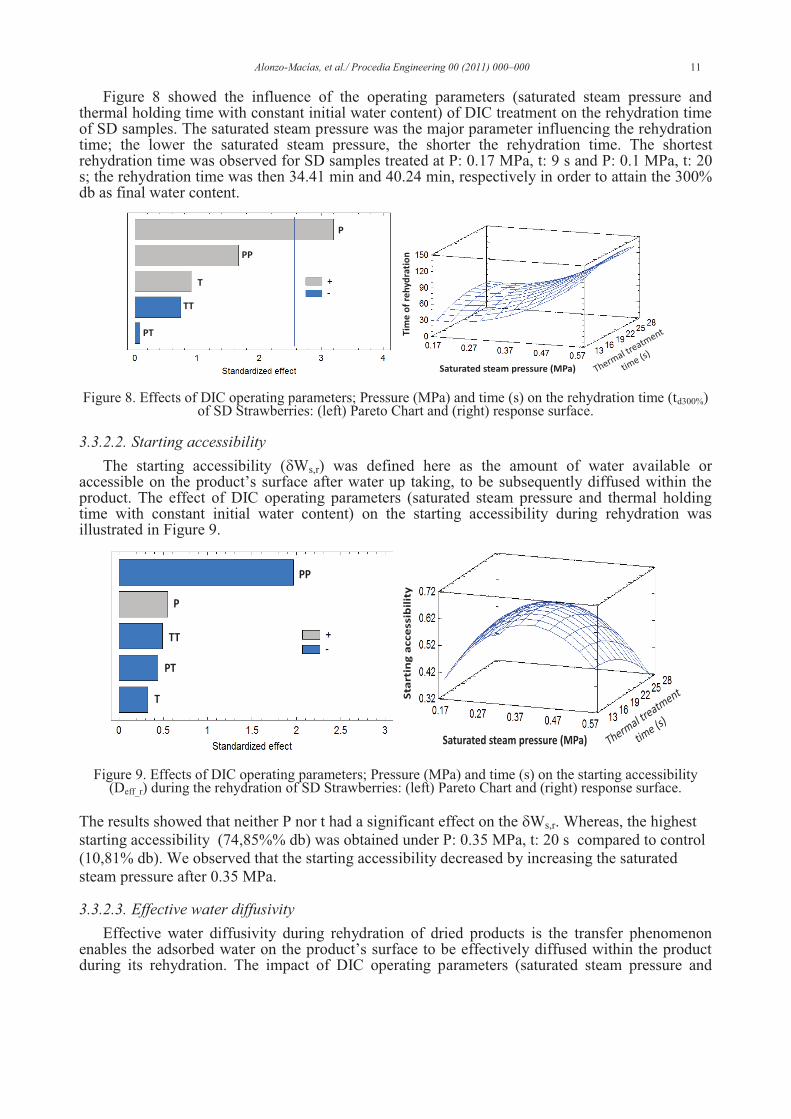
Alonzo-Macías, et al./ Procedia Engineering 00 (2011) 000–000 11
Figure 8 showed the influence of the operating parameters (saturated steam pressure and thermal holding time with constant initial water content) of DIC treatment on the rehydration time of SD samples. The saturated steam pressure was the major parameter influencing the rehydration time; the lower the saturated steam pressure, the shorter the rehydration time. The shortest rehydration time was observed for SD samples treated at P: 0.17 MPa, t: 9 s and P: 0.1 MPa, t: 20 s; the rehydration time was then 34.41 min and 40.24 min, respectively in order to attain the 300% db as final water content.
Figure 8. Effects of DIC operating parameters; Pressure (MPa) and time (s) on the rehydration time (td300%) of SD Strawberries: (left) Pareto Chart and (right) response surface.
3.3.2.2. Starting accessibility
The starting accessibility (dWs,r) was defined here as the amount of water available or accessible on the product’s surface after water up taking, to be subsequently diffused within the product. The effect of DIC operating parameters (saturated steam pressure and thermal holding time with constant initial water content) on the starting accessibility during rehydration was illustrated in Figure 9.
Figure 9. Effects of DIC operating parameters; Pressure (MPa) and time (s) on the starting accessibility (Deff_r) during the rehydration of SD Strawberries: (left) Pareto Chart and (right) response surface.
The results showed that neither P nor t had a significant effect on the dWs,r. Whereas, the highest starting accessibility (74,85%% db) was obtained under P: 0.35 MPa, t: 20 s compared to control (10,81% db). We observed that the starting accessibility decreased by increasing the saturated steam pressure after 0.35 MPa.
3.3.2.3. Effective water diffusivity
Effective water diffusivity during rehydration of dried products is the transfer phenomenon enables the adsorbed water on the product’s surface to be effectively diffused within the product during its rehydration. The impact of DIC operating parameters (saturated steam pressure and
P
PP
TT
T
PT
Saturated steam pressure (MPa)
Tim
e o
f re
hy
dra
tio
n
P
PP
PT
T
TT
Saturated steam pressure (MPa)
Sta
rtin
g a
cce
ssib
ilit
y

12 Alonzo-Macías, et al/ Procedia Engineering 42 (2012) 297-312
thermal holding time with constant initial water content) on the effective water diffusivity was shown in Figure 10. The effective water diffusivity was significantly increased by increasing the saturated steam pressure; the higher saturated steam pressures the higher rate of water diffusivity during the rehydration of SD samples, whereas, the thermal holding time had a slight effect. It is interested to mention here that a similar behavior was observed for the effective water diffusivity during drying where the saturated steam pressure was the major affecting the effective water diffusivity while the effect of thermal holding time was slight reflecting a god definition of time limits and nearby treatment.
The rapid rate of effective water diffusivity Deff,r (4,6510-10 m2 s-1) was obtained for SD sample (treated at P: 0.35 MPa, t: 20 s) against 0,67x 10⁻¹⁰ m2 s-1 for control sample (HAD) with an increase of 694% (table 4). As mentioned before that the rehydration of freeze dried products is not diffusion phenomenon but it based on superficial exchange phenomenon; thus the effective water diffusivity of FD was incomparable in our study.
Figure 10. Effects of DIC operating parameters; Pressure (MPa) and time (s) on the effective water diffusivity (Deff_r) during the rehydration of SD Strawberries: (left) Pareto Chart and (right) response
surface
3.3.3. Water holding capacity
The capacity of water holding of strawberry samples dried by different techniques of drying was studied, was studied (fig. 12), the water holding capacity was significantly decreased with increasing the saturated steam pressure; the higher saturated steam pressure the lower water holding capacity, while the thermal holding time had insignificant effect. The HAD strawberry samples was found with the highest values of water holding capacity compared to FD and SD samples. The high capacity (235.97%) to hold water was found for SD treated at P: 0.35 and t: 10 s (Table 6). The study of DIC operating parameters (saturated steam pressure and thermal holding time at constant initial water content) showed that neither the saturated steam pressure nor thermal holding time had a notable effect on this response parameter.
Figure 11. Effects of DIC operating parameters; Pressure (MPa) and time (s) on the water holding capacity (% db) of SD Strawberries: (left) Pareto Chart and (right) response surface
P
PP
PT
T
TT
Saturated steam pressure (MPa)
Dif
fuss
ivit
y
T
PT
PP
P
TT
Saturated steam pressure (MPa)
WH
C

Alonzo-Macías, et al./ Procedia Engineering 00 (2011) 000–000 13
Table 6. Water Holding Capacity (% db) of dried Strawberries: Freeze drying FD, Traditional Hot Air Drying; THD (control), and Swell Drying SD.
4. Discussion
Drying is one of the most common methods to preserve strawberries [7, 11, 12] and following up its kinetics is the best way to design, predict a model and optimize this process [1, 13, 14]. The traditional food hot air drying commonly includes two periods. The first involves quick water removal (until the critical moisture point) often associated with product’s shrinkage which finally dramatically reduces the diffusivity of water within the material with almost great deformation of the product [15-17]. The second has limited water removal as a result of the low diffusivity value, implying long-time period, high heating temperature and hence thermal degradation [18] revealed by a loss of vitamins and bioactive molecules, degradation of pigments and color, and poor nutrition value with a high energy consummation.
So new trends in food processing are focused on the marriage between new and innovative techniques to the Traditional Hot Air Drying (HAD) with the objective of drying resulting in costs reduction (short drying-time with low energy consumption), and product’s quality preservation.
In this study, Instant Controlled Pressure Drop DIC was coupled to HAD; defined as Swell Drying SD, in order to intensify the HAD. The operation can be considered as an intensification of HAD. The obtained results showed the shorter time of SD compared to HAD (control) with lower final water content. This can be explained by the structural modifications occurred as a result of texturing by DIC. Some of these modifications were the breakdown of the plant cell walls entrapping water inside. SD is a relevant solution to dried product’s shrinkage (texture compactness), product deformation, super heating, and hence thermal degradation (loss of vitamins and bioactive molecules, degradation of pigments and colour, and poor nutrition value).
Texturing by DIC induced an autovaporization of a small amount of product’s water resulting in open texture as a result of gas (saturated steam) expansion within the product. The later produced some mechanical constrains on the cell wall leading to its expansion and to get pores specially since pressure dropping towards a vacuum allows crossing the glass transition border.
The internal water transfer (water diffusion) is the driven force in both drying and rehydration, the open and spongy texture improved significantly the starting accessibility and effective water diffusivity during both drying and rehydration operations. The higher the effective water diffusivity, the shorter the drying and/or rehydration times. These results are in agreement of those reported by other authors; Pilatowski et al., (2010) and Cong et al., (2009) reported time decreasing from 205 min to 11.10 min for paddy rice [19] [20]; Mounir et al., (2009) reported a significant decrease in drying time of apple from 6 h to 1 h [21] and Al Haddad et al. showed a significant decrease in drying time, when they studied the DIC swell drying SD coupled to a final drying by microwaves (700W). This study was carried out on apple and mango cubes. They reported needed time was less than 5 min in the case of DIC coupled to the drying by microwaves, followed by 2 hours for the usual SD. While, they found that HAD needed 8 hours to attain a higher water content (5% db as final moisture content) [22].
The low final water content of SD samples was explained by the rapid removal of water as the diffusivity was improved compared to HAD samples. Others studies reported different levels of final moisture content confirming that the drying kinetics and the final water content are drying techniques and conditions dependent.
Water holding capacity revealed the amount of water absorbed during rehydration (capacity and rate), the low capacity of water holding of SD compared to HAD is due to the structural
THD FD
SWELL-DRYING SD samples
DIC1 DIC2 DIC3 DIC4 DIC5 DIC6 DIC7 DIC8 DIC9 DIC10 DIC11
WHC (%db)
289 190 163 236 204 135 158 229 108 223 133 230 85

14 Alonzo-Macías, et al/ Procedia Engineering 42 (2012) 297-312
modification, the texture was become open and spongy which makes it difficult to catch and hold the absorbed water, this can explain the low capacity of water holding for FD samples, in addition to the texture collapse of FD products. The low water holding capacity for SD strawberries may be due to some broking cell walls.
The RSM analysis for all response parameters showed that DIC saturated steam pressure was the major affecting on the studied response parameters. This can be explained by the mechanical strains induced as a result of steam expansion within the product implying some chemical and textural modifications.
5. Conclusions
Different drying techniques were studied in terms of drying kinetics, starting accessibility and water effective diffusivity during drying. Some of physical and functional properties of dried strawberries were studied as well, such as rehydration kinetics (capacity and rate), starting accessibility and water effective diffusivity during rehydration and the water holding capacity.
The obtained results shows that the swell drying SD can be used as an alternative technique to dry the foodstuffs with high quality during short time decreasing the costs of the operation. The product quality attributes are drying technique dependent. The SD is a flexible process; the operating parameters (saturated steam pressure and thermal processing time) can be optimized to meet the product’s quality and attributes depending on industrial and consumer needs as well.
6. Acknowledgements
The authors acknowledge the Consejo Nacional de Ciencia y Tecnología (CONACyT–Mexico) for the financial support given to this research. Also, thanks to ABCAR-DIC PROCESS SAS (La Rochelle, France) for providing drier equipment and pilot-scale DIC reactor.
7. References
[1] Agnieszka C, Andrzej L. Rehydration and sorption properties of osmotically pretreated freeze-dried strawberries. Journal of Food Engineering 2010;97:267.
[2] Haddad J, Allaf K. A study of the impact of instantaneous controlled pressure drop on the trypsin inhibitors of soybean. Journal of Food Engineering 2007;79:353.
[3] Haddad J, Greiner R, Allaf K. Effect of instantaneous controlled pressure drop on the phytate content of lupin. LWT - Food Science and Technology 2007;40:448.
[4] da Silva FL, Escribano-Bailón MT, Pérez Alonso JJ, Rivas-Gonzalo JC, Santos-Buelga C. Anthocyanin pigments in strawberry. LWT - Food Science and Technology 2007;40:374.
[5] da Silva Pinto M, Lajolo FM, Genovese MI. Bioactive compounds and quantification of total ellagic acid in strawberries (Fragaria x ananassa Duch.). Food Chemistry 2008;107:1629.
[6] Motohashi N, Sakagami H. Anthocyanins as Functional Food Colors. In: Motohashi N, editor. Bioactive Heterocycles VII, vol. 16. Springer Berlin / Heidelberg, 2009. p.1.
[7] El-Beltagy A, Gamea GR, Essa AHA. Solar drying characteristics of strawberry. Journal of Food Engineering 2007;78:456.
[8] Maache-Rezzoug Z, Bouvier J-M, Allaf K, Patras C. Effect of principal ingredients on rheological behaviour of biscuit dough and on quality of biscuits. Journal of Food Engineering 1998;35:23.
[9] Ben Amor B, Allaf K. Impact of texturing using instant pressure drop treatment prior to solvent extraction of anthocyanins from Malaysian Roselle (Hibiscus sabdariffa). Food Chemistry 2009;115:820.
[10] Karathanos VT. Determination of water content of dried fruits by drying kinetics. Journal of Food Engineering 1999;39:337.
[11] Figiel A. Drying kinetics and quality of beetroots dehydrated by combination of convective and vacuum-microwave methods. Journal of Food Engineering 2010;98:461.

Alonzo-Macías, et al./ Procedia Engineering 00 (2011) 000–000 15
[12] Abdel-Aal E-SM, Hucl P. A Rapid Method for Quantifying Total Anthocyanins in Blue Aleurone and Purple Pericarp Wheats. Cereal Chemistry 1999;76:350.
[13] Vieira MGA, Rocha SCS. Mathematical Modeling of Handmade Recycled Papper Drying Kinetics and Sorption Isotherms. Brazilian Journal of Chemical Engineering 2008;25:299.
[14] İbrahim D. Convective drying kinetics of strawberry. Chemical Engineering and Processing: Process Intensification 2008;47:914.
[15] Allaf T, Mih I, Mounir S, Lefrancois V, Allaf K. Let’s combine sun and DIC, let’s Sun-DIC-dry. In: Symposium tICT, editor. TOWARD A SUSTAINABLE FOOD CHAIN: Food Process, Bioprocessing and Food Quality Management. Nantes, France, 2001.
[16] Arslan D, Özcan MM. Dehydration of red bell-pepper (Capsicum annuum L.): Change in drying behavior, colour and antioxidant content. Food and Bioproducts Processing 2011;89:504.
[17] Contreras C, Martín-Esparza ME, Chiralt A, Martínez-Navarrete N. Influence of microwave application on convective drying: Effects on drying kinetics, and optical and mechanical properties of apple and strawberry. Journal of Food Engineering 2008;88:55.
[18] Iguedjtal T, Louka N, Allaf K. Sorption isotherms of potato slices dried and texturized by controlled sudden decompression. Journal of Food Engineering 2008;85:180.
[19] Pilatowski I, Mounir S, Haddad J, Cong D, Allaf K. The Instant Controlled Pressure Drop Process as a New Post-harvesting Treatment of Paddy Rice: Impacts on Drying Kinetics and End Product Attributes. Food and Bioprocess Technology 2010;3:901.
[20] Cong DT, Mounir S, Pilatowski I, Haddad J, Allaf K. Definition of a new post-harvesting treatment of paddy rice; characterization of final product. 5th International Technical Symposium on Food Processing, Monitoring Technology in Bioprocesses and Food Quality Management. Potsdam, Germany, 2009.
[21] Mounir S, Besombes C, Allaf K. Study, manufacturing, and characterization of expanded granule powder of Apple. Association Française de Séchage pour l'Industrie et l'Agriculture - AFSIA. Lyon, France, 2009.
[22] Al Haddad M, Mounir S, Sobolik V, Allaf K. FRUITS & VEGETABLES DRYING COMBINING HOT AIR, DIC TECHNOLOGY AND MICROWAVES. 5TH ASIA-PACIFIC DRYING CONFERENCE. Hong Kong, 2007.

CHAPTER III.2
COMPARATIVE STUDY OF THE EFFECTS OF DRYING
METHODS ON ANTIOXIDANT ACTIVITY OF DRIED
STRAWBERRY (FRAGARIA VAR. CAMAROSA)
79

Comparative study of the effects of drying methods on antioxidant activity of dried strawberry (Fragaria var. Camarosa)
Maritza ALONZO-MACÍAS1,2, Anaberta CARDADOR-MARTÍNEZ1, Sabah MOUNIR2,3, Gerardo MONTEJANO-GAITÁN1 & Karim ALLAF2
1 Instituto Tecnológico y de Estudios Superiores de Monterrey, Campus Queretaro, Mexico 2 University of La Rochelle-Pole Science and Technology, La Rochelle, France 3 Food Science Department, Faculty of Agriculture, Zagazig University, Egypt
Correspondence: Karim Allaf, University of La Rochelle-Pole Science and Technology, Laboratory of Engineering
Science for Environment (LaSIE FRE 3474 CNRS), Avenue Michel Crépeau, 17042 La Rochelle, France. Tel: +33685816912. E-mail: [email protected]
Received: October XX, 201X Accepted: November XX, 201X Online Published: November XX, 201X
doi:10.5539/ URL: http://dx.doi.org/

Journal of Food Research; Vol. 2, No. 2; 2013 ISSN 1927-0887 E-ISSN 1927-0895
Published by Canadian Center of Science and Education
1
Received: October 29, 2012 Accepted: November 18, 2012 Online Published: February, 2013
doi:10.5539/xxx.v2n2p URL: http://dx.doi.org/10.5539/xxx.v2n2p
Comparative study of the effects of drying methods on antioxidant activity of dried strawberry (Fragaria var. Camarosa)
1. Abstract
Hot air drying (HAD), freeze-drying (FD), and swell-drying (SD, coupling instant controlled pressure drop, DIC, to standard hot air) were applied to strawberries (Fragaria var. Camarosa). The total phenol, total flavonoid, and total anthocyanin contents were evaluated versus the drying methods. The correlations between the bioactive compounds and antioxidant activity were investigated. The obtained results showed that the differences in phenol levels were no quite comparing the three drying techniques; however, great variations were reported for anthocyanin and flavonoid content.
A strong correlation between the antioxidant activity and anthocyanin content was found in SD strawberries. Also, it was observed that saturated steam pressure (P) of DIC texturing operation, had a significant effect on the studied parameters compared to the thermal holding time (t). The optimum conditions of DIC were P=0.35 MPa for t=10 s to obtain the highest levels of phenols, flavonoids, and anthocyanins, as well as antioxidant activity.
Keywords: antioxidant activity, anthocyanins, phenolic compounds, instant controlled pressure drop, drying, strawberry.
2. Introduction
The health benefits resulting from the use of natural products rich in bioactive substances have promoted a growing interest from pharmaceutical, food and cosmetic industries. Strawberries are really attractive by their red color, excellent taste and as source of bioactive phenolic compounds including hydroxycinnamic acids, ellagic acid, ellagitannins, flavan-3-ols, flavonols and anthocyanins (Giampieri, et al., 2012; Oszmiański, Wojdyło, & Kolniak, 2009). Moreover, strawberries are economically and commercially important and widely consumed fresh or in processed forms, such as jams, juices, and jellies by their sweet taste and potential benefits to the health (Giampieri, et al., 2012). And, by their antioxidant activity, they are important in the prevention of certain types of cancers, as well as, anti-inflammatory functions, cardiovascular, obesity and other chronic diseases (Basu, et al., 2009; Crecente-Campo, Nunes-Damaceno, Romero-Rodríguez, & Vázquez-Odériz, 2012; Giampieri, et al., 2012; Hannum, 2004; Olsson, et al., 2004; Oszmiański, et al., 2009). It is established that oxidation processes are involved in various chronic and degenerative diseases and that the intake of chemical constituents with antioxidant activity, found in plants in high concentrations, has beneficial effects on health. Phenolic compounds and anthocyanins, two large and heterogeneous groups of biologically active molecules, are known to be dietary components in fruits and vegetables with antioxidant activities (Panico, et al., 2009). Phenolic compounds present in strawberries are ellagic and p-coumaric acid; flavonoids as quercetin, kaempferol and myricetin. Anthocyanins are a group of phenolic compounds responsible for the red-blue color of many fruits and vegetables. Pelargonidin 3-glucoside, cyaniding 3-glucoside and pelargonidin 3-rutinoside are the main anthocyanins found in strawberries, which are responsible for their bright red color (Böhm, 1994; Crecente-Campo, et al., 2012). These bioactive compounds are of prominent importance; in fact, anthocyanin pigments constitute an integral part of the sensory attributes and contribute directly to the coloration of the strawberries. Anthocyanins were claimed to possess diverse biological properties and therefore, they are considered as the main secondary metabolites with a potential nutritional value. In vitro oxidation assays showed that the antioxidant activity of strawberries has been directly correlated with anthocyanin content in the fruit (Andersen, Fossen, Torskangerpoll,
www.ccsenet.org/jfr Journal of Food Research Vol. 2, No. 2; 2013
2
Fossen, & Hauge, 2004). However, this content is affected by the cultivar, ripening stage, storage conditions and their post-harvest treatment (Crecente-Campo, et al., 2012; Olsson, et al., 2004)
Unfortunately, strawberries postharvest life is relatively short, due to their highly fragile structure and their high rates of respiration (Modise, 2008). At the same time, they are highly susceptible to bruises and fungal attacks (Blanda, et al., 2009). This problem affects also their bioactive compounds.
To extent their shelf life and preserve their bioactive compounds, technologies as hot air drying and freeze-drying were used. Comparing the two processes, freeze-drying is the best method applied in the industry to preserve high-value foods such as coffee, spices, food ingredients and strawberries; however, as it is costly and time consuming process, its applications or uses are limited to high value foods and pharmaceutics (Ratti, 2001). On the other hand, hot air drying is considered as the most ancient process used to preserve foods; it offers dehydrated products that have an extended life, up to a year but, unfortunately, the quality of a conventionally dried product is usually drastically reduced compared to the original foodstuff.
Thus, new trends in drying process are used to improve the quality of dried foods and preserve their nutraceutical value. New technologies, such as swell-drying “SD”; Instant Controlled Pressure Drop “DIC”-assisted hot air drying; can improve the process performances, and the quality attributes of dried foods such as strawberries. SD is revealed by many authors (Albitar, Mounir, Besombes, & Allaf, 2011; Haddad & Allaf, 2007; Kamal, Sobolik, Kristiawan, Mounir, & Allaf, 2008; Louka & Allaf, 2004; Sabah Mounir, Allaf, Mujumdar, & Allaf, 2012; S. Mounir, Besombes, Al-Bitar, & Allaf, 2011). Their work reviewed the effect of DIC on the quality attributes of dried food products and on drying process performance. Furthermore, the SD is largely used at industrial scale to produce swell-dried products (ABCAR-DIC Process, La Rochelle, France).
DIC is a high temperature–short time (HTST) treatment followed by an abrupt pressure drop towards a vacuum crossing the glass transition boundary: the pressure dropping induces an abrupt cooling of treated product preserving the expanded state of the new obtained structure (Sabah Mounir, et al., 2012).
The aim of this study was to compare three processes of drying; swell-drying (SD), freeze-drying (FD), and classical hot air drying (HAD) in terms of quality attributes, including total phenolic content, flavonoid content, total anthocyanin content and the antioxidant activity of dried strawberries.
3. Materials and Methods
3.1. Chemicals and reagents
Cyaniding-3-glucoside; Trolox (6-hydroxy-2,5,7,8-tetramethylchroman-2-carboxylicacid); Gallic acid; Pelargonidin-3-glucoside, which is a hydrophilic analogue of vitamin E; 2,2-Diphenyl-1-picrylhydrazyl (DPPH); and Rutin; were purchased from Sigma Chemical Co., St. Louis, MO, USA. Ethanol and methanol were purchased from J.T. Baker (Deventer, The Netherlands). All other reagents and chemicals of analytical grade were procured from local sources (Queretaro, Mexico) and milli-Q water was used.
3.2. Biological material
The strawberries (Fragaria var. Camarosa) were purchased from Carrefour (La Rochelle, France). They were immediately transported to the laboratory and stored at 5 ºC until the next day. Strawberries were sorted, washed with tap water and cut with kitchen knife into slices of 4-5 mm as thickness. After that, the total quantity was divided in three batches; one for each process; hot air drying (HAD), freeze-drying (FD) and swell-drying (SD).
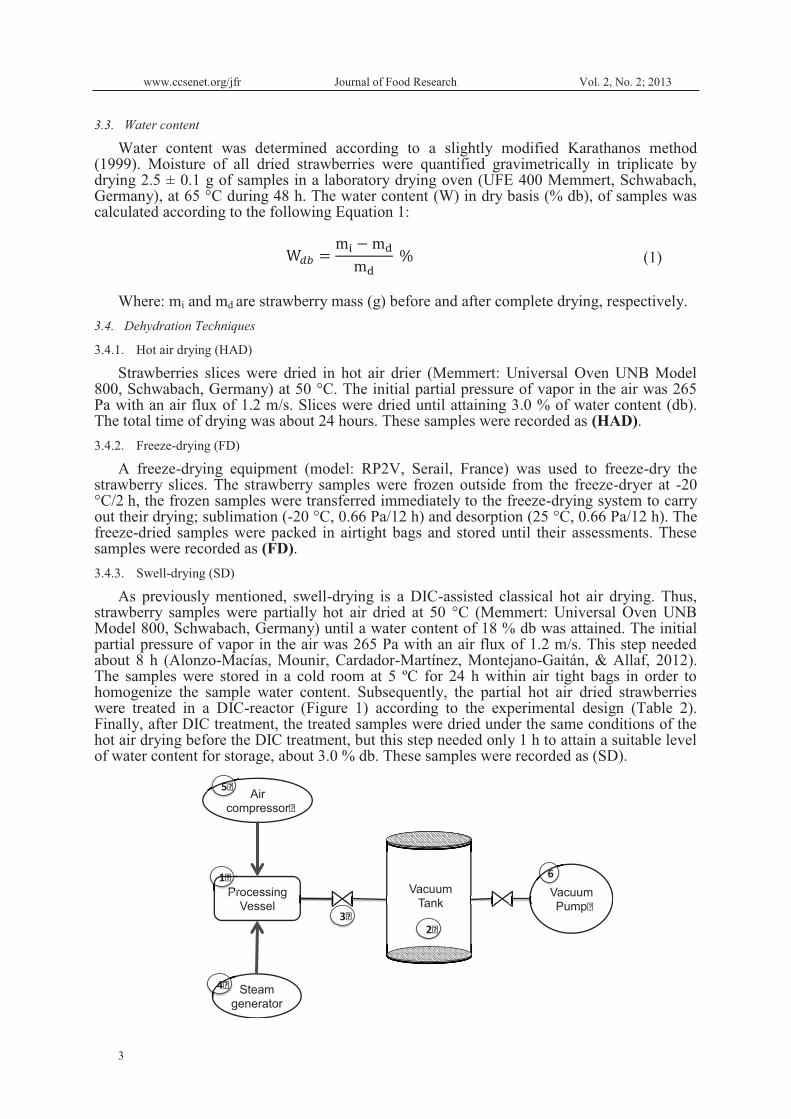
www.ccsenet.org/jfr Journal of Food Research Vol. 2, No. 2; 2013
3
3.3. Water content
Water content was determined according to a slightly modified Karathanos method (1999). Moisture of all dried strawberries were quantified gravimetrically in triplicate by drying 2.5 ± 0.1 g of samples in a laboratory drying oven (UFE 400 Memmert, Schwabach, Germany), at 65 °C during 48 h. The water content (W) in dry basis (% db), of samples was calculated according to the following Equation 1:
(1)
Where: mi and md are strawberry mass (g) before and after complete drying, respectively.
3.4. Dehydration Techniques
3.4.1. Hot air drying (HAD)
Strawberries slices were dried in hot air drier (Memmert: Universal Oven UNB Model 800, Schwabach, Germany) at 50 °C. The initial partial pressure of vapor in the air was 265 Pa with an air flux of 1.2 m/s. Slices were dried until attaining 3.0 % of water content (db). The total time of drying was about 24 hours. These samples were recorded as (HAD).
3.4.2. Freeze-drying (FD)
A freeze-drying equipment (model: RP2V, Serail, France) was used to freeze-dry the strawberry slices. The strawberry samples were frozen outside from the freeze-dryer at -20 °C/2 h, the frozen samples were transferred immediately to the freeze-drying system to carry out their drying; sublimation (-20 °C, 0.66 Pa/12 h) and desorption (25 °C, 0.66 Pa/12 h). The freeze-dried samples were packed in airtight bags and stored until their assessments. These samples were recorded as (FD).
3.4.3. Swell-drying (SD)
As previously mentioned, swell-drying is a DIC-assisted classical hot air drying. Thus, strawberry samples were partially hot air dried at 50 °C (Memmert: Universal Oven UNB Model 800, Schwabach, Germany) until a water content of 18 % db was attained. The initial partial pressure of vapor in the air was 265 Pa with an air flux of 1.2 m/s. This step needed about 8 h (Alonzo-Macías, Mounir, Cardador-Martínez, Montejano-Gaitán, & Allaf, 2012). The samples were stored in a cold room at 5 ºC for 24 h within air tight bags in order to homogenize the sample water content. Subsequently, the partial hot air dried strawberries were treated in a DIC-reactor (Figure 1) according to the experimental design (Table 2). Finally, after DIC treatment, the treated samples were dried under the same conditions of the hot air drying before the DIC treatment, but this step needed only 1 h to attain a suitable level of water content for storage, about 3.0 % db. These samples were recorded as (SD).
Vacuum Pump�
Processing Vessel
Air compressor�
5�
6
PrPr
1�
Steam generator
4�
3�
Vacuum Tank
2�

www.ccsenet.org/jfr Journal of Food Research Vol. 2, No. 2; 2013
4
Figure 1. Schematic diagram of the DIC reactor. 1: Processing vessel; 2: Vacuum tank; 3: Abrupt opening valve;
4: Steam generator; 5: Air compressor 6: Vacuum pump. It can be briefly described as followed: A) The
processing vessel, where samples are placed and treated. B) The vacuum system, which consists mainly of a
vacuum tank with a volume 130 times greater than the processing vessel, and an adequate vacuum pump. The
initial vacuum level was almost maintained at 5 kPa in all the experiments. C) A pneumatic valve that ensures
the connection/disconnection between the vacuum tank and the processing vessel inducing the abrupt pressure
dropping within less than 0.2 s (DP/Dt > 0.5 MPa/s). DIC reactor has been largely described in many scientific
papers (Ben Amor & Allaf, 2009; Haddad & Allaf, 2007; Louka & Allaf, 2004; Sabah Mounir, et al., 2012).
3.5. Samples extraction
The different strawberry samples (0.5 g) were weighted in a 30 mL centrifuge tube, and 10 mL of acidified methanol (1.0 % HCl in methanol, v/v) were added and agitated for 2 h at room temperature in darkness. The sample suspensions were centrifuged at 6000 rpm for 10 min at 4 °C and the supernatants were stored at -20 °C until analysis, the operation was performed in duplicate.
3.5.1. Total phenolic content
Total phenolic content was estimated by using the Folin-Ciocalteu colorimetric method (Singleton, Orthofer, & Lamuela-Raventós, 1999). Briefly, 0.02 mL of the extracts was oxidized with 0.1 mL of 0.5 N Folin-Ciocalteu reagent, and then the reaction was neutralized with 0.3 mL sodium carbonate solution (20 %). The absorbance values were obtained by the resulting blue color measured at 760 nm with a Spectrophotometer (UV-Vis Double Beam UVD-3500, Labomed, Inc. USA) after incubation for 2 h at 25 °C. Quantification was achieved on the basis of a standard curve of Gallic acid from 0 to 500 μg/mL. Results were expressed as mg of Gallic acid per g of dry weight (mg eq. GA/g db).
3.5.2. Flavonoid content
The spectrophotometric assay for the quantitative determination of flavonoid content was determined according to Oomah, Cardador-Martínez, and Loarca-Piña (2005). Briefly, the method consisted of mixing 50 μL of the methanolic extract with 180 μL of distilled water and 20 μL of a solution of 10 g/L 2-aminoethyldiphenylborate in a 96-well microtitration flat-bottom plate. The absorbance of the solution was monitored at 404 nm with a spectrophotometer (xMark Microplate Spectrophotometer, BioRad, Japan). Extract absorption was compared with a Rutin standard at different concentrations ranging from 0 to 200 μg/mL. Flavonoids content was expressed as mg Rutin per g of dry weight (mg eq. Rutin/g db).
3.5.3. Total anthocyanin content
0.2 mL of extract were diluted with 1.8 mL acidified methanol (1.0 % HCl in methanol) and absorbance was taken at 250 nm (Spectro UV-Vis Double Beam. UVD-3500 Labomed, Inc. USA). An acid pH was used to take the anthocyanins to the flavylium ion form, which exhibits coloration, thus to be able to quantify them by spectrophotometry. Total anthocyanins concentration (TAC) was calculated as pelargonidin-3-glucoside according to the Equation 2 (Abdel-Aal & Hucl, 1999):
Where:
TAC: concentration of total anthocyanin content per sample were expressed as mg pelargonidin-3-glucoside equivalent per g of dry weight (mg eq. Pe-3-Gl/g db)
A: absorbance reading,
e: molar absorptivity (pelargonidin-3-glucoside = 15,600 L/ (mol cm)),

www.ccsenet.org/jfr Journal of Food Research Vol. 2, No. 2; 2013
5
Vol: total volume of anthocyanin extract, and
MW: molecular weight of pelargonidin-3-glucoside = 433.2 g/mol
3.5.4. Determination of anthocyanins by HPLC
Strawberry extracts were filtered through a 0.45 μM nylon membrane-filter. HPLC analysis was performed using an Agilent 1200 HPLC system (Agilent Technology 1200 series, Palo Alto, CA), equipped with quaternary pumps, autosampler and a diode array detector. Anthocyanin separation were performed using an Eclipse XDB-C18 column (5 μM, 4.6 mm · 150 mm) at 28 ºC. Mobile phases were constituted of 1.0 % methanol acidified (A) and 5.0 % formic acid (B) at a flow rate of 1 mL/min. The gradient condition started with 20 % A, linearly increased to 85 % A at 10 min, finally it decreased to 20 % A at 15 min. Calibration curves (0-1 mg/mL) were realized to quantify cyanidin-3-glucoside (Cy-3-Gl, mg/g db) and pelargonidin-3-glucoside (Pe-3-Gl, mg/g db).
3.5.5. Determination of antioxidant capacity by DPPH method
Measurement of antioxidant capacity was carried out using 2,2-Diphenyl-1-picrylhydrazyl (DPPH) as a free radical. Reduction of DPPH by an antioxidant or a free radical produces decreased absorbance at 515 nm. 20 μL of the extract were mixed with 200 μL DPPH (125 μM in 80 % methanol). After 90 min, the plate was read at 520 nm in a spectrophotometer and the antioxidant capacity was calculated as a percentage of DPPH discoloration according to Burda and Oleszek (2001). The analysis was performed in triplicate.
3.6. DIC Experimental Design
The operating parameters of DIC treatment in this study were only the saturated steam pressure (MPa) and the thermal holding time (s), while the initial water content (W) of strawberries was maintained constant at 18 % db. Hence, in order to study these parameters on the various response parameters (total phenolic content, flavonoid content, total anthocyanin content, pelargonidin-3-glucoside, cyanidin-3-glucoside and antioxidant activity), a central composite rotatable design was used (Statgraphics, Centurion XV, USA) (Table 1). For the 2 factors, the design resulted in 11 trials; 4 (22) factorial points, 4 axial points to form a central composite design, and 3 center points for replications (Table 2). The ranges and the center point (Table 1) were defined after preliminary trials. The 11 trials were run in random order to minimize the effects of unexpected variability on observed responses due to external factors. The mathematical empirical model applied in this study was:
(3)
Where:
Y: the response, βi, βii, βij: the regression coefficients, Xi and Xj: the independent variables, ε: random error, and i and j: the indices of the factors.
For more understanding and interpreting the results,
· The analysis of variance (ANOVA) was used to determine significant differences between independent variables (p < 0.05),
· Pareto chart was used to identify the impact of variables on various responses. The vertical line in the Pareto chart determines the effects that are statistically significant at the 95 % confidence level,
· Surface response methodology plots to optimize the various responses,
· General trends to analyze various responses behavior in front of variable changes,
· Empirical model coefficients to determine the regression model for each response and R² to accurate fitting models to real data.

www.ccsenet.org/jfr Journal of Food Research Vol. 2, No. 2; 2013
6
Table 1. Coded and real ranges of independent variables used in the 2-variable 5-level rotatable experimental
design
Factor (Coded Level) -a -1 0 1 +a
Processing pressure (MPa) 0.10 0.19 0.35 0.53 0.60
Processing time (s) 10 13 20 27 30
a (axial distance) = , k is the number of experiments of orthogonal desig. In this case, k=2 and a=1.4142.
Table 2. Trials in the experimental design for DIC process
DIC
Run 1 2 3 4 5 6 7 8 9 10 11
Pressure, P (MPa) 0.60 0.35 0.35 0.53 0.53 0.35 0.17 0.17 0.10 0.35 0.35
Time, t (s) 20 30 20 27 13 20 13 27 20 10 20
4. Results and discussion
The present study was carried out to evaluate the antioxidant capacity, total phenolic, total flavonoid, and total anthocyanin contents in strawberries samples dried by different techniques. Hence, the discussion and the interpretation of the results are presented in two parts; a comparison between the different drying techniques (HAD, FD and SD) and, on the other hand, a study of operating parameters of DIC treatment in order to optimize the texturing operation within SD in the light of obtained results.
4.1. Total phenolic content
Table 3 shows the total phenolic content (TPC) in different dried strawberries. The TPC were not quite different in the studied drying methods. The TPC in HAD, FD and SD (DIC 10, 0.35 MPa and 10 s) were 16.18, 18.41, and 14.47 mg eq.GA/g db, respectively. The TPC in FD samples was higher than those in HAD and SD by 12 % and 21 %, respectively, and TPC in SD samples was decreased by 11 % compared to HAD samples. This phenomenon can be explained by the thermal damage of free phenols occurred during the long time of drying in the case of HAD samples and by the thermo-mechanical effects of DIC treatment. Hung and Duy (2012) reported similar behavior in their study, when comparing the effect of drying methods on bioactive compounds in vegetables. They found that the free phenols in freeze-dried vegetables were significantly higher than those in hot air dried vegetables.
Table 3. Bioactive compounds evaluated in SD, HAD and FD strawberries.
Sample Pressure
(MPa)
Time
(s) TPCa FCb TACc Cy-3-Gld Pe-3-Gle
% ARA at 250
μM
DIC 1 0.60 20 17.14 4.15 4.96 0.60 0.92 43.20
DIC 2 0.35 30 16.06 3.19 6.17 1.49 1.99 54.36
DIC 3 0.35 20 14.58 2.93 6.26 1.66 2.29 54.27
DIC 4 0.53 27 16.34 3.58 4.71 0.42 0.62 42.35
DIC 5 0.53 13 16.67 3.28 5.71 1.12 1.73 45.85
DIC 6 0.35 20 14.81 2.86 6.59 1.69 2.38 51.90
DIC 7 0.17 13 13.97 2.79 5.98 2.55 3.35 49.87
DIC 8 0.17 27 15.76 3.25 6.59 2.24 2.99 53.42
DIC 9 0.10 20 14.60 2.70 5.76 2.49 3.68 49.68
DIC 10 0.35 10 14.47 3.01 7.00 2.34 3.07 56.82
DIC 11 0.35 20 16.35 3.06 5.96 1.78 2.43 53.61
www.ccsenet.org/jfr Journal of Food Research Vol. 2, No. 2; 2013
7
HAD
16.18 3.08 6.69 1.58 1.64 51.67
FD
18.41 3.99 8.31 2.06 2.60 51.34
a Total phenolic content (mg eq. GA/g db) b Flavonoid content (mg eq. Rutin/g db)
c Total anthocyanin content (mg eq. Pe-3-Gl/g db)
d Cyanidin-3-glucoside (mg/g db) e Pelargonidin-3-glucoside (mg/g db)
In order to compare the operating parameters of DIC treatment, Figure 2 (a, b) shows the effect of saturated steam pressure (MPa) and thermal holding time (s) on the TPC of SD samples. The highest value of TPC (17.14 mg eq.GA/g db) was verified for samples treated at 0.6 MPa as saturated steam pressure for 20 s. According to obtained results of DIC treatment, the saturated steam pressure had a significant and positive effect on the TPC compared to the thermal holding time. Hence, the higher the saturated steam pressure, the higher the TPC. This behavior is maybe due to the mechanical effect induced by the dropping pressure towards a vacuum, resulting in a broken-down the cell walls and thus the formation of some vacuoles and pores within the product thanks to water autovaporization. Such new structures can increase the availability of the bound phenols and facilitate, subsequently, their extraction; while HAD and FD do not affect phenol-cell wall association (Hung & Duy, 2012). Albitar, et al. (2011) proved that, the increase in phenol availability is dependent not only on the DIC operating parameters, such as saturated steam pressure and processing time, but also the initial water content.
This result is not in contradiction with the previously found, when the different drying methods (HAD, FD and SD) were compared because the DIC is a heat treatment (temperature and time couple treatment). Hence, some of these compounds, as free phenols, were destructed under sever conditions of high temperature treatment (high saturated steam pressure and longtime treatment) before broken-down the cell walls.
The obtained regression model of TPC was as follows with r2 = 82.7 %:

www.ccsenet.org/jfr Journal of Food Research Vol. 2, No. 2; 2013
8
Figure 2. Effects of DIC operating parameters; pressure (MPa) and time (s) on the total phenols content (TPC;
mg eq. GA/g db) of SD strawberries: A) Pareto Chart and B) Response Surface.
4.2. Flavonoid Content
Total flavonoid content (FC) in hot air drying, freeze-drying and swell-drying is listed in Table 3. It was observed that thermal processes had a large influence in flavonoid availability, which depends on the magnitude and duration of drying processes. Flavonoid contents of HAD, FD and SD (0.35 MPa, 10 s) strawberries were 3.08, 3.99 and 3.01 mg eq. Rutin/g db, respectively. There were not significant differences by these treatments with respect to the flavonoids content. However, the slight difference may be due to the thermal degradation of these compounds. Drying processes lead also to flavonoid degradation. The proportion lost depends on the drying method. Freeze-drying is the less aggressive method followed by hot air drying; while microwave and vacuum drying can have an intermediate degradation. (Dong, Ma, Fu, & Guo, 2011; Viña & Chaves, 2008; Zainol, Abdul-Hamid, Bakar, & Dek, 2009; Zhang, Hettiarachchy, Horax, Chen, & Over, 2009).
The impact of DIC operating parameters (pressure and time) on FC is shown in Figure 3 (a, b). Similar behavior in TPC was observed for FC. The saturated steam pressure had a significant effect on the FC compared to the thermal holding time. Hence, the higher the saturated steam pressure, the higher the flavonoid content. At saturated steam pressure of 0.6 MPa during 20 s, the highest value of FC (4.15 mg eq. Rutin/g db) was recorded for treated samples.
P
T
PT
PP
TT
P: Saturated steam pressure (MPa)
T: Processing time (s)
A
Tota
l p
he
no
l co
nte
nt
(mg
eq
. G
A/g
db
)
Saturated steam pressure (MPa)
B

www.ccsenet.org/jfr Journal of Food Research Vol. 2, No. 2; 2013
9
Figure 3. Effects of DIC operating parameters; pressure (MPa) and time (s) on the flavonoid content (FC; mg eq.
Rutin/g db) of SD strawberries: A) Pareto Chart and B) Response Surface
The degradation of flavonoids not only depends on temperature and magnitude of heating; it may depend also on other parameters such as pH, phytochemicals, structure and even the presence or absence of oxygen.
The thermal degradation of HAD products correlates with the slowness of the operation, due to the fact that shrinkage leads to a very low diffusivity. DIC texturing can dramatically increase the diffusivity, reducing the drying time, preserving the natural nutritive value, and, by opening the structure and possibly breaking cell walls, releasing the bound flavonoids and dramatically improving the availability of these compounds (S. Mounir, et al., 2011). As an example, Sabah Mounir, et al. (2012) reported that the amount of quercetin in DIC-treated apple compared to untreated fresh samples was increased by up to 700 %. They obtained similar results with other fruits (e.g., cranberry fruits and seeds, sumac) and vegetables. Furthermore, results for onions proved that the instantaneity of the pressure drop toward a vacuum is an important factor influencing the availability of flavonoids (S. Mounir, et al., 2011).
The obtained regression model of FC was as follows with r2= 85.64 %:
P
PP
T
TT
PT
P: Saturated steam pressure (MPa)
T: Processing time (s)
A
Fla
von
oid
co
nte
nt
(m
g e
q. R
uti
n/g
db
)
Saturated steam pressure (MPa)
B

www.ccsenet.org/jfr Journal of Food Research Vol. 2, No. 2; 2013
10
4.3. Total Anthocyanin Content
The total anthocyanin content (TAC) in dried strawberry was investigated in several drying methods. As reported in Table 3, TAC was higher in the FD samples than HAD and SD samples by 19 % and 16 %, respectively. A slight difference was observed in TAC between HAD and SD, an increase by 4 % in TAC was reported in SD samples compared to HAD samples.
DIC treatment at 0.35 MPa of pressure for 10 s, gave the highest value of TAC, 7.00 Pe-3-Gl/g db. Evaluating the effect of DIC operating parameters on the TAC in SD strawberries, in Figure 4 (a, b) it was observed that the saturated steam pressure had a great influence compared to the thermal holding time. Thus, the higher the saturated steam pressure, the lower the TAC. The negative effect may be due to the thermal degradation of strawberries’ anthocyanins. The highest values of TAC were found in SD samples treated at low pressure (under soft conditions). Ben Amor and Allaf (2009) reported that the yield of Total Monomeric Anthocyanin content (TMA) in dried Malaysian Roselle calyces was improved by up to 135 % under soft conditions of 0.18 MPa as saturated steam pressure during 18 s.
Figure 4. Effects of the saturated steam pressure (MPa) and the thermal treatment time of DIC on the total
anthocyanin content (TAC; mg eq. Pe-3-Gl/g db) of SD strawberries. A) Pareto Chart and B) Response Surface.
The obtained regression model for TAC, with r2= 89.17, was:
PP
P
PT
T
TT P: Saturated steam pressure (MPa)
T: Processing time (s)
A
Tota
l An
tho
cyan
in C
on
ten
t
(m
g eq
. Pe-
3-G
l/g
db)
Saturated steam pressure (MPa)
B

www.ccsenet.org/jfr Journal of Food Research Vol. 2, No. 2; 2013
11
The principal anthocyanins in strawberries are pelargonidin-3-glucoside (Pe-3-Gl) and cyanidin-3-glucoside (Cy-3-Gl) (da Silva, Escribano-Bailón, Pérez Alonso, Rivas-Gonzalo, & Santos-Buelga, 2007; Giampieri, et al., 2012). Pelargonidin-3-glucoside is the major anthocyanin in strawberries independent from genetic and environmental factors and the presence of cyanidin-3-glucoside seems to be constant and in less quantity (Giampieri, et al., 2012; Patras, Brunton, Da Pieve, & Butler, 2009).
Anthocyanins were quantified by HPCL using Cy-3-Gl and Pe-3-Gl standards. The levels of Cy-3-Gl and Pe-3-Gl are listed in Table 3. It was found that SD strawberries samples had the highest levels of Cy-3-Gl and Pe-3-GI compared to HAD and FD. The level of Cy-3-Gl in SD samples was increased by 32 % and 11 % compared to HAD and FD samples, respectively; while Pe-3-GI was increased by 47 % and 15 % compared to HAD and FD samples, respectively. The highest level of these anthocyanin types was obtained at DIC texturing parameters of 0.35 MPa and 0.10 MPa as saturated steam pressure for 10 s and 20 s as thermal holding time, respectively.
Although, the highest levels of Cy-3-Gl and Pe-3-Gl were obtained in SD strawberry samples, the saturated steam pressure had a significant effect on strawberry’s content of these compounds compared to the thermal holding time. The higher the saturated steam pressure, the lower the levels of Cy-3-Gl (Figure 5; a, b) and Pe-3-Gl (Figure 6; a, b).This phenomenon can be explained by the thermal destruction of these compounds as a result of increasing the saturated steam pressure during the treatment. Therefore, the highest levels were obtained under soft conditions (low saturated steam pressure and short time treatment) as early mentioned.
P
T
PP
TT
PT
P: Saturated steam pressure (MPa)
T: Processing time (s)
A
Cya
nid
in-3
-glu
cosi
de
(mg
/g d
b)
Saturated steam pressure (MPa)
B

www.ccsenet.org/jfr Journal of Food Research Vol. 2, No. 2; 2013
12
Figure 5. Effects of DIC operating parameters (pressure; MPa and time; s) on the cyanidin-3-glucoside (Cy-3-Gl;
mg/g db) of SD strawberries. A) Pareto Chart and B) Response Surface.
Figure 6. Effects of DIC parameters (saturated steam pressure; MPa and thermal treatment time; s) on the
pelargonidin-3-glucoside (Pe-3-Gl; mg/g db) of SD strawberries. A) Pareto Chart and B) Response Surface.
The obtained regression models for Cy-3-Gl and Pe-3-Gl were as follows with r2= 98.15 and 98.60, respectively:
4.4. Antioxidant capacity
The antioxidant capacity of fruits is closely correlated to the presence of efficient oxygen radical scavengers, such as vitamin C and phenolic compounds (Giampieri, et al., 2012). Strawberries have a greater antioxidant capacity (2 to 11-fold) than apples, peaches, pears, grapes, tomatoes, oranges, or kiwi fruit (Giampieri, et al., 2012; Scalzo, Politi, Pellegrini, Mezzetti, & Battino, 2005; H. Wang, Cao, & Prior, 1996). In the present study, scavenging capacity was evaluated as percent discoloration of a free radical DPPH solution and expressed as antiradical activity (% ARA). The concentration tested for the different extracts in this essay was 250 μM (μM equivalent of Gallic acid).
P
T
PT
TT
PP
P: Saturated steam pressure (MPa)
T: Processing time (s)
A
Pe
larg
on
idin
-3-g
luco
sid
e
(mg
/g d
b)
Saturated steam pressure (MPa)
B

www.ccsenet.org/jfr Journal of Food Research Vol. 2, No. 2; 2013
13
As shown in Table 3, there was no significant difference in % ARA of HAD and FD samples. Whereas, it is increased by 9 % and 10 % in SD samples (56.82 %) compared to HAD (51.67 %) and FD (51.34 %) samples respectively.
The effect of saturated steam pressure and thermal holding time on % ARA was illustrated in Figure 7 (a, b). The saturated steam pressure had a negative effect on the % ARA; it means that in SD samples, the higher the saturated steam pressure, the lower the % ARA. However, the highest % ARA was found in SD strawberries samples treated under the softest conditions (lowest saturated steam pressure for shortest time treatment). For example, the highest level of % ARA was found at 56.82 % for SD samples treated at 0.35 MPa for 10 s.
Figure 7. Effects of DIC operating parameters; pressure (MPa) and time (s) on the antioxidant activity (% ARA)
of SD strawberries: A) Pareto Chart and B) Response Surface
It is difficult to explain the evolution of the antioxidant activity according to heat process conditions. Too numerous factors are implied in its evolution. A decrease in phenolic content does not lead systematically to a decrease of the antioxidant activity. Indeed, with lower phenolic content, one can also have a higher antioxidant activity (Buchner, Krumbein, Rohn, & Kroh, 2006; Murakami, Yamaguchi, Takamura, & Atoba, 2004). Thus, an increase of antioxidant activity is noticed in many studies using thermal processes (Chandrasekara & Shahidi, 2011; Hartmann, Patz, Andlauer, Dietrich, & Ludwig, 2008; Sharma & Gujral, 2011). However, interactions are important phenomena, which act on the antioxidant activity of molecules. Depending on this environment, synergies between antioxidant compounds and the food matrix can occur (S. Wang, Meckling, Marcone, Kakuda, & Tsao, 2011). In some cases, the antioxidant capacity of flavonoids in a food matrix is enhanced (Freeman, Eggett, &
PP
P
PT
T
TT
P: Saturated steam pressure (MPa)
T: Processing time (s)
A
% A
RA
Saturated steam pressure (MPa)
B
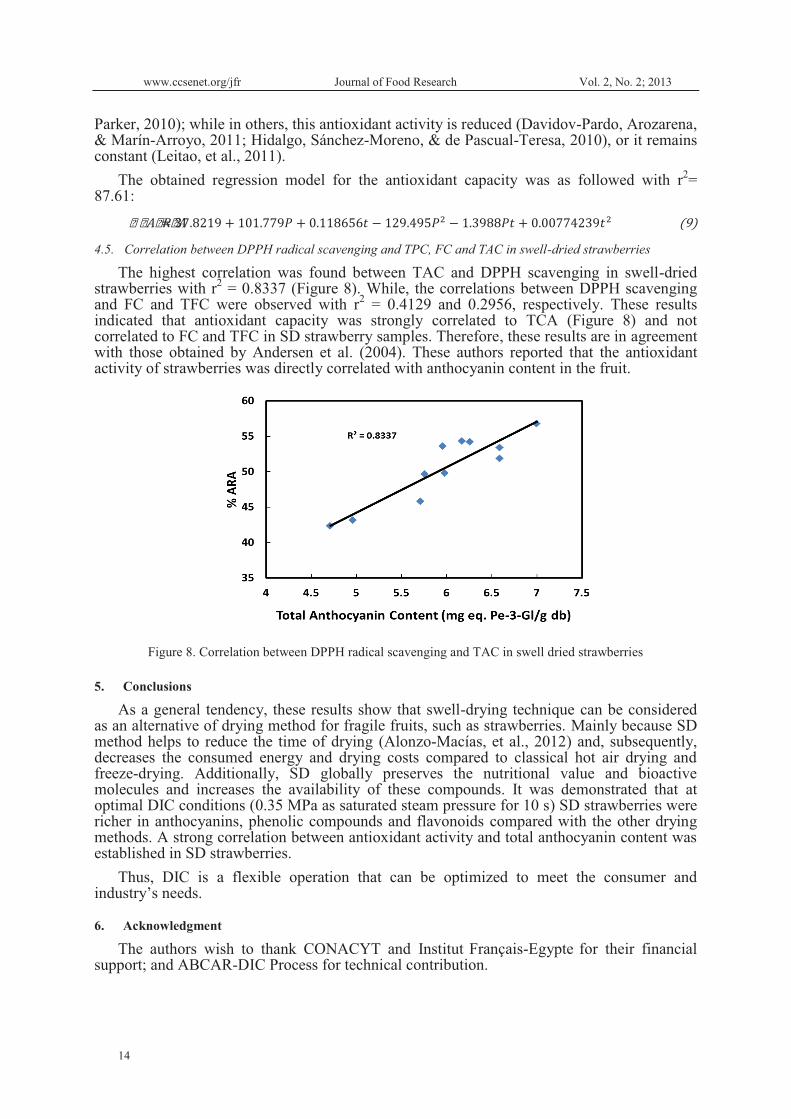
www.ccsenet.org/jfr Journal of Food Research Vol. 2, No. 2; 2013
14
Parker, 2010); while in others, this antioxidant activity is reduced (Davidov-Pardo, Arozarena, & Marín-Arroyo, 2011; Hidalgo, Sánchez-Moreno, & de Pascual-Teresa, 2010), or it remains constant (Leitao, et al., 2011).
The obtained regression model for the antioxidant capacity was as followed with r2= 87.61:
4.5. Correlation between DPPH radical scavenging and TPC, FC and TAC in swell-dried strawberries
The highest correlation was found between TAC and DPPH scavenging in swell-dried strawberries with r2 = 0.8337 (Figure 8). While, the correlations between DPPH scavenging and FC and TFC were observed with r2 = 0.4129 and 0.2956, respectively. These results indicated that antioxidant capacity was strongly correlated to TCA (Figure 8) and not correlated to FC and TFC in SD strawberry samples. Therefore, these results are in agreement with those obtained by Andersen et al. (2004). These authors reported that the antioxidant activity of strawberries was directly correlated with anthocyanin content in the fruit.
Figure 8. Correlation between DPPH radical scavenging and TAC in swell dried strawberries
5. Conclusions
As a general tendency, these results show that swell-drying technique can be considered as an alternative of drying method for fragile fruits, such as strawberries. Mainly because SD method helps to reduce the time of drying (Alonzo-Macías, et al., 2012) and, subsequently, decreases the consumed energy and drying costs compared to classical hot air drying and freeze-drying. Additionally, SD globally preserves the nutritional value and bioactive molecules and increases the availability of these compounds. It was demonstrated that at optimal DIC conditions (0.35 MPa as saturated steam pressure for 10 s) SD strawberries were richer in anthocyanins, phenolic compounds and flavonoids compared with the other drying methods. A strong correlation between antioxidant activity and total anthocyanin content was established in SD strawberries.
Thus, DIC is a flexible operation that can be optimized to meet the consumer and industry’s needs.
6. Acknowledgment
The authors wish to thank CONACYT and Institut Français-Egypte for their financial support; and ABCAR-DIC Process for technical contribution.

www.ccsenet.org/jfr Journal of Food Research Vol. 2, No. 2; 2013
15
References
Abdel-Aal, E. S. M., & Hucl, P. (1999). A Rapid Method for Quantifying Total Anthocyanins in Blue Aleurone and Purple Pericarp Wheats. Cereal Chemistry Journal, 76(3), 350-354. http://dx.doi.org/10.1094/CCHEM.1999.76.3.350
Albitar, N., Mounir, S., Besombes, C., & Allaf, K. (2011). Improving the Drying of Onion Using the Instant Controlled Pressure Drop Technology. Drying Technology, 29(9), 993-1001. http://dx.doi.org/10.1080/07373937.2010.507912
Alonzo-Macías, M., Mounir, S., Cardador-Martínez, A., Montejano-Gaitán, J. G., & Allaf, K. (2012). Comparative Study of Various Drying Processes at Physical and Chemical Properties of Strawberries (Fragaria var. Camarosa). Procedia Engineering, 42(0), 267-282. http://dx.doi.org/10.1016/j.proeng.2012.07.418
Andersen, Ø. M., Fossen, T., Torskangerpoll, K., Fossen, A., & Hauge, U. (2004). Anthocyanin from strawberry (Fragaria ananassa) with the novel aglycone, 5-carboxypyranopelargonidin. Phytochemistry, 65(4), 405-410. http://dx.doi.org/10.1016/j.phytochem.2003.10.014
Basu, A., Wilkinson, M., Penugonda, K., Simmons, B., Betts, N., & Lyons, T. (2009). Freeze-dried strawberry powder improves lipid profile and lipid peroxidation in women with metabolic syndrome: baseline and post intervention effects. Nutrition Journal, 8(1), 1-7. http://dx.doi.org/10.1186/1475-2891-8-43
Ben Amor, B., & Allaf, K. (2009). Impact of texturing using instant pressure drop treatment prior to solvent extraction of anthocyanins from Malaysian Roselle (Hibiscus sabdariffa). Food Chemistry, 115(3), 820-825. http://dx.doi.org/10.1016/j.foodchem.2008.12.094
Blanda, G., Cerretani, L., Cardinali, A., Barbieri, S., Bendini, A., & Lercker, G. (2009). Osmotic dehydrofreezing of strawberries: Polyphenolic content, volatile profile and consumer acceptance. LWT - Food Science and Technology, 42(1), 30-36. http://dx.doi.org/10.1016/j.lwt.2008.07.002
Böhm, H. (1994). G. Mazza und E. Miniati: Anthocyanins in Fruits, Vegetables and Grains. 362 Seiten, zahlr. Abb. und Tab. CRC Press, Boca Raton, Ann Arbor, London, Tokyo 1993. Preis: 144.— £. Food / Nahrung, 38(3), 343-343. http://dx.doi.org/10.1002/food.19940380317
Buchner, N., Krumbein, A., Rohn, S., & Kroh, L. W. (2006). Effect of thermal processing on the flavonols rutin and quercetin. Rapid Communications in Mass Spectrometry, 20(21), 3229-3235. http://dx.doi.org/10.1002/rcm.2720
Burda, S., & Oleszek, W. (2001). Antioxidant and Antiradical Activities of Flavonoids. Journal of Agricultural and Food Chemistry, 49(6), 2774-2779. http://dx.doi.org/10.1021/jf001413m
Chandrasekara, N., & Shahidi, F. (2011). Effect of Roasting on Phenolic Content and Antioxidant Activities of Whole Cashew Nuts, Kernels, and Testa. Journal of Agricultural and Food Chemistry, 59(9), 5006-5014. http://dx.doi.org/10.1021/jf2000772
Crecente-Campo, J., Nunes-Damaceno, M., Romero-Rodríguez, M. A., & Vázquez-Odériz, M. L. (2012). Color, anthocyanin pigment, ascorbic acid and total phenolic compound determination in organic versus conventional strawberries (Fragaria x ananassa Duch, cv Selva). Journal of Food Composition and Analysis(0). http://dx.doi.org/10.1016/j.jfca.2012.07.004
da Silva, F. L., Escribano-Bailón, M. T., Pérez Alonso, J. J., Rivas-Gonzalo, J. C., & Santos-Buelga, C. (2007). Anthocyanin pigments in strawberry. LWT - Food Science and Technology, 40(2), 374-382. http://dx.doi.org/10.1016/j.lwt.2005.09.018
www.ccsenet.org/jfr Journal of Food Research Vol. 2, No. 2; 2013
16
Davidov-Pardo, G., Arozarena, I., & Marín-Arroyo, M. (2011). Stability of polyphenolic extracts from grape seeds after thermal treatments. European Food Research and Technology, 232(2), 211-220. http://dx.doi.org/10.1007/s00217-010-1377-5
Dong, J., Ma, X., Fu, Z., & Guo, Y. (2011). Effects of microwave drying on the contents of functional constituents of Eucommia ulmoides flower tea. Industrial Crops and Products, 34(1), 1102-1110. http://dx.doi.org/10.1016/j.indcrop.2011.03.026
Freeman, B. L., Eggett, D. L., & Parker, T. L. (2010). Synergistic and Antagonistic Interactions of Phenolic Compounds Found in Navel Oranges. Journal of Food Science, 75(6), C570-C576. http://dx.doi.org/10.1111/j.1750-3841.2010.01717.x
Giampieri, F., Tulipani, S., Alvarez-Suarez, J. M., Quiles, J. L., Mezzetti, B., & Battino, M. (2012). The strawberry: Composition, nutritional quality, and impact on human health. Nutrition, 28(1), 9-19. http://dx.doi.org/10.1016/j.nut.2011.08.009
Haddad, J., & Allaf, K. (2007). A study of the impact of instantaneous controlled pressure drop on the trypsin inhibitors of soybean. Journal of Food Engineering, 79(1), 353-357. http://dx.doi.org/10.1016/j.jfoodeng.2006.01.066
Hannum, S. M. (2004). Potential Impact of Strawberries on Human Health: A Review of the Science. Critical Reviews in Food Science and Nutrition, 44(1), 1-17. http://dx.doi.org/10.1080/10408690490263756
Hartmann, A., Patz, C.-D., Andlauer, W., Dietrich, H., & Ludwig, M. (2008). Influence of Processing on Quality Parameters of Strawberries. Journal of Agricultural and Food Chemistry, 56(20), 9484-9489. http://dx.doi.org/10.1021/jf801555q
Hidalgo, M., Sánchez-Moreno, C., & de Pascual-Teresa, S. (2010). Flavonoid–flavonoid interaction and its effect on their antioxidant activity. Food Chemistry, 121(3), 691-696. http://dx.doi.org/10.1016/j.foodchem.2009.12.097
Hung, P. V., & Duy, T. L. (2012). Effects of drying methods on bioactive compounds of vegetables and correlation between bioactive compounds and their antioxidants. International Food Research Journal, 19(1), 327-332.
Kamal, I. M., Sobolik, V., Kristiawan, M., Mounir, S. M., & Allaf, K. (2008). Structure expansion of green coffee beans using instantaneous controlled pressure drop process. Innovative Food Science & Emerging Technologies, 9(4), 534-541. http://dx.doi.org/10.1016/j.ifset.2008.01.004
Karathanos, V. T. (1999). Determination of water content of dried fruits by drying kinetics. Journal of Food Engineering, 39(4), 337-344. http://dx.doi.org/10.1016/s0260-8774(98)00132-0
Leitao, C. l., Marchioni, E., Bergaentzlé, M., Zhao, M., Didierjean, L., Taidi, B., & Ennahar, S. d. (2011). Effects of Processing Steps on the Phenolic Content and Antioxidant Activity of Beer. Journal of Agricultural and Food Chemistry, 59(4), 1249-1255. http://dx.doi.org/10.1021/jf104094c
Louka, N., & Allaf, K. (2004). Expansion ratio and color improvement of dried vegetables texturized by a new process “Controlled Sudden Decompression to the vacuum”: Application to potatoes, carrots and onions. Journal of Food Engineering, 65(2), 233-243. http://dx.doi.org/10.1016/j.jfoodeng.2004.01.020
Modise, D. M. (2008). Does freezing and thawing affect the volatile profile of strawberry fruit (Fragaria x ananassa Duch.)? Postharvest Biology and Technology, 50(1), 25-30. http://dx.doi.org/10.1016/j.postharvbio.2008.03.009
Mounir, S., Allaf, T., Mujumdar, A. S., & Allaf, K. (2012). Swell Drying: Coupling Instant Controlled Pressure Drop DIC to Standard Convection Drying Processes to Intensify Transfer Phenomena and Improve Quality—An Overview. Drying Technology, 30(14), 1508-1531. http://dx.doi.org/10.1080/07373937.2012.693145

www.ccsenet.org/jfr Journal of Food Research Vol. 2, No. 2; 2013
17
Mounir, S., Besombes, C., Al-Bitar, N., & Allaf, K. (2011). Study of Instant Controlled Pressure Drop DIC Treatment in Manufacturing Snack and Expanded Granule Powder of Apple and Onion. Drying Technology, 29(3), 331-341. http://dx.doi.org/10.1080/07373937.2010.491585
Murakami, M., Yamaguchi, T., Takamura, H., & Atoba, T. M. (2004). Effects of Thermal Treatment on Radical-scavenging Activity of Single and Mixed Polyphenolic Compounds. Journal of Food Science, 69(1), FCT7-FCT10. http://dx.doi.org/10.1111/j.1365-2621.2004.tb17848.x
Olsson, M. E., Ekvall, J., Gustavsson, K.-E., Nilsson, J., Pillai, D., Sjöholm, I., Svensson, U., Åkesson, B., & Nyman, M. G. L. (2004). Antioxidants, Low Molecular Weight Carbohydrates, and Total Antioxidant Capacity in Strawberries (Fragaria × ananassa): Effects of Cultivar, Ripening, and Storage. Journal of Agricultural and Food Chemistry, 52(9), 2490-2498. http://dx.doi.org/10.1021/jf030461e
Oomah, B. D., Cardador-Martínez, A., & Loarca-Piña, G. (2005). Phenolics and antioxidative activities in common beans (Phaseolus vulgaris L). Journal of the Science of Food and Agriculture, 85(6), 935-942. http://dx.doi.org/10.1002/jsfa.2019
Oszmiański, J., Wojdyło, A., & Kolniak, J. (2009). Effect of l-ascorbic acid, sugar, pectin and freeze–thaw treatment on polyphenol content of frozen strawberries. LWT - Food Science and Technology, 42(2), 581-586. http://dx.doi.org/10.1016/j.lwt.2008.07.009
Panico, A. M., Garufi, F., Nitto, S., Di Mauro, R., Longhitano, R. C., Magrì, G., Catalfo, A., Serrentino, M. E., & De Guidi, G. (2009). Antioxidant activity and phenolic content of strawberry genotypes from Fragaria x ananassa. Pharmaceutical Biology, 47(3), 203-208. http://dx.doi.org/10.1080/13880200802462337
Patras, A., Brunton, N. P., Da Pieve, S., & Butler, F. (2009). Impact of high pressure processing on total antioxidant activity, phenolic, ascorbic acid, anthocyanin content and colour of strawberry and blackberry purées. Innovative Food Science & Emerging Technologies, 10(3), 308-313. http://dx.doi.org/10.1016/j.ifset.2008.12.004
Ratti, C. (2001). Hot air and freeze-drying of high-value foods: a review. Journal of Food Engineering, 49(4), 311-319. http://dx.doi.org/10.1016/S0260-8774(00)00228-4
Scalzo, J., Politi, A., Pellegrini, N., Mezzetti, B., & Battino, M. (2005). Plant genotype affects total antioxidant capacity and phenolic contents in fruit. Nutrition, 21(2), 207-213. http://dx.doi.org/10.1016/j.nut.2004.03.025
Sharma, P., & Gujral, H. S. (2011). Effect of sand roasting and microwave cooking on antioxidant activity of barley. Food Research International, 44(1), 235-240. http://dx.doi.org/10.1016/j.foodres.2010.10.030
Singleton, V. L., Orthofer, R., & Lamuela-Raventós, R. M. (1999). Analysis of total phenols and other oxidation substrates and antioxidants by means of folin-ciocalteu reagent. In P. Lester (Ed.), Methods in Enzymology, vol. Volume 299 (pp. 152-178): Academic Press.
Viña, S. Z., & Chaves, A. R. (2008). Effect of heat treatment and refrigerated storage on antioxidant properties of pre-cut celery (Apium graveolens L.). International Journal of Food Science & Technology, 43(1), 44-51. http://dx.doi.org/10.1111/j.1365-2621.2006.01380.x
Wang, H., Cao, G., & Prior, R. L. (1996). Total Antioxidant Capacity of Fruits. Journal of Agricultural and Food Chemistry, 44(3), 701-705. http://dx.doi.org/10.1021/jf950579y
Wang, S., Meckling, K. A., Marcone, M. F., Kakuda, Y., & Tsao, R. (2011). Synergistic, Additive, and Antagonistic Effects of Food Mixtures on Total Antioxidant Capacities. Journal of Agricultural and Food Chemistry, 59(3), 960-968. http://dx.doi.org/10.1021/jf1040977

www.ccsenet.org/jfr Journal of Food Research Vol. 2, No. 2; 2013
18
Zainol, M. M., Abdul-Hamid, A., Bakar, F. A., & Dek, S. P. (2009). Effect of different drying methods on the degradation of selected flavonoids in Centella asiatica. International Food Research Journal, 16(4), 531-537.
Zhang, M., Hettiarachchy, N. S., Horax, R., Chen, P., & Over, K. F. (2009). Effect of Maturity Stages and Drying Methods on the Retention of Selected Nutrients and Phytochemicals in Bitter Melon (Momordica charantia) Leaf. Journal of Food Science, 74(6), C441-C448. http://dx.doi.org/10.1111/j.1750-3841.2009.01222.x

CHAPTER III.3
TEXTURE AND STRUCTURE ANALYSIS OF DRYING
STRAWBERRY (FRAGARIA VAR. CAMAROSA) BY
INSTANT CONTROLLED PRESSURE DROP
99

1
TEXTURE AND STRUCTURE ANALYSIS OF DRYING STRAWBERRY
(Fragaria var. Camarosa) BY INSTANT CONTROLLED PRESSURE DROP
Alonzo-Macías Maritza1,2, Montejano-Gaitán Gerardo2, Allaf Karim1
1. University of La Rochelle, Pole Science and Technology, Laboratory Engineering Science for Environment, (LaSIE FRE 3474 CNRS), Avenue Michel Crépeau, 17042, La Rochelle, France.
2. Instituto Tecnológico y de Estudios Superiores de Monterrey, Campus Queretaro. Epigmenio González 500, Fracc. San Pablo 76130, Queretaro, Mexico.
Correspondance: E-mail: [email protected]
ABSTRACT
The aim of this study was to evaluate the effect of hot air drying (HAD), freeze-drying (FD) and swell drying (SD, is a coupling of hot air drying to instant controlled pressure drop, DIC) on the strawberry (Fragaria var. Camarosa) to compare and to contrast its quality in terms of texture parameters as crunchy and crispy features, the expansion ratios and the microstructure’s modification. The obtained results showed that SD strawberry had a significant swelled structure and high crispness behavior. Also, its relative expansion ratio increased thrice more than HAD samples. Moreover, it was observed that saturated steam pressure (P) of DIC texturing operation compared to the thermal holding time (t), had a significant effect on the maximum penetration distance (Xmax) and the average of micro-ruptures force (f) on crunchiness and crispness, respectively. Hence, these structural changes provide a versatile swell-dried strawberry as highly-functional snack that was able to be evaluated instrumentally by puncture test.
Keywords: crunchy, crispy, texture, instant controlled pressure drop, expansion ratio,
strawberry, puncture test
NOMENCLATURE
HAD Hot Air Drying
FD Freeze-Drying
SD Swell-Drying
db Dry-basis
mi Material weight before (g)
md Material weight after drying (g)
Fmax Maximum penetration force (N)
Xmax Maximum penetration distance (mm)
Wmax Total work at Xmax
<F> Average puncturing force (N)
n Total number of peaks
N Spatial frequency of structural micro-ruptures (m-1)
f Average micro-ruptures force (N)

2
wrupture Average work for micro-ruptures
DX Penetration distance for each micro-rupture peak (mm)
DF Individual force drops for each micro-rupture peak (N)
eabsolute Absolute expansion ratio
erelative Relative expansion ratio
rintrinsic Density intrinsic (g/cm3)
rspecific Density specific (g/cm3)
rsand Density of sand (g/cm3)
msample mass of sample (g)
msand mass of sand (g)
ms,1 mass initial of sand (g)
ms,2 mass final of sand (g)
INTRODUCTION
From commercial point of view, strawberry is widely consumed fresh or in processed forms. In addition, strawberry consumption is recognized by its potential benefits in the human health, thanks to bioactive phenolic compounds (Oszmiański et al., 2009; Giampieri et al., 2012). Also, it has a very soft and fragile texture, which tends to disintegrate when are incorporated, in fresh form, into food such as yoghurts, ice creams as well as other processed products. Food industry, commonly use strawberry in dried form to preserve it and to handle it easily as an ingredient. Up to now, solar drying, hot air drying, freeze-drying and vacuum drying are the conventional methods used to process fruits and vegetables. However, they present some disadvantage for the quality product, as deterioration of significant bioactive compounds and structural textural damages. Indeed the shrinkage of product is usually produced by very long time exposure of hot air drying. In addition, the difficulties in processing, as grinding and rehydration are barriers to adopt hot air process for a large range of fruit and vegetable (Mounir et al., 2012). Furthermore, freeze-drying has high cost manufacturing, mainly due to high energy consumption coupled with loss of flavor and color, which greatly reduces its utilization (Ratti, 2001).
A new drying operation has been proposed as an alternative to improve: a) the drying process performance, b) the intensification of the texture and the quality attributes of dried foods, and c) to reduce the energy consumption that directly impacts in the manufacturing cost. It also has the ability to handle ranges of food products, regardless of their sensitivity to heat (e.g. strawberry, cranberry, blackberry, guava, mango, onion, carrot, pepper, potato, apple, etc.) (Albitar et al., 2011; Mounir et al., 2011; Alonzo-Macías et al., 2012; Mounir et al., 2012; Téllez-Pérez et al., 2012). This technology is the instant controlled pressure drop, called, the Détente Instantanée Contrôlée (DIC).
It was defined in 1988 (Allaf and Vidal) as a high temperature short time (HTST) treatment followed by an abrupt pressure drop towards a vacuum (pressure drop speed higher than 0.5 MPa/s). DIC-assisted hot air drying is a texturing stage between pre and final hot air drying operation. This coupling is better known as swell-drying (Kamal et al., 2008; Albitar et al.,

3
2011; Mounir et al., 2011; Alonzo-Macías et al., 2012). Therefore, the swell-drying products have a controlled texture expansion to improve the quality product and the physical properties. This texture change results in higher porosity, as well as the increases of the specific surface area and reduces the diffusion resistance of moisture during the final dehydration step (Mounir et al., 2012). Moreover, this structural change provides a versatile function in the dried foods, producing the "snacking". But it could be considered as a highly-functional snack, due to its preservation of vitamins, bioactive compounds, color and flavor.
However, texture is a very important feature of all kinds of foods that impact directly in the consumer acceptability. More specifically, texture has a specific importance in such a snacking. Texture is primarily the response of tactile senses to physical stimuli that results from contact between some part of the body and the food (Bourne, 2002a). The cellular structure of food materials, in both macro (porosity and relative density) and micro (cell wall thickness, cell diameter, and their distributions) scales. It also influences in the mechanical properties (Sozer et al., 2011). The most important characteristics of dry cellular materials, which determine their mechanical behavior are the volume fraction of air, the mechanical properties and the structure of the solid matrix, as well as having closed or open cells (Van Vliet and Primo-Martín, 2011).
In the case of the snack products obtained by drying processes of fruits and vegetables, is proposed that crunchiness and crispiness are the textural attributes that better describe their quality and even freshness (Luyten et al., 2004). These features, as well as hardness, are likely the most important texture attributes of hard solid products (i.e. dry cellular materials). They are related to the fracture properties of food materials. And, they belong to the most frequently used texture descriptors in the United States, Japan, France, Austria… (Bourne, 2002a; Roudaut et al., 2002; Nishinari et al., 2008; Saeleaw and Schleining, 2011; Van Vliet and Primo-Martín, 2011). In general, both crispy and crunchy food products are brittle products, which mean absence of plastic behavior; only elastic behavior till rupture exists. They relatively easily break producing a sharp sound (Al Chakra et al., 1996; Luyten et al., 2004; Saeleaw and Schleining, 2011). The distinction between crispy and crunchy features is not so clear. Indeed, different works suggest that crispy and crunchy refer to different concepts (Table 1).
And the question is still open (Roudaut et al., 2002). The definitions given varied between different studies and likely between countries and products (Roudaut et al., 2002; Luyten et
al., 2004; Nishinari et al., 2008). Sometimes, the panelists as well as consumers found it very difficult to distinguish between crispy and crunchy terms and needed constant probing, However, all insisted that they could perceive a difference between the two, although struggling to describe this difference, indicating that it was only slight (Saeleaw and Schleining, 2011).
By this research, crunchiness and crispness were defined according to French language and culture. Crunchiness “croquant” is defined as linear elastic behavior till the complete fracture (brittle; e.g. hot air dried products, almonds, …). On the other hand, crispness “croustillant” is understood as the same but small continuous linear elastic behavior till the successive fractures during chewing (e.g. swell-drying and freeze-drying products, biscuits…). At the same time, to carry out measurements of the physical aspects of texture perception in foods, different methods have been proposed. They involve two main categories: sensory and instrumental analysis. These last measurements include mechanical measurements (e.g. compression, penetration), and acoustical procedures (Roudaut et al., 2002; Van Vliet and
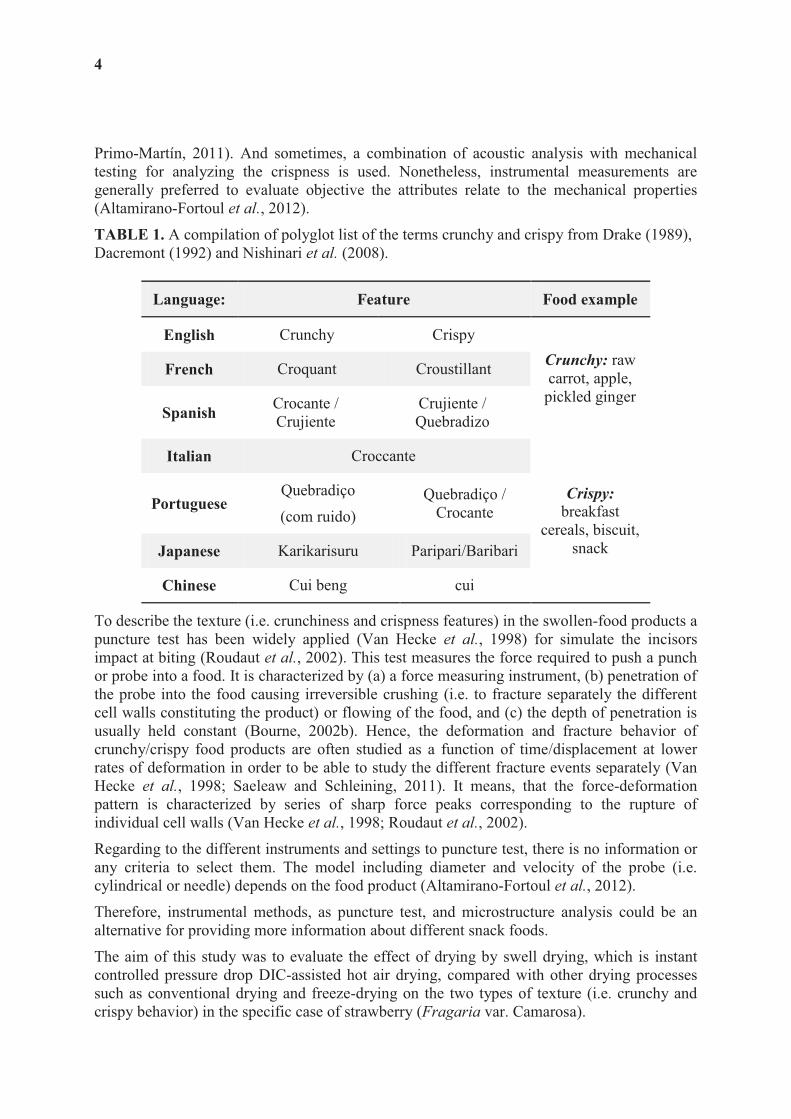
4
Primo-Martín, 2011). And sometimes, a combination of acoustic analysis with mechanical testing for analyzing the crispness is used. Nonetheless, instrumental measurements are generally preferred to evaluate objective the attributes relate to the mechanical properties (Altamirano-Fortoul et al., 2012).
TABLE 1. A compilation of polyglot list of the terms crunchy and crispy from Drake (1989), Dacremont (1992) and Nishinari et al. (2008).
Language: Feature Food example
English Crunchy Crispy
Crunchy: raw carrot, apple,
pickled ginger
French Croquant Croustillant
Spanish Crocante / Crujiente
Crujiente / Quebradizo
Italian Croccante
Crispy: breakfast
cereals, biscuit, snack
Portuguese Quebradiço
(com ruido)
Quebradiço / Crocante
Japanese Karikarisuru Paripari/Baribari
Chinese Cui beng cui
To describe the texture (i.e. crunchiness and crispness features) in the swollen-food products a puncture test has been widely applied (Van Hecke et al., 1998) for simulate the incisors impact at biting (Roudaut et al., 2002). This test measures the force required to push a punch or probe into a food. It is characterized by (a) a force measuring instrument, (b) penetration of the probe into the food causing irreversible crushing (i.e. to fracture separately the different cell walls constituting the product) or flowing of the food, and (c) the depth of penetration is usually held constant (Bourne, 2002b). Hence, the deformation and fracture behavior of crunchy/crispy food products are often studied as a function of time/displacement at lower rates of deformation in order to be able to study the different fracture events separately (Van Hecke et al., 1998; Saeleaw and Schleining, 2011). It means, that the force-deformation pattern is characterized by series of sharp force peaks corresponding to the rupture of individual cell walls (Van Hecke et al., 1998; Roudaut et al., 2002).
Regarding to the different instruments and settings to puncture test, there is no information or any criteria to select them. The model including diameter and velocity of the probe (i.e. cylindrical or needle) depends on the food product (Altamirano-Fortoul et al., 2012).
Therefore, instrumental methods, as puncture test, and microstructure analysis could be an alternative for providing more information about different snack foods.
The aim of this study was to evaluate the effect of drying by swell drying, which is instant controlled pressure drop DIC-assisted hot air drying, compared with other drying processes such as conventional drying and freeze-drying on the two types of texture (i.e. crunchy and crispy behavior) in the specific case of strawberry (Fragaria var. Camarosa).
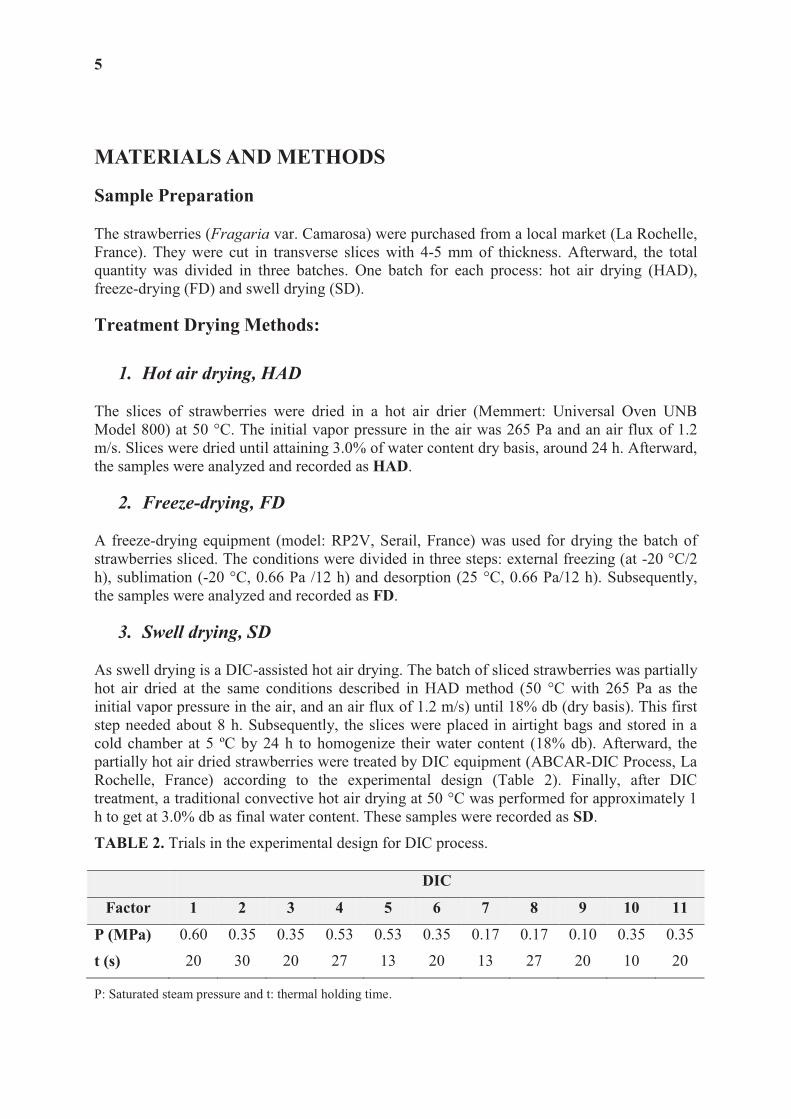
5
MATERIALS AND METHODS
Sample Preparation
The strawberries (Fragaria var. Camarosa) were purchased from a local market (La Rochelle, France). They were cut in transverse slices with 4-5 mm of thickness. Afterward, the total quantity was divided in three batches. One batch for each process: hot air drying (HAD), freeze-drying (FD) and swell drying (SD).
Treatment Drying Methods:
1. Hot air drying, HAD
The slices of strawberries were dried in a hot air drier (Memmert: Universal Oven UNB Model 800) at 50 °C. The initial vapor pressure in the air was 265 Pa and an air flux of 1.2 m/s. Slices were dried until attaining 3.0% of water content dry basis, around 24 h. Afterward, the samples were analyzed and recorded as HAD.
2. Freeze-drying, FD
A freeze-drying equipment (model: RP2V, Serail, France) was used for drying the batch of strawberries sliced. The conditions were divided in three steps: external freezing (at -20 °C/2 h), sublimation (-20 °C, 0.66 Pa /12 h) and desorption (25 °C, 0.66 Pa/12 h). Subsequently, the samples were analyzed and recorded as FD.
3. Swell drying, SD
As swell drying is a DIC-assisted hot air drying. The batch of sliced strawberries was partially hot air dried at the same conditions described in HAD method (50 °C with 265 Pa as the initial vapor pressure in the air, and an air flux of 1.2 m/s) until 18% db (dry basis). This first step needed about 8 h. Subsequently, the slices were placed in airtight bags and stored in a cold chamber at 5 ºC by 24 h to homogenize their water content (18% db). Afterward, the partially hot air dried strawberries were treated by DIC equipment (ABCAR-DIC Process, La Rochelle, France) according to the experimental design (Table 2). Finally, after DIC treatment, a traditional convective hot air drying at 50 °C was performed for approximately 1 h to get at 3.0% db as final water content. These samples were recorded as SD.
TABLE 2. Trials in the experimental design for DIC process.
DIC
Factor 1 2 3 4 5 6 7 8 9 10 11
P (MPa) 0.60 0.35 0.35 0.53 0.53 0.35 0.17 0.17 0.10 0.35 0.35
t (s) 20 30 20 27 13 20 13 27 20 10 20
P: Saturated steam pressure and t: thermal holding time.

6
DIC technology was initially developed by Allaf and Vidal (1988). Thus, the experimental set up of DIC equipment (Fig. 1) has been largely described in several papers (Maache-Rezzoug
et al., 1998); (Louka and Allaf, 2004); (Haddad and Allaf, 2007); (Ben Amor and Allaf, 2009); (Berka-Zougali et al., 2010) and (Mounir et al., 2012).
Figure 1. Schematic diagram of the DIC reactor (1) Processing vessel; (2) Vacuum tank; (3) Quick motion valve; (4) Steam generator; (5) Air compressor (6) Vacuum pump. It is composed of three main elements: A) The processing vessel (1), where strawberries samples were placed and treated; B) The vacuum system, which consists mainly of a vacuum tank (2) with a volume 130 times greater than the processing vessel, and an adequate vacuum pump. The initial vacuum level was maintained at 5 kPa in all the experiments; C) A pneumatic valve (3) that ensures the connection/separation between the vacuum tank and the processing vessel. It is capable of producing the abrupt pressure drop within the reactor in less than 0.2 s.
Briefly, DIC process is based on the thermal effects induced by subjecting the strawberries samples for short time (13 to 27 s) to high pressure saturated steam (0.17 to 0.53 MPa). This high temperature-short time stage is followed by an instant pressure drop towards a vacuum (5 kPa) inducing a mechanical effect; such an abrupt pressure drop (DP/Dt>0.5 MPa/s), provokes simultaneously autovaporization of a part of water contained in the product and an instantaneous cooling of the products which stops their thermal degradation and give a controlled expansion of the product (Fig. 2).

7
Figure 2. Schematic time-pressure profiles of a DIC process (A) vacuum establishment; (B) steam injection; (C) pressure and time treatment; (D) instant controlled pressure drop towards vacuum and (E) atmospheric pressure establishment.
Assessment Methods
Water Moisture Content
Water moisture content was determined following Karathanos method modified (1999). Briefly, the dried strawberries samples were quantified gravimetrically by triplicate. 2.5 ± 0.1 g of samples were drying at 65 °C during 48 h in the oven UFE 400 (Memmert, Germany). The moisture content (W) dry basis (db) was calculated using the following equation:
Eq. 1
Where, mi and md (g) were the material weight before and after drying, respectively.
Puncture Test
To measure the mechanical properties of the cellular structure of dried strawberries sliced (i.e. HAD, FD and SD batches), a puncture test was performed with an INSTRON (Model 5543, USA). The probe used was a stainless steel needle with 1 mm in diameter (Petrotest, VICAT needles ISO 6873-EN26873), moving at a constant speed of 1 mm/s. The analysis consisted in recording the force required to penetrate the dried samples by puncturing the middle of the sliced strawberries. The penetration in the dried fruit was until 2 mm for HAD and 3 mm for FD and SD samples (Fig. 3A). And, five measures were done by each batch (i.e. HAD, FD and the eleven SD samples).

8
Figure 3. (A) Schematic diagram of puncture test. (B) Theoretical force-deformation curves obtained by puncture test: crunchy behavior: maximum penetration force, Fmax (N); maximum penetration distance, Xmax (mm) and total work, Wmax, (J). (C) Theoretical force-deformation curves obtained by puncture test: crispy behavior: the penetration distance for each micro-rupture peak, DX (mm); the individual force drops for each micro-rupture peak (DF, N) and the average work for micro-ruptures, wrupture (J). (D) Real force-deformation curve recorded by puncture test: crunchy and crispy behavior.
Fundamental Approach to Analyze the Force-Time Curve
The obtained data by force-displacement curves were analyzed in two parts (Fig. 3B-C). The first was for descripting the crunchy behavior parameters (Fig. 3B) and the second was for the crispy behavior (Fig. 3C). In this analysis the method reported by Van Hecke et al. (1998) was used also. The following parameters were determined as:

9
Descripting parameters of Crunchy (Croquant) behavior
Maximum penetration force:
Maximum penetration distance:
Total work: Eq. 2
Total work at Xmax: Eq. 3
Average puncturing force:
Eq. 4
Descripting parameters of Crispy (Croustillant) behavior
Total number of peaks:
Spatial frequency of structural micro-ruptures:
Eq. 5
Average of micro-rupture force: Eq. 6
Average work for micro-ruptures:
Eq. 7
Where, DX is the penetration distance for each micro-rupture peak (mm) and DF is the individual force drops for each micro-rupture peak (N). All of these parameters (i.e. Xmax, Wmax, <F>, N, f, wrupture, DX and DF) were calculated until Fmax was reached (Fig. 3D). And, the final values were the arithmetic mean of five measurements.
Expansion ratios
For porous materials, two expansion ratios are normally defined; the absolute expansion ratio, and the relative expansion ratio, . The first is the ratio of the
apparent volume of the product and the volume of the solid itself. The second reflects
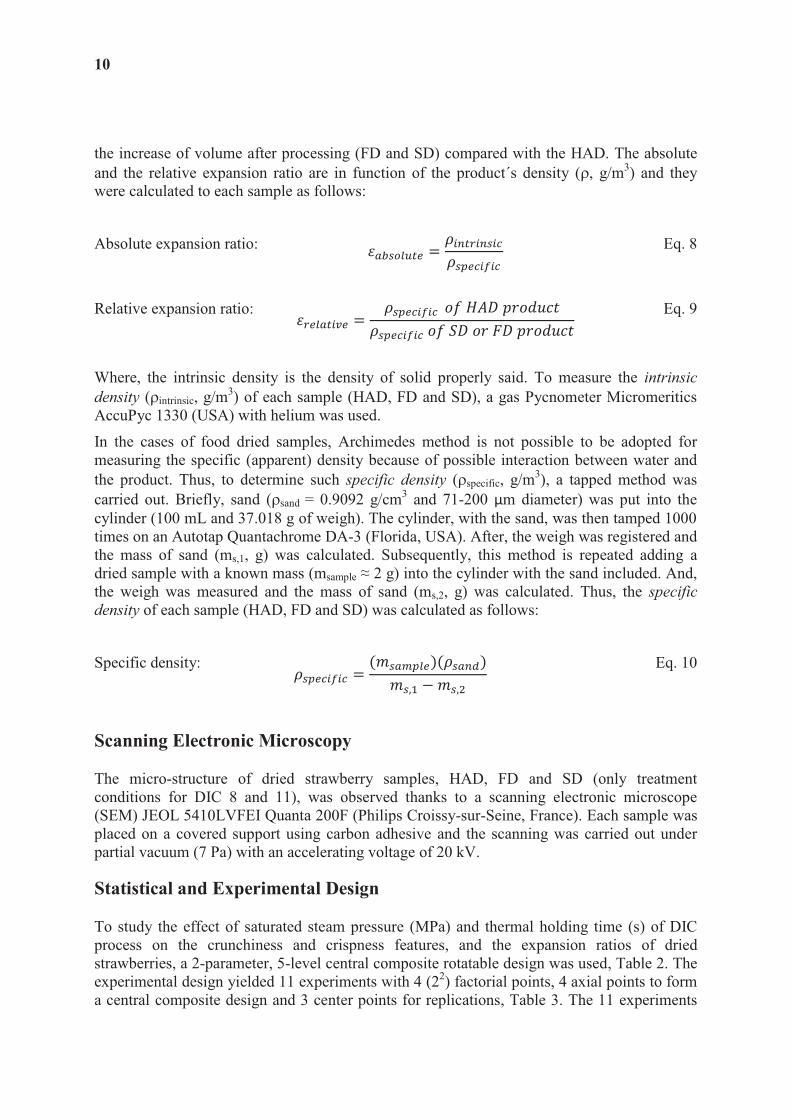
10
the increase of volume after processing (FD and SD) compared with the HAD. The absolute and the relative expansion ratio are in function of the product´s density (r, g/m3) and they were calculated to each sample as follows:
Absolute expansion ratio: Eq. 8
Relative expansion ratio:
Eq. 9
Where, the intrinsic density is the density of solid properly said. To measure the intrinsic
density (rintrinsic, g/m3) of each sample (HAD, FD and SD), a gas Pycnometer Micromeritics AccuPyc 1330 (USA) with helium was used.
In the cases of food dried samples, Archimedes method is not possible to be adopted for measuring the specific (apparent) density because of possible interaction between water and the product. Thus, to determine such specific density (rspecific, g/m3), a tapped method was carried out. Briefly, sand (rsand = 0.9092 g/cm3 and 71-200 μm diameter) was put into the cylinder (100 mL and 37.018 g of weigh). The cylinder, with the sand, was then tamped 1000 times on an Autotap Quantachrome DA-3 (Florida, USA). After, the weigh was registered and the mass of sand (ms,1, g) was calculated. Subsequently, this method is repeated adding a dried sample with a known mass (msample ≈ 2 g) into the cylinder with the sand included. And, the weigh was measured and the mass of sand (ms,2, g) was calculated. Thus, the specific
density of each sample (HAD, FD and SD) was calculated as follows:
Specific density:
Eq. 10
Scanning Electronic Microscopy
The micro-structure of dried strawberry samples, HAD, FD and SD (only treatment conditions for DIC 8 and 11), was observed thanks to a scanning electronic microscope (SEM) JEOL 5410LVFEI Quanta 200F (Philips Croissy-sur-Seine, France). Each sample was placed on a covered support using carbon adhesive and the scanning was carried out under partial vacuum (7 Pa) with an accelerating voltage of 20 kV.
Statistical and Experimental Design
To study the effect of saturated steam pressure (MPa) and thermal holding time (s) of DIC process on the crunchiness and crispness features, and the expansion ratios of dried strawberries, a 2-parameter, 5-level central composite rotatable design was used, Table 2. The experimental design yielded 11 experiments with 4 (22) factorial points, 4 axial points to form a central composite design and 3 center points for replications, Table 3. The 11 experiments

11
were run in random in order to minimize the effects of unexpected variability in observed responses due to external factors, Table 2.
TABLE 3. Coded and real levels for independent variables used in 2-variables 5-level rotatable experimental design.
Coded Level P: Processing pressure (MPa) t: Processing time (s)
-a 0.10 10
-1 0.19 13
0 0.35 20
1 0.53 27
+a 0.60 30
a= ; a is the axial distance and k is the number of experiments of orthogonal design. In this case k=2 and a= 1.4142.
The different responses analyzed for crunchiness were the maximum penetration force (Fmax, N), the maximum penetration distance (Xmax, mm), the total work at Xmax (Wtotal, J) and the average puncturing force (<F>, N). Concerning to the crispness, the responses evaluated were the total number of peaks (n), the spatial frequency of structural micro-ruptures (N, m-1), the average of micro-rupture force (f, N) and the average work for micro-ruptures (wrupture, J). The expansion ratios were considered at both aspects of absolute and relative .
The analysis was done with Statgraphics, (Centurion XV, USA) statistical program. The mathematical empirical model applied is:
Eq. 11
Where Y is the response, βi, βii, βij are the regression coefficients, Xi and Xj are the independent variables, ε is random error, i and j are the indices of the factors.
For each response, Pareto Charts was introduced to identify the impact of variables (p < 0.05). The Response Surface Methodology (RSM) was used to optimize treatment conditions depending on consumer needs. The general trends allow to analyzing responses behavior in front of variable changes. The empirical model coefficients were defined to determine the models of each response, and R² value to accurate fitting models to real data.
RESULTS AND DISCUSSION
The present study was performed to evaluate the effect of various drying processes (HAD, FD and SD) on the strawberry’s structure and its instrumental crunchy and crispy features. Therefore, the interpretation and discussion of the obtained results are presented as follows.
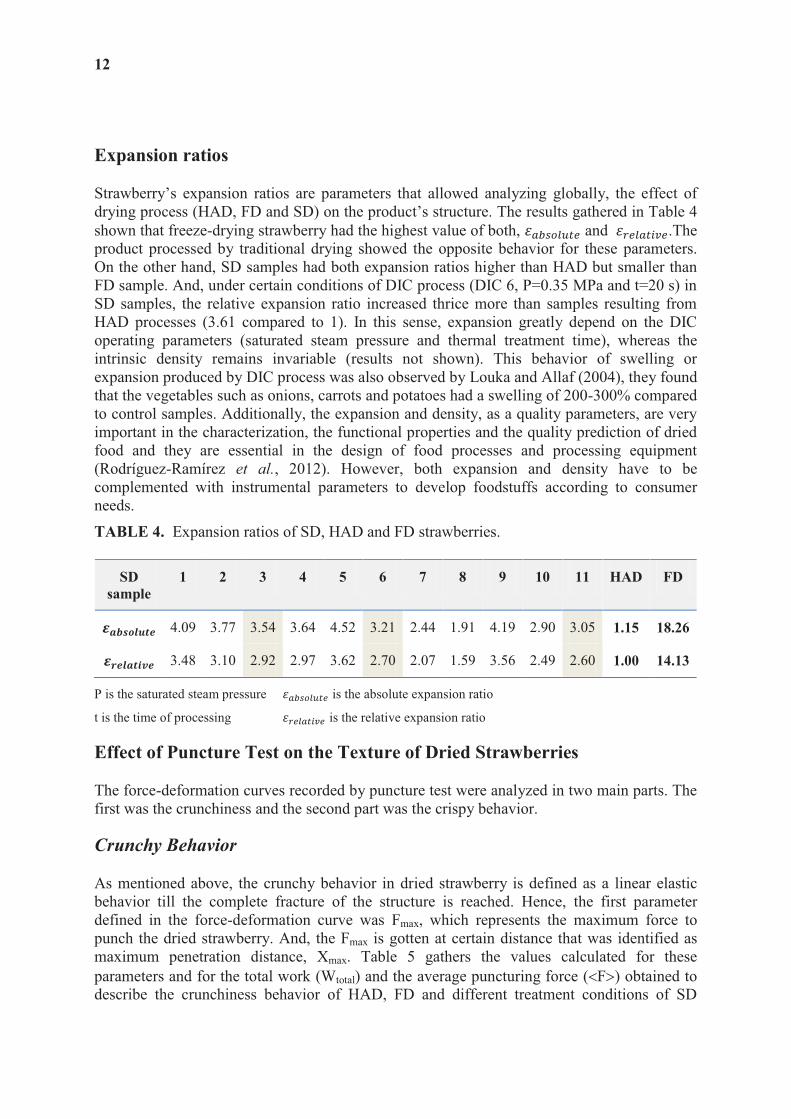
12
Expansion ratios
Strawberry’s expansion ratios are parameters that allowed analyzing globally, the effect of drying process (HAD, FD and SD) on the product’s structure. The results gathered in Table 4 shown that freeze-drying strawberry had the highest value of both, and .The product processed by traditional drying showed the opposite behavior for these parameters. On the other hand, SD samples had both expansion ratios higher than HAD but smaller than FD sample. And, under certain conditions of DIC process (DIC 6, P=0.35 MPa and t=20 s) in SD samples, the relative expansion ratio increased thrice more than samples resulting from HAD processes (3.61 compared to 1). In this sense, expansion greatly depend on the DIC operating parameters (saturated steam pressure and thermal treatment time), whereas the intrinsic density remains invariable (results not shown). This behavior of swelling or expansion produced by DIC process was also observed by Louka and Allaf (2004), they found that the vegetables such as onions, carrots and potatoes had a swelling of 200-300% compared to control samples. Additionally, the expansion and density, as a quality parameters, are very important in the characterization, the functional properties and the quality prediction of dried food and they are essential in the design of food processes and processing equipment (Rodríguez-Ramírez et al., 2012). However, both expansion and density have to be complemented with instrumental parameters to develop foodstuffs according to consumer needs.
TABLE 4. Expansion ratios of SD, HAD and FD strawberries.
SD
sample
1 2 3 4 5 6 7 8 9 10 11 HAD FD
4.09 3.77 3.54 3.64 4.52 3.21 2.44 1.91 4.19 2.90 3.05 1.15 18.26
3.48 3.10 2.92 2.97 3.62 2.70 2.07 1.59 3.56 2.49 2.60 1.00 14.13
P is the saturated steam pressure is the absolute expansion ratio
t is the time of processing is the relative expansion ratio
Effect of Puncture Test on the Texture of Dried Strawberries
The force-deformation curves recorded by puncture test were analyzed in two main parts. The first was the crunchiness and the second part was the crispy behavior.
Crunchy Behavior
As mentioned above, the crunchy behavior in dried strawberry is defined as a linear elastic behavior till the complete fracture of the structure is reached. Hence, the first parameter defined in the force-deformation curve was Fmax, which represents the maximum force to punch the dried strawberry. And, the Fmax is gotten at certain distance that was identified as maximum penetration distance, Xmax. Table 5 gathers the values calculated for these parameters and for the total work (Wtotal) and the average puncturing force (<F>) obtained to describe the crunchiness behavior of HAD, FD and different treatment conditions of SD

13
samples. Fig. 4 exemplifies the main behavior of the time-deformation curves obtained from HAD, FD and SD (DIC 11, P=0.35 MPa and t=20 s) samples.
Figure 4. Force-deformation curve from fracture tests on strawberries dried by different methods; HAD, FD and SD.
In general, Fmax had a significant effect in FD strawberries compared with HAD and SD samples, Table 5. It was too small, as well as the Wtotal used to penetrate the FD sample. Contrary behavior was observed in HAD and SD samples, Table 5. Hot air drying strawberries needed a maximum force and a total work of penetration smaller than swell-drying samples. Concerning to <F>, which is the mechanical resistance given by the product when the force to punch it is applied, in the average of DIC samples was higher than those in HAD and FD by 18% and 88%, respectively (Table 5).
On the other hand, the impact of DIC operating parameters (saturated steam pressure and processing time) on the different responses to measure the crunchiness of strawberry are shown in Table 5). The saturated steam pressure had a significant and positive effect (p < 0.05) on Xmax compared to the thermal holding time (Fig.5A). Hence, the higher the saturated steam pressure, the higher Xmax. The optimized conditions were calculated for an optimum value of 2.66 mm, with a saturated steam pressure of 0.6 MPa and 30 s of thermal treatment time (Fig.5B).
The obtained regression model for the maximum penetration distance is follows, with R2=71.69%
Xmax Eq. 12
-1
0
1
2
3
4
5
6
7
8
9
0 0.5 1 1.5 2 2.5 3
Fo
rce
(N
)
Deformation (mm)
HAD
FD
DIC 11
Fmax
=5.09
Fmax
=8.16
Xmax
= 1.44Xmax
=0.61 Xmax
= 2.54
Fmax
=0.59
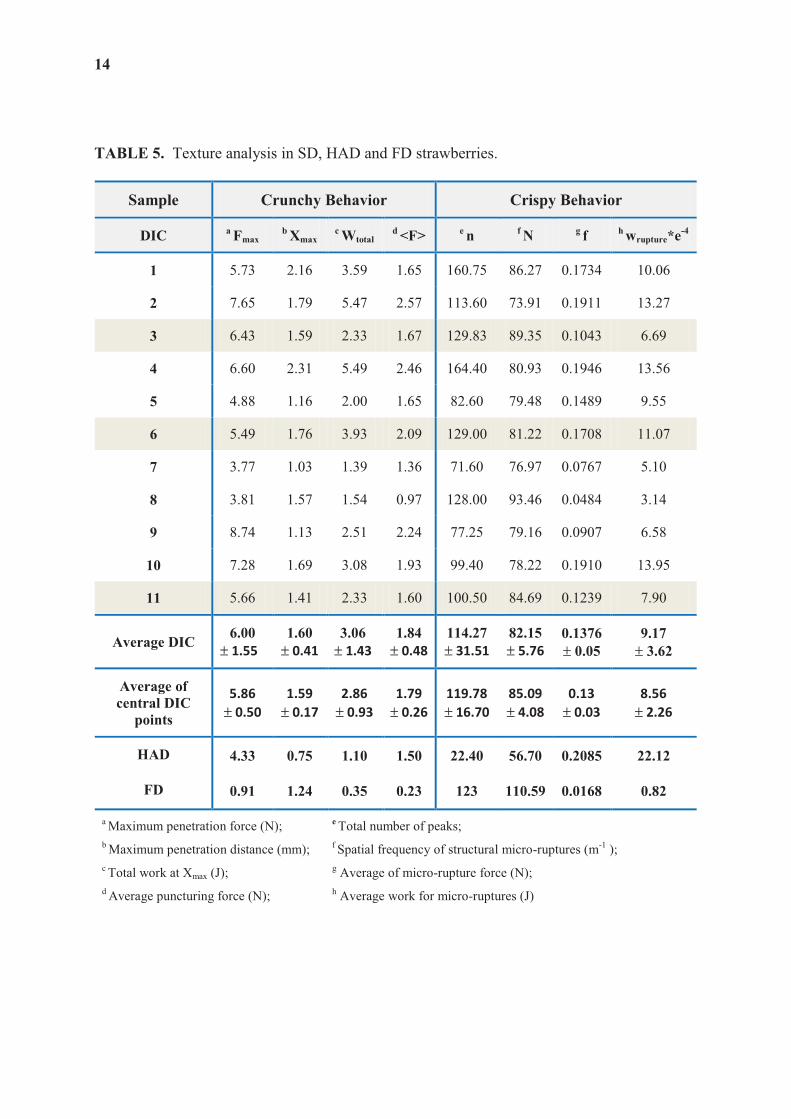
14
TABLE 5. Texture analysis in SD, HAD and FD strawberries.
Sample Crunchy Behavior Crispy Behavior
DIC a Fmax
b Xmax
c Wtotal
d <F>
e n
f N
g f
h wrupture*e
-4
1 5.73 2.16 3.59 1.65 160.75 86.27 0.1734 10.06
2 7.65 1.79 5.47 2.57 113.60 73.91 0.1911 13.27
3 6.43 1.59 2.33 1.67 129.83 89.35 0.1043 6.69
4 6.60 2.31 5.49 2.46 164.40 80.93 0.1946 13.56
5 4.88 1.16 2.00 1.65 82.60 79.48 0.1489 9.55
6 5.49 1.76 3.93 2.09 129.00 81.22 0.1708 11.07
7 3.77 1.03 1.39 1.36 71.60 76.97 0.0767 5.10
8 3.81 1.57 1.54 0.97 128.00 93.46 0.0484 3.14
9 8.74 1.13 2.51 2.24 77.25 79.16 0.0907 6.58
10 7.28 1.69 3.08 1.93 99.40 78.22 0.1910 13.95
11 5.66 1.41 2.33 1.60 100.50 84.69 0.1239 7.90
Average DIC 6.00
± 1.55
1.60
± 0.41
3.06
± 1.43
1.84
± 0.48
114.27
± 31.51
82.15
± 5.76
0.1376
± 0.05
9.17
± 3.62
Average of
central DIC
points
5.86
± 0.50
1.59
± 0.17
2.86
± 0.93
1.79
± 0.26
119.78
± 16.70
85.09
± 4.08
0.13
± 0.03
8.56
± 2.26
HAD 4.33 0.75 1.10 1.50 22.40 56.70 0.2085 22.12
FD 0.91 1.24 0.35 0.23 123 110.59 0.0168 0.82
a Maximum penetration force (N); e Total number of peaks; b Maximum penetration distance (mm); f Spatial frequency of structural micro-ruptures (m-1 ); c Total work at Xmax (J); g Average of micro-rupture force (N); d Average puncturing force (N); h Average work for micro-ruptures (J)

15
Figure 5. Effect of DIC operating parameters; saturated steam pressure (MPa) and time processing (s) on the maximum penetration distance (Xmax, mm), a parameter of crunchy behavior in the strawberry’s texture. (A) Pareto Chart and (B) Response Surface.
Furthermore, the mean correlations were analyzed between the four parameters (Fmax, Xmax, Wtotal and <F>) of crunchiness presented in strawberry dried by HAD, FD and SD processes.
The highest correlation was found between <F> and Fmax with R2=0.8083, Fig. 6A. Another important correlation with R2= 0.7270 was observed between <F> and Wtotal. And, the last one was between Xmax and Wtotal, with R2=0.6257.
Figure 6. Mean correlations between crunchy and crispy behavior. (A) <F> and Fmax for crunchiness; (B) wrupture and f for crispness; (C) Xmax and n between both, crunchy and crispy behavior.

16
Crispy Behavior
In the case of crispy behavior of dried strawberry, the crispness or croustillant feature was used to describe the small continuous linear elastic behavior till the successive fractures during chewing of dried strawberry. Hence, the mean parameters analyzed that described the crispness behavior in the dried strawberry (HAD, FD and SD) are presented in Table 5. Therefore, the small fractures recorded during puncture test were gathered in the total number of peaks (n) and in the spatial frequency of structural micro-ruptures (N); however the last one is dependent on Xmax. Thus, the n value in HAD product was smaller than FD and SD samples in 82% and 80%, respectively. Similar behavior was observed for the N value; it was small in 49% for FD and 31% for SD samples compared with the values obtained in HAD strawberry. In case of SD samples compared with FD, no significant difference was found for the total number of micro-ruptures, but FD presented a spatial frequency of structural micro-ruptures higher in 26% than SD strawberries. Relating to the average on micro-rupture force (f) and the average work for micro-ruptures (wrupture), the least values were for FD samples. And HAD strawberries had a significant difference in f and wrupture with SD samples. These values in HAD were higher than SD fruits.
Nevertheless, as process parameters and macrostructure are difficult to separate, the operating parameters of DIC showed an effect of saturated steam pressure (MPa) and time processing (s) on the average of micro-rupture force (f) (Fig. 7A-B). Similar behavior in Xmax was observed for f. The saturated steam pressure had a great influence compared to the thermal holding time (Fig. 7A). The higher saturated pressure time, the higher f. Hence, the DIC treatment at 0.6 MPa of saturated steam pressure and 30 s of thermal holding time gave the highest value of f, 0.2447 N (Fig. 7B).
The obtained regression model for the average of micro-rupture force is follows:
f Eq. 13
With R2= 72.26%
Respect to correlations, they were studied between the crispness parameters (i.e. n, N, f and wrupture) for the three drying process applied at strawberry. A correlation between f and wrupture was the highest, with R2=0.8442 (Fig. 6B). While, the correlation between N and wrupture and f were observed with R2=0.7172 and R2=0.5439, respectively.

17
Figure 7. Effect of DIC operating parameters; saturated steam pressure (MPa) and time processing (s) on the average of micro-rupture force (f, N), a parameter of crunchy behavior in the strawberry’s texture. (A) Pareto Chart and (B) Response Surface.
Correlations Between Crunchiness, Crispness and Expansion Ratios.
Only two correlations were observed between eight parameters (e.g. Xmax, n) that described the crunchy and crispy behavior of this study. The highest correlations was observed between Xmax and n, with R2=0.8143 (Fig. 6C). And, the second correlation with R2=0.5311 was obtained between <F> and f. In contrast, there was just one correlation between and N, with R2= 5445. These results indicated that crunchiness and crispness were strongly correlated.
The overall of these results could be explained by the effect of shrinkage phenomena in HAD, the cell walls broken in FD and the swelling or expansion phenomena in SD strawberries. Namely, the arrangement of cells in fruits and vegetables is strongly marked by the processing (Hammami and René, 1997; Wang et al., 2011; Guiné and Barroca, 2012). And it influences directly in the textural behavior and functionality of foodstuffs. Therefore, the cell walls networking are contracted in the strawberry after HAD, producing a hard and brittle structure in the product. In contrast, FD strawberries have a membranes system disrupted that behave more like a sponge characterized by network tortuosity (Voda et al., 2012). And, it provokes a soft texture and many micro-ruptures in the FD fruit. However, the micro-ruptures will have a small force and work. In case of SD products, the cells arrangement is better defined due to the micro-alveolation phenomenon produced as consequence of the decompression process in the DIC treatment. The swelling products will be highly crispy with a significant number of micro-ruptures, and considerable force and work.
At the same time, crispness is an important and desirable sensory attribute and there is a great deal of interest in correlating crispness to instrumental recorded data (Tsukakoshi et al., 2007; Arimi et al., 2010). Hence, this puncture test method helps strongly to elucidate crunchiness and crispness features; such are very important attributes in the swell-dried fruits. And, it means that is possible to concoct a crispy snack produced by swell-drying performance and accordingly with the consumer needs.

18
Impact of Processes in the Microstructure
Fig. 8 shows the impact of drying processes on strawberry’s microstructure. The cross section micrographs of dried strawberries, shown structural differences between HAD, FD and SD processes (Fig. 8). The shrinkage of HAD product is evident in the image; however, the cell structure is relatively organized, Fig. 8A. With respect to FD micrograph, it shows that cell walls of strawberry were broken, Fig. 8B. On the other hand, SD images illustrate a strawberry’s microstructure expanded (Fig. 8C-D). It can be identified by the dark regions that represent the cavities of the pores expanded. And, the structure of cell walls was well preserved. However, in SD samples, the structure modification is highly dependent of the operating parameters (saturated steam pressure, MPa and thermal holding time, s) used for the DIC treatment. These observations were consisted with the results of puncture test.
Figure 8. Scanning Electron Micrographs of cross-section of strawberry treated by different drying methods (A); Hot Air Drying (B); Freeze-Drying at (C); Swell-Drying (DIC 8) at P=17 MPa and t=27 s, and (D); Swell-Drying (DIC 11) at P=35 MPa and t=20 s of treatment conditions.
In fruits treated by freeze-drying, is normal the formation of ice crystals that destroy the tissue during the freezing step. Likewise, this damage is limited in function of the rates of freezing (Hammami and René, 1997). Voda et al. (2012) analyzed SEM images of carrots processed by freeze-drying and found that during the freezing the growth of an ice crystal ruptures,

19
pushes, and compresses cells and this damage is more pronounced in slowly frozen tissue which yields bigger ice crystals.
In the case of SD samples, this structure modification produced by DIC treatment, can intensify the mass transfer phenomena, improving the effective water diffusivity during both drying and rehydration operations of strawberries reported in a previously work (Alonzo-Macías et al., 2012). This effect is observed not only for strawberries but also other kind of fruits and vegetables treated by DIC (Ben Amor and Allaf, 2009; Albitar et al., 2011; Téllez-Pérez et al., 2012).
CONCLUSIONS
Based on our experimental study, it is possible to obtain a crispy fruit modifying, controlling, and optimizing the DIC operating parameters. Thus, this snack product can be confectioned according to the consumer needs. In case of strawberry was possible to reduce the shrinkage phenomena in swell-drying samples. Consequently, the swell-dried strawberries showed an interesting macro and micro-structure. They had a high expansion ratios and significant crispness provoked by the micro-alveolation phenomenon induced as consequence of the decompression process in the DIC treatment.
On the other hand, the most important correlations were between Fmax and <F> and between f and wrupture for crunchiness and crispness features, respectively. And, there was just one correlation between and N.
Hence, the present study opens the possibility to use the puncture test as an instrumental source to measure the crispness on swell-dried fruits and vegetables. Also, it could be used as a complement of the analysis to describe better the physical attributes of swelled products.
Additionally, DIC technology can compete with freeze drying process and is a better alternative instead of using the hot air drying process to preserver strawberries. This proposal is in terms of the high-quality in the product with a low-cost of processing and the high diversification of the fruit obtained with DIC performance.
AKNOWLEDGMENTS
The authors would like to thank the Common Center of Analyses CCA of the University of La Rochelle, France to provide the analysis by SEM. Thanks also to CONACyT, for the facilitates provided to carry out this research and ABCAR-DIC Process for technical contribution. The authors are grateful to Ing. Victor Lefrançois for his valuable collaboration.
REFERENCES
AL CHAKRA, W., ALLAF, K., and JEMAI, A.B. 1996. Characterization of brittle food products: Application of the acoustical emission method. Journal of Texture Studies 27, 327-348. http://dx.doi.org/10.1111/j.1745-4603.1996.tb00078.x
ALBITAR, N., MOUNIR, S., BESOMBES, C., and ALLAF, K. 2011. Improving the drying of onion using the instant controlled pressure drop technology. Drying Technology 29, 993-1001. http://dx.doi.org/10.1080/07373937.2010.507912
ALLAF, K., and VIDAL, P. 1988. Feasibility study of a new process of drying/swelling by instantaneous decompression toward vacuum of in pieces vegetables in view of a rapid re-hydration. Gradient activity plotting university of technology of compiegne utc. In.
20
ALONZO-MACÍAS, M., MOUNIR, S., CARDADOR-MARTÍNEZ, A., MONTEJANO-
GAITÁN, J.G., and ALLAF, K. 2012. Comparative study of various drying processes at physical and chemical properties of strawberries (fragaria var. Camarosa). Procedia Engineering 42, 267-282. http://dx.doi.org/10.1016/j.proeng.2012.07.418
ALTAMIRANO-FORTOUL, R., HERNANDO, I., and ROSELL, C.M. 2012. Texture of bread crust: Puncturing settings effect and its relationship to microstructure. Journal of Texture Studies, n/a-n/a. http://dx.doi.org/10.1111/j.1745-4603.2012.00368.x
ARIMI, J.M., DUGGAN, E., O'SULLIVAN, M., LYNG, J.G., and O'RIORDAN, E.D. 2010. Development of an acoustic measurement system for analyzing crispiness during mechanical and sensory testing. Journal of Texture Studies 41, 320-340. http://dx.doi.org/10.1111/j.1745-4603.2010.00224.x
BEN AMOR, B., and ALLAF, K. 2009. Impact of texturing using instant pressure drop treatment prior to solvent extraction of anthocyanins from malaysian roselle (hibiscus sabdariffa). Food Chemistry 115, 820-825. http://dx.doi.org/10.1016/j.foodchem.2008.12.094
BERKA-ZOUGALI, B., HASSANI, A., BESOMBES, C., and ALLAF, K. 2010. Extraction of essential oils from algerian myrtle leaves using instant controlled pressure drop technology. Journal of Chromatography A 1217, 6134-6142. http://dx.doi.org/10.1016/j.chroma.2010.07.080
BOURNE, M.C. 2002a. Chapter 1 - texture, viscosity, and food. In Food texture and viscosity
(second edition). Academic Press, London pp. 1-32.
BOURNE, M.C. 2002b. Chapter 4 - principles of objective texture measurement. In Food
texture and viscosity (second edition). Academic Press, London pp. 107-188.
DACREMONT, C. 1992. Contribution à la caractérisation de trois descripteurs de texture: Croustillant craquant et croquant par des approches acoustiques et sensorielles. In ENSABANA. Université de Bourgogne, Dijon, FRANCE.
DRAKE, B. 1989. Sensory textural/rheological properties—a polyglot list. Journal of Texture Studies 20, 1-27. http://dx.doi.org/10.1111/j.1745-4603.1989.tb00417.x
GIAMPIERI, F., TULIPANI, S., ALVAREZ-SUAREZ, J.M., QUILES, J.L., MEZZETTI, B., and BATTINO, M. 2012. The strawberry: Composition, nutritional quality, and impact on human health. Nutrition 28, 9-19. http://dx.doi.org/10.1016/j.nut.2011.08.009
GUINÉ, R.P.F., and BARROCA, M.J. 2012. Effect of drying treatments on texture and color of vegetables (pumpkin and green pepper). Food and Bioproducts Processing 90, 58-63. http://dx.doi.org/10.1016/j.fbp.2011.01.003
HADDAD, J., and ALLAF, K. 2007. A study of the impact of instantaneous controlled pressure drop on the trypsin inhibitors of soybean. Journal of Food Engineering 79, 353-357. http://dx.doi.org/10.1016/j.jfoodeng.2006.01.066
HAMMAMI, C., and RENÉ, F. 1997. Determination of freeze-drying process variables for strawberries. Journal of Food Engineering 32, 133-154.
KAMAL, I.M., SOBOLIK, V., KRISTIAWAN, M., MOUNIR, S.M., and ALLAF, K. 2008. Structure expansion of green coffee beans using instantaneous controlled pressure

21
drop process. Innovative Food Science & Emerging Technologies 9, 534-541. http://dx.doi.org/10.1016/j.ifset.2008.01.004
KARATHANOS, V.T. 1999. Determination of water content of dried fruits by drying kinetics. Journal of Food Engineering 39, 337-344. http://dx.doi.org/10.1016/s0260-8774(98)00132-0
LOUKA, N., and ALLAF, K. 2004. Expansion ratio and color improvement of dried vegetables texturized by a new process “controlled sudden decompression to the vacuum”: Application to potatoes, carrots and onions. Journal of Food Engineering 65, 233-243. http://dx.doi.org/10.1016/j.jfoodeng.2004.01.020
LUYTEN, H., J. PLIJTER, J., and VAN VLIET, T.O.N. 2004. Crispy/crunchy crusts of cellular solid foods: A literature review with discussion. Journal of Texture Studies 35, 445-492. http://dx.doi.org/10.1111/j.1745-4603.2004.35501.x
MAACHE-REZZOUG, Z., BOUVIER, J.-M., ALLAF, K., and PATRAS, C. 1998. Effect of principal ingredients on rheological behaviour of biscuit dough and on quality of biscuits. Journal of Food Engineering 35, 23-42. http://dx.doi.org/10.1016/S0260-8774(98)00017-X
MOUNIR, S., ALLAF, T., MUJUMDAR, A.S., and ALLAF, K. 2012. Swell drying: Coupling instant controlled pressure drop dic to standard convection drying processes to intensify transfer phenomena and improve quality—an overview. Drying Technology 30, 1508-1531. http://dx.doi.org/10.1080/07373937.2012.693145
MOUNIR, S., BESOMBES, C., AL-BITAR, N., and ALLAF, K. 2011. Study of instant controlled pressure drop dic treatment in manufacturing snack and expanded granule powder of apple and onion. Drying Technology 29, 331-341. http://dx.doi.org/10.1080/07373937.2010.491585
NISHINARI, K., HAYAKAWA, F., XIA, C.-F., HUANG, L., MEULLENET, J.-F., and SIEFFERMANN, J.-M. 2008. Comparative study of texture terms: English, french, japanese and chinese. Journal of Texture Studies 39, 530-568. http://dx.doi.org/10.1111/j.1745-4603.2008.00157.x
OSZMIAŃSKI, J., WOJDYŁO, A., and KOLNIAK, J. 2009. Effect of l-ascorbic acid, sugar, pectin and freeze–thaw treatment on polyphenol content of frozen strawberries. LWT - Food Science and Technology 42, 581-586. http://dx.doi.org/10.1016/j.lwt.2008.07.009
RATTI, C. 2001. Hot air and freeze-drying of high-value foods: A review. Journal of Food Engineering 49, 311-319. http://dx.doi.org/10.1016/S0260-8774(00)00228-4
RODRÍGUEZ-RAMÍREZ, J., MÉNDEZ-LAGUNAS, L., LÓPEZ-ORTIZ, A., and TORRES, S.S. 2012. True density and apparent density during the drying process for vegetables and fruits: A review. Journal of Food Science 77, R146-R154. http://dx.doi.org/10.1111/j.1750-3841.2012.02990.x
ROUDAUT, G., DACREMONT, C., VALLÈS PÀMIES, B., COLAS, B., and LE MESTE, M. 2002. Crispness: A critical review on sensory and material science approaches. Trends in Food Science & Technology 13, 217-227. http://dx.doi.org/10.1016/S0924-2244(02)00139-5

22
SAELEAW, M., and SCHLEINING, G. 2011. A review: Crispness in dry foods and quality
measurements based on acoustic–mechanical destructive techniques. Journal of Food Engineering 105, 387-399. http://dx.doi.org/10.1016/j.jfoodeng.2011.03.012
SOZER, N., DOGAN, H., and KOKINI, J.L. 2011. Textural properties and their correlation to cell structure in porous food materials. Journal of Agricultural and Food Chemistry 59, 1498-1507. http://dx.doi.org/10.1021/jf103766x
TÉLLEZ-PÉREZ, C., MOUNIR, S., MONTEJANO-GAITÁN, J.G., SOBOLIK, V., MARTÍNEZ-CARDADOR, A., and ALLAF, K. 2012. Impact of instant controlled pressure drop treatment on dehydration and rehydration kinetics of green moroccan pepper (capsicum annuum). Procedia Engineering 42, 978-1003. http://dx.doi.org/10.1016/j.proeng.2012.07.491
TSUKAKOSHI, Y., NAITO, S., and ISHIDA, N. 2007. Probabilistic characteristics of stress changes during cereal snack puncture. Journal of Texture Studies 38, 220-235. http://dx.doi.org/10.1111/j.1745-4603.2007.00095.x
VAN HECKE, E., ALLAF, K., and BOUVIER, J.M. 1998. Texture and structure of crispy-puffed food products part ii: Mechanical properties in puncture. Journal of Texture Studies 29, 617-632. http://dx.doi.org/10.1111/j.1745-4603.1998.tb00189.x
VAN VLIET, T.O.N., and PRIMO-MARTÍN, C. 2011. Interplay between product characteristics, oral physiology and texture perception of cellular brittle foods. Journal of Texture Studies 42, 82-94. http://dx.doi.org/10.1111/j.1745-4603.2010.00273.x
VODA, A., HOMAN, N., WITEK, M., DUIJSTER, A., VAN DALEN, G., VAN DER SMAN, R., NIJSSE, J., VAN VLIET, L., VAN AS, H., and VAN DUYNHOVEN, J. 2012. The impact of freeze-drying on microstructure and rehydration properties of carrot. Food Research International 49, 687-693. http://dx.doi.org/10.1016/j.foodres.2012.08.019
WANG, Y., XU, P., FENG, L., YANG, X., and QIAN, L. 2011. Impact of instantaneous controlled pressure drop on microstructural modification of green tea and its infusion quality. Journal of Food Science and Technology, 1-8. http://dx.doi.org/10.1007/s13197-011-0466-1
PART IV
CONCLUSIONS AND PERSPECTIVES
122
CHAPTER IV.1
CONCLUSIONS
The overall results shown that swell-drying technique can be considered as an
alternative of drying method for fragile fruits, such as strawberries. Because of SD
method helped to reduce the time of drying and is a low-cost processing compared
with classical hot air drying and freeze-drying. At the same time, it could face the
shrinkage phenomenon that is very common in hot air drying samples.
Additionally, SD globally preserved the strawberry’s nutritional value and bioactive
compounds, increasing their availability. Also, it was demonstrated that at optimal
DIC conditions (0.35 MPa as saturated steam pressure for 10 s) SD strawberries were
richer in anthocyanins, phenolic compounds and flavonoids compared with the other
dried samples and increased the availability of these compounds. Moreover, a strong
correlation between antioxidant activity and total anthocyanin content was
established in SD strawberries.
On the other hand, the swell-dried strawberries showed an interesting macro and
micro-structure. They had a high expansion ratios and significant crispness provoked
by the micro-alveolation phenomenon induced as consequence of the instant
decompression process by DIC treatment.
Hence, the present study opens the possibility to use the puncture test as an
instrumental way to measure the crispness on swell-dried fruits and vegetables.
Since it also can estimate the crunchy content, it will be possible to use it as
complement analysis to describe better the physical attributes of swelled products,
and to optimize the treatment and texturing conditions.
Thus, it was possible to obtain a crispy high nutritional quality dried strawberry
modifying, controlling, and optimizing the operating parameters of DIC. Thus, this
snack product can be confectioned according to the industrial and consumer needs.
123
CHAPTER IV.2
PERSPECTIVES
This thesis has made original contribution to knowledge by providing basic and
applied information on drying strawberries, using different treatments as hot air
drying, freeze-drying and swell-drying. However, the main points that are yet to be
addressed for further studies are explained as follows:
Process:
To improve swell-drying performances two solutions are proposed. It is possible to
optimize the parameters used for the hot air drying in the first part of SD process.
They are the air flux rate, temperature and humidity. Some improvements
depending on the products can also be defined such as intermittency and sun
drying… The second possibility in terms of process is to use microwaves or DDS
technology instead of hot air drying in the last stage of SD process. Both suggestions
are to decrease the time and cost operation and increase the quality of end product.
Product:
It is necessary to extend this study to other fruits and vegetables to technically
support the industrial scale of final products for various applications (baby foods,
nutraceutics…) to make them commercially available.
Assessments:
Since we could define an instrumental method to quantify the texture of swell-dried
snacking, more texture measurements by penetration test are important to perfectly
optimize the treatment parameters and to obtain the highest quality products. Our
analyses were defined for one diameter and with a pre-determined velocity. It will
be very important to study the correlations between the products, thickness and
these puncture assessment parameters through the force-time curves obtained. It is
also important to define a “standard instrumental method independently of the
product”.
124
Other techniques such as acoustical methods for brittle materials should help to well
describe the sound emitted by snacking products, and its correlation with sensorial
acoustical content. Thus, a sensorial analysis must be included for further studies.
The consumer’s acceptance is crucial to get uniform quality of final products at
industrial scale. Particularly, when a new product is developed and it presents a
health potential benefit. Since the swell-dried strawberry issued from this research is
an alternative of snacking products, medical studies should be carried out to identify
much better its impact on health and nutritional effect, more specially for children.
Hence, measurements of the various phytochemical bioavailabilities (i.e. phenols
and anthocyanins) through human feeding studies are necessary to give evidences of
its health benefits. Additionally, it is also interesting to identify the metabolites of
these compounds and their bioactivity.
In terms of quality product, it is necessary to evaluate the profile of volatile
compounds by gas chromatography-mass spectrometry (GC-MS) to compare the
effect of drying methods (i.e. SD, HAD and FD).
Finally, it is indispensable to evaluate comparatively the shelf-life of various dried
products depending on the processes, specially in terms of nutritional component
degradation.
125
PART V
REFERENCES
126

AABY, K., EKEBERG, D., and SKREDE, G. 2007. Characterization of phenolic
compounds in strawberry (fragaria × ananassa) fruits by different hplc detectors and
contribution of individual compounds to total antioxidant capacity. Journal of
Agricultural and Food Chemistry 55, 4395-4406.
http://dx.doi.org/10.1021/jf0702592
ABDEL-AAL, E.S.M., and HUCL, P. 1999. A rapid method for quantifying total
anthocyanins in blue aleurone and purple pericarp wheats. Cereal Chemistry Journal
76, 350-354. http://dx.doi.org/10.1094/CCHEM.1999.76.3.350
AL HADDAD, M., MOUNIR, S.M., SOBOLIK, V., and ALLAF, K. 2008. Fruits and
vegetables drying combining hot air, dic technology and microwaves. International
Journal of Food Engineering 4.
ALBITAR, N., MOUNIR, S., BESOMBES, C., and ALLAF, K. 2011. Improving the drying of
onion using the instant controlled pressure drop technology. Drying Technology 29,
993-1001. http://dx.doi.org/10.1080/07373937.2010.507912
ALLAF, K., ed. 1982. Transfer phenomena and industrial applications. .
ALLAF, K., S. MOUNIR, AND T. ALLAF, 2012. Swell-drying: Séchage et texturation par
dic des végétaux. In Techniques de l'Ingénieur.La Rochelle, France.
ALLAF, K., and VIDAL, P. 1988. Feasibility study of a new process of drying/swelling
by instantaneous decompression toward vacuum of in pieces vegetables in view of a
rapid re-hydration. Gradient activity plotting university of technology of compiegne
utc. In.
ALVAREZ, C.A., AGUERRE, R., GÓMEZ, R., VIDALES, S., ALZAMORA, S.M., and
GERSCHENSON, L.N. 1995. Air dehydration of strawberries: Effects of blanching and
osmotic pretreatments on the kinetics of moisture transport. Journal of Food
Engineering 25, 167-178. http://dx.doi.org/10.1016/0260-8774(94)00026-6
ARORA, S., BHARTI, S., and SEHGAL, V.K. 2006. Convective drying kinetics of red
chillies. Drying Technology 24, 189-193.
http://dx.doi.org/10.1080/07373930600559068
127
BEN AMOR, B., and ALLAF, K. 2009. Impact of texturing using instant pressure drop
treatment prior to solvent extraction of anthocyanins from malaysian roselle
(hibiscus sabdariffa). Food Chemistry 115, 820-825.
http://dx.doi.org/10.1016/j.foodchem.2008.12.094
BENZIE, I.F.F., and STRAIN, J.J. 1996. The ferric reducing ability of plasma (frap) as a
measure of “antioxidant power”: The frap assay. Analytical Biochemistry 239, 70-76.
http://dx.doi.org/10.1006/abio.1996.0292
BERKA-ZOUGALI, B., HASSANI, A., BESOMBES, C., and ALLAF, K. 2010. Extraction of
essential oils from algerian myrtle leaves using instant controlled pressure drop
technology. Journal of Chromatography A 1217, 6134-6142.
http://dx.doi.org/10.1016/j.chroma.2010.07.080
BLANDA, G., CERRETANI, L., CARDINALI, A., BARBIERI, S., BENDINI, A., and LERCKER,
G. 2009. Osmotic dehydrofreezing of strawberries: Polyphenolic content, volatile
profile and consumer acceptance. LWT - Food Science and Technology 42, 30-36.
http://dx.doi.org/10.1016/j.lwt.2008.07.002
BÖHM, H. 1994. G. Mazza und e. Miniati: Anthocyanins in fruits, vegetables and
grains. 362 seiten, zahlr. Abb. Und tab. Crc press, boca raton, ann arbor, london,
tokyo 1993. Preis: 144.— £. Food / Nahrung 38, 343-343.
http://dx.doi.org/10.1002/food.19940380317
BOURNE, M.C. 2002a. Chapter 1 - texture, viscosity, and food. In Food texture and
viscosity (second edition). Academic Press, London pp. 1-32.
BOURNE, M.C. 2002b. Chapter 4 - principles of objective texture measurement. In
Food texture and viscosity (second edition). Academic Press, London pp. 107-188.
BURDA, S., and OLESZEK, W. 2001. Antioxidant and antiradical activities of flavonoids.
Journal of Agricultural and Food Chemistry 49, 2774-2779.
http://dx.doi.org/10.1021/jf001413m
CHUA, K.J., MUJUMDAR, A.S., and CHOU, S.K. 2003. Intermittent drying of
bioproducts––an overview. Bioresource Technology 90, 285-295.
http://dx.doi.org/10.1016/S0960-8524(03)00133-0
128
CORDENUNSI, B.R., GENOVESE, M.I., OLIVEIRA DO NASCIMENTO, J.R., AYMOTO
HASSIMOTTO, N.M., JOSÉ DOS SANTOS, R., and LAJOLO, F.M. 2005. Effects of
temperature on the chemical composition and antioxidant activity of three
strawberry cultivars. Food Chemistry 91, 113-121.
http://dx.doi.org/10.1016/j.foodchem.2004.05.054
CORDENUNSI, B.R., NASCIMENTO, J.R.O., and LAJOLO, F.M. 2003. Physico-chemical
changes related to quality of five strawberry fruit cultivars during cool-storage. Food
Chemistry 83, 167-173. http://dx.doi.org/10.1016/s0308-8146(03)00059-1
CRANK, J. 1975. The mathematics of diffusion.
CRECENTE-CAMPO, J., NUNES-DAMACENO, M., ROMERO-RODRÍGUEZ, M.A., and
VÁZQUEZ-ODÉRIZ, M.L. 2012. Color, anthocyanin pigment, ascorbic acid and total
phenolic compound determination in organic versus conventional strawberries
(fragaria x ananassa duch, cv selva). Journal of Food Composition and Analysis.
http://dx.doi.org/10.1016/j.jfca.2012.07.004
DA SILVA, F.L., ESCRIBANO-BAILÓN, M.T., PÉREZ ALONSO, J.J., RIVAS-GONZALO, J.C.,
and SANTOS-BUELGA, C. 2007. Anthocyanin pigments in strawberry. LWT - Food
Science and Technology 40, 374-382. http://dx.doi.org/10.1016/j.lwt.2005.09.018
DE OLIVEIRA, A.C., VALENTIM, I.B., SILVA, C.A., BECHARA, E.J.H., BARROS, M.P.D.,
MANO, C.M., and GOULART, M.O.F. 2009. Total phenolic content and free radical
scavenging activities of methanolic extract powders of tropical fruit residues. Food
Chemistry 115, 469-475. http://dx.doi.org/10.1016/j.foodchem.2008.12.045
DI SCALA, K., VEGA-GÁLVEZ, A., URIBE, E., OYANADEL, R., MIRANDA, M., VERGARA, J.,
QUISPE, I., and LEMUS-MONDACA, R. 2011. Changes of quality characteristics of
pepino fruit (solanum muricatum ait) during convective drying. International Journal
of Food Science & Technology 46, 746-753. http://dx.doi.org/10.1111/j.1365-
2621.2011.02555.x
DOYMAZ, *. 2008. Convective drying kinetics of strawberry. Chemical Engineering
and Processing: Process Intensification 47, 914-919.
http://dx.doi.org/10.1016/j.cep.2007.02.003
129

EL-BELTAGY, A., GAMEA, G.R., and ESSA, A.H.A. 2007. Solar drying characteristics of
strawberry. Journal of Food Engineering 78, 456-464.
http://dx.doi.org/10.1016/j.jfoodeng.2005.10.015
FELLOWS, P. 2000. Food processing technology: Principles and practice. CRC Press,
Boca Raton, Florida.
FERNANDES, V.C., DOMINGUES, V.F., DE FREITAS, V., DELERUE-MATOS, C., and
MATEUS, N. 2012. Strawberries from integrated pest management and organic
farming: Phenolic composition and antioxidant properties. Food Chemistry 134,
1926-1931. http://dx.doi.org/10.1016/j.foodchem.2012.03.130
FERNANDEZ-PANCHON, M.S., VILLANO, D., TRONCOSO, A.M., and GARCIA-PARRILLA,
M.C. 2008. Antioxidant activity of phenolic compounds: From in vitro results to in
vivo evidence. Critical Reviews in Food Science and Nutrition 48, 649-671.
http://dx.doi.org/10.1080/10408390701761845
FILLION, L., and KILCAST, D. 2002. Consumer perception of crispness and crunchiness
in fruits and vegetables. Food Quality and Preference 13, 23-29.
http://dx.doi.org/10.1016/S0950-3293(01)00053-2
GIAMPIERI, F., TULIPANI, S., ALVAREZ-SUAREZ, J.M., QUILES, J.L., MEZZETTI, B., and
BATTINO, M. 2012. The strawberry: Composition, nutritional quality, and impact on
human health. Nutrition 28, 9-19. http://dx.doi.org/10.1016/j.nut.2011.08.009
GUINÉ, R.P.F., and BARROCA, M.J. 2012. Effect of drying treatments on texture and
color of vegetables (pumpkin and green pepper). Food and Bioproducts Processing
90, 58-63. http://dx.doi.org/10.1016/j.fbp.2011.01.003
HADDAD, J., and ALLAF, K. 2007. A study of the impact of instantaneous controlled
pressure drop on the trypsin inhibitors of soybean. Journal of Food Engineering 79,
353-357. http://dx.doi.org/10.1016/j.jfoodeng.2006.01.066
HALVORSEN, B.L., CARLSEN, M.H., PHILLIPS, K.M., BØHN, S.K., HOLTE, K., JACOBS,
D.R., and BLOMHOFF, R. 2006. Content of redox-active compounds (ie, antioxidants)
in foods consumed in the united states. The American Journal of Clinical Nutrition 84,
95-135.
130

HAMMAMI, C., and RENÉ, F. 1997. Determination of freeze-drying process variables
for strawberries. Journal of Food Engineering 32, 133-154.
HANCOCK, J.F., SJULIN, T.M., and LOBOS, G.A. 2008. Strawberries temperate fruit
crop breeding. In J.F. Hancock, ed. Springer Netherlands, pp. 393-437.
HANNUM, S.M. 2004. Potential impact of strawberries on human health: A review of
the science. Critical Reviews in Food Science and Nutrition 44, 1-17.
http://dx.doi.org/10.1080/10408690490263756
HARRIS, L.J. 2007. Strawberries: Safe methods to store, preserve, and enjoy In ANR
Catalog. University of California, Agriculture and Natural Resources, pp. 15 pp.
HARTMANN, A., PATZ, C.-D., ANDLAUER, W., DIETRICH, H., and LUDWIG, M. 2008.
Influence of processing on quality parameters of strawberries. Journal of Agricultural
and Food Chemistry 56, 9484-9489. http://dx.doi.org/10.1021/jf801555q
HERRERA, M.C., and LUQUE DE CASTRO, M.D. 2005. Ultrasound-assisted extraction
of phenolic compounds from strawberries prior to liquid chromatographic
separation and photodiode array ultraviolet detection. Journal of Chromatography A
1100, 1-7. http://dx.doi.org/10.1016/j.chroma.2005.09.021
HOLZWARTH, M., KORHUMMEL, S., CARLE, R., and KAMMERER, D.R. 2012.
Evaluation of the effects of different freezing and thawing methods on color,
polyphenol and ascorbic acid retention in strawberries (fragaria x ananassa duch.).
Food Research International 48, 241-248.
http://dx.doi.org/10.1016/j.foodres.2012.04.004
HUNG, P.V., and DUY, T.L. 2012. Effects of drying methods on bioactive compounds
of vegetables and correlation between bioactive compounds and their antioxidants.
International Food Research Journal 19, 327-332.
IOANNOU, I., and GHOUL, M. 2012. Biological activities and effects of food
processing on flavonoids as phenolic antioxidants. Advances in Applied
Biotechnology 5. http://dx.doi.org/10.5772/30690
KÄHKÖNEN, M.P., HOPIA, A.I., VUORELA, H.J., RAUHA, J.-P., PIHLAJA, K., KUJALA, T.S.,
and HEINONEN, M. 1999. Antioxidant activity of plant extracts containing phenolic
131
compounds. Journal of Agricultural and Food Chemistry 47, 3954-3962.
http://dx.doi.org/10.1021/jf990146l
KALT, W., FORNEY, C.F., MARTIN, A., and PRIOR, R.L. 1999. Antioxidant capacity,
vitamin c, phenolics, and anthocyanins after fresh storage of small fruits. Journal of
Agricultural and Food Chemistry 47, 4638-4644. http://dx.doi.org/10.1021/jf990266t
KARATHANOS, V.T. 1999. Determination of water content of dried fruits by drying
kinetics. Journal of Food Engineering 39, 337-344. http://dx.doi.org/10.1016/s0260-
8774(98)00132-0
KROKIDA, M.K., ZOGZAS, N.P., and MAROULIS, Z.B. 1997. Modelling shrinkage and
porosity during vacuum dehydration. International Journal of Food Science &
Technology 32, 445-458. http://dx.doi.org/10.1111/j.1365-2621.1997.tb02119.x
LIU, R.H. 2004. Potential synergy of phytochemicals in cancer prevention:
Mechanism of action. The Journal of Nutrition 134, 3479S-3485S.
LOUKA, N., and ALLAF, K. 2004. Expansion ratio and color improvement of dried
vegetables texturized by a new process “controlled sudden decompression to the
vacuum”: Application to potatoes, carrots and onions. Journal of Food Engineering
65, 233-243. http://dx.doi.org/10.1016/j.jfoodeng.2004.01.020
LUYTEN, H., J. PLIJTER, J., and VAN VLIET, T.O.N. 2004. Crispy/crunchy crusts of
cellular solid foods: A literature review with discussion. Journal of Texture Studies 35,
445-492. http://dx.doi.org/10.1111/j.1745-4603.2004.35501.x
MAACHE-REZZOUG, Z., BOUVIER, J.-M., ALLAF, K., and PATRAS, C. 1998. Effect of
principal ingredients on rheological behaviour of biscuit dough and on quality of
biscuits. Journal of Food Engineering 35, 23-42. http://dx.doi.org/10.1016/S0260-
8774(98)00017-X
MARQUES, L.G., PRADO, M.M., and FREIRE, J.T. 2009. Rehydration characteristics of
freeze-dried tropical fruits. LWT - Food Science and Technology 42, 1232-1237.
MARQUES, L.G., SILVEIRA, A.M., and FREIRE, J.T. 2006. Freeze-drying characteristics
of tropical fruits. Drying Technology 24, 457-463.
http://dx.doi.org/10.1080/07373930600611919
132

MASKAN, M. 2001. Drying, shrinkage and rehydration characteristics of kiwifruits
during hot air and microwave drying. Journal of Food Engineering 48, 177-182.
http://dx.doi.org/10.1016/S0260-8774(00)00155-2
MAZZA, G.J. 2007. Anthocyanins and heart health. Annali dell'Istituto Superiore di
Sanità 43, 369-374.
MEDA, L., and RATTI, C. 2005. Rehydration of freeze-dried strawberries at varying
temperatures. Journal of Food Process Engineering 28, 233-246.
http://dx.doi.org/10.1111/j.1745-4530.2005.00404.x
MINTE. 2010. Consumer snacking uk-2010. In
http://academic.mintel.com/display/480788/#.
MODISE, D.M. 2008. Does freezing and thawing affect the volatile profile of
strawberry fruit (fragaria x ananassa duch.)? Postharvest Biology and Technology 50,
25-30. http://dx.doi.org/10.1016/j.postharvbio.2008.03.009
MONTERO, T.M., MOLLÁ, E.M., ESTEBAN, R.M., and LÓPEZ-ANDRÉU, F.J. 1996.
Quality attributes of strawberry during ripening. Scientia Horticulturae 65, 239-250.
http://dx.doi.org/10.1016/0304-4238(96)00892-8
MOUNIR, S., and ALLAF, K. 2009. Study and modeling of dehydration and rehydration
kinetics within porous medium. . Association Française de Séchage pour l'Industrie et
l'Agriculture - AFSIA Lyon, France2009.
MOUNIR, S., ALLAF, T., MUJUMDAR, A.S., and ALLAF, K. 2012. Swell drying: Coupling
instant controlled pressure drop dic to standard convection drying processes to
intensify transfer phenomena and improve quality—an overview. Drying Technology
30, 1508-1531. http://dx.doi.org/10.1080/07373937.2012.693145
MOUNIR, S., BESOMBES, C., AL-BITAR, N., and ALLAF, K. 2011. Study of instant
controlled pressure drop dic treatment in manufacturing snack and expanded
granule powder of apple and onion. Drying Technology 29, 331-341.
http://dx.doi.org/10.1080/07373937.2010.491585
OEY, I., LILLE, M., VAN LOEY, A., and HENDRICKX, M. 2008. Effect of high-pressure
processing on colour, texture and flavour of fruit- and vegetable-based food
133

products: A review. Trends in Food Science & Technology 19, 320-328.
http://dx.doi.org/10.1016/j.tifs.2008.04.001
OOMAH, B.D., CARDADOR-MARTÍNEZ, A., and LOARCA-PIÑA, G. 2005. Phenolics and
antioxidative activities in common beans (phaseolus vulgaris l). Journal of the
Science of Food and Agriculture 85, 935-942. http://dx.doi.org/10.1002/jsfa.2019
PANICO, A.M., GARUFI, F., NITTO, S., DI MAURO, R., LONGHITANO, R.C., MAGRÌ, G.,
CATALFO, A., SERRENTINO, M.E., and DE GUIDI, G. 2009. Antioxidant activity and
phenolic content of strawberry genotypes from fragaria x ananassa. Pharmaceutical
Biology 47, 203-208. http://dx.doi.org/10.1080/13880200802462337
PATRAS, A., BRUNTON, N.P., DA PIEVE, S., and BUTLER, F. 2009. Impact of high
pressure processing on total antioxidant activity, phenolic, ascorbic acid,
anthocyanin content and colour of strawberry and blackberry purées. Innovative
Food Science & Emerging Technologies 10, 308-313.
http://dx.doi.org/10.1016/j.ifset.2008.12.004
POTTER, R., STOJCESKA, V., and PLUNKETT, A. 2013. The use of fruit powders in
extruded snacks suitable for children's diets. LWT - Food Science and Technology 51,
537-544. http://dx.doi.org/10.1016/j.lwt.2012.11.015
QUIDEAU, S. 2006. Flavonoids. Chemistry, biochemistry and applications. Edited by
øyvind m. Andersen and kenneth r. Markham. Angewandte Chemie International
Edition 45, 6786-6787. http://dx.doi.org/10.1002/anie.200685399
RATTI, C. 2001. Hot air and freeze-drying of high-value foods: A review. Journal of
Food Engineering 49, 311-319. http://dx.doi.org/10.1016/S0260-8774(00)00228-4
RE, R., PELLEGRINI, N., PROTEGGENTE, A., PANNALA, A., YANG, M., and RICE-EVANS,
C. 1999. Antioxidant activity applying an improved abts radical cation decolorization
assay. Free Radical Biology and Medicine 26, 1231-1237.
http://dx.doi.org/10.1016/S0891-5849(98)00315-3
ROHM, H. 1990. Consumer awareness of food texture in Austria. Journal of Texture
Studies 21, 363-374. http://dx.doi.org/10.1111/j.1745-4603.1990.tb00485.x
134

ROUDAUT, G., DACREMONT, C., VALLÈS PÀMIES, B., COLAS, B., and LE MESTE, M.
2002. Crispness: A critical review on sensory and material science approaches.
Trends in Food Science & Technology 13, 217-227. http://dx.doi.org/10.1016/S0924-
2244(02)00139-5
SAELEAW, M., and SCHLEINING, G. 2011. A review: Crispness in dry foods and quality
measurements based on acoustic–mechanical destructive techniques. Journal of
Food Engineering 105, 387-399. http://dx.doi.org/10.1016/j.jfoodeng.2011.03.012
SCALZO, J., POLITI, A., PELLEGRINI, N., MEZZETTI, B., and BATTINO, M. 2005. Plant
genotype affects total antioxidant capacity and phenolic contents in fruit. Nutrition
21, 207-213. http://dx.doi.org/10.1016/j.nut.2004.03.025
SCHIERBAUM. 1965. Van arsdel, w. B.: Food dehydration. Vol. I. Principles. Avi
publishing company, inc., westport, conn. 1963. Ix, 185 s, gr.-8°, mit 50 abb., 12 tab.,
geb., preis 11 $. Starch - Stärke 17, 103-104. 10.1002/star.19650170313
SEERAM, N.P., LEE, R., SCHEULLER, H.S., and HEBER, D. 2006. Identification of
phenolic compounds in strawberries by liquid chromatography electrospray
ionization mass spectroscopy. Food Chemistry 97, 1-11.
http://dx.doi.org/10.1016/j.foodchem.2005.02.047
SHISHEHGARHA, F., MAKHLOUF, J., and RATTI, C. 2002. Freeze-drying characteristics
of strawberries. Drying Technology 20, 131-145. http://dx.doi.org/10.1081/DRT-
120001370
SHUKLA, S. 2011. Freeze drying process: A review International Journal of
Pharmaceutical Science and Research 2, 3061-3068.
SINGLETON, V.L., ORTHOFER, R., and LAMUELA-RAVENTÓS, R.M. 1999. Analysis of
total phenols and other oxidation substrates and antioxidants by means of folin-
ciocalteu reagent. In Methods in enzymology. P. Lester, ed. Academic Press, pp.
152-178.
SUTHANTHANGJAI, W., KAJDA, P., and ZABETAKIS, I. 2005. The effect of high
hydrostatic pressure on the anthocyanins of raspberry (rubus idaeus). Food
Chemistry 90, 193-197. http://dx.doi.org/10.1016/j.foodchem.2004.03.050
135

SZCZESNIAK, A.S. 1988. The meaning of textural characteristics - crispness. Journal of
Texture Studies 19, 51-59. http://dx.doi.org/10.1111/j.1745-4603.1988.tb00924.x
TOONTOM, N., MEENUNE, M., POSRI, W.A., and LERTSIRI, S. 2012. Effect of drying
method on physical and chemical quality, hotness and volatile flavour characteristics
of dried chilli. International Food Research Journal 19, 1023-1031.
TULIPANI, S., MEZZETTI, B., CAPOCASA, F., BOMPADRE, S., BEEKWILDER, J., DE VOS,
C.H.R., CAPANOGLU, E., BOVY, A., and BATTINO, M. 2008. Antioxidants, phenolic
compounds, and nutritional quality of different strawberry genotypes. Journal of
Agricultural and Food Chemistry 56, 696-704. http://dx.doi.org/10.1021/jf0719959
VAN HECKE, E., ALLAF, K., and BOUVIER, J.M. 1998. Texture and structure of crispy-
puffed food products part ii: Mechanical properties in puncture. Journal of Texture
Studies 29, 617-632. http://dx.doi.org/10.1111/j.1745-4603.1998.tb00189.x
WANG, H., CAO, G., and PRIOR, R.L. 1996. Total antioxidant capacity of fruits. Journal
of Agricultural and Food Chemistry 44, 701-705.
http://dx.doi.org/10.1021/jf950579y
WANG, S.Y., and MILLNER, P. 2009. Effect of different cultural systems on
antioxidant capacity, phenolic content, and fruit quality of strawberries (fragaria ×
aranassa duch.). Journal of Agricultural and Food Chemistry 57, 9651-9657.
http://dx.doi.org/10.1021/jf9020575
WATANABE, Y., YOSHIMOTO, K., OKADA, Y., and NOMURA, M. 2011. Effect of
impregnation using sucrose solution on stability of anthocyanin in strawberry jam.
LWT - Food Science and Technology 44, 891-895.
http://dx.doi.org/10.1016/j.lwt.2010.11.003
WESCHE-EBELING, P., and MONTGOMERY, M.W. 1990. Strawberry
polyphenoloxidase: Its role in anthocyanin degradation. Journal of Food Science 55,
731-734. http://dx.doi.org/10.1111/j.1365-2621.1990.tb05217.x
ZHAO, Y. 2007. Berry fruit value-added products for health promotion. In C.P.T.F.
Group, ed.Boca Raton, Florida, USA pp. 448.
136
"Faostat". Food and Agriculture Organization of the United Nations. Faostat.fao.org.
http://faostat.fao.org/site/567/DesktopDefault.aspx?PageID=567#ancor. Retrieved
2013-03-09.
“SIAP”. Servicio de Información Agroalimentaria y Pesquera, Mexico. SIAP.gob.mx.
http://www.siap.gob.mx/index.php?option=com_content&view=article&id=170&Ite
mid=80. Retrieved 2013-03-09
“USDA”. United States Department of Agriculture: National Agricultural Statistics
Service. Usda.gov. http://quickstats.nass.usda.gov/results/46419ED8-9E7C-3C33-
AC12-518977236987?pivot=short_desc. Retrieved 2013-03-09
“CSC”. California Strawberry Commission:
http://www.calstrawberry.com/health/rhprofessionals.asp
“NCCIA”. North Carolina Crop Improvement Association:
http://www.nccrop.com/varieties.php/17/Strawberry_Plants
137