Point elementary school team- ximena, grace and audrey-basket of hope-2957
Maritime Disruptions Management
Research Student: Saut GurningMain Supervisor: Dr. Stephen Cahoon
Second Supervisor: Dr. Owen

Changes, the important issue !!!
in :
- System environment
- Unpredictable events
- System parameters
- Availability of resources
- New restrictions
- System Performance
- New considerations
POSITIVE
NEGATIVE
RISKS
= function (frequency, consequences)

Supply-Chain Risks
Uncertainties Disturbances
Delay Deviation Disruption Disaster
Related to risks as Disruption Risks
Clausen et al.(2001a,
p. 41)
“A state during the execution of the current
operation, where the deviation from plan is
sufficiently large that the plan has to be
changed substantially”.
Yu and Gi (2004)
“Various unanticipated events caused by
internal and external factors which significantly
deviate original plans of a system and
consequently affect its performance severely”
Events in Supply Chain as Supply Chain Disruption
Craighead et al. (2007,
p.132)
“Unplanned and unanticipated events that
disrupt the normal flow of goods and materials
within a supply chain and, as a consequence,
expose firms within the supply chain to
operational and financial risks”.
Disruptions in Maritime
Bearing-Point &
Hewlett-Packard
(2005, p.2)
“The maritime industry is directly
impacted by a variety of disruptions
to the flow of legitimate trade and
travel. These range from minor
weather disruptions to hurricanes
and typhoons, from workforce
shortages to work stoppages and
from security breaches to potential
Terrorist attacks”.
ImpactFrequency
DirectIndirect
MajorMinor

Disturbances
Stage One (delay) or the first stage through which a risk passes is referred to as the delay stage; here the focus is on the recurrent changes displayed by the performance of a supply-chain and the cancelation of previous planned (Wright 2008; Zsidisin & Smith 2005).

Disturbances
Stage Two is the deviation stage when one or more performance parameters of a supply-chain diverge from their estimated or mean value, without significant transformation to original supply-chain structure (Gaonkar & Viswanadham 2007)

Disturbances
Stage Three is the disruption stage which occurs when existing services are unavailable due to direct and indirect factors interrupting the services’ provisions (Gaonkar & Viswanadham 2007; Handfield et al. 2008; Yu & Qi 2004).

Disturbances
The last stage is the disaster stage which results in a service platform being damaged and as a consequence, supply-chain entities are unable to provide services (Chang 2000; Gaonkar & Viswanadham 2007).

Hypothesis of Disruption Stages
Time
Ser
vice
var
iab
el
det
erio
rati
on
Delay Deviation Disruption Disaster
Flat zonal rate
Sacrificing Phase
D2
D3
D1
D4
D5

Maritime Disruptions and its impacts(Explorative Study and Literatures)
TYPE OF MARITIME DISRUPTION RISKSDIRECT INDIRECTSecurity and safety Market
- Ship accidents - Shortage of Demand
- Ship pollution - Shortage of ships
- Political events - Financial Crisis
- Terrorist attack - Trade imbalance
Service related factors Organisation and relationship
- Operational and equipment - Employment / Port Workers
- Competition - Legal and policy
- Fuel and bunkering - Resource
- Electrical shortage - Customs process
- Congestion - Ships inspection
- Infrastructure related factors Environmental
- Communication facility - Severe weather
- Lack of development - Earthquakes
- Inland transport connections - Flood

Summary of factors identified in major studies as causes of maritime disruptions
Ak
aha
198
6
Rose
et
al.
199
7
Chan
g 2
000
Ram
age
200
1
Wata
nabe
200
2
Conn
olly
200
4
Ale
xan
der
and I
rwin
2005
Bea
rin
gP
oin
t 2
005
Chu a
nd
Hans
en 2
005
Coy
et
al.
200
5
Davi
s e
t al
200
5
Earl
y-W
arn
ing 2
00
5
Fritt
elli
200
5
Kle
indorf
er
and
Saa
d 2
005
Arn
old
et
al.
2006
CS
A 2
00
6
Shu
ltz 2
00
6
Auc
klan
d 2
007
Bu
sine
ss L
ine 2
007
CB
C 2
00
7
Con
rad e
t al 2
007
Dru
m 2
007
Hege
r 200
7
Mahb
ub 2
007
Pe
ttit
200
7
Reute
rs 2
00
7
Yan
k 2
007
Bro
wn
200
8
Gurn
ing 2
008
Horl
ock
200
8
Robe
rt 2
00
8
Said
i 200
8
Seb
a 2
00
8
Str
atfor
200
8
Todd
200
8
Tsu
kim
ori
and
Juk
wey
200
8
Wrig
ht
200
8
Nig
hti
ngale
, 20
08
NO Disruptive Events
1 Security issues • • • •
2 Political events • • •
3 Rail related operation • •
4 Port strikes • • • • • • • •
5 Customs & administration • • •
6 Severe weather condition • • • • • • • • • • • •
7 Earthquakes • • • •
8 Electrical outages • •
9 Equipment down / shortage • •
10 Empty containers •
11 Ship accidents in port areas • • •
12 Shipping-Port disputes •
13 Port congestion • • • •
14 Ship shortages • • •
15 Fuel and bunkering Costs •
16 Inland accesibilty problems • •
17 Telecomunication system •
18 Shortage of service demand •
Researchers and Factors Identified / Discussed

4
5
8
3
7
6
1
3
8
9
4
5
2
6
7
1
2
3
4
6
1
2
3
5
Ships High Wind Power failure
Accidents
Lack of pilotage Heavy snow
Service & tug-boat and rain
Clearance of
Medical &
Quarantine Checks
Port Strikes / Immigration
Labor shortage
Downstream
intermodal
problems
Ships shortage Cranes Disabled
Hazardous Spill Straddle Carriers
In shops
Low tide level Shortage of chassis Cargo verified Customs
to work vessel By customs Clearance
Severe WaveShip’s Fire Accident Lack of
Roads,
bridges &
Access lanesEarthquake
Shortage of handling Overloaded
equipments Container area
Disruption before Disruption Disruption at Disruption
at Port platformPort Channel in waterways Port Berth
Problems in
nearby port
Coast guard
delaying
boarding and
clearance
II (PORT CHANNEL) III (BERTHING AREA) IV (PORT YARD)
2
4
5
8
3
7
6
1
3
8
9
4
5
2
6
7
1
2
3Process
4Terminal & port
Computer system
Crash / down
5
1
4
Flooding
I (PORT V (ADM PROCESS) VI (INLAND)
Diagram of Possible Direct Maritime Disruptive Events
Disruption
In Inland area
Disruption
In port
SCM network

WHEAT SUPPLY CHAIN IN AUSTRALIA AND INDONESIA
Farmers Handlers Processors Distributors
Sub
Wholesalers Retailers Consumers
Farm Scale
Southern-Belt
Wheat Area
High Rain Fall
Special Area
AWB Limited
Grain Pool
Agra-Corp
Premium
Grain
Brooks Grain
ABB
Mortons
Aus-Wheat
Millers For
Animal
Feeds
Millers For
Human
Foods
Processors
For
Beverage
Processors
For Ethanol /
Bio-Fuel
Industrial
Consumers
Big Industry
Small
Medium
Enterprise
Household
End
Consumer
Export
Markets
Domestic
Markets
Agents
Marketers
Freight
Forwarders
Storage and
Handling
Global Supply Chain Networking
National and Local Wholesalers and
Retailers Chains
Food Retail Services and Small Shops
Wholesalers
Third Party Suppliers

THE ILLUSTRATION OF RESEARCH SCENARIO
Farmers Handlers Processors
Maritime Distributors
& Handling
Wholesalers Retailers Consumers
Shipping
Ports
Forwarders
Shippers
Consignees
Tim
e, costs
, volu
mes
Tim
e, costs
, volu
mes
Tim
e, costs
, volu
mes
Tim
e, costs
, volu
mes
Tim
e, costs
, volu
mes
Tim
e, costs
, volu
mes
Effecting Factors / Affecting issues on three layers of upstream chain
Global and common wheat chain as
research perspective and objective
DISRUPTION
ANALYSIS &
THEORY IN
MARITIME
WHEAT CHAIN
MODELING &
WHAT IF
SCENARIOS
MITIGATION
IDENTIFICATION
&STRATEGIES
USING CASE
STUDY BASED
APPROACH
Focal PointFocal Point
Effecting Factors / Affecting issues on three layers of downstream
1
53 42
Disruption MitigationOther trade chain Maritime Disruption Model
Prepared on Wed, 9/20/2010, 15.30 PM

Logical Process of Maritime Disruptions on Wheat-Trade
Demand Over Supply
Diversification of cons
Natural Problems
Change of Diets
Marketing Arrangements
Severe wave and wind
Political / Security
Inland Congestions
Port Congestions
Strikes
Customs and Quarantine
Shortage of ships
Port Rail Services Post-disruptions
Natural Hazard
Operational
Maritime
Disruption
Mitigation and
Responses
Pre disruption events
On going disruptive events
Basic drivers
In Wheat Chain
Goals
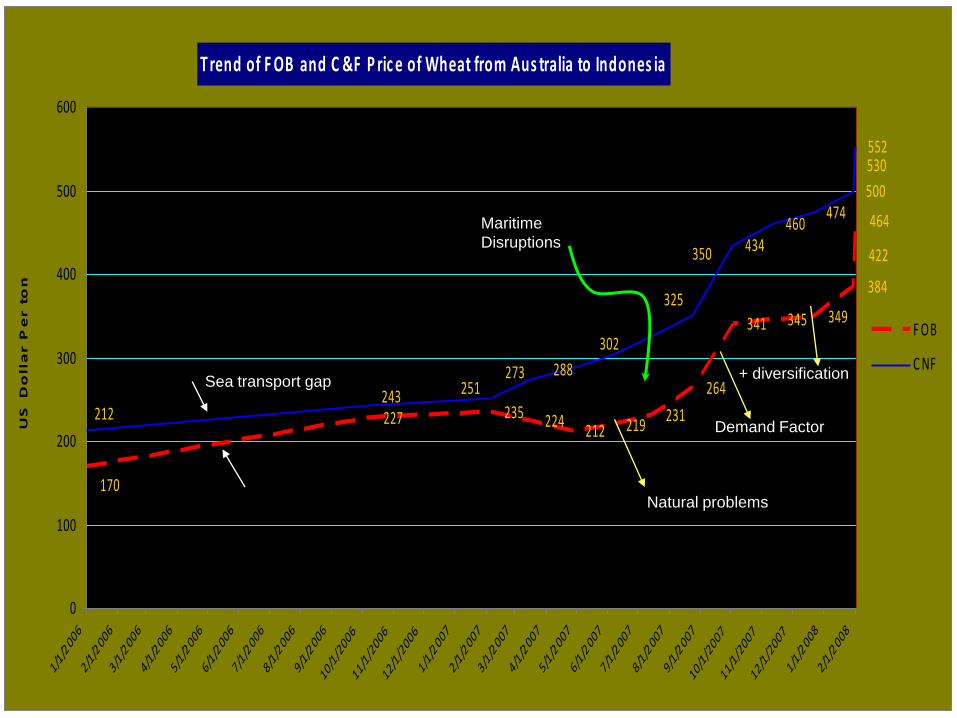
T rend of F OB and C &F P ric e of Wheat from Aus tralia to Indones ia
227 235 224212 219
231
264
341 345 349
384
422
464
434460
474500
530552
170
350
325
302
288273251243
212
0
100
200
300
400
500
600
1/1/200
6
2/1/200
6
3/1/200
6
4/1/200
6
5/1/200
6
6/1/200
6
7/1/200
6
8/1/200
6
9/1/200
6
10/1/2
006
11/1/2
006
12/1/2
006
1/1/200
7
2/1/200
7
3/1/200
7
4/1/200
7
5/1/200
7
6/1/200
7
7/1/200
7
8/1/200
7
9/1/200
7
10/1/2
007
11/1/2
007
12/1/2
007
1/1/200
8
2/1/200
8
US
Do
lla
r P
er t
on
F OB
C NF
Natural problems
Demand Factor
+ diversificationSea transport gap
Maritime
Disruptions
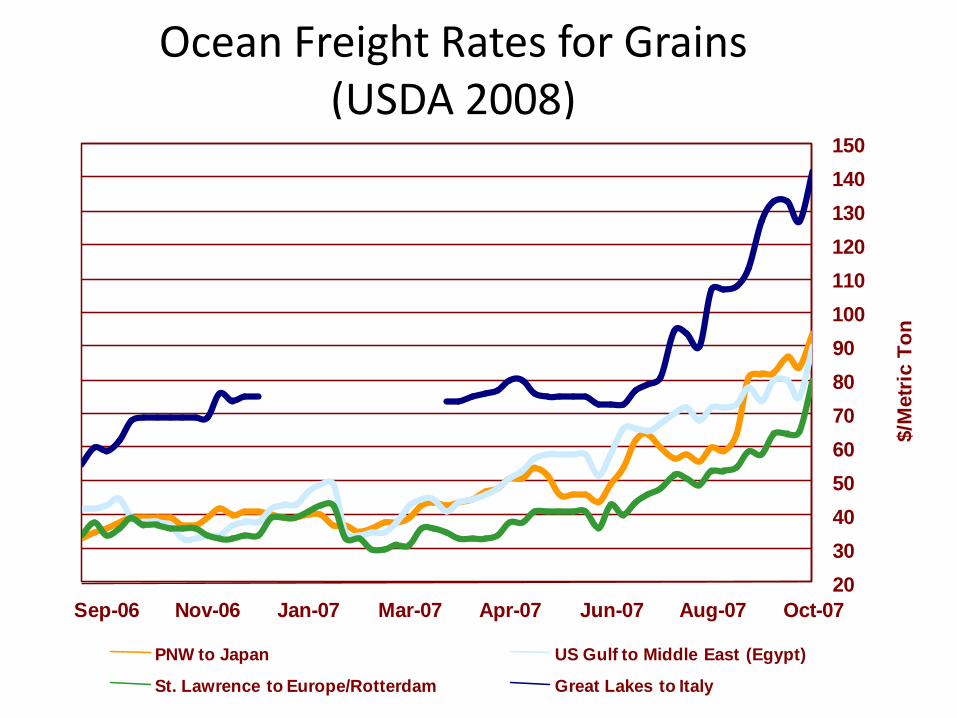
Ocean Freight Rates for Grains (USDA 2008)
20
30
40
50
60
70
80
90
100
110
120
130
140
150
Oct-07Aug-07Jun-07Apr-07Mar-07Jan-07Nov-06Sep-06
$/M
etr
ic T
on
X
X
PNW to Japan US Gulf to Middle East (Egypt)
St. Lawrence to Europe/Rotterdam Great Lakes to Italy

Higher
Financial
Costs
Higher
Financial
Costs
Lower
Demand
Transport
Lower
Demand
TransportParadox Links
Higher Interest rate & FluctuateHigher Interest rate & Fluctuate
Insufficient credit for businessInsufficient credit for business
Difficulties to Open Letter of CreditDifficulties to Open Letter of Credit
Global Economic recessionGlobal Economic recession
The Fall of Commodity PriceThe Fall of Commodity Price
Low Level of Shipping FreightLow Level of Shipping Freight
MARITIME
DISRUPTIONS
IDLE OF
SHIPPING
FLEET
LOWER PORT
TRAFFIC
INTERRUPTION
OF PORT
SERVICES
Higher
Financial
Costs
Higher
Financial
Costs
Lower
Demand
Transport
Lower
Demand
TransportParadox Links
Higher Interest rate & FluctuateHigher Interest rate & Fluctuate
Insufficient credit for businessInsufficient credit for business
Difficulties to Open Letter of CreditDifficulties to Open Letter of Credit
Global Economic recessionGlobal Economic recession
The Fall of Commodity PriceThe Fall of Commodity Price
Low Level of Shipping FreightLow Level of Shipping Freight
MARITIME
DISRUPTIONS
IDLE OF
SHIPPING
FLEET
LOWER PORT
TRAFFIC
INTERRUPTION
OF PORT
SERVICES
Global Financial Crisis and Maritime Disruptions
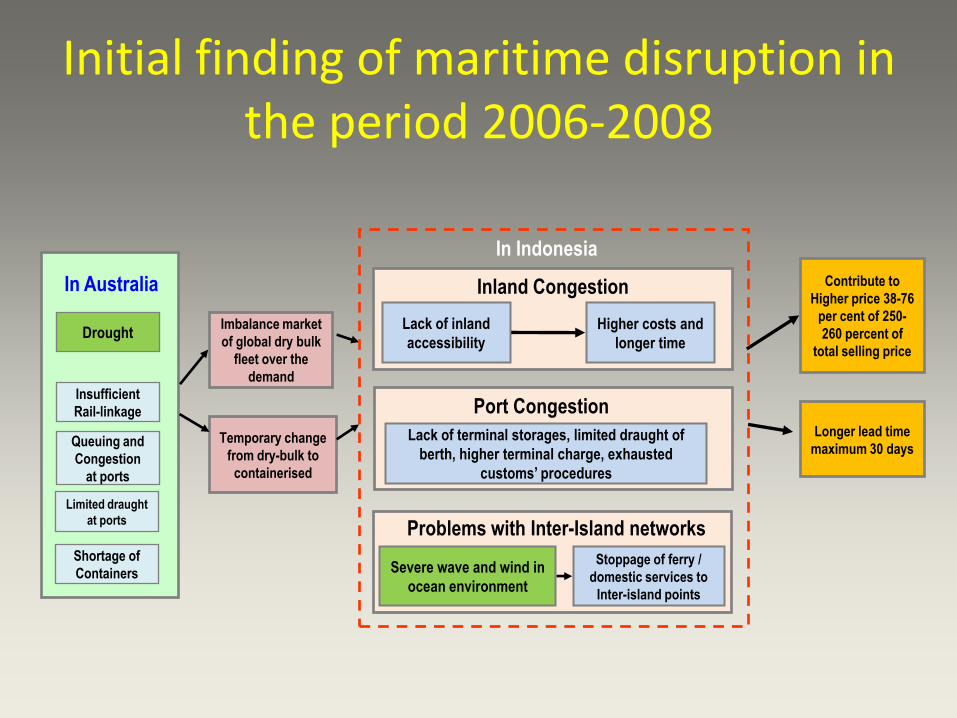
Initial finding of maritime disruption in the period 2006-2008
In Australia
Drought
Insufficient
Rail-linkage
Queuing and
Congestion
at ports
Limited draught
at ports
Shortage of
Containers
Imbalance market
of global dry bulk
fleet over the
demand
Temporary change
from dry-bulk to
containerised
Inland Congestion
Port Congestion
Problems with Inter-Island networks
Lack of inland
accessibility
Higher costs and
longer time
Lack of terminal storages, limited draught of
berth, higher terminal charge, exhausted
customs’ procedures
Severe wave and wind in
ocean environment
Stoppage of ferry /
domestic services to
Inter-island points
Contribute to
Higher price 38-76
per cent of 250-
260 percent of
total selling price
Longer lead time
maximum 30 days
In Indonesia

RESPONSE ON MARITIME DISRUPTIONS
BelawanPriok
PerakTj Emas
BaritoMakassar
Container (TEU)
Bulk (20 tons)
0
500
1000
1500
2000
2500
3000
3500
4000
Cost (US$)Container (TEU)
Bulk (20 tons)
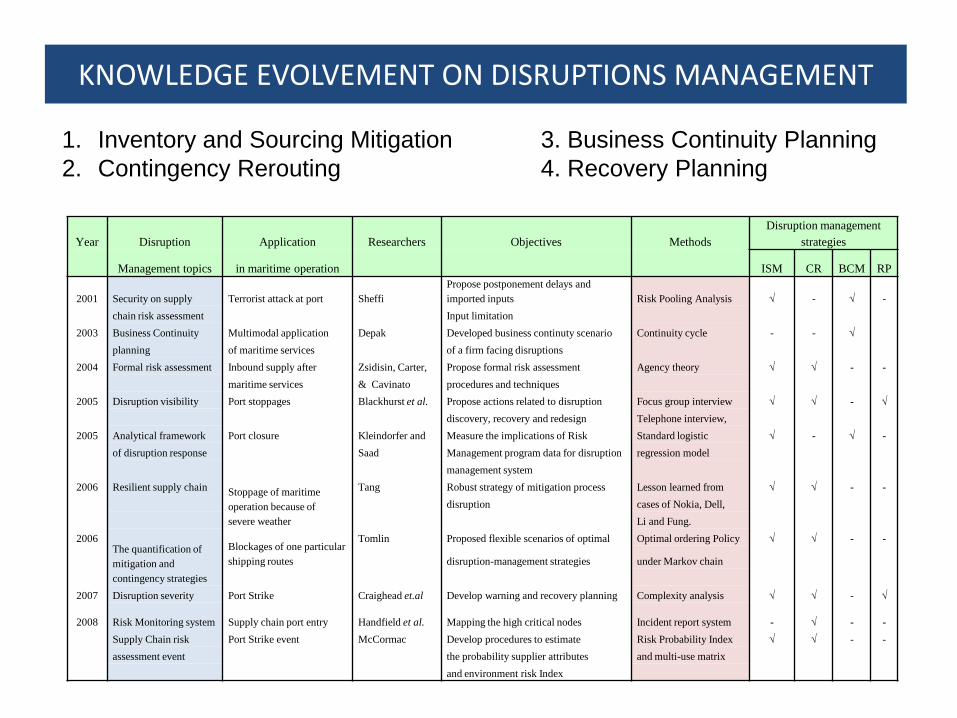
Year Disruption Application Researchers Objectives Methods
Disruption management
strategies
Management topics in maritime operation ISM CR BCM RP
2001 Security on supply Terrorist attack at port Sheffi
Propose postponement delays and
imported inputs Risk Pooling Analysis √ - √ -
chain risk assessment Input limitation
2003 Business Continuity Multimodal application Depak Developed business continuty scenario Continuity cycle - - √
planning of maritime services of a firm facing disruptions
2004 Formal risk assessment Inbound supply after Zsidisin, Carter, Propose formal risk assessment Agency theory √ √ - -
maritime services & Cavinato procedures and techniques
2005 Disruption visibility Port stoppages Blackhurst et al. Propose actions related to disruption Focus group interview √ √ - √
discovery, recovery and redesign Telephone interview,
2005 Analytical framework Port closure Kleindorfer and Measure the implications of Risk Standard logistic √ - √ -
of disruption response Saad Management program data for disruption regression model
management system
2006 Resilient supply chainStoppage of maritime
operation because of
severe weather
Tang Robust strategy of mitigation process Lesson learned from √ √ - -
disruption cases of Nokia, Dell,
Li and Fung.
2006The quantification of
mitigation and
contingency strategies
Blockages of one particular
shipping routes
Tomlin Proposed flexible scenarios of optimal Optimal ordering Policy √ √ - -
disruption-management strategies under Markov chain
2007 Disruption severity Port Strike Craighead et.al Develop warning and recovery planning Complexity analysis √ √ - √
2008 Risk Monitoring system Supply chain port entry Handfield et al. Mapping the high critical nodes Incident report system - √ - -
Supply Chain risk Port Strike event McCormac Develop procedures to estimate Risk Probability Index √ √ - -
assessment event the probability supplier attributes and multi-use matrix
and environment risk Index
KNOWLEDGE EVOLVEMENT ON DISRUPTIONS MANAGEMENT
1. Inventory and Sourcing Mitigation 3. Business Continuity Planning
2. Contingency Rerouting 4. Recovery Planning

Year Researchers Country Stages in Simulation Objectives
maritime flow DEL DEV DISP DST Mitigation Response Recovery Method Assessed I CP CN D
1995 Parlar, Wang & Canada Manufacturers, retailers - x x - - x - Time-homogeneous Period inventory - x - x
Gerchak and Wholesalers Markov chain pattern Level
2002 Jason et al. USA Shipping Channel - - x x x - x Probabilistic risk Probablity of oil - x - x
analysis spill accidents
2004 Conrad USA Port Operations - x x - x x - Long-term economic Port security x - x -
and Queing problems vaibility and risk action plan and
assessment method long term
economic impact
2005 Pachakis and USA Port operation - - x x - x x Seismic Hazard and Downtime analysis - x - x
Kiremidjian Risk assessment analysis and revenue loss
impact
Brian, Erera, and USA Port Operations - - x x x x - Markov Decision The impact of - x - x
White Model with value temporary port
interation algorithim closure
Merrick, Van Dorp, USA Short-sea shipping - - x x x - - Bayesian simulation Model framework - x - x
& Dinesh technique for maritime
uncertainties
2006 Pinto and Wayne USA Port Operations - - x x x x - Risk-based assessment Total loss in - x - x
and risk-based return-on throughput of
investment incident until port
operations restored
Tomlin Canada Manufacturers, retailers - x x - - x - Four-state continuous Average costs - x x -
and Wholesalers time of Markov Chain Functions
2007 Gaonkar and Singapore Port Operations - x x - x - - Simple integer Risk propagation x - - x
Viswanadham and Manufacturers quadratic Markowitz in supply chain
model
2008 Garcia USA Port Operation and - x x - - x x Rerouting Impact x - x -
Inland Transport
2008 Guerrero, Muray, USA Port and Vessel traffic - x x - x x - Large scale integer Restoration/ x - - x
and Flood area programming recovery process
Simulation Needs System ModelRisk Stages
Modelling of maritime risks and its application to supply-chain

Fundamental Approach of Supply-Chain Risks
Uncertainties
Contingency Planning
Stochastic Models
Robust Optimisation
Pure Rescheduling
Disruption Management
Real-time Optimisation
Deviation Costs
Multi-criteria decision making
Returning to Original Plan
Multiple Solutions
Partial Solutions
Multi-criteria decision
making for maritime
Markov-Chain Decision
Process

23
Markov Decision Processes (MDPs)
• MDPs is a decision-theoretic planning and learning problems.
• An MDP is a model M = < S, A, T, R > consisting
a set of environment states S,
a set of actions A,
a transition function T: S A S [0,1]
T(s,a,s’) = Pr (s’| s,a),
a reward function R: S A R .
• A policy is a function : S A.
• Expected cumulative reward -- value function V: S R .
The Bellman Eq.: V(s) = R(s, (s)) + s’T(s, (s),s’) V(s’)

Surveys (mail & in depth telephone interviews)
Items of Research GoalsMethods & Targets
in Australia in Indonesia The Scenario of Survey Questions
Far Col Mil MarOp MarOp Proc Dis Ret
Q.1. Are shippers and consignees aware of the
Mail Survey Telp interview
Output expectd from various question types
disruption that may occur in the maritime Expected targets Dichotomous Checklist Range Open Likert Total
leg of the wheat supply-chain? Ended
A. Disruption Process (including delay, deviation) x x x x √ √ √ √ Recognition & types 1 1 - - - 2
B. Consequences (costs and lead-time) x x x x √ √ √ √ Average level of value - 1 1 1 1 4
C. Frequency (occurency) x x x x √ √ √ √ Probabilistic value - - 1 - - 1
D. Maritime contribution (shipping, port and FF) x x x x √ √ √ √ Categories of events - - - 2 2
E. Dominant and maritime recurrent events x x x x √ √ √ √ Important events - - - - 1 1
Far Col Mil MarOp MarOp Proc Dis Ret Awareness of disruption Sub Total Questions for Q1 10
Q.2. Are shippers and consignees in wheat
Mail Survey Telp interview
Output expectd from various question types
supply-chain implementing supply chain risk Expected targets
assessment or mitigation strategies to minimise Dichotomous Checklist Rank Open Likert Total
disruption events in maritime of both countries Ended
F. Commodity transferred x x x x √ √ √ √ Types of wheat products - 2 - - 1 3
G. Risk assessment strategy x x x x √ √ √ √ Classification and its focuses - 2 - - 1 3
H. Acceptable Consequences x x x x √ √ √ √ Identify the accepted level 1 1 - 1 - 3
J. Mitigation process x x x x √ √ √ √ If exists or not & its stages 1 1 - 1 - 3
K. Contigency plan x x x x √ √ √ √ The detailed goals of minimising - - - - 1 1
L. Respon actions x x x x √ √ √ √ Prevention based and others - - - 1 1 2
M. Information sharing x x x x √ √ √ √ Interactions level with others 1 1 - 1 - 3
Far Col Mil MarOp MarOp Proc Dis Ret Recognize & distinguish responses Sub Total Questions for Q2 18
Q.3. Are current risk mitigation and detection
Online Focus Group Online Focus Group
Output expectd from various question types
processess in maritime operations effective Expected targets Dichotomous Checklist Rank Open Likert Total
in wheat supply-chain systems ? Ended
N. Approach to identify potential disruptions x x x x √ √ √ √ Various prevention methods 2 - 1 - - 3
P. Propagation effect on SC performance x x x x √ √ √ √ Orientation to up/down stream 2 - - 1 1 4
R. Response analysis x x x x √ √ √ √ Response objectives into time frames 1 1 1 - 3
S. Recovery plan x x x x √ √ √ √ Important factors of recovering plan 1 - 1 - 1 3
T. Redesign plan x x x x √ √ √ √ Sifnificant variables of new planning 1 - - 1 - 2
U. Effective mitigation process x x x x √ √ √ √ Detail stages and indicators - 1 - 1 1 3
Far Col Mil MarOp MarOp Proc Dis Ret Operational & real time effectiveness Sub Total Questions for Q3 18
Far: Farmers; Col: Collectors; Mil: Millers; MarOp: Maritime Operations ; Proc: Processors ; Dis: Distributors; Ret: Retailers

Using Studio 8 Academic of Powersim
Wheat in SupplyChain
Initiation Rate
Transport Fleet
Delivery Rate Distribution Rate
Initial Fleet Rate
Unloading Time
Wheat Processingutilisation
Effect of Utilizationon Inland transport
Time
New Order Rate
Port Performance
Port CapacityUtilisation
Effect of CapacityUtilization onHandlind rate
Effect of ShipmentRates on
Distribution
Shipping rate
Effect of Wheatprices
Wheat ProcessingCapacity Normal Wheat
Delivery Time
Scenario
Normal Freight Rate
Average NewWheat Order Rate
Average SC-time
Average NewWheat Order Rate
Normal WheatDelivery Time
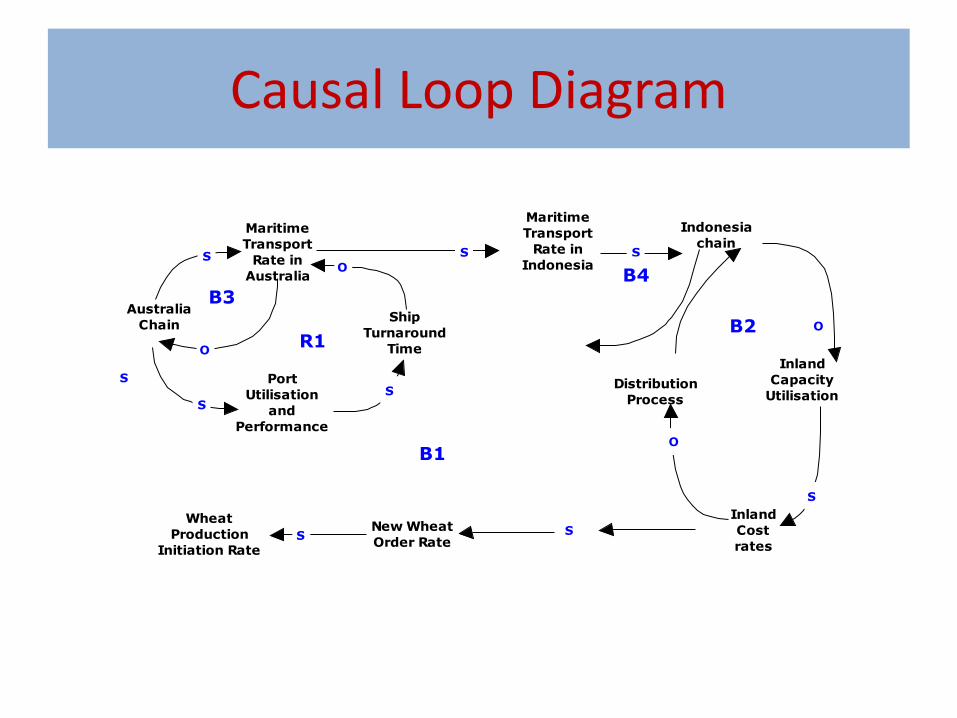
Causal Loop Diagram
Maritime
Transport
Rate in
Australia
Australia
Chain
Port
Utilisation
and
Performance
Wheat
Production
Initiation Rate
New Wheat
Order Rate
Inland
Cost
rates
Ship
Turnaround
Time
Indonesia
chain
Distribution
Process
Inland
Capacity
Utilisation
S S
S
SS
S
SS
O
O
O
O
R1
B3
B1
B2
Maritime
Transport
Rate in
IndonesiaS
B4

Parameters in Maritime Disruptions Model
• Wheat Supply-Chain Performance Indicators (time, costs, and unit volume) .
• Maritime Operational Performance
Throughput
Service Capacity
Service Platforms
• Decision Support Indicators in mitigation, response, recovery
• Continuity Target and Plan

Jan 01, 2008 Jan 01, 20585
10
15
20
25
30
whv
Current
Reference
Wh
ea
t in
Su
pp
ly
Ch
ain
Non-commercial use only!
Jan 01, 2008 Jan 01, 2058
100
110
120
130
140
whv
Current
Reference
Tra
nsp
ort F
lee
t
Non-commercial use only!
Jan 01, 2008
100,000
150,000
200,000
USD/da
Current
Reference
Sh
ipp
ing
ra
te
Non-commercial use only!
Jan 01, 2008 Jan 01, 2028 Jan 01, 2048
2
4
6
8
whv/yr
Delivery Rate
Distribution Rate
Initiation Rate
Non-commercial use only!
Jan 01, 2008
2
4
6
8
whv/yr
Current
Reference
Ne
w O
rd
er R
ate
Non-commercial use only!
Jan 01, 2008 Jan 01, 20580
5
10
15
20
25
30
whv
Current
Reference
Wh
ea
t in
Su
pp
ly
Ch
ain
Non-commercial use only!
Jan 01, 2008 Jan 01, 2058
80
90
100
110
120
130
140
whv
Current
Reference
Tra
nsp
ort F
lee
t
Non-commercial use only!
Jan 01, 2008
100,000
150,000
200,000
USD/da
Current
Reference
Sh
ipp
ing
ra
te
Non-commercial use only!
Jan 01, 2008 Jan 01, 2028 Jan 01, 20480.0
0.5
1.0
1.5
2.0
2.5
whv/yr
Delivery Rate
Distribution Rate
Initiation Rate
Non-commercial use only!
Jan 01, 20080
3
6
whv/yr
Current
Reference
Ne
w O
rd
er R
ate
Non-commercial use only!
With
Effective
Mitigation
Without
Effective
Mitigation
Temporary Results of Maritime Disruption of Global Credit Crunch on Wheat Supply-Chain
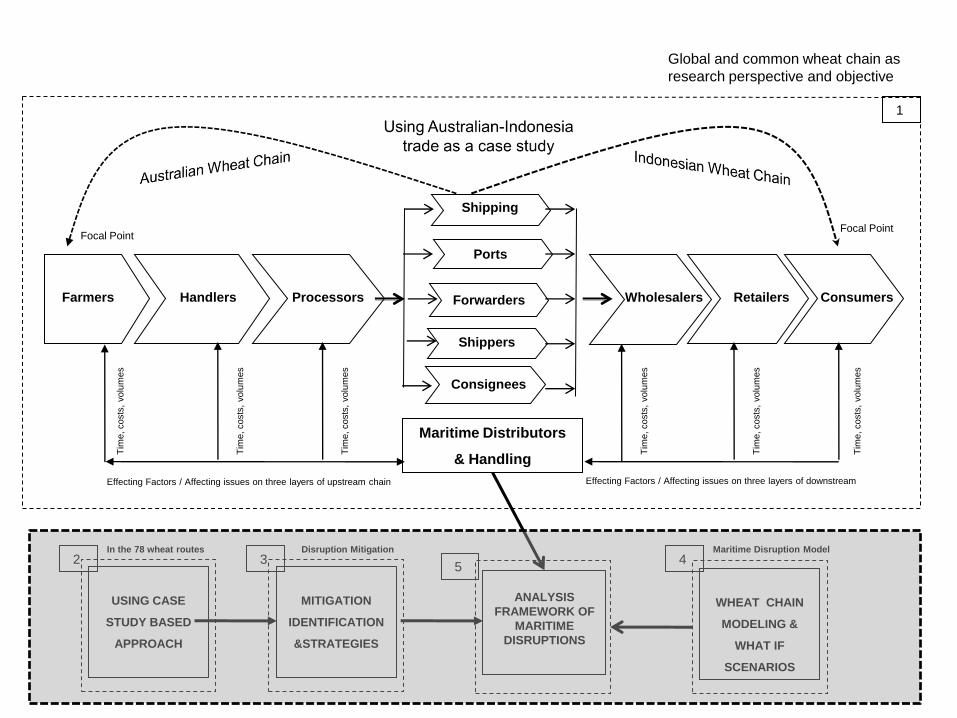
Farmers Handlers Processors
Maritime Distributors
& Handling
Wholesalers Retailers Consumers
Shipping
Ports
Forwarders
Shippers
Consignees
Tim
e, costs
, volu
mes
Tim
e, costs
, volu
mes
Tim
e, costs
, volu
mes
Tim
e, costs
, volu
mes
Tim
e, costs
, volu
mes
Tim
e, costs
, volu
mes
Effecting Factors / Affecting issues on three layers of upstream chain
Global and common wheat chain as
research perspective and objective
ANALYSIS
FRAMEWORK OF
MARITIME
DISRUPTIONS
WHEAT CHAIN
MODELING &
WHAT IF
SCENARIOS
MITIGATION
IDENTIFICATION
&STRATEGIES
USING CASE
STUDY BASED
APPROACH
Focal PointFocal Point
Effecting Factors / Affecting issues on three layers of downstream
1
53 42
Disruption MitigationIn the 78 wheat routes Maritime Disruption Model