MARION COUNTY - Tennessee State Government - TN.gov · Marion County’s landfill is operated by...
34
1 Southeast Tennessee Municipal Solid Waste Region MARION COUNTY Solid Waste Needs Assessment Fiscal Year 2016
Transcript of MARION COUNTY - Tennessee State Government - TN.gov · Marion County’s landfill is operated by...

1
Southeast Tennessee Municipal Solid Waste Region
MARION COUNTY
Solid Waste Needs Assessment
Fiscal Year 2016
2
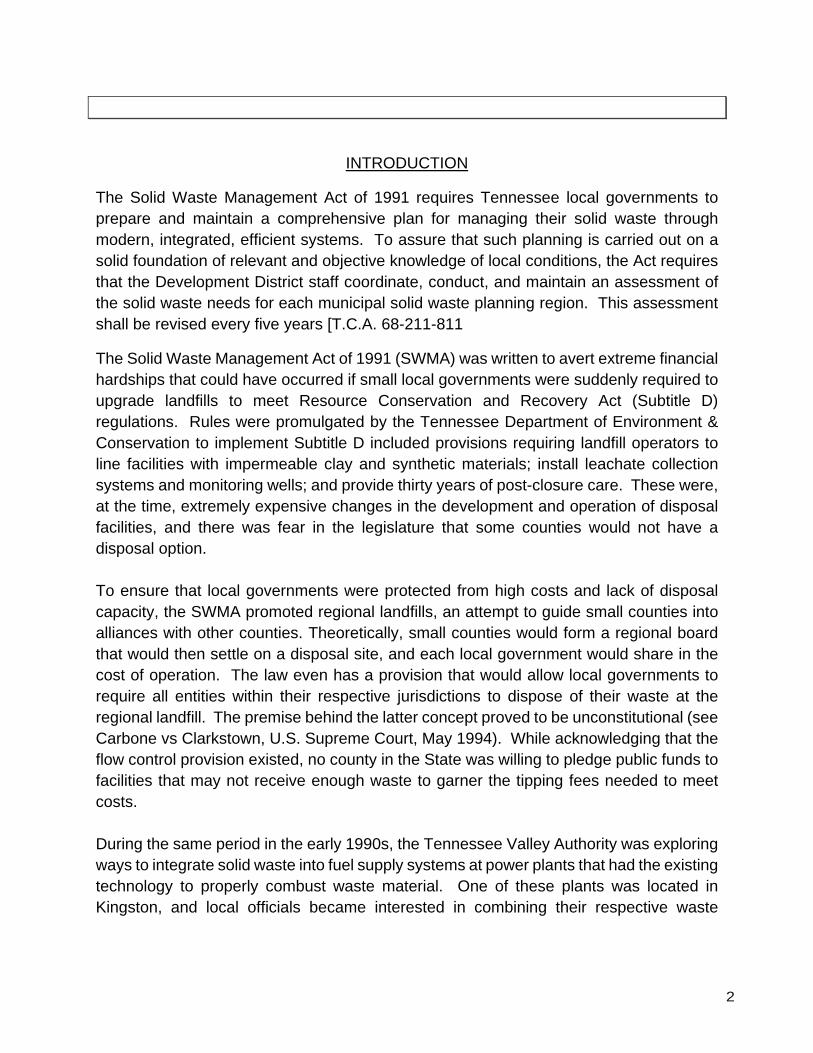
INTRODUCTION
The Solid Waste Management Act of 1991 requires Tennessee local governments to prepare and maintain a comprehensive plan for managing their solid waste through modern, integrated, efficient systems. To assure that such planning is carried out on a solid foundation of relevant and objective knowledge of local conditions, the Act requires that the Development District staff coordinate, conduct, and maintain an assessment of the solid waste needs for each municipal solid waste planning region. This assessment shall be revised every five years [T.C.A. 68-211-811
The Solid Waste Management Act of 1991 (SWMA) was written to avert extreme financial hardships that could have occurred if small local governments were suddenly required to upgrade landfills to meet Resource Conservation and Recovery Act (Subtitle D) regulations. Rules were promulgated by the Tennessee Department of Environment & Conservation to implement Subtitle D included provisions requiring landfill operators to line facilities with impermeable clay and synthetic materials; install leachate collection systems and monitoring wells; and provide thirty years of post-closure care. These were, at the time, extremely expensive changes in the development and operation of disposal facilities, and there was fear in the legislature that some counties would not have a disposal option. To ensure that local governments were protected from high costs and lack of disposal capacity, the SWMA promoted regional landfills, an attempt to guide small counties into alliances with other counties. Theoretically, small counties would form a regional board that would then settle on a disposal site, and each local government would share in the cost of operation. The law even has a provision that would allow local governments to require all entities within their respective jurisdictions to dispose of their waste at the regional landfill. The premise behind the latter concept proved to be unconstitutional (see Carbone vs Clarkstown, U.S. Supreme Court, May 1994). While acknowledging that the flow control provision existed, no county in the State was willing to pledge public funds to facilities that may not receive enough waste to garner the tipping fees needed to meet costs. During the same period in the early 1990s, the Tennessee Valley Authority was exploring ways to integrate solid waste into fuel supply systems at power plants that had the existing technology to properly combust waste material. One of these plants was located in Kingston, and local officials became interested in combining their respective waste

3
streams, closing most of their landfills, and hauling everything to a waste-to-energy facility. Engineers working with TVA had prepared studies for other power plants and suggested the Watts Bar site as an alternative because two moth-balled fossil fuel plants are located there. The engineers recommended installing a companion boiler system that would utilize existing infrastructure and reduce the haul distance for all southeast Tennessee counties. Other infrastructure planned for the site included a materials recovery facility (MRF), which would have diverted enough material to meet the SWMA waste reduction goal. This situation was the catalyst for the formation of the Southeast Tennessee Municipal Solid Waste Planning Region, which included all of the counties within the Southeast Tennessee Development District1. Without the flow control provision, commitments from all counties and cities were vital in bringing this project to fruition. After the completion of studies funded by TVA, the utility lost interest in the project. No official reason was ever conveyed, but the decision was probably based on the fact that any emissions from the proposed plant would have a potential impact on the Cherokee National Forest and the Smokey Mountain National Park. TVA’s involvement in the project was crucial because the utility had existing infrastructure and would have bought the steam produced by the plant. Tipping fees would have been a reasonable $35 per ton, including MRF operations. Without TVA, the Board could not finance a stand-alone facility because tipping fees would have reached $100 or more, far above existing landfill disposal costs. The failure to implement the waste-to-energy project did not deter the Board from remaining a regional planning entity. Board members were comfortable with the situation and wished to remain together in the event that other regional opportunities arose. Saving landfill space was a primary goal of the SWMA. Many experts believed early on that the cost per ton of garbage would be in the $40 - $90/ton range at Class I facilities. Consequently, recycling, waste diversion, and saving landfill space became paramount goals. However high tipping fees failed to materialize as competition and economies of scale drove down development costs. Subsequently, many cities and counties found themselves with expensive recycling and waste diversion programs. Studies by several jurisdictions showed costs of $280+ to recycle a ton of waste material versus $25-$28
1 The Southeast Tenn. Municipal Solid Waste Planning Board is composed of Marion, Bradley, Marion, Hamilton, Marion, McMinn, Meigs, Polk, Rhea, and Sequatchie Counties.
4
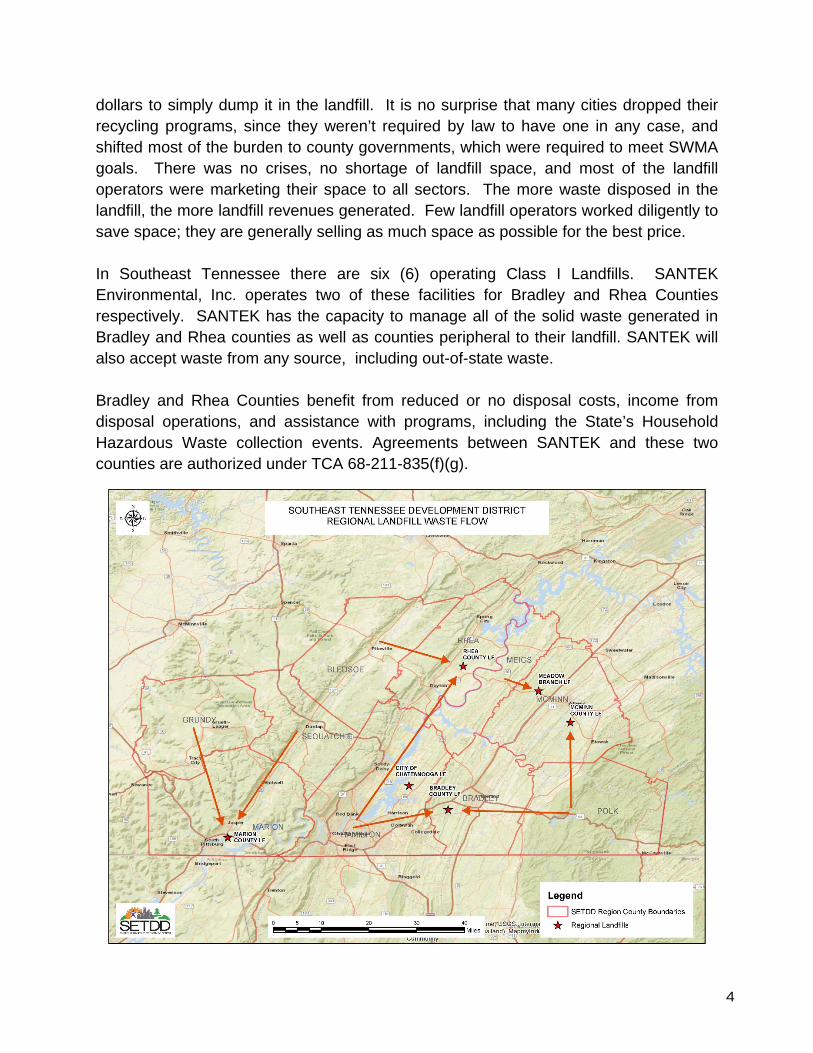
dollars to simply dump it in the landfill. It is no surprise that many cities dropped their recycling programs, since they weren’t required by law to have one in any case, and shifted most of the burden to county governments, which were required to meet SWMA goals. There was no crises, no shortage of landfill space, and most of the landfill operators were marketing their space to all sectors. The more waste disposed in the landfill, the more landfill revenues generated. Few landfill operators worked diligently to save space; they are generally selling as much space as possible for the best price. In Southeast Tennessee there are six (6) operating Class I Landfills. SANTEK Environmental, Inc. operates two of these facilities for Bradley and Rhea Counties respectively. SANTEK has the capacity to manage all of the solid waste generated in Bradley and Rhea counties as well as counties peripheral to their landfill. SANTEK will also accept waste from any source, including out-of-state waste. Bradley and Rhea Counties benefit from reduced or no disposal costs, income from disposal operations, and assistance with programs, including the State’s Household Hazardous Waste collection events. Agreements between SANTEK and these two counties are authorized under TCA 68-211-835(f)(g).

5
Source: 2015 Annual Progress Report Meadow Branch, a private landfill located in McMinn County, provides disposal for Meigs, Hamilton, Bradley, and Polk counties in the Southeast Tennessee Region. Solid waste is also transported from outside of the region, including Knox, Loudon, and Monroe Counties. McMinn County receives a host feei for Meadow Branch, and the county also operates its own C&D landfill, which also accepts waste from outside the region. Marion County’s landfill is operated by Solid Waste Disposal, Inc., established by the local governments to operate independently. This is not a Part 9 Solid Waste Authority. Like the other landfills, waste is accepted from all sectors. In the past, landfill operators have received waste from Dade County, Georgia, Jackson County, Alabama, and both Hamilton and Franklin Counties in Tennessee. The landfill routinely accepts all of Grundy and Sequatchie County’s waste. Chattanooga operates the sixth landfill in the region. It is a facility that originally belonged to Hamilton County, but when the city’s Summit Landfill was closing, the city and county came to an agreement that allowed Chattanooga to own and operate the landfill. This landfill accepts waste from Hamilton County and all municipalities within the county. About 78 percent of the Chattanooga/Hamilton County waste stream, over 335,000 tons annually, goes to landfills located outside of the county. More than 54 percent is hauled to the SANTEK landfill in Bradley County. The original 1991 solid waste assessment for the entire region advocated sub-regions composed of natural “waste sheds.” In reality, these sub-regions have occurred based on the economics of waste generation, hauling distance, etc. As the previous map indicates, these sub-regions consist of county groupings as follows: Bledsoe-Rhea; Meigs-McMinn-Polk; Bradley County; Hamilton County; and Grundy-Marion-Sequatchie. The following is a detailed description of Marion County’s waste collection, diversion, and disposal system and how these programs function in relation to other parts of the Region. Every attempt has been made to provide an objective assessment of the County’s infrastructure and program needs based on the legal requirements of the SWMA.

6
i Per TCA 68-211-835€

7
Item 1-Demographic Information & Projections
Provide a table and chart of the region’s population during the past ten (10) years with a projection for the next five (5) years. Provide a breakdown by sub- table and sub-chart, or some similar method to detail county and municipality populations. Considering the trends, discuss the effect on the solid waste infrastructure needs over the next five (5) years.
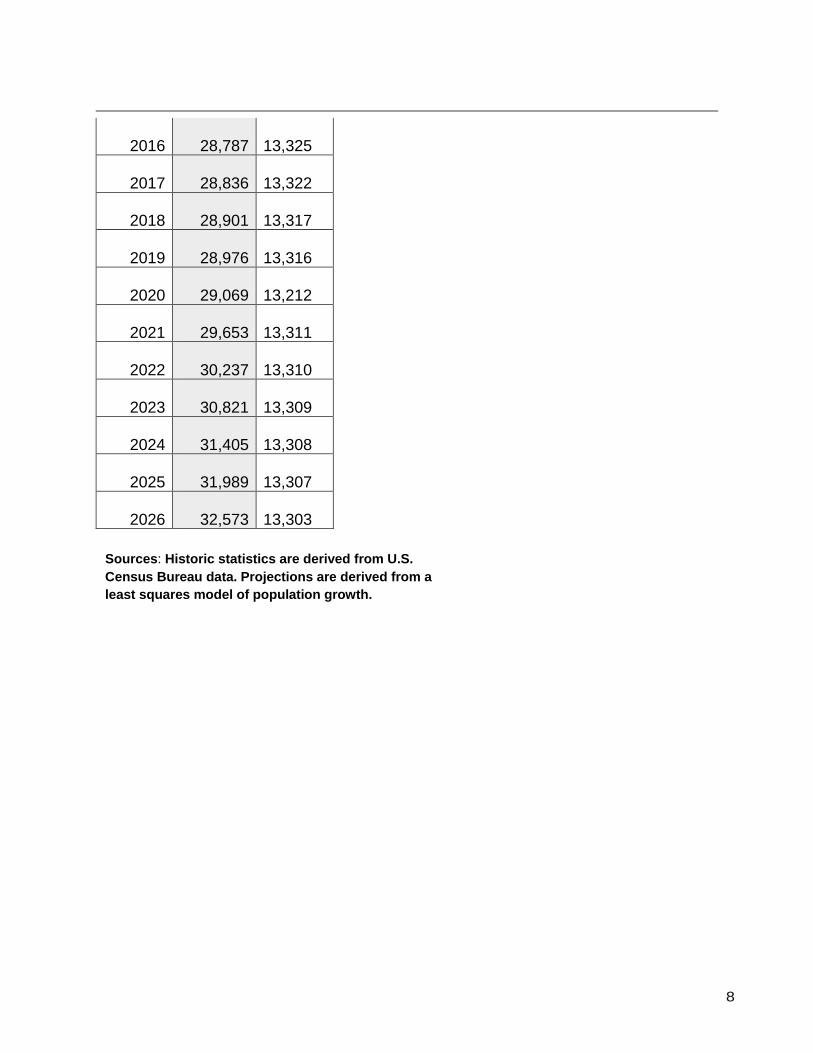
Table 1.1-Marion County-Total Population and Municipal Population-Historical and Future Population Estimates
Year Total
Population Municipal Portion
2000 27,776 13,172
2001 27,778 13,333
2002 27,811 13,349
2003 27,814 13,351
2004 27,718 13,305
2005 27,732 13,311
2006 27,953 13,417
2007 28,023 13,451
2008 28,112 13,494
2009 28,208 13,540
2010 28,332 13,182
2011 28,383 13,624
2012 28,455 13,658
2013 28,538 13,698
2014 28,641 13,748
2015 28,756 13,326
8
2016 28,787 13,325
2017 28,836 13,322
2018 28,901 13,317
2019 28,976 13,316
2020 29,069 13,212
2021 29,653 13,311
2022 30,237 13,310
2023 30,821 13,309
2024 31,405 13,308
2025 31,989 13,307
2026 32,573 13,303
Sources: Historic statistics are derived from U.S. Census Bureau data. Projections are derived from a least squares model of population growth.

9
Graph 1.1-Marion County-Total Population and Municipal Population-Historical and Future Population Estimates Chart
Sources: Historic statistics are derived from U.S. Census Bureau data. Projections are derived from a least squares model of population growth. Table 1.2-Marion County-Historical Municipal Populations in Marion County ` Square
1960 1970 1980 1990 2000 2010 2015 Miles
Jasper
1,450 2,009
2,633
2,780
3,214
3,257
3,312 7.6
Kimball
- 807
1,220
1,243
1,312
1,416
1,401 4.8
Monteagle
- 934
1,126
1,138
1,238
1,191
1,177 4.3
New Hope
- - 681
854
1,043
1,070
1,067 10.3
Orme
171 122
181
150
124
123
123 4.2
Powells Crossroads
- -
918
1,098
1,286
1,321
1,317 4.1
South Pittsburg
4,130 3,613
3,636
3,295
3,295
3,107
3,114 5.7
Whitwell
1,857 1,669
1,783
1,622
1,660
1,697
1,725 2.2
0
5,000
10,000
15,000
20,000
25,000
30,000
35,000
2000
2001
2002
2003
2004
2005
2006
2007
2008
2009
2010
2011
2012
2013
2014
2015
2016
2017
2018
2019
2020
2021
2022
2023
2024
2025
2026
Marion County Population Projections
County Municipal

10
Total: 7,608
9,154
12,178
12,180
13,172
13,182
13,236 43.2
County
21,036 20,577
24,416
24,860
27,776
28,332
28,756 512.0
Municipal Percent of County 36.2% 44.5% 49.9% 49.0% 47.4% 46.5% 46.0% 8.4%
Source: U.S. Census Bureau. 2015 data are taken from the American Community Survey. Overall, the population trends of Marion County and its municipalities do not indicate a significant increase over the next 5 years and therefore is not expected to put serious stress on the County’s solid waste management system. Per the U. S. Census Bureau and projections based on Census Bureau data, the municipal population will likely remain flat or fall slightly over the planning period. Most of the population growth is expected in the county’s more rural areas. Economic Development staff at the Southeast Development District do not anticipate any major industrial or institutional locations in Marion County over the next five years. Likewise, staff members assigned to the Marion County Planning Commission do not expect additional large-scale residential developments in the county because there are projects in progress that have yet to meet their development goals. As documented in succeeding chapters, Marion County has considerable waste collection infrastructure in place, and there are no other identifiable solid waste collection infrastructure needs projected over the next 5 years.

11
Item 2-Analysis of Economic Activity within the Region
Provide a table and chart showing the region’s economic profile for the county and its municipalities for the last ten (10) years with a projection for the next five (5) years. This can be accomplished by using the following economic indicators: • Taxable sales, property tax generation, and per capita income • Evaluation by break down of each economic sector • County or municipal budgeting information • Other commonly accepted economic indicators
Table 2-1-Marion County Economic Profile
Unemployed
Year
Total in Workforce Pool (1)
Employ-ment Total Percent
Per Capita Income
(2)
Retail Sale
(million$) (3)
Property Taxes
(millions $) (4)
2006 13,289 12,529 760 5.7%
27,691 329 293
2007 13,154 12,378 776 5.9%
28,234 337 298
2008 13,039 12,040 999 7.7%
29,841 346 301
2009 12,707 11,144 1,563 12.3%
29,246 312 307
2010 12,542 11,145 1,397 11.1%
30,754 333 312
2011 12,513
11,205 1,308 10.5%
31,764 373 322
2012 12,290
11,172 1,118 9.1%
32,629 386 333
2013 12,033
10,937 1,096 9.1%
32,479 403 343
2014 11,670
10,756 914 7.8%
33,341 460 353
2015 11,768
10,955 813 6.9%
34,388 439 363
2016 11,488
10,450 1,038 9.0%
35,049 441 373
2017 11,303
10,278 1,025 9.1%
35,779 444 383
2018 11,119
10,105 1,014 9.1%
36,508 450 393
2019 10,935 9,933 1,002 9.2%
37,238 455 403
2020 10,751 9,760 991 6.6%
37,967 458 413
2021 10,567 9,588 979 6.5%
38,697 461 423

12
Sources: Historic employment data, U. S. Dept. of Labor; Per capita income data, U.S. Bureau of Economic Analysis; Retail data, Tenn. Dept. of Revenue. All state and local area dollar estimates are in current dollars (not adjusted for inflation). Projections: SETDD staff. There has been sustained growth in retail sales and property taxes over the last decade, and that trend is projected to continue through the planning period. Home sales have helped increase property tax revenues. Although specific data are not available, it is likely that many of these home sales are driven by the new subdivisions that offer lake properties, and mountain top views to more affluent buyers. Graph 2-1-Marion County Housing
Source: City Data.com, 2014 Although Marion County is rural in nature, agricultural employment only accounted for about 1.6 percent of jobs in 2014 per 2015 Bureau of Labor Statistics data. There are a few large agricultural operations in the Sequatchie Valley, but most of the county is comprised of small holdings that may produce supplemental incomes but do not provide the basis for long-term employment. The average farm size is 181 acres (2012 Census of Agriculture) which is basically a family farm.

13
Figure 2-1-Non-Agricultural Employment
Source: U.S. Cluster Mapping Project, Institute for Strategy and Competitiveness, Harvard Business School. As the graphic above indicates, the primary sources of local employment are healthcare, service related enterprises, and real estate development. There are some manufacturing plants in the area, but locally, there are not enough of these jobs to have a significant impact on the overall employment picture.

14
Figure 2-2- Marion County Commuting Patterns
Per the U.S. Census, American Factfinder, 41.1 percent of the workforce was employed outside the county, primarily in the Chattanooga area in 2015. Many of these jobs are in

15
the manufacturing sector, including the Volkswagen plant, Alstom, and related industries that tend to pay well. The service jobs that predominate in Marion County are generally associated with lower pay and variable work hours. As Table 2.1 indicates, per capita income has remained relatively stable despite decreases in employment. This is probably due to the jobs available in Chattanooga, which have remained viable even in a recessionary period. Overall, the county’s economic status appears to have limited growth potential although it is relatively stable. All the economic indicators point to a continuation of that trend through the planning period. Therefore, it is likely that waste volumes will also remain stable with a slight upward trend that is primarily due to population growth. Item 3-Characterization of the Solid Waste Stream
Elaborate on the region’s solid waste stream. Compare the current waste stream with trend anticipated over the next five (5) years, and discuss how this new total will be handled. Include in this discussion how problem wastes like waste tires, used oil, latex paint, electronics and other problem wastes are currently handled and are projected to be handled in the next five (5) years. What other waste types generated in this region require special attention? Discuss disposal options and management of these waste streams as well as how these waste streams will be handled in the future. Include in this discussion how commercial and industrial wastes are managed. Also, provide an analysis of any wastes entering or leaving the region, noting the source and amounts of such wastes.
16
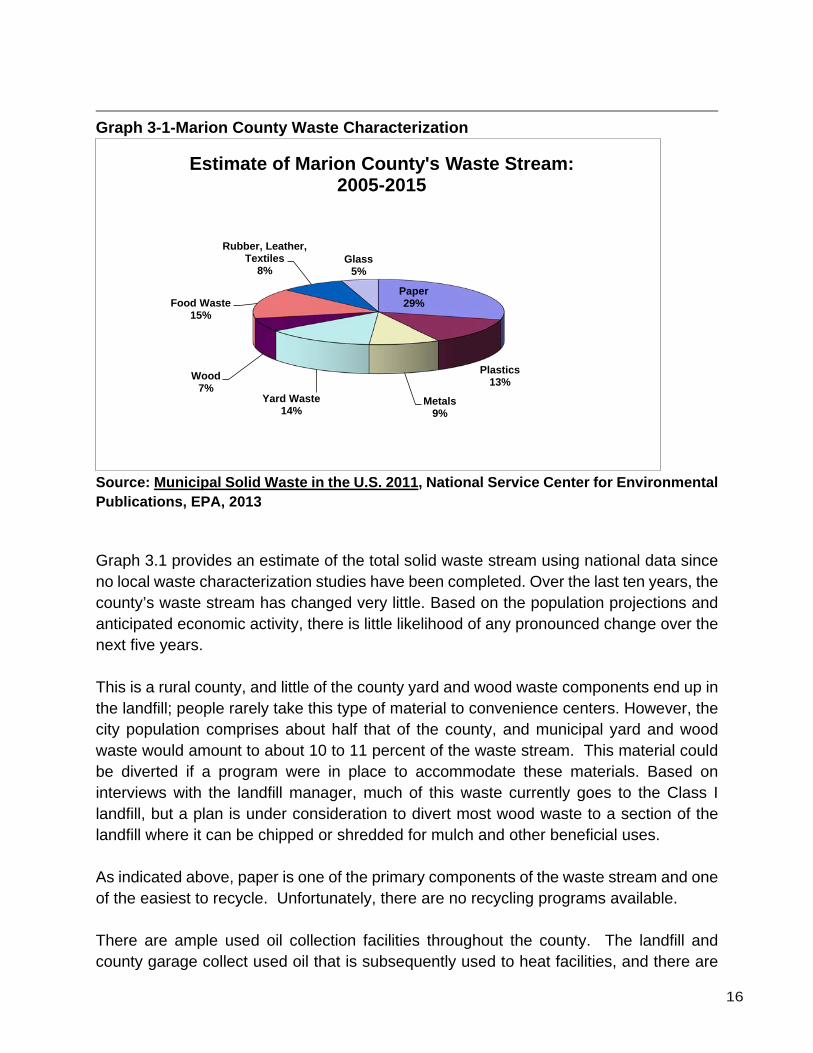
Graph 3-1-Marion County Waste Characterization
Source: Municipal Solid Waste in the U.S. 2011, National Service Center for Environmental Publications, EPA, 2013 Graph 3.1 provides an estimate of the total solid waste stream using national data since no local waste characterization studies have been completed. Over the last ten years, the county’s waste stream has changed very little. Based on the population projections and anticipated economic activity, there is little likelihood of any pronounced change over the next five years. This is a rural county, and little of the county yard and wood waste components end up in the landfill; people rarely take this type of material to convenience centers. However, the city population comprises about half that of the county, and municipal yard and wood waste would amount to about 10 to 11 percent of the waste stream. This material could be diverted if a program were in place to accommodate these materials. Based on interviews with the landfill manager, much of this waste currently goes to the Class I landfill, but a plan is under consideration to divert most wood waste to a section of the landfill where it can be chipped or shredded for mulch and other beneficial uses. As indicated above, paper is one of the primary components of the waste stream and one of the easiest to recycle. Unfortunately, there are no recycling programs available. There are ample used oil collection facilities throughout the county. The landfill and county garage collect used oil that is subsequently used to heat facilities, and there are
Paper29%
Plastics13%
Metals9%
Yard Waste14%
Wood7%
Food Waste15%
Rubber, Leather, Textiles
8%Glass
5%
Estimate of Marion County's Waste Stream: 2005-2015
17
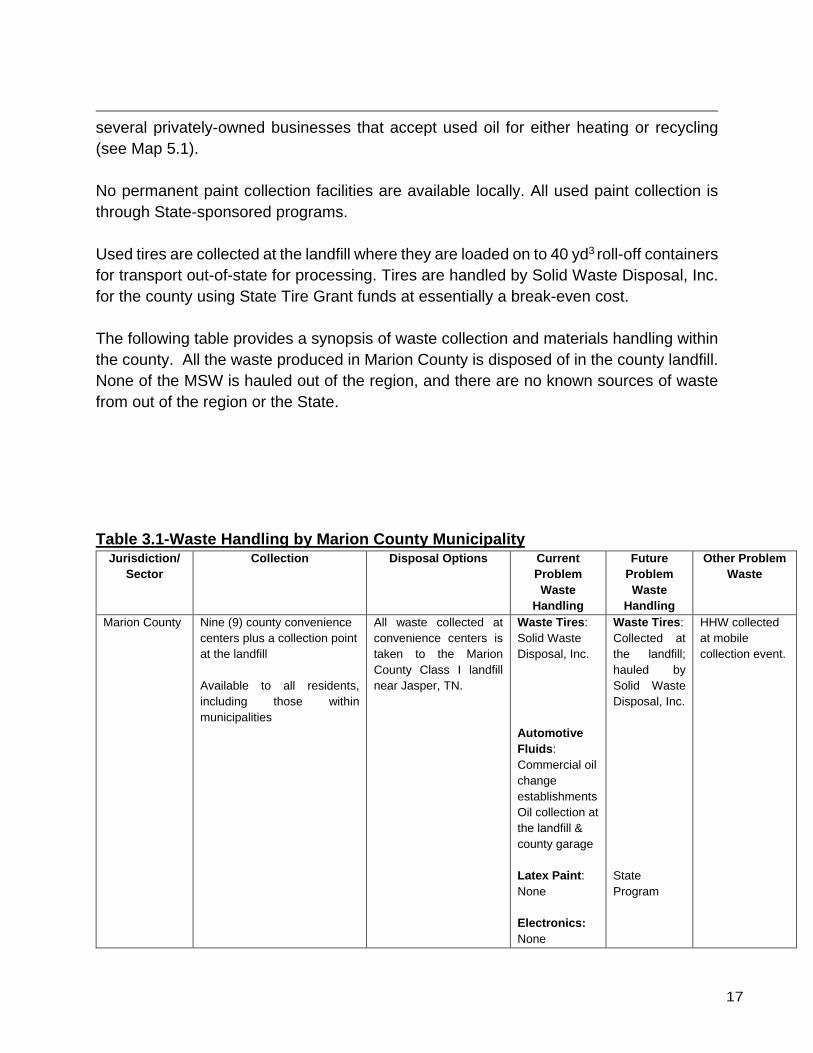
several privately-owned businesses that accept used oil for either heating or recycling (see Map 5.1). No permanent paint collection facilities are available locally. All used paint collection is through State-sponsored programs. Used tires are collected at the landfill where they are loaded on to 40 yd3 roll-off containers for transport out-of-state for processing. Tires are handled by Solid Waste Disposal, Inc. for the county using State Tire Grant funds at essentially a break-even cost. The following table provides a synopsis of waste collection and materials handling within the county. All the waste produced in Marion County is disposed of in the county landfill. None of the MSW is hauled out of the region, and there are no known sources of waste from out of the region or the State. Table 3.1-Waste Handling by Marion County Municipality
Jurisdiction/ Sector
Collection Disposal Options Current Problem Waste
Handling
Future Problem Waste
Handling
Other Problem Waste
Marion County
Nine (9) county convenience centers plus a collection point at the landfill Available to all residents, including those within municipalities
All waste collected at convenience centers is taken to the Marion County Class I landfill near Jasper, TN.
Waste Tires: Solid Waste Disposal, Inc. Automotive Fluids: Commercial oil change establishments Oil collection at the landfill & county garage Latex Paint: None Electronics: None
Waste Tires: Collected at the landfill; hauled by Solid Waste Disposal, Inc.
State Program
HHW collected at mobile collection event.

18
Town of Jasper Curbside Marion County Landfill Residential
only
Town of Kimball
Curbside Marion County Landfill Residential only
City of South Pittsburg
Curbside Marion County Landfill Residential only
Business Contracts with private haulers and self-service by business/industry.
Marion County Landfill In-house programs and contractors
In-house programs and contractors.
Commercial generation of hazardous waste is regulated by TDEC. Participation in the mobile HHW/CESQG collection service for a fee.
Item 4-Solid Waste Collection System
Provide a detailed description of the waste collection system in the county and each municipality, including a narrative of the life cycle of solid waste from the moment it becomes waste (loses value) until it ceases to be a waste by becoming a useful product, residual landfill material or an emission to air or water. Label all major steps in this cycle noting all locations where wastes are collected, stored or processed, along with the name of operators and transporters for these sites. Convenience centers are the primary waste collection method available to Marion County residents. Waste is hauled by county employees using two roll-off trucks. Municipal curbside collection programs are available in Jasper, Kimball, and South Pittsburg. All this waste is hauled to the Marion County Landfill for disposal using town or city trucks. No transfer stations are involved. Except for problems wastes, such as used oil and tires, all the commercial and institutional waste is taken to the Marion County Landfill for disposal. One industry, Lodge Manufacturing, has its own landfill for foundry waste only. Approximately 50 percent of the population is located in municipalities. All but one of these small towns and cities are in the Sequatchie Valley which bisects the county from north to south. Monteagle is the only municipality located on the plateau above the valley. Jasper, Kimball, and South Pittsburg are contiguous municipalities located in the southern end of the county immediately adjacent to the landfill. Whitwell and Powells Crossroads

19
are small, contiguous communities located on either side of the Sequatchie River in the northern end of the valley. The Cumberland Plateau rises almost vertically on both sides of the Sequatchie Valley to heights of about 1,800 above sea level. Roads generally wind through canyon-like declivities in the escarpment to reach communities on the plateau. Interstate 24 connects Monteagle to the rest of the county, but other small unincorporated communities have more limited access due to steep winding mountain roads. These communities require individual convenience centers to provide adequate waste collection within a reasonable distance of residents’ homes. Foster Falls, Whitwell Mountain, Suck Creek Mountain, and Sequatchie Mountain comprise about 30 percent of the waste flow to the Marion County landfill but closer to 60 percent of the haul time and cost. Except for Monteagle, all the waste collected at these plateau communities is residential; there are no significant industrial or commercial waste streams in these areas. South Pittsburg is located on the border with Jackson County, Alabama. However, there is very little if any waste flowing out of Tennessee from Marion County. The Marion County landfill is within 4 to 5 miles of any point in Jasper, Kimball, or South Pittsburg, and there is little incentive for haulers to seek alternative disposal options. The Browder Switch Industrial Park is in Jasper within less than a mile of the landfill. Lodge Manufacturing, located in South Pittsburg, is the only significant industrial presence outside the industrial park. Lodge has its own monofil devoted exclusively to foundry waste. Much of this material is subsequently diverted to beneficial uses such as fill for road beds. Commercial and institutional waste production is primarily centered in the Town of Kimball at a commercial center on Interstate 24. A concentration of restaurants, hotels, and large commercial chain stores produces about 75 percent of waste from these sectors. This waste is hauled by private haulers to the Marion County landfill. Jasper, Kimball, and South Pittsburg operate separate curbside waste collection systems. There is a high degree of redundancy among these systems since Jasper, Kimball, and South Pittsburg are contiguous and could easily be served by a single system. Currently, Jasper and Kimball maintains their own collection vehicles; South Pittsburg has a contract with a private hauler for collection. There are no recycling or diversion programs in any of the municipalities, and all the municipal waste is hauled to the Marion County Landfill. With the preceding background, it is evident that most the waste stream is landfilled. The Solid Waste Disposal, Inc., which provides landfill and hauling service for the county, does

20
not provide any recycling services. There have been attempts to install a landfill gas recovery system but without success. Consequently, all the waste is subject to normal decay. Marion County has nine (9) convenience centers strategically located to maximize access to all residents (see Map 5.1). The centers are located as follows: Jasper South Pittsburg Kimball Suck Creek Sequatchie Community Whitwell Sequatchie Mountain Whitwell Mountain Monteagle The minimum number of convenience centers required is calculated using the formula that determines a reasonable number by land area rather than population. This method was chosen because population densities are low and the county is relatively large. The minimum required number of centers would be only two (2). Table 4.1
Minimum Collection Required Required Existing
Total
Sq. Miles
Non-Service Area* Difference Centers Centers
Marion 512 56 456 3 9 The above formula subtracts the area where waste collection service is not appropriate and the resulting figure is divided by 180 square miles (TDEC formula) to arrive at a reasonable waste-shed area. This area includes the Prentice Cooper State forest area and TVA lakes that are not populated and were deducted from the total square miles of potential service area. Even without accounting for non-service areas, the calculation establishes a minimum required number of just three. Although the formula suggests that three centers are adequate, nine centers were constructed to serve sections of the county that would be cut off from essential services due to topographic barriers and poor transportation facilities.

21
Regional Solid Waste Flow and Life-Cycle Table 4.2 represents data collected for the 2015 Annual Report for the Southeast Tennessee region. As is apparent, almost all of the recycling occurs in the Industrial sector. The high percentage of industrial recycling is primarily due to Lodge Manufacturing’s foundry operations, which produces high volumes of residual materials that are amenable to recycling and re-use. Total residential waste generation trends are in the 20,000 tons/year range over the planning period. More collection capacity will not be needed, and existing facilities could handle more than is currently generated.
Table 4.2-Marion County 2015 APR
Tennessee Sector Summary Report-Marion County 2015 APR Data
Type Residential Commercial Industrial Total Tons
Recycling 166 846 19788 20800 Waste Diversion 0 0 0 0 Hazardous Waste 0 0 0 0 Solid Waste 19513 0 0 19513
Total 19679 846 19788 40313
Real Time Diversion Rate (Percentage) 52.0%
Public Recycling Rate (Percentage) 0.0%

22
Item 5-Analysis of Existing or Potential Solid Waste Flows within the Region and Between Adjacent Regions
Provide organizational charts of each county and municipality’s solid waste program and staff arrangement. Identify needed positions, facilities, and equipment that a fully integrated solid waste system would have to provide at a full level of service. Provide a page-size, scaled county map indicating the location of all solid waste facilities, including convenience centers, transfer stations, recycling centers, waste tire drop-off sites, used oil collection sites, paint recycling centers, all landfills, etc. Identify any short comings in service and note what might be needed to fill this need.
Since there are no recycling centers or materials processing facilities, the organization of solid waste programs is relatively simple. The county mayor is responsible for nine convenience center operators, two roll-off truck drivers, and roll-off trucks. All other functions are contracted to Solid Waste Disposal, Inc., which operates the landfill and tire collection facility. Municipal collection organization is as follows: Jasper Mayor→Sanitation Manager→Driver Kimball City Manager→Sanitation Manager→Driver South Pittsburg City Administrator→Contractor (Tennessee Valley Waste Services) The county’s convenience centers are equipped with a 4 yd3 compactor feeding into a 40 yd3 receiving container. Municipal services provide about 40 percent of the population with curbside waste collection. All residents also have access to convenience centers located within or near municipal boundaries. Monteagle, New Hope, Orme, Powells Crossroads, and Whitwell do not have waste collection services, and their residents rely on nearby convenience centers.

23
Table 5.1: Regional Collection Systems
Provider of
Service
Service Area
Population Total Under This Service
Frequency of Service
(Weekly, Bi-weekly, on call, etc.)
Annual Tonnage Capacity
Type Service (Curbside,
Convenience Center, Green
Box) Marion County
County-wide drop-off 20,660 As Needed 14,430 Convenience
Center Jasper Town 3,312 Weekly 2,075 Curbside Kimball Town 1,401 Weekly 895 Curbside South
Pittsburg City 3,114 Weekly 2,100 Curbside
Total: 28,487 19,500 Note: Population figures are from the 2015 American Community Survey. Annual tonnage capacities are estimated. There is considerable redundancy in waste collection capacity within Marion County. Although Jasper, Kimball, and South Pittsburg have curbside programs, each of these municipalities also host a convenience center. However, these centers also serve residents who live outside municipal boundaries in areas such as Orme, South Pittsburg Mountain, New Hope, and Guild (unincorporated). Fewer centers would likely lead to illegal roadside dumps, which have largely disappeared with the advent of the convenience center system as is today.

24
Map 5.1 Solid Waste Facilities
25
Item 6-Analize Attitude of Region Toward Waste Management in General and Specify Needed Changes and/or Educational Measures
Describe current attitudes of the region and its citizens towards recycling, waste diversion, and waste disposal in general. Where recycling is provided, discuss participation within the region. Indicate current and ongoing education measures to curb apathy or negative attitude towards waste reduction. Are additional measures needed to change citizen’s behaviors? If so, what specific behaviors need to be targeted and by what means.
No surveys have been done to measure the public’s attitude of Marion County residents concerning support for environmental programs. In the remote areas of Marion County, there are still areas where citizens have a hard time properly disposing of their Class I waste. Motorized transport is necessary to reach convenience centers, and those who do not have it use burn barrels or other on-site disposal. In discussions with the county mayor and landfill operator over the last year, it is apparent that people are pleased with the service they receive at convenience centers, but there is little demand for recycling services. Since there are no recycling services offered at convenience centers, it is difficult to determine what the participation rate would be. The economic incentive for Solid Waste Disposal, Inc. is to landfill as much MSW as possible to maintain the financial integrity of the waste disposal system, especially during periods when waste volumes decline.
A viable residential recycling program will require county residents to demand these services and be willing to pay for them. To determine if citizens would be willing to bear the costs of recycling, surveys should be conducted by Development District staff at the many public hearings, commission meetings, and other public forums that occur over the course of a year. This would give public officials the backing needed to implement recycling at convenience centers.
There are no concerted efforts to educate the public on solid waste issues. There is an on-going Litter Grant program, but the education component of that program does not actually address recycling, waste diversion, re-use and other issues that would help promote programs within the county. To build an educational program, the county needs to have some type of organization that can implement the program. Currently, there is no local government organization with that capacity. Development District staff can act as advocates, but the District is composed of a board of local officials, which limits what can be done without local approval.

26
Item 7-Evaluation of the Waste Reduction Systems for Counties & Municipalities in Region
The Solid Waste Management Act of 1991 requires all regions to reduce the amount of waste going into Class I landfills by 25%. Amendments to the Act allow for consideration of economic growth, and a “qualitative” method in which the reduction rate is compared on a yearly basis with the amount of Class I disposal. Provide a table showing the reduction rate by each of these goal calculation methodologies. Discuss how the region made the goal by each methodology, or why it did not. If the Region did not meet the 25% waste reduction goal, what steps or infrastructure improvements should be taken to attain the goal, and to sustain this goal into the future.
Table 7-1-Reduction Rate by Methodology Southeast Tennessee Planning Region
County
% Reduction Compared
to Base Year
MSW % Reduction Pop Ratio
MSW % Reduction
Using Pop Econ
Ratio
Real Time Comparison
Maximum %
Reduction Qualified
For
Is county in Compliance?
23% 23% 11% 33% 33% Yes Bledsoe 2% 2% No Bradley 12% 12% No Grundy 3% 3% No Hamilton 40% 40% Yes Marion 48% 48% Yes McMinn 30% 30% Yes Meigs 6% 6% No Polk 3% 3% No Rhea 24% 24% No Sequatchie 23% 23% No
Source: TDEC Compliance Formulas, 2014 (latest available) As a whole, the Southeast Region has always met the 25 percent waste reduction goal as specified in the 1991 Solid Waste Management Act. Some of the smaller counties have never been able to meet the goal individually because they are very rural with small waste streams. Even with fully functioning recycling operations, these small counties struggle to reduce the amounts going to the landfill. Without a significant commercial and/or industrial presence in these counties, they must rely on residential recycling programs that usually produce small volumes. On an annual basis, Marion County meets the waste reduction goal, primarily due to industrial waste recycling. To have a public recycling rate of any consequence, Marion County and its municipalities need to have recycling programs in place. The county
27
previously had roll-off containers at the Powells Crossroads, Sequatchie, and Jasper convenience centers to collect paper, but that equipment is no longer in use. Basically, the county has abandoned recycling because those programs operated at a loss. Infrastructure is important, but it does not make a recycling program work when there is no will to implement the program and no economic incentive to do so.
Item 8-Collection/Disposal Capacity and Projected Life of Solid Waste Sites
(a) Using the example shown below, provide a chart indicating current collection and disposal capacity by facility site and the maximum capacity the current infrastructure can handle at maximum through put. Provide this for both Class I and Class III/IV disposal and recycled materials. Identify and discuss any potential shortfalls in materials management capacity whether these are at the collection or processor level.
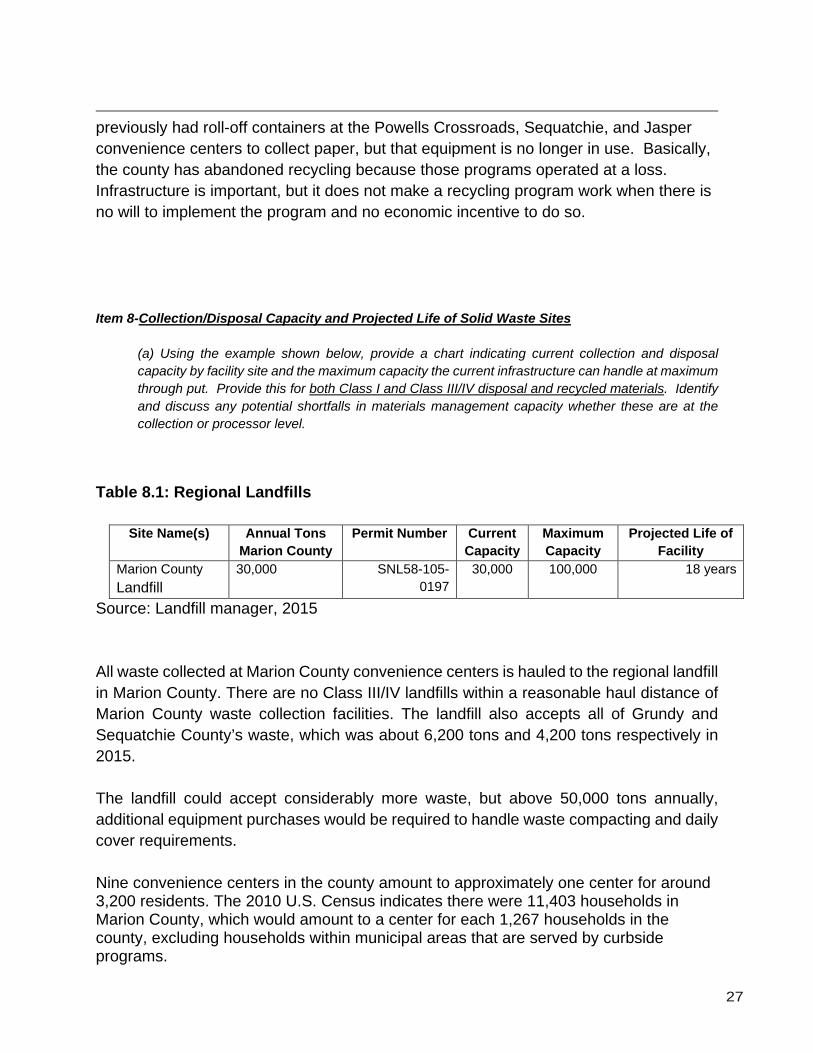
Table 8.1: Regional Landfills
Site Name(s) Annual Tons Marion County
Permit Number Current Capacity
Maximum Capacity
Projected Life of Facility
Marion County Landfill
30,000 SNL58-105-0197
30,000 100,000 18 years
Source: Landfill manager, 2015 All waste collected at Marion County convenience centers is hauled to the regional landfill in Marion County. There are no Class III/IV landfills within a reasonable haul distance of Marion County waste collection facilities. The landfill also accepts all of Grundy and Sequatchie County’s waste, which was about 6,200 tons and 4,200 tons respectively in 2015. The landfill could accept considerably more waste, but above 50,000 tons annually, additional equipment purchases would be required to handle waste compacting and daily cover requirements. Nine convenience centers in the county amount to approximately one center for around 3,200 residents. The 2010 U.S. Census indicates there were 11,403 households in Marion County, which would amount to a center for each 1,267 households in the county, excluding households within municipal areas that are served by curbside programs.

28
The minimum number of convenience centers required is calculated using the formula that determines a reasonable number by land area rather than population. This method was chosen because population densities are low and the county is relatively large. The minimum required number of centers would be only two (2).
Table 8-2 Minimum Collection Required Required Existing
Total
Sq. Miles
Non-Service Area* Difference Centers Centers
Marion 512 56 456 3 9 The above formula subtracts the area where waste collection service is not appropriate and the resulting figure is divided by 180 square miles (TDEC formula) to arrive at a reasonable waste-shed area. This area includes the Prentice Cooper State forest area and TVA lakes that are not populated and were deducted from the total square miles of potential service area. Even without accounting for non-service areas, the calculation establishes a minimum required number of just three. Although the formula suggests that three centers are adequate, nine centers were constructed to serve sections of the county that would be cut off from essential services due to topographic barriers and poor transportation facilities. The preceding information indicates a high degree of redundancy in Marion County’s waste collection and disposal system. Any failure in a collection system or center can easily be absorbed by adjacent systems. Likewise, the landfill has sufficient capacity to maintain disposal of existing waste flows and add more if necessary for disaster response scenarios, sudden unexpected growth, or other contingencies.

29
Item 9-Unmet Financial Needs and Cost Summary
Complete the following table and discuss unmet solid waste financial needs to maintain current level of service. Provide a cost summary for current year expenditures and projected increased costs for unmet needs.
EXPENDITURES
Description Present Need $/year Unmet Needs $/year Total Needs (Present
+ Unmet) $/year Salary and Benefits Transportation/hauling Collection and Disposal Systems
Equipment $385,000 $385,000 Sites Convenience Center $185,453 $185,453 Transfer Station Recycling Center MRF Landfills (Tipping Fee) $317,250 $317,250 Site Operation Closure Post Closure Care Administration (supplies, communication costs, etc.)
$3,985 $3,985
Education $2,000 $2,000 Public Continuing Ed. Capital Projects Total: $506,688 $387,000 $893,688
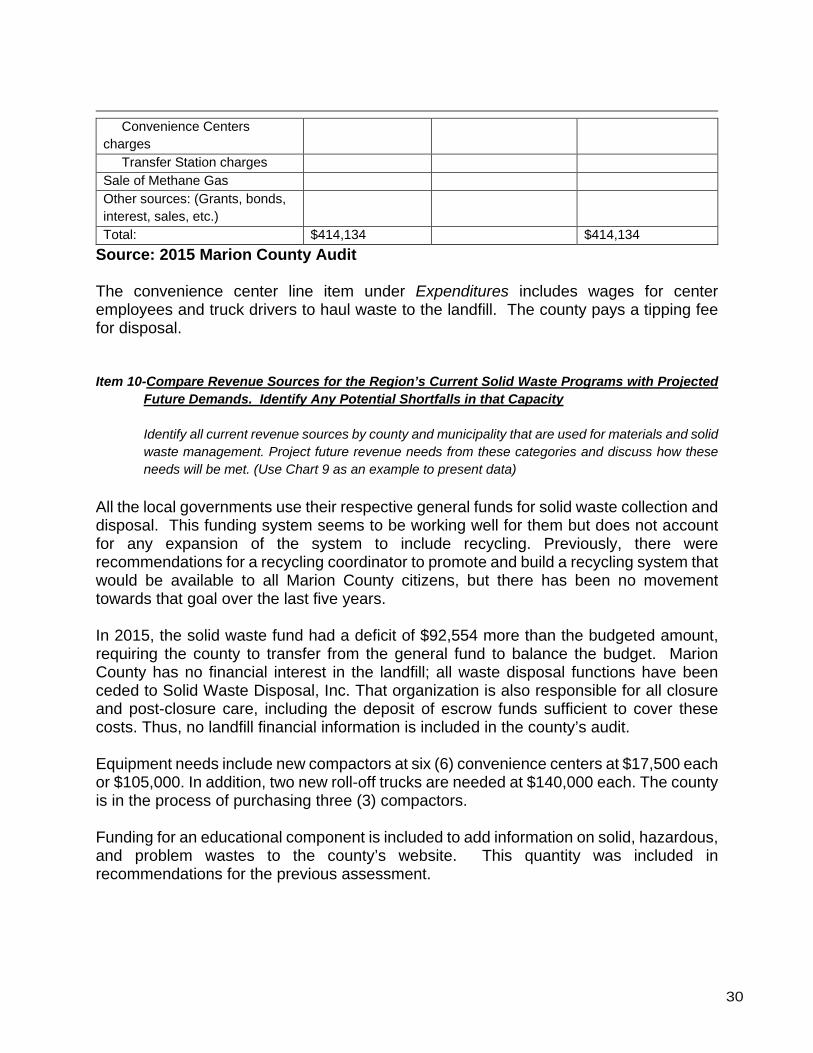
REVENUE Host agreement fee State of TN $161,009 $161,009 Local taxes $232,229 $232,229 Sales tax Surcharges Disposal Fees Collection charges Industrial or Commercial charges
$20,896 $20,896
Residential charges
30
Convenience Centers charges
Transfer Station charges Sale of Methane Gas Other sources: (Grants, bonds, interest, sales, etc.)
Total: $414,134 $414,134 Source: 2015 Marion County Audit The convenience center line item under Expenditures includes wages for center employees and truck drivers to haul waste to the landfill. The county pays a tipping fee for disposal. Item 10-Compare Revenue Sources for the Region’s Current Solid Waste Programs with Projected
Future Demands. Identify Any Potential Shortfalls in that Capacity
Identify all current revenue sources by county and municipality that are used for materials and solid waste management. Project future revenue needs from these categories and discuss how these needs will be met. (Use Chart 9 as an example to present data)
All the local governments use their respective general funds for solid waste collection and disposal. This funding system seems to be working well for them but does not account for any expansion of the system to include recycling. Previously, there were recommendations for a recycling coordinator to promote and build a recycling system that would be available to all Marion County citizens, but there has been no movement towards that goal over the last five years. In 2015, the solid waste fund had a deficit of $92,554 more than the budgeted amount, requiring the county to transfer from the general fund to balance the budget. Marion County has no financial interest in the landfill; all waste disposal functions have been ceded to Solid Waste Disposal, Inc. That organization is also responsible for all closure and post-closure care, including the deposit of escrow funds sufficient to cover these costs. Thus, no landfill financial information is included in the county’s audit. Equipment needs include new compactors at six (6) convenience centers at $17,500 each or $105,000. In addition, two new roll-off trucks are needed at $140,000 each. The county is in the process of purchasing three (3) compactors. Funding for an educational component is included to add information on solid, hazardous, and problem wastes to the county’s website. This quantity was included in recommendations for the previous assessment.

31
Item 11-Sustainable Goals Consistent with the State Plan
Discuss the region’s plan for managing its solid waste system over the next five (5) years. Identify any deficiencies in that plan and offer recommendations for eliminating these deficiencies. Suggest and list the specific ways in which the region can improve its solid waste program to reach a level of waste reduction above that of the goal and provide long term sustainability to the current solid waste collection system. Show how the region’s plan supports the statewide Solid Waste Management Plan.
Goal 1 in the State’s Solid Waste Materials Management Plan 2025 is to reduce the per capita waste from 5.17 pounds/person/day to 4 lbs. by 2020 and 3.5 lbs. by 2025 (p.68). Excluding industrial waste, Marion County produces about 19,700 tons per year from a population of about 28,500. This amounts to 3.8 lbs./person/day, which is below the State goal for 2020 but short of the 2025 goal. Goal 2 indicates a Class III/IV waste reduction goal to be determined, but Marion County does not have a Class III/IV landfill within a reasonable haul distance, so it is unlikely that it will be able to meet any of the objectives determined for that goal. Marion County has already met Goal 3, which is a 35 percent waste reduction by 2025. However, that is assuming that the method of calculating waste reduction is not changed and the industrial waste reduction that the county relies on remains consistent over time. A long-term waste disposal option is available at the Marion County landfill where all of Marion County waste is currently disposed. This facility provides has adequate capacity of all the waste generated in the county for the next 18 years. Solid Waste Disposal, Inc. operates the landfill and has been able to maintain services with receipts from tipping fees. Educating the public about waste reduction, recycling, litter control, and other waste issues remains deficient. With a relatively high illiteracy rate, the county cannot rely on the written word for educational purposes. More internet-related advertising should be incorporated into the education program. Currently, the county’s website does not have a solid waste component, and that could easily be incorporated with at a minimal cost. In addition, the Litter Grant educational program in K-12 schools should be expanded to include local recycling as well as litter control.

32
Recommendations Education Recommendation 1: Much of today’s information is disseminated through the internet. Consequently, it is imperative that the county incorporate solid waste issues in its website, providing all the basic details of county programs and services, including solid waste and recycling. Marion County’s residents need to be provided with information about other counties that have successful recycling programs. It is likely that they are unaware of the successful efforts that other, less affluent counties, have made to recycle. Action Item: Petition the County Mayor to assist with implementation. Facilities and Programs Recommendation 2: All convenience centers need used oil/antifreeze collection containers. Action Item: Apply for grant funds to purchase collection containers, containment systems and covers.
Funding Source: Solid Waste Management Fund
Recommendation 3: All convenience centers need oil based paint collection containers. Action Item: Apply for grant funds to purchase waste paint collection containers.
Funding Source: Solid Waste Management Fund Recommendation 4: Collect high value paper products such as cardboard to increase the quantities of material diverted from the Class I waste stream. Action Item: Apply for grant funds to purchase four 30 yd3 roll-off containers.

33
Funding Source: Solid Waste Management Fund and/or County Solid Waste Management fund Recommendation 5: Divert wood waste from the Class I landfill. Action Item: Establish a wood waste holding area on the landfill site and purchase a chipper or other volume reduction equipment. Funding Source: Solid Waste Disposal, Inc. Recommendation 6: Encourage the development of recycling programs in municipalities. Action Item: Meetings between county, municipal officials, and promotions at the Joint Economic & Community Development Board. The participation of School Boards is also important because they have previously been willing to operate and maintain recycling centers at schools. Funding Source: Appalachian Regional Commission/USDA Rural Development, Rural Utilities Service Recommendation 7: Explore the consolidation of the Jasper, Kimball, and South Pittsburg waste collection systems. Prepare a study to determine if a private hauler such as Republic Services could provide waste collection and recycling services for all three municipalities at a lower cost than their combined budgets. Funding Source: Local government Conclusion In order to remain in compliance with statutory requirements, Marion County should develop a comprehensive waste reduction, diversion, and recycling program. Many of these programs can be implemented with little cost to the county. Among these are used oil recycling containers that can be provided and serviced by private companies; scrap metal collection, which can also be contracted to private interests; and used paint that can be collected in barrels for re-use by county residents.

34
In general, Marion County has all the facilities in place to meet statutory requirements. The county has made a good faith effort to provide its residents with clean, efficient waste collection facilities. Solid Waste Disposal, Inc., that operates the Marion County Landfill, is fully capable of assuring waste disposal options for at least the planning period. The County does not have access to alternate disposal options for demolition materials. It does have the capacity to implement a viable recycling program that could, at a minimum, reduce the amount of paper sent to the landfill. Sources All sources are cited at appropriate points throughout the assessment.
• U.S. Census Bureau, American Community Survey and American Factfinder • U.S. Department of Commerce, Bureau of Economic Analysis • Tennessee Bluebook, 2015-2016 • U.S. Environmental Protection Agency, Center for Environmental Publications • U.S. Department of Labor • Tennessee Department of Revenue • Tennessee Code Annotated • U.S. Cluster Mapping Project, Institute for Strategy & Competitiveness, Harvard
Business School • Solid Waste Disposal, Inc., Marion County Landfill Operator • Local Officials, including the county mayor and municipal officials • Southeast Tennessee Development District staff