Marion County, Oregon - Amazon Web Services · Fund – Department Matrix ... 6. Budget Message....
190
City of Keizer Marion County, Oregon Adopted Budget Budget FY 2016-17
Transcript of Marion County, Oregon - Amazon Web Services · Fund – Department Matrix ... 6. Budget Message....

City of Keizer Marion County, Oregon
Adopted Budget
Budget FY 2016-17

FISCAL YEAR 2016-2017
BUDGET COMMITTEE MEMBERS Council Members:Cathy Clark, Mayor
Dennis Koho, President Bruce Anderson
Kim Freeman Roland Herrera
Marlene Parsons Amy Ryan
Public Members: Allen Barker Ron Bersin
Charlotte Clark Joseph Gillis Jerry McGee
Nelson Sossamam Jonathan Thompson
STAFF
Chris Eppley, City Manager Shannon Johnson, City Attorney
Department Head Team
Nathan Brown, Community Development Director Tracy Davis, City Recorder
Machell DePina, Human Resources Director Bill Lawyer, Public Works Director
John Teague, Chief of Police Tim Wood, Finance Director
“We’re Building a Better Community - Together!”
2

QuotesonDemocracy
The ballot is stronger than the bullet.
ABRAHAM LINCOLN, speech, May 19, 1856
Although our interests as citizens vary, each one is an artery to the heart that pumps life through the body politic, and each is important to the health of democracy.
BILL MOYERS, The Nation, January 22, 2007
Democracy is two wolves and a lamb voting on what to have for lunch. Liberty is a well-armed lamb contesting the vote!
BENJAMIN FRANKLIN
Democracy means that anyone can grow up to be president, and anyone who doesn’t grow up can be vice president.
JOHNNY CARSON, The Tonight Show, September. 11, 1991
There are more incorruptible than the few; they are like the greater quantity of water which is less easily corrupted than a little.
ARISTOTLE, Politics
Democracy, like liberty, justice and other social and political rights, is not "given", it is earned through courage, resolution and sacrifice.
AUNG SAN SUU KYI, In Quest of Democracy
Democracy alone, of all forms of government, enlists the full force of men's enlightened will.
FRANKLIN D. ROOSEVELT, Third Inaugural Address, January 20, 1941
3

4

TableofContents
BUDGET MESSAGE
City Manager’s Budget Message .................................................................................................................. 8
CITY OVERVIEW
City Demographics ...................................................................................................................................... 10
Budget Process & Calendar ................................................................................................................... 11‐16
Financial Policies .................................................................................................................................... 17‐22
Organization Chart ...................................................................................................................................... 23
Fund – Department Matrix ......................................................................................................................... 24
City Council Goals .................................................................................................................................. 25‐27
FINANCIAL TRENDS
General & Economic Information .......................................................................................................... 29‐30
Revenue Trends & Assumptions ............................................................................................................ 31‐35
Resources & Requirements ........................................................................................................................ 36
Budgets .................................................................................................................................................. 37‐38
Debt ....................................................................................................................................................... 39‐41
Property Taxes and Comparative Tax Rate ........................................................................................... 42‐43
BUDGET SUMMARY
Budget Overview and Highlights ........................................................................................................... 45‐50
All Funds Combined .................................................................................................................................... 51
Resource & Requirement by Fund Type ..................................................................................................... 52
Fund Descriptions and Summary by Fund ............................................................................................. 53‐56
Consolidated Fund Summary ................................................................................................................ 57‐60
Capital Expenditures ................................................................................................................................... 61
Fund Balances ........................................................................................................................................ 62‐64
Staffing History ...................................................................................................................................... 65‐67
Staffing Allocations ..................................................................................................................................... 68
Summary of Employee Benefits ................................................................................................................. 69
Department Summaries ........................................................................................................................ 70‐97
FUNDS & DEPARTMENTS
Administrative Services
Summary ......................................................................................................................................... 99‐100
City Manager’s Office ................................................................................................................... 101‐102
City Attorney’s Office .................................................................................................................... 103‐104
City Records .................................................................................................................................. 105‐106
Human Resources ........................................................................................................................ 107‐108
Finance
Non‐departmental ..................................................................................................................... 109‐110
Information Systems ................................................................................................................. 111‐112
Utility Billing .............................................................................................................................. 113‐114
5

TableofContents
Public Works (Administrative Services)
Non‐departmental ..................................................................................................................... 115‐116
Facility Maintenance ................................................................................................................. 117‐118
General Administration ................................................................................................................ 119‐121
Public Works
Streets ........................................................................................................................................... 122‐125
Street Lighting ............................................................................................................................... 126‐127
Transportation Improvements ............................................................................................................ 128
Off‐Site Transportation ........................................................................................................................ 129
Stormwater ................................................................................................................................... 130‐132
Sewer ............................................................................................................................................ 133‐134
Sewer Reserve ..................................................................................................................................... 135
Water ............................................................................................................................................ 136‐139
Water Facility Replacement ................................................................................................................. 140
Park Improvements ............................................................................................................................. 141
General Fund
Summary ....................................................................................................................................... 142‐143
Non‐Department Resources ......................................................................................................... 144‐145
Non‐Department Requirements ................................................................................................... 146‐147
Park Operations ............................................................................................................................ 148‐150
Community Development ............................................................................................................ 151‐152
Municipal Court ............................................................................................................................ 153‐154
Police ............................................................................................................................................ 155‐158
Revenue Sharing .................................................................................................................................. 159
Urban Renewal
Summary .............................................................................................................................................. 160
Program Funds .............................................................................................................................. 161‐162
Tax Increment ...................................................................................................................................... 163
Other Funds
Community Center ....................................................................................................................... 164‐165
Public Education Government Access ................................................................................................. 166
Law Enforcement Grants ..................................................................................................................... 167
Housing Rehabilitation Program .......................................................................................................... 168
Energy Efficiency Loan Program .......................................................................................................... 169
Keizer Station Local Improvement ............................................................................................... 170‐171 LONG RANGE PLANNING
Introduction .............................................................................................................................................. 173 General Fund ..................................................................................................................................... 174‐178 Civic Center Sinking Fund ......................................................................................................................... 179Stormwater & Water Fund ................................................................................................................ 180‐182
GLOSSARY
Common Budget Terms ..................................................................................................................... 184‐190
6

Budget Message
ooookkkk
7

CityManager’sBudgetMessageCityofKeizer
FiscalYear2016‐17 Honorable Mayor Clark, City Councilors, Budget Committee and Citizens of Keizer: The Manager Recommended budget carries out the City Council’s goals and policy direction by: Continuing work toward providing the City Council the information and tools necessary to lead a
community discussion on, and create a policy direction for any future urban growth boundary expansion by funding the periodic review order compliance for the urban growth boundary expansion project,
Funding the bi-annual citizen survey to continue ongoing community engagement, and Supporting Parks by allocating 3.6% of general fund revenues to park operations.
Overall the fiscal year 2016-17 operating budget is consistent with fiscal year 2015-16 with the exception of not filling a vacant police officer position. Once sustainable funding is identified the police officer position will be recommended for reinstatement. Staff will use mid-year revenue projections to evaluate our ability to reinstate the vacant Police officer position. The operating budget also provides for strategic increases in spending for the Police vehicle fleet, citizen survey and increasing the reserve for Civic Center improvements. These strategic measures will allow the City to maintain existing service levels into the future, prepare for replacement of aging assets, and continue to balance the overall budget. The City is expecting overall operating revenues to increase 4% over the prior year. The primary revenue increases are from property taxes which include a 3%-increase in assessed values and a 1%-increase in growth and Charges for Services which include: a proposed 4% water rate increase, a proposed $0.50 per ESU Storm Water rate increase, and an expected 3% sewer rate increase. The City of Salem, who manages the City’s sewer infrastructure,
sets the rates for the regional system.
The rate increases are needed to sustain service levels and fund capital improvements. The City’s Long-Range Planning committee convened in April to look at the sustainability of its services and rank initiatives for potential increases in service levels for future years. The forecasting documents are intended to project the long‐term consequences and opportunities associated with the decisions we make today. While stable economic indicators continue, the City is mindful to ensure that all increases in service level are sustainable into the near future. I thank the City Council and Budget Committee for providing helpful policy direction in creating this balanced budget, the important questions you ask, and the requests for detail needed to understand and appreciate the City services. Respectfully submitted, Christopher Eppley City Manager
8

City
Overview
City Demographics .................................................................................................
Budget Process & Calendar ...................................................................................
Financial Policies ....................................................................................................
Organization Chart ................................................................................................
Fund – Department Matrix ....................................................................................
City Council Goals ..................................................................................................
9

Demographics
CITY OF KEIZER
Keizer, a mid-size city in Oregon, is nestled in the center of the Willamette Valley and is recognized as the “Iris Capital of the World.” In the 1990’s, the City experienced a rapid amount of new residential building and growth, establishing Keizer as one of the fastest growing cities in Oregon. In spite of this growth, the community continues to preserve its small-town pride by supporting the largest volunteer youth baseball program in Oregon and community-wide events, such as the Keizer Iris Festival, the Festival of Lights Holiday Parade and the annual Miracle of Christmas lighting display. Opening for the first season in 1997, the Keizer Stadium is home to the Volcanoes, a Minor League baseball team affiliated with the San Francisco Giants. The citizens of Keizer can be proud of the progress of this great community. Pride, Spirit, and Volunteerism are alive and well in the City of Keizer.
DEMOGRAPHICS & STATISTICS
Incorporation 1982 City Debt
Government Council/Mayor Moody’s Bond Rating A3 Population (July 1, 2015) 36,985 General obligation debt None Neighborhood associations 2 General obligation debt limit* $91,046,820 Area in square miles 7.36 Revenue bonds debt $1,040,000 Keizer School Enrollment 7,354 Full faith and credit debt $15,495,000 Line of Credit outstanding NonePublic Safety *3% of real market value of all taxable property in Keizer Number of sworn officers 37 911 Calls for police 13,021 ECONOMIC INDICATORS
Number of holding cells 2 Largest Private Enterprise Tax Payers Assessed Value: Donahue Schriber Realty Group LP $51,968,800Culture & Recreation Target Corporation 11,444,684
Heritage center 1 Emerald Pointe LLC 11,423,418 Community center 1 Lowe’s HIW Inc 11,253,170 Neighborhood parks 15 CCP Keizer 1526 LLC 11,036,800 Community parks 2 Hawk’s Point Apartments LLC 10,701,040 Regional park 1 Keizer Road Apartments LLC 8,396,310 Dog park 1 Per capita personal income 35,489
Amphitheater 1 Total personal income $1.3 billion Splash fountain 1 Average annual unemployment 6.1% Public golf course 1 Real market value of property $3.0 billion Minor league ball club 1 Assessed value of property $2.4 billion
10
BudgetProcess BUDGETING IN THE STATE OF OREGON A budget as defined by Oregon State Law [Oregon Revised Statutes (ORS)] is a financial plan containing estimates of revenues and expenditures for a given period of purpose. Local governments in Oregon operate on a fiscal year that begins July 1 and ends the following June 30. Budgeting requires local governments to evaluate plans and priorities in light of the financial resources available to meet those needs. In Oregon, a budget is necessary to justify the need for a given rate and amount of property taxes. Oregon’s local governments are highly regulated and controlled in state statute. The state’s local budget law is set out in ORS 294. Oregon local budget law has several important objectives:
Establish standard procedures, Outline programs and services and the fiscal policy to carry them out, Provide estimates of revenues, expenditures, and proposed tax levies (if any), Inform citizens and encourage citizen involvement in budget formulation before budget
adoption, and Provide controls to promote efficiency and economy in expenditure of public funds.
BUDGETING IN THE CITY OF KEIZER Budget Adoption The City prepares its budget in accordance with state statute and City Charter. The budget is presented by fund either by function or object class. Over-expenditure in any function or object class are prohibited and unexpended budget appropriations lapse at the fiscal year’s end. As provided by City Council resolution, the Finance Director serves as the Budget Officer and has the responsibility to prepare the budget document and maintain budgetary control at the approved appropriation level. Ongoing review and monitoring of revenues and expenditure is performed by the Finance Department and the appropriate operating departments. Under the City’s expenditure limitation, total expenditures cannot exceed the final appropriation once the budget is adopted. Any amendments to the budget come about via the supplemental budget process. The City employs baseline (or status quo) budgeting which assumes current service levels are maintained into the next budget year. Increases or decreases are considered separately and are dependent upon available resources and priorities. Budget Amendments The adopted budget may be amended by budget transfers (ORS 294.463) or supplemental budget (ORS 294.471 to 294.473). By transferring appropriations, the City is able to carry out the programs prescribed in its adopted budget. There will be times, however, when an adopted budget has no authority to make certain expenditures or when revenues are received for which the City had no prior knowledge. In those cases it is possible to use a supplemental budget to authorize expenditures and/or appropriate additional revenues in the current fiscal year.
11

BudgetProcess Supplemental budgets are adopted through a process similar to that of the regular budget process (including public hearings but excluding Budget Committee meetings) and shall not extend beyond the end of the fiscal year in which they are submitted. Supplemental budgets cannot be used to authorize a tax levy. BUDGET TIMELINE AND INTERNAL PROCESS October through January Finance staff review financial position and report to City Manager and Department Directors Finance develop basic departmental and program worksheets
January City Council updates goals for the year Finance staff submit worksheets to departments for completion Department Directors gather data for departmental workload indicators Finance staff send outside budget request forms to City partners
February Finance staff compile revenue estimates Department Directors submit requests for new or expanded programs Finance compute indirect costs and interfund transfers Department Directors submit narratives for Finance staff review Finance staff develop and update long-range financial forecasts Human Resource staff provide personnel services information to finance staff for incorporation in
to budget March Department Directors submit preliminary budget drafts for Finance staff review City partners submit outside budget request forms Department Directors hold internal meetings on departmental budget requests
April Long Range Planning Committee meets and discusses upcoming initiative and challenges Finance staff determine City Manager proposed budget Finance staff, in coordination with Department Directors, make final adjustments to balance each
fund Finance staff prepare Proposed Budget document Finance staff deliver Proposed Budget to Budget Committee members and post on City web site City Recorder advertise notice of Budget Committee public hearings City Recorder advertise notice of State Shared Revenues public hearings
12

BudgetProcess May City Manager presents budget message at opening meeting of Budget Committee, public
testimony received Continue Budget Committee meetings, deliberations, discuss changes, approve the budget and
specify tax levies Finance staff update budget to reflect committee changes, if any City Recorder advertise notice of State Shared Revenues City Recorder advertise budget adoption public hearing and publish legal forms summarizing
approved budget June Council receives public input on budget approved by Budget Committee Council discusses and proposes changes, if any Council passes resolutions for state revenue sharing eligibility and proposed uses Council adopts budget, makes appropriations and declares tax levies Finance staff finalize Adopted Budget, distribute and post on City Website
July Adopted Budget takes effect Finance staff submit budget packets to County Assessor and revenue sharing certifications to
State of Oregon BUDGET COMMITTEE The Budget Committee reviews and approves the budget as proposed by the City Manager and Budget Officer. The committee consists of the governing body (City Council) plus an equal number of voters within the City. The non-elected positions are appointed by the Council and serve three year terms. Terms are staggered so no more than three members’ terms expire in any given year. Keizer’s Budget Committee consists of fourteen members. Each member has an equal vote. The City alternates between Council members and non-elected members each year to serve as chair of the Budget Committee. Members receive no compensation for their services. The Budget Committee reviews the proposed budget as presented by the City Manager. The Committee may approve the proposed budget intact, or change part or all of it prior to final approval. After notices and publications are filed according to law, the budget is forwarded to the City Council for formal adoption prior to June 30. The powers and duties of the Budget Committee are: Receive the proposed budget Receive public testimony Discuss and deliberate on the budget Request from officers or employees information the committee requires for the revision of the
proposed budget Specify the ad valorem property tax amount or rate Approve the proposed budget with changes as voted on by the committee
13

BudgetProcess The Budget Committee is comprised of: City Council Member Citizen Members
Cathy Clark, Mayor Allen Barker Dennis Koho, President Ron Bersin Bruce Anderson Charlotte Clark Kim Freeman Joseph Gillis Roland Herrera Jerry McGee Marlene Parsons Nelson Sossamam Amy Ryan Jonathan Thompson
After the Budget Committee reviews and recommends changes, if any, the budget is forwarded to the City Council for formal adoption prior to June 30. Once the budget hearing has been held, the governing body can make changes to the budget that was approved by the budget committee. Any expenditure in any fund can be reduced as long as resources and requirements in the fund remain in balance. The total budget must also remain in balance. No additional process steps are required when expenditures are reduced. Any tax levy can be reduced from the rate or amount that was approved by the Budget Committee. Otherwise, no additional process steps are required when taxes are reduced. Expenditures may be increased. If the total increase in a fund exceeds $5,000 or 10 percent, whichever is greater, then no additional process steps are required. However, if the expenditures in any fund are increased by more than $5,000 or 10 percent, the governing body must publish notice of a second budget hearing and a new financial summary, and hold the second hearing before the adjusted budget can be adopted. If taxes are increased at all above the rate or amount approved by the budget committee, a second notice and hearing are required before a budget including those additional revenues can be adopted. Oregon law prohibits the increase of a municipality’s tax rate above its permanent rate ($2.0838 for Keizer). BUDGETING BY FUND The City’s budget is organized on the basis of funds and each is considered a separate accounting entity. The operations of each fund are accounted for with a separate set of self-balancing accounts. The various funds are grouped by three types: governmental funds, proprietary funds, and fiduciary funds. Governmental funds finance two-thirds of the City’s services and include the general fund, special revenue funds, debt service funds, and capital projects funds. Proprietary funds are used to account for the City’s activities that are similar to those often found in the private sector and include enterprise and internal services. All of the City funds in the budget document are listed later on in this section and are appropriated.
14

BudgetProcess Major funds represent the significant activities of the City and basically include any fund whose revenues or expenditures, excluding other financing sources and uses, constitute more than 10% of the revenues or expenditures of the appropriated budget. The City’s funds are budgeted by either:
Organizational unit – any administrative subdivision of a municipal corporation, especially one charged with carrying on one or more functions or activities, or
Program and Activities – A group of related activities aimed at accomplishing a major service or function for which the municipality is responsible.
BASIS OF ACCOUNTING Budget Basis All of the funds are budgeted using the modified accrual basis of accounting in accordance with budgetary accounting practices. In modified accrual, revenues are recognized when they become measurable and available. Measureable means that the dollar value of the revenue is known. Available means that it is collectible within the current period or soon enough after the end of the current period to pay off liabilities of the current period. Significant revenues that are considered to be measurable and available under the modified accrual basis of accounting are property taxes, franchise fees, and assessment lien installments received within approximately 60 days of the end of the fiscal year. Expenditures are recognized when the liability is incurred, except for interest on general long-term obligations which is recorded when due. Audit Basis The Audit, as reported in the Comprehensive Annual Financial Report (CAFR), accounts for the City’s finances on the basis of generally accepted accounting principles. Generally Accepted Accounting Principles or GAAP is defined as conventions, rules, and procedures necessary to describe accepted accounting practice at a particular time. The modified accrual basis of accounting, a GAAP-approved method, is also used in the audit for all funds except for the Proprietary Fund Types. The audit uses the full accrual method of accounting for the Proprietary Funds. The CAFR shows all of the City’s funds on both a budgetary and GAAP basis for comparison purposes.
15

BudgetCalendar
Friday, April 15 & Friday, April 22
Notice of Budget Committee meeting on City Budget posted to website and for publication for purpose of receiving proposed budget, and a public hearing to be held on Tuesday, May 3 on the proposed budget and state revenue sharing.
Wednesday, April 27 Budget documents to be distributed to Budget Committee
Tuesday, May 3
6:00 p.m. City Budget Committee Meeting Election of City of Keizer Budget Committee Chair Approval of Budget Calendar Public Testimony Presentation of City of Keizer Budget Message Staff presentations & discussions
Thursday, May 5
6:00 p.m. City Budget Committee Meeting Public Testimony Continuation of presentations and discussion
Tuesday, May 10
City Budget Committee Meeting Continuation of discussion from Thursday, May 5th as needed Budget recommendations to City Council
Tuesday, May 17 6:00 p.m.
Alternate meeting to complete City Budget (if needed)
Friday, May 20 Financial Summaries and notice of budget hearings for publication
Monday June 6 7:00 p.m.
Public hearing on City Budget. Council adoption of City Budget, if approved.
Monday June 20 7:00 p.m.
Alternate public hearing on City Budget (if needed). Council adoption of City Budget.
16

FinancialPolicies STATEMENT OF FINANCIAL POLICIES Financial management policies provide guidelines for the City Council and staff to use in making financial decisions that ensure core services are maintained and the Council’s vision for the community is achieved. In addition, financial policies provide a level of security for the community by ensuring tax dollars, user charges and other public resources are being used openly, legally, efficiently and effectively and in a manner that provides insulation from fiscal crisis and economic disruption. The City’s financial policies accomplish the following: 1. Ensure the financial integrity and accountability of the City 2. Ensure compliance with financially related legal mandates, laws and regulations 3. Guide policy decisions that have a significant fiscal impact and direct attention to the total financial picture of
the City rather than single-issue areas 4. Ensure the City maintains a financial base to sustain a consistent level of municipal services 5. Ensure the City is able to withstand local and regional economic variations 6. Adjust to changes in the service requirements of the community GENERAL 1. The City shall keep City government costs and services to a minimum by providing City services to the
community in a coordinated, efficient and least cost fashion. 2. The City shall seek federal, state, and local funding to support its current priorities and policy objectives. 3. The City shall initiate, encourage, and participate in economic development efforts to create job opportunities,
broaden the community’s tax base and strengthen the local economy. 4. The City shall commit existing resources to continue developing a proactive Police Department with a strong
Problem-oriented Policing philosophy. 5. The City’s shall set the anniversary dates for all financially related decisions at July 1 of each year in its
contractual agreements. OPERATING BUDGET Present a balanced budget that serves as a policy document, financial tool, and communications tool, to demonstrate fiscal integrity and measure performance. 1. The City shall comply with Oregon Budget Law in preparing, presenting, adopting and amending the annual
budget. 2. The City shall adopt a balanced budget based on one of the following scenarios:
a. Revenues equal expenditures b. Revenues exceed expenditures c. Revenues plus appropriated fund balances equal expenditures
3. Revenue forecasts shall be based on actual historical data adjusted for any known changes in the underlying assumptions. Assumptions will be based on likely outcomes versus more extreme aggressive or conservative outcomes.
4. The City shall operate on a current funding basis. Expenditures shall be budgeted and controlled so as not to exceed current revenues plus the planned use of fund balance accumulated through prior years.
17

FinancialPolicies LONG-RANGE PLANNING Provide “road map” for where the City wants to go financially and how it plans to get there, by combining financial forecasting with financial strategizing. 1. The City shall develop and maintain a financial forecast for each operating fund. The first year shall be the
current year’s adopted budget and the ensuing years shall be forecasts. 2. Operating budgets shall be tested for sustainability using long-range forecasts. Corrective action plans will be
created and implemented in the year deficiencies are noted. 3. All fund designations and reserves will be evaluated annually for long-term adequacy and use requirements in
conjunction with development of the City’s Long-Range Financial Forecast. 4. The City’s updated Long-Range Financial Forecast is a picture of the City’s financial future given existing
resources and service levels and agreed upon assumptions. The Long-Range Financial Forecast is the basis for preparing the Long-Range Financial Plan. The Long-Range Financial Plan incorporates changes in resources and service levels as needed to attain a sustainable financial condition while providing an acceptable level of service.
5. Major financial decisions shall be made in the context of the Long-Range Financial Plan. CAPITAL IMPROVEMENT PLANS (CIPS) Annually review and monitor the state of the City’s capital equipment and infrastructure, set priorities for replacement and renovation based on needs, funding alternatives and availabilities of resources. 1. The City will develop a multi-year plan for capital improvements, update it annually and make all capital
improvements in accordance with the plan. 2. The City will maintain its physical assets at a level adequate to protect the City’s capital investment and to
minimize future maintenance and replacement costs. The budget will provide for adequate maintenance and orderly replacement of capital assets from current revenues where possible.
3. Capital projects will conform to the following criteria: a. Will be part of an approved City plan b. Will be part of a maintenance and/or replacement schedule c. Will minimize operating costs d. Will be selected according to the established Capital Improvement Plan
4. The capital budget process works in conjunction with the regular operating budget process. CIP projects are flagged as funded or unfunded depending on whether or not the forecasted operating budget can support or fund the project. All funded CIP projects are included in the operating budget for the current budget year.
REVENUES Design, maintain and administer a revenue system that will assure a reliable, equitable, diversified and sufficient revenue stream to support desired City services. 1. The City will strive to maintain a diversified and stable revenue system to shelter the government from short-
run fluctuations in any one revenue source. 2. The City shall collect revenues aggressively, including past due bills of any type. 3. Restricted revenue will only be used for the purposes legally permissible and in a fiscally responsible manner. 4. One-time revenue will be used for one-time expenses whenever possible. If one-time revenue is considered
for ongoing expenditures the City will balance the need for the additional ongoing expenditure with the on-going ability to pay prior to approving the program.
18

FinancialPolicies 5. Fees, licenses, permits and fines shall be set to recover the City’s full cost (operating, direct, indirect, capital) of
providing the related service. A fee shall be charged for any service that benefits limited interests within the community, except for basic unavoidable human needs type services provided to persons with limited ability to pay. Such concessions shall be authorized by Council resolution. Fees will be indexed periodically using a formula adopted by Council resolution for that fee.
6. Enterprise and Internal Service operations will be self-supporting. 7. As provided for in the City Charter, all revenue generated by the Water Fund shall be used exclusively to pay
for Water Fund expenses. 8. Utility fees and related system development charges will be based on the cost of providing the service so that
total resources of each utility are at least equal to its operating expenditures, reserves, debt coverage and planned infrastructure replacement.
9. The City shall follow State adopted guidelines in setting fines and forfeiture amounts. EXPENDITURES Identify priority services, establish appropriate service levels and administer the expenditure of available resources to assure fiscal stability and the effective and efficient delivery of services. 1. All purchases shall comply with State laws and regulations and the City’s Purchasing Policies. 2. The City shall take immediate corrective actions if at any time during the fiscal year expenditure and revenue
re-estimates are such that an operating deficit is projected at year-end. Corrective actions can include a hiring freeze, expenditure reductions, fee increases (if approved by City Council), or use of contingencies. Expenditure deferrals into future years, short-term loans, or use of one-time revenues to balance the budget shall be avoided.
3. The City shall undertake periodic staff and third-party reviews of City programs for both efficiency and effectiveness. Privatization and contracting with other entities will be evaluated as alternatives to service delivery. Programs that are determined to be inefficient and/or ineffective shall be reduced in scope or eliminated.
4. The City shall make every effort to maximize any discounts offered by creditors/vendors. Staff shall also use competitive bidding to attain the best possible price on goods and services.
5. The City shall commit a minimum 2.5% of General Fund Budgeted Revenues (net grants and other dedicated revenues) to the operation and maintenance of its Park system.
6. Subject to available funding and budget approval, salary surveys for all classifications will be performed on a schedule of no less than every four years.
7. Beginning in fiscal year 2016-17 the City needs to pay $208,700 each year over the next six years to repay the Salem-Keizer School District for tax increment revenue foregone to the Keizer Urban Renewal District. By contractual agreement, repayment of $1,252,205 must be paid by December 2022. The additional property tax revenues received into the General Fund beginning in fiscal year 2015-16 will be sufficient to cover this expense.
CONTINGENCIES, UNANTICIPATED EXPENSES, RESERVES, AND FUND BALANCE Maintain contingencies, reserves, and ending fund balances of the City’s operating funds at levels sufficient to protect the City’s credit as well as its financial position from adversity. 1. Funds shall be set aside each year to build reserves necessary to fulfill long-term commitments. 2. Fund balance in each of the City’s operating funds is projected to ensure that there is adequate cash on hand
to meet the expected cash flow needs for that fund. 3. General Fund:
a. Contingency levels are based on historical usage and represent approximately 1% of operating expenditures (Personnel Services and Materials and Services less grant expenditures).
19

FinancialPolicies
b. Ending fund balance is projected to ensure that there is adequate cash on hand to meet the expected cash flow needs from July until November, when the bulk of the property tax revenue is received. Ending fund balance shall be at least 15% of annual operating revenues.
4. Street Fund: a. Contingency is 5% of operating expenditures (Personnel Services and Materials and Services). b. Unanticipated expenses within the Capital Outlay category shall be at least 10% of appropriated
expenditures. Use of these funds shall be identified and then authorized by City Council prior to expenditure.
c. Fund balance provides for at least a 30-day cash supply to correspond with the monthly gas tax revenue receipts.
5. Sewer Fund: a. Contingency is 5% of total expenses less the Salem Sewer Payments which are a pass-through of Salem
Sewer Billings. b. Fund balance provides for at least a 60-day cash supply to correspond with the bi-monthly sewer billings.
6. Water Fund: a. Contingency equals 5% of total expenditures (excluding debt service), as provided for in the Cost of
Service Analysis adopted by the City Council. b. Unanticipated expenses within the Capital Outlay category shall be at least 10% of appropriated
expenditures. Use of these funds shall be identified and then authorized by City Council prior to expenditure.
c. Fund balance provides for at least a 60-day cash supply, as provided for in the Cost of Service Analysis adopted by the City Council.
7. Water Facility Fund: a. Unanticipated expenses within the Capital Outlay category shall be at least 10% of appropriated
expenditures. Use of these funds shall be identified and then authorized by City Council prior to expenditure.
b. The Water Bond covenant requires a reserve in the amount of $234,100 for debt service. 8. Street Lighting Districts Fund:
a. Contingency shall be at least 5% of operating expenditures (Personnel Services and Materials and Services).
b. The City has contractual agreements with various property owners to set aside reserves for pole replacement. Reserves are funding through assessments collected through property tax bills.
c. Ending fund balance is projected to ensure that there is adequate cash on hand to meet the expected cash flow needs from July until November, when the bulk of the lighting assessments are received. Ending fund balance shall be at least 15% of annual revenues.
9. Stormwater Fund: a. Contingency shall be at least 5% of total expenditures. b. Fund balance shall provide for at least a 60-day cash supply to correspond with the bi-monthly
stormwater billings. 10. Administrative Services Fund:
a. Reserves shall be maintained for Civic Center Improvements using a long-range replacement forecasting model. Reserves are appropriated to contingency each year so that funds may be accessed to cover unforeseen expenses.
b. General, auto and liability insurance reserves shall be maintained at the maximum exposure level as defined in the City’s insurance policy agreement. Reserves are appropriated to contingency each year to cover the maximum claims loss if needed.
11. Debt reserves shall be maintained in the amounts provided for in the debt covenants.
20

FinancialPolicies CAPITAL ASSET MANAGEMENT Safeguard the capital assets of the City which is property owned in-common by the citizens of our community. 1. Capital assets will not be degraded, given away, or allowed to deteriorate except by action of the City Council. 2. Capital assets include land, right-of-way, buildings, improvements, equipment, infrastructure, and other
tangible and intangible assets costing $5,000 or more and used in operations that have initial useful lives extending beyond two years.
3. Adequate insurance shall be maintained on all capital assets. 4. GASB 34: The Government Accounting Standards Board (GASB) requires local governments to report
infrastructure and depreciation on all capital assets. The City shall maintain compliance with this requirement. INVESTMENTS Invest the City’s operating cash to ensure its legality, safety, necessary liquidity, prudent risk, and to optimize yield. Legality is first priority, followed by preservation of principal, with rate-of-return last. 1. The City shall invest funds subject to arbitrage regulations, bond indenture requirements, and the Prudent
Person Rule which states that “Investments shall be made with judgment and care, under circumstances then prevailing, which persons of prudence, discretion and intelligence exercise in the management of their own affairs, not for speculation, but for investment, considering the probable safety of their capital as well as the probable income to be derived.”
2. Pursuant to the provisions of ORS 294.035 and 294.125, the City Manager is authorized to invest surplus funds to include all bond and sinking funds, into allowable investments at current market prices as described in ORS 294.035, subject to any limitations imposed by law.
3. Investment objectives are: a. Compliance with all applicable statutes and legal provisions. b. Preservation of capital and the protection of principal. c. Maintenance of sufficient liquidity to meet operating requirements. d. Avoidance of imprudent credit, market, or speculative risk. e. Attainment of a market rate-of-return throughout all economic and fiscal cycles. f. Safekeeping shall be consistent with modern investment, banking, and commercial practices and may
include physical possession, book entry, and automated recordation.
DEBT POLICIES Establish guidelines for debt financing that will provide needed capital equipment and infrastructure improvements while minimizing the impact of debt payments on current revenues. 1. The City will confine long-term borrowing to capital improvements. 2. General Obligation Debt issued by the City shall not exceed three percent of the total assessed value of
property in the City, in accordance with Oregon State law (ORS 287.004). 3. The City will follow a policy of full disclosure on every financial report and bond prospectus. 4. The City will strive to maintain its A3 Moody’s bond rating. 5. General obligation debt will not be used for self-supporting enterprise activity. 6. The City shall strive to repay its debt as expeditiously as is financially prudent within the constraints of debt
covenants as a means of reducing interest expense. 7. The City shall balance its future debt obligations with its current rate structure to ensure a balance so that
current rate payers do not bear the burden of future goods and services and future rate payers do not bear the burden of past goods and services.
21

FinancialPolicies ACCOUNTING, AUDITING AND FINANCIAL REPORTING Comply with prevailing federal, state, and local statutes and regulations. Conform to generally accepted accounting principles as promulgated by the Governmental Accounting Standards Board (GASB), the American Institute of Certified Public Accountants (AICPA), and the Government Finance Officers Association (GFOA). 1. The City shall establish and maintain a system of internal controls that is designed to provide reasonable
assurance that the City achieves the following objectives: a. Effective and efficient operations b. Reliable and accurate financial information c. Compliance with applicable laws and regulations d. Safeguarding assets against unauthorized acquisition, use or disposition
2. The financial system shall be used as the means of recording and reporting financial transactions in a way that will assist users in assessing the service efforts, costs and accomplishments of the City.
3. The City will establish and maintain only those funds that are necessary by law and for sound financial management.
4. The City shall prepare and adopt an annual budget by June 30th of each year. 5. The City shall annually prepare and publish, by December 31st of each year, a Comprehensive Annual Financial
Report (CAFR) in conformity with generally accepted accounting principles. 6. In accordance with Oregon State law, the City shall hire an independent external auditor to perform an annual
audit of the financial statements, including tests of the system of internal controls.
22

OrganizationalChart
CITIZENS OF KEIZER
City Council
City Attorney City Manager
City Recorder
Public Information
Access
Community Center
Volunteer Support
General Risk Management
Human Resources Director
Employee Risk Management
Health &Wellness
Finance Director
Accounting
Information Systems
Administrative Support
Utility Billing
Municipal Court
Police Chief
Administration
Records
Patrol
Traffic
Investigations
School Resources
Community Services
Community Development
Director
Building
Planning
Code Compliance
Public Works Director
Engineering*
Water
Stormwater
Streets
Parks
Facility Maintenance
Emergency Management
Municipal Judge*
*contracted services
23

Fund‐DepartmentMatrix
City Manager Legal
City Records
Human Resources Finance
Community Development
Public Works Police
M GENERAL FUND - By FunctionX
General Administration X X
Municipal Court X
Parks X
Police X
Revenue Sharing X
SPECIAL REVENUE FUNDSN X
N X
N X
N X
N X
N X
N X
M X
N X
PROPRIETARY FUNDSEnterprise Funds
N X
M X X
M X
N X
M X
M X
Internal Services FundM
City Attorney's Office X
City Manager's Office X
City Records X
City-Wide Administration X
Civic Center Facilities X
Finance X
Human Resources X
Network Administration X
Utility Billing X
Public Works X
DEBT SERVICE FUNDSM X
X indicates primary responsibility for budget and services providedM Major FundN Non-major Fund
Community Development
Administrative Services Fund
FUND
Street Lighting DistrictsWaterWater Facility Replacement Reserve
Energy Loan ProgramHousing Services
Sewer
Public Education Government AccessSewer ReserveStreetTransportation Improvements
Keizer Station Local Improvement District
Law Enforcement GrantOff-Site Transportation ImprovementPark Improvements
Community Center
Stormwater
24

CityCouncilGoals
Introduction Each year at a City Council work session, the Council reviews, reprioritizes and updates the City Council Goals. Below is a status update of the Council’s goal list as of February 2016.
Council Goals Established for 2015 through 2017
SHORT TERM GOALS
Goal: Explore and determine policy direction regarding Urban Growth Boundary expansion (continued from 2013-2014 short term goal list) Work with Council to evaluate and determine policy direction regarding a future UGB expansion and community dialogue.
Next Steps: 1. Perform transportation analysis for UGB discussion
Complete assessing the EOA/HNA information for Periodic Review Develop policies to address any deficiencies in Comprehensive Plan based on EOA/HNA data.
2. UGB Discussion community outreach Develop community outreach strategy to discuss the UGB topic with citizenry. Execute community outreach program and gather input.
3. Develop policy direction on UGB topic Deliberate EOA/HNA data and public comment to develop p policy direction on UGB topic.
Goal: Revisit and potentially update infill standards (continued from 2013-2014 short term goal list) Work with Planning Commission and City Council to evaluate and determine whether the adopted infill standards are in need of modification. If so, proceed with process to do so.
Next Steps: 1. Review Infill Standards
Provide Planning Commission an opportunity to review the current Infill Standards. If the PC determines the standards should be modified, then the PC makes recommendations to
Council on code revisions.2. Infill Standards Discussion community outreach
Hold public Hearing(s) on Infill Standards to receive public input. Review and deliberate Infill Standards at the City Council level.
3. Adopt changes to the Infill Standards if Council deems appropriate Council adopts revisions to Infill Standards within the Development Code.
25

CityCouncilGoals
Goal: Add an additional FTE to the Parks Department as soon as is fiscally sustainable Evaluate revenue trends and capacity versus expenditures over the next 24-months with the intent to add 1 FTE to the Parks Department as soon as is fiscally sustainable in the General Fund.
Next Steps: 1. Support City Council
Annually evaluate budget capacity to add Parks position when revenues allow the position to befunded in a sustainable manner.
Goal: Identify Parks levels of service and stable funding platform Initiate process to communicate with the community and discern a desired level of service for City Parks. Develop stable funding mechanism to support Parks at levels that are able to provide the desires level of service.
Next Steps: 1. Initiate public dialogue on Parks service levels
Hold a series of town hall forums to converse with the public on Parks issues, desired levels ofservice and funding platforms
2. Identify stable funding platform to support Parks levels of service Conduct a dialogue with the public and City Council to identify a preferred funding platform to
support Parks levels of service3. Refer to general election or Council enact
City Council refers an initiative to a general election for voter approval on the selected fundingplatform or enact such a platform if preferred
Goal: Create a task force to foster community engagement Initiate a task force to identify opportunities to engage with all cultures and groups of people within the community so as to provide an opportunity for all peoples to positively interact and have influence within their City government.
Next Steps: 1. Initiate Task Force
Initiate City Council Task Force to evaluate community engagement opportunities and strategies Work with community partners to develop forums and opportunities for positive communications
between all members of the community and their government Make recommendations to City Council on community engagement and develop strategies for
ongoing positive community involvement
26

CityCouncilGoals
Goal: Create a Youth Council program Work with Mayor, City Council, and Youth Councilor to develop a Youth Council/Page program where local high school students shadow City Councilors to gain experience with City Government and build leadership skills
Next Steps: 1. Initiate program
City Council initiates Youth Councilor/Page program
Goal: Facilitate a youth sports program round table Work with Mayor, City Council, and leadership of the various youth sports programs in Keizer to facilitate a round table forum for sharing of information and fostering collaboration.
Next Steps: 1. City Council initiates Task Force
LONG TERM GOALS
1. Take appropriate steps to liquidate any Keizer Station Area A property foreclosed upon and refund theRiver Road Renaissance program after completing a review of the program’s goals and proposedprojects (continued from 2013-2014 long term goal list)
2. Evaluate the need for a Communications Position/Volunteer Coordinator (should come from TaskForce work on Community Engagement)
3. Create Sidewalk Local Improvement District Program
4. Resolve Urban Growth Boundary issue
27

Financial Trends
General & Economic Information .......................................................................... X
Revenue Trends & Assumptions ............................................................................ X
Resources & Requirements ................................................................................... X
Budgets .................................................................................................................. X
Debt ....................................................................................................................... X
Property Taxes and Comparative Tax Rate ........................................................... X
28

General&EconomicInformation
Keizer is located in northwestern Oregon in Marion County, along the 45th parallel. As of 2015, its population was 36,985. It lies inside of the Willamette Valley and is part of the Metropolitan Statistical Area. Keizer shares its southern border with Salem, the state capitol. Keizer is primarily a residential community having a low level of commercial activity. Most new commercial development is at Keizer Station, near Interstate 5. POPULATION TRENDS
The City’s population increased marginally yet steadily over the past 10 years at an average 0.6% growth rate per year. Keizer anticipates an increase in growth over the next several years at 1.5% annually compared with the State of Oregon, which is increasing in population at 1.1% annually.
Population Trend
AVERAGE ANNUAL CPI-U
The Bureau of Labor Statistics for the U.S. Department of Labor tracks the Consumer Price Index (CPI-U) for most U.S. cities. The CPI-U is a leading economic indicator that measures inflation, which is central to assessing the cost of living and whether living standards are rising or falling. The table below shows the annual percentage change in this measure for the past 10 years. Nationally, over the last 12 months, the all items index increased 1.5 percent before seasonal adjustment.
Percent Change in Average Annual CPI-U Index Portland Oregon
Year CPI-U Increase2006 102.6%2007 103.7%2008 103.3%2009 100.1%2010 101.3%2011 102.9%2012 102.3%2013 102.5%2014 102.3%2015 100.4%
29
General&EconomicInformation
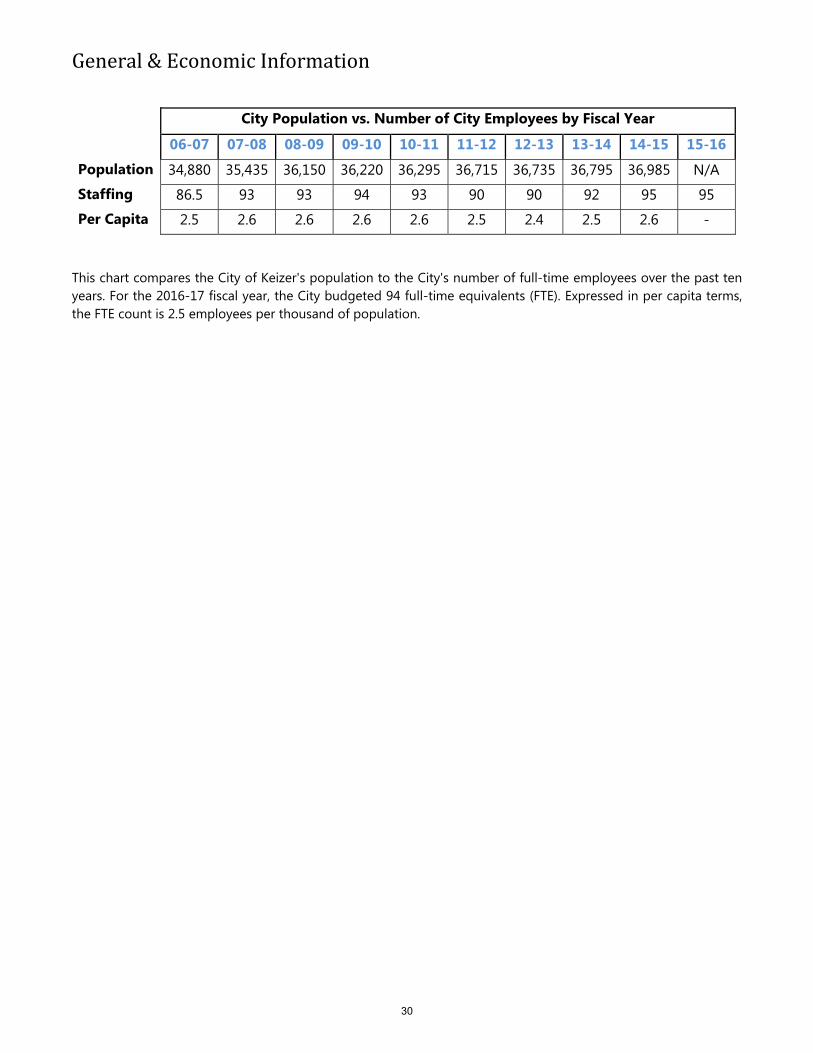
City Population vs. Number of City Employees by Fiscal Year06-07 07-08 08-09 09-10 10-11 11-12 12-13 13-14 14-15 15-16
Population 34,880 35,435 36,150 36,220 36,295 36,715 36,735 36,795 36,985 N/AStaffing 86.5 93 93 94 93 90 90 92 95 95Per Capita 2.5 2.6 2.6 2.6 2.6 2.5 2.4 2.5 2.6 -
This chart compares the City of Keizer's population to the City's number of full-time employees over the past ten years. For the 2016-17 fiscal year, the City budgeted 94 full-time equivalents (FTE). Expressed in per capita terms, the FTE count is 2.5 employees per thousand of population.
30

RevenueTrends&Assumptions
This section describes the City’s major revenue sources, explains the underlying assumptions for the revenue estimates, and discusses significant revenue trends. The City uses ‘moderate’ assumptions in its revenue projections as opposed to more aggressive or conservative estimates. The City believes this is the appropriate balance between mitigating risk and allowing the city to provide a responsible level of service. The City is expecting overall operating revenues to increase 3% over the prior year. The primary revenue increase is for taxes and assessments and an increase charges for services. This chart shows the make-up of the City’s revenue sources by category.
Taxes & Assessments
25%
Licenses & Fees 12%
Intergovernmental10%
Fines & Forfeits 2%
Charges for Services
39%
Miscellaneous 4% Debt Proceeds
2%
The revenue sources and assumptions used in the fiscal year 2016-17 budget are summarized below: TAXES AND ASSESSMENTS Property Taxes Property taxes are assessed using a levy rate on each $1,000 of assessed valuation. They are classified into three types: permanent rate levy for general purpose operations, local option serial levies for specific purposes approved by voters, and bonded debt principal and interest. The City’s permanent rate levy is a function of its permanent tax rate applied to its assessed value. The City has no local option serial levies or bonded debt levies. The budget projects the tax base levy by estimating the new assessed value and applying it to the City’s applicable tax rate. The estimation of the assessed value starts with the previous year’s assessed value and adds three factors: a growth factor (maximum allowed by law is 3%), an allowance for new construction, and an allowance for annexed property. The City’s permanent tax rate is $2.0838 per $1,000 assessed value. Assessed value is projected to be $2.4 billion for fiscal year 2016-17 compared to real market value which is approximately $3 billion; over 22% above assessed value. At $4.9 million, property tax revenues continue to be a major source of revenue for the City, comprising 25% of total revenues. Despite the economic downturn and slow recovery during the past ten year period, property taxes increased 55% or $1.7 million. A significant factor in this was the reduction of the North River Road Urban Renewal District tax increment collections. When the district collects less than the maximum allowable, those taxes revert to the overlapping jurisdictions. The North River Road Urban Renewal District completed its plan in fiscal year 2014-15 and will no longer collect tax increment revenue.
31
RevenueTrends&Assumptions
That revenue will now be allocated to the overlapping taxing jurisdictions and the City of Keizer’s share is estimated at $250,000 for fiscal year 2016-17.
Beginning in fiscal year 2008-09 real market value was 67% more than assessed value. That margin narrowed to 22% by fiscal year 2013-14 however since then the margin has slowly increased with fiscal year 2015-16 increasing to 28%. The higher the percentage the more likely the City will receive the full 3% growth in future years.
For fiscal year 2016-17, Marion County projects a 4.0% increase in current property tax revenues; 1% from new construction and 3% for increased valuation. This projection is supported by the increase construction permits taken in by the City’s Community Development Department. Over the past year, the City has had significant increases in building permits and fees, and system development charges. The impact of increased new construction will favorably impact future property tax collections.
Assessments Assessments are primarily from Local Improvement Districts (LID). An LID is a method by which a group of property owners can share in the cost of transportation and utility infrastructure improvements.
The Keizer Station Local Improvement Fund has been established to account for the improvements to the Keizer Station Development Project. Money expended in this fund was financed with a line-of-credit and an interfund loan during the construction phase of the project. Now that the project is complete, the City has arranged for long-term financing to pay off the line-of-credit and interfund loan. The cost of the improvements has been assessed to the property owners who directly benefit from the project. The assessments received will be used to pay off the long-term debt scheduled for maturity on June 1, 2031. These assessments make up 6% of the City’s total revenues. Revenue projections are based on contractual agreements with property owners totaling $1.6 million annually.
LICENSES AND FEES For 2016-17, revenue from licenses and fees is projected to be 12% of the City’s total revenues.
Franchise Fees Franchise fees are received from several franchises currently operating within the City of Keizer. These fees are collected based upon rates applied to the gross operating revenues generated within the City. Franchise fee rates have been set at 5% for natural gas, electricity, garbage, cable and broadband, water, sewer and stormwater and at 7% for telephone. Franchise Fees are an important revenue source for the City. Revenue is estimated at $2.7 million for fiscal year 2016-17 and represents 12% of total revenues. Revenue estimates are based on a five-year trend analysis and adjusted for known changes in utility rates. Over the past five years, franchise fees have increased 10% primarily due to rate increases. Electricity fee revenues make up over 41% of total franchise fees and have increased 9% during this time.
Assumptions for fiscal year 2016-17 include:
Electricity companies anticipate a 3-4% rate increase effective January 2016 which will primarilyimpact fiscal year 2016-17.
Gas companies, serving the Keizer area, experienced a 2% increase in rates during fiscal year2014-15 and have requested a 1.7% increase during fiscal year 2016-17.
32

RevenueTrends&Assumptions
Telephone franchise revenues continue to decline as more users switch from landlines to cellular phones which are not subject to franchise tax. Fiscal year 2016-17 revenue projections are based on a 5% reduction over fiscal year 2015-16 projected revenues, consistent with the current downward trend.
The area’s cable television provider is projecting a 4% increase overall in cable television revenues during calendar year 2016.
City Utility assessments and fees are expected to increase commensurate with the rate increases anticipated in fiscal year 2016-17 and include Water at 4%, Sewer at 3% and Stormwater at 9%.
System Development Charges System Development Charges (SDCs) are one-time fees based on the proposed new use or increase in use of a property. These fees apply to both new construction and residential projects which increase impact to city infrastructure. The City has four SDC fees including water, sanitary sewer, transportation, and park improvements. These fees make up 1% of the City’s total revenues. The City has seen significant increases in SDCs over the past five years from $98,000 in fiscal year 2011-2012 to over $800,000 in fiscal year 2015-16. Revenue estimates are based on expected growth of 1% in fiscal year 2016-17 using assumptions from Marion County and the City’s Community Development Department. By Council action, these SDCs are indexed annually taking an average of the Northwest construction cost index (CCI) and the change in land values in the Keizer area. Building and Permit Fees This revenue category includes, building permits and fees, and planning development review fees. All licenses and fees are authorized by council resolution or ordinance and located on the City’s website. Revenue from licenses and fees has picked up again and is gaining momentum, after the housing and development market had declined significantly. Revenue estimates are based on expected growth of 1% in fiscal year 2016-17 using assumptions from Marion County and the City’s Community Development Department. These fees make up less than 1% of the City’s total revenues. INTERGOVERNMENTAL REVENUES Intergovernmental revenues include federal, state, and local grant revenues and state-shared revenues received from the State of Oregon. All the grant revenues directly support specific programs that are reviewed annually and adjusted to incorporate any changes in funding levels. The State of Oregon collects gas, cigarette, and liquor taxes and shares these taxes with its political subdivision based upon a per capita distribution. The City’s share is budgeted at $3.9 million or 16% of the City’s total revenue. State shared revenue estimates are based on five-year trend analysis and adjusted using information provided by the State of Oregon through the League of Oregon Cities (League). Legislation passed in 2009 provided a phased-in increase in gas tax revenues which explains the 17% increase over the past five years. Now that the phase-in is complete future revenues are expected to level off. For fiscal year 2016-17 the League projects a 1% revenue increase, the City reduced its projections to 1% as past trends support the lower estimate. The State’s allocation of cigarette tax revenues to cities has declined over time; the City of Keizer’s revenues have declined 10% over the last five years. The League reports that these revenues will continue to decline and projects a 6% decrease in fiscal year 2016-17 over the previous year.
33

RevenueTrends&Assumptions
Liquor tax revenues have increased 8% in the past five years primarily from an increase in the growing distillery industry in Oregon. The League projects a 3% increase in liquor sales in fiscal year 2016-17 over the previous year.
FINES AND FORFEITS The City operates a municipal court to handle traffic citations and municipal code violations with the primary goal of encouraging compliance. These revenues have declined in recent years due to the reduced number of sworn officers. When the economy turned downward funding was no longer available to support these positions. The Police Department reinstated one-half of the Traffic Safety Unit late in fiscal year 2014-15 to help ensure traffic safety. Revenue estimates are based on five-year trend analysis adjusted for any changed in the traffic control efforts as planned by the Keizer Chief of Police.
CHARGES FOR SERVICES Utility Revenues The City operates a water and stormwater utility and does the billing for the sewer utility (which is operated by the City of Salem). Utility rates are expected to increase in fiscal year 2016-17 to keep up with operating costs and implement the capital improvement program of each utility. These revenues make up 39% of the City’s operating revenues. Revenue estimates are based on approved rate structures for each utility and adjusted for changes in consumption in consultation with the Public Works Director.
Over the past five years water consumption has declined due to customer conservation measures and wetter than average summers. These trends are offset by modest annual rate increases. Water sales revenues are expected to increase 4% over fiscal year 2015-16 commensurate with the scheduled rate increase.
Sewer charges are set using average water consumption per customer account. Revenue trends are similar to water sales given annual modest sewer rate increases are similar to water rates. Sewer revenues are expected to increase 3% in fiscal year 2016-17 over the previous year.
Stormwater charges are based on equivalent service unit (ESU) which is set at one ESU per single family dwelling and impervious surface measurements for multifamily and commercial accounts. Revenue increases are driven by rate increases and new construction which adds impervious surface to the system. The City anticipates revenues to increase 8% in the upcoming fiscal year over fiscal year 2015-16.
Administrative Services Charges Administrative Service charges represent costs between departments for administration, insurance, maintenance, and operational services and are reflected in both the resource category and as the requirements of the respective funds. Revenue estimates are based on total expenditures appropriated for the fund plus increases in reserve requirements. Revenues are expected to increase 6% over projected fiscal year 2015-16 amounts primarily due to the increases in information technology.
34

RevenueTrends&Assumptions
MISCELLANEOUS For fiscal year 2016-17, miscellaneous revenue is projected to be 5% of the City’s total revenues. Investment Income Investment income is dependent upon short-term interest rates and the amount of resources available for investment. Our investment policy, as summarized in the Financial Polices section, outlines the investment objectives as follows: legality, safety of principal, adequate liquidity, avoidance of unnecessary risk, and then obtaining a market yield. Generally, the City invests heavily in the State of Oregon Local Government Investment Pool (LGIP) and has sizable deposits with banks as needed to offset banking fees. Currently, the LGIP is earning 0.75% on its investments. For this coming fiscal year, the rate of return on the City’s investments is projected to remain very low. Investment income is budgeted in each fund based upon its estimated share of pooled cash at the projected interest rate for the upcoming year. TRANSFERS Transfers represent payments between departments for subsidizing operations or funding capital projects and are reflected in both the resource category as well as the requirements of a fund.
35

FinancialTrends–Resources&Requirements
RESOURCES BY SOURCE – FY 2016-17
Beginning Balances
32%
Taxes & Assessments
17%Licenses & Fees 8%
Intergovernmental10%
Fines & Forfeits 1%
Charges for Services
27%
Miscellaneous 3% Debt Proceeds
1%
For fiscal year 2016-17, total resources come to $38 million. Charges for Services support the City’s utilities including Water, Sewer and Stormwater. Property tax revenues, including delinquencies continue to be a major source of resources for the City. For this fiscal year, City property taxes are projected to be 4% above the previous fiscal year.
REQUIREMENTS BY USE – FY 2016-17
General Fund22%
Special Revenue Funds16%
Debt Service Funds
4%Internal Services Fund9%
Enterprise Funds27%
Fund Balance & Contingency
22%
Requirements are balanced to fiscal year 2016-17 resources at $38 million. As the pie chart above shows, 22% or $8 million of this fiscal year’s requirements are budgeted as contingency and ending fund balances. The remaining budgeted requirements are allocated between the General Fund, Special Revenue Funds, Capital Projects, Debt Service and Utility Funds.
36

The above graph depicts the total operating expenditures by category for the past ten fiscal years, adjusted for inflation. The spike in FY07-08 depicts payoff of a line of credit used for the construction of the Keizer Station Area A development. Spikes in debt service payments in FY12-13 and FY13-14 represent pay down of Keizer Station Local Improvement District debt resulting from the foreclosure of delinquent properties. Proceeds from these properties were used to repay debt owed by those properties. Operating costs, other than debt service have increased gradually over the ten year period.
FinancialTrends‐Budgets
This graph depicts the total resources budgeted in each fund category for the past ten fiscal years. The graph indicates the combined General Fund, which includes General Services, Parks Operations, Community Development, Municipal Court and Police Services. The Utility funds include Water, Sewer and Stormwater both Operations and Capital Improvements. The large spike in FY07-08 in the Keizer Station LID Fund depicts the receipt of long-term debt proceeds to pay infrastructure improvements for the Keizer Station development. The property owners who benefited from these improvements repay the City through assessments. The Urban Renewal Funds significantly declined in recent years as the district accomplished its plan and stopped collecting tax increment revenue at the end of FY14-15.
Total Budgeted Resources by Fund Categories
Operating Budget
$0
$10,000,000
$20,000,000
$30,000,000
$40,000,000
$50,000,000
$60,000,000
$70,000,000
$80,000,000
07‐08 08‐09 09‐10 10‐11 11‐12 12‐13 13‐14 14‐15 15‐16 16‐17
Other Funds
Urban Renewal Funds
Keizer Station LID Fund
Utility Funds
Street Fund
General Fund
$0
$10,000,000
$20,000,000
$30,000,000
$40,000,000
$50,000,000
$60,000,000
07‐08 08‐09 09‐10 10‐11 11‐12 12‐13 13‐14 14‐15 15‐16 16‐17
Operating Transfers
Personnel Services
Materials & Services
Debt Service
37

FinancialTrends‐Budgets
Capital Budget
The above graph depicts the total capital expenditures by category for the past ten fiscal years, adjusted for inflation. Capital Outlay in FY06-07 through FY08-09 included construction of a new Civic Center and road, water and stormwater improvements. Capital construction in FY09-10 through FY16-17 is for road, water and stormwater improvements.
Reserves, Contingencies and Ending Fund Balances
The above graph depicts budgeted reserves, contingencies, and unappropriated ending fund balances for the past ten fiscal years, adjusted for inflation. Generally, these balances reflect what is left after revenues and expenditures have been accounted for. Each year, these balances have met or exceeded the City’s adopted policy in their respective area. Reserves beginning in FY07-08 are primarily for the Keizer Station Local Improvement District debt. The City has also established contingencies and reserves for Liability Insurance and Civic Center Facility Improvements.
$0$1,000,000$2,000,000$3,000,000$4,000,000$5,000,000$6,000,000$7,000,000$8,000,000$9,000,000
$10,000,000
07‐08 08‐09 09‐10 10‐11 11‐12 12‐13 13‐14 14‐15 15‐16 16‐17
Fund Balance
Contingency
Reserves
$0
$5,000,000
$10,000,000
$15,000,000
$20,000,000
$25,000,000
07‐08 08‐09 09‐10 10‐11 11‐12 12‐13 13‐14 14‐15 15‐16 16‐17
Capital Transfers
Capital Outlay
38

The City anticipates having to issue up to $2.0 million in additional debt for the replacement of the bridge over Claggett Creek on Dearborn Ave NE during Fiscal Year 2017-18.
The above graph depicts the City's debt service (principal and interest payments) on its bonded indebtedness. Since the Keizer Station Local Improvement District (LID) bonds are 21-year bonds, the graph is extended out to fiscal year 2028-29. Debt service payments increased dramatically in fiscal year 2008-09 when the City made its first debt service payment on the LID bonds. During fiscal years 2009-10 through 2013-14 a few property owners defaulted on their assessment payments, the City foreclosed on these properties and used the proceeds to repay its debt. Fiscal years 2016-17 through 2028-29 assume all assessment payments will be made on time and the final debt service payment will include use of the debt reserve. Principal payment on this debt is not due until maturity on June 1, 2031, however, the City plans on making annual debt service payments equal to the amount of assessment payments received from property owners. This strategy will allow the City to pay off the debt in FY28-29.
Annual Debt Service on Gross Bonded Debt
FinancialTrends‐Debt
The above graph shows the City's total gross bonded debt. ORS 287.004 sets a legal limit on General Obligation (G.O.) debt at 3% of the total real market value in the city. Real market value is $3,034,894,344, giving a debt limit of $91,046,830 compared to $15,495,000 G.O. debt outstanding. The City's gross bonded indebtedness has stayed less than 1%, well below this limit. The graph reflects existing general obligation bond issues only and does not project for any future debt issuance.
Gross Bonded Debt
-
20,000,000
40,000,000
60,000,000
80,000,000
100,000,000
120,000,000
07-08 08-09 09-10 10-11 11-12 12-13 13-14 14-15 15-16 16-17
Bonded Debt LimitsGross Bonded Debt
$0$1,000,000$2,000,000$3,000,000$4,000,000$5,000,000$6,000,000$7,000,000
39

Keizer Station Local Improvement District Debt Service SchedulePayment
DatePrincipal Balance
Principal Payment
Interest Payment Total Payment
12/1/2016 15,495,000 - 402,870 402,870
6/1/2017 15,495,000 - 402,870 402,870
12/1/2017 15,495,000 - 402,870 402,870
6/1/2018 15,495,000 - 402,870 402,870
12/1/2018 15,495,000 - 402,870 402,870
6/1/2019 15,495,000 - 402,870 402,870
12/1/2019 15,495,000 - 402,870 402,870
6/1/2020 15,495,000 - 402,870 402,870
12/1/2020 through 12/1/2030 15,495,000 - 8,460,270 8,460,270
6/1/2031 15,495,000 15,495,000 402,870 15,897,870
$15,495,000 $12,086,100 $27,581,100
REVENUE BONDS
Interest Rate
Original Date
Maturity Date
Original Principal
Principal Outstanding
Coverage Ratio*
4.10% 9/30/2005 9/1/2020 2,600,000$ 1,040,000$ 2.64%
*
235,000$
Coverage ratio required by the Water Revenue Loan is 1.25. In other words, the net operating revenues pledged by these funds must exceed their annual debt service payments by at least this ratio. To date, the City's revenue bond has all exceeded these coverage requirements.
2005 Water Revenue Loan
FinancialTrends‐DebtService
Full faith and credit bonds are long-term obligations that are payable solely from a designated source of revenue. They do not carry any taxing power. The Keizer Station Local Improvement District Debt is the City's one full faith and credit bond outstanding. Assessment payments from property owners are used to pay this debt. Interest payments are due semi-annually and principal is not due until maturity. The debt service schedule below represents the City's legally obligated debt service requirements. However, the City intends to make principal payments semi-annually from assessments received. Future assessments due and existing reserves are sufficient to repay the full principal and interest due on this debt.
FULL FAITH AND CREDIT BONDS
Revenue bonds are long-term obligations that are payable solely from a designated source of revenue. They do not carry any taxing power or general fund pledge as security. Currently, the City has one revenue bond issue outstanding:
Annual Debt Service
40

FinancialTrends‐DebtService
Principal Payable
Interest Payable Total
190,000 - 190,000
200,000 - 200,000
210,000 - 210,000
215,000 - 215,000
225,000 - 225,000
1,040,000$ -$ 1,040,000$
Debt Outstanding
Debt Per Capita
Debt as % of RMV
Statutory Maximum
Revenue Bond, debt ratios 1,040,000$ 28.12$ 0.03% NA
REIMBURSEMENT AGREEMENT
[1] Note: the City of Keizer is a North River Road Urban Renewal District overlapping taxing jurisdiction, however, the City did not elect to be repaid for foregone taxes.
Fiscal Year End
The City entered into reimbursement agreements with the North River Road Urban Renewal District’s overlapping taxing jurisdictions to repay the districts for their foregone revenues as described in the agreements. The City has repaid all Districts[1] the amounts owed for tax increment collected plus interest at 4% per annum, except the Salem-Keizer School District. The City closed the Urban Renewal District at the end of fiscal year 2014-15 and the Urban Renewal District no longer collects tax increment revenue.
June 30, 2017
June 30, 2018
June 30, 2019
June 30, 2020
June 30, 2021
Water Revenue Loan Debt Service Schedule
Beginning in fiscal year 2016-17 the City needs to pay $208,700 each year over the next six years to repay the Salem-Keizer School District for tax increment revenue foregone to the Keizer Urban Renewal District. By contractual agreement, repayment of $1,252,205 must be paid by December 2022. The additional property tax revenues received into the General Fund as the result of closing the Urban Renewal District will be sufficient to repay the annual obligation to the Salem-Keizer School District.
41

City Property Tax Revenues 104%1 District Assessed Value $2,373,579,515 $2,468,522,6962 Permanent Tax Rate per $1,000 $2.0838 $2.08383 Gross Property Tax Revenues $4,946,065 $5,143,9084 Penalties/Compression/Adjustments 2,8945 Property Tax Revenues $4,948,959 $5,143,9086 Uncollectables and Discounts (5.0%) (247,448) (257,195) 7 Net Anticipated Tax Collected 4,701,511$ 4,886,712
Total Real Market Value Compared to Assessed Value (000's) for City of Keizer
FinancialTrends‐PropertyTaxes
2015-16 Actual
Tax Revenue
2016-17 Estimated Tax
Revenues
Assessed value is expected to increase 4%; 3% from the maximum growth value plus 1% for new construction.
This graph provides some insight into the growth of the City of Keizer's property values over the past 10 years. The trend shows that assessed value continues to climb and real market value took a decline with the economic downturn impacting 2009-10 values. The estimation of the assessed value starts with the previous year’s assessed value and adds three factors: a growth factor (maximum allowed by law is 3%), an allowance for new construction, and an allowance for annexed property. The assessed value now reflects about 78% of the real market value compared to fiscal year 2012-13 which was the high at 82%. This is a positive trend and shows that real market value is increasing faster than assessed value which has a legal cap as previously noted.
‐
500,000
1,000,000
1,500,000
2,000,000
2,500,000
3,000,000
3,500,000
2006-07 2007-08 2008-09 2009-10 2010-11 2011-12 2012-13 2013-14 2014-15 2015-16
42

FY16‐17
PopCity Tax
Rate/$1,000Fire District Tax
Rate/$1,000Park & Rec Tax
Rate/$1,000Total FTE
Total FTE/1,000 Residents
Total Tax Rate
Roseburg 21,903 8.48 3.16 158.85 7.25 11.64Beaverton 95,109 4.81 2.11 1.62 595.86 6.27 9.48Klamath Falls 21,119 5.44 2.88 219.00 10.37 8.32Woodburn 24,734 6.40 1.85 171.11 6.92 8.25Oregon City 35,266 4.52 2.56 296.48 8.41 8.02Milwaukie 20,640 4.28 2.46 197.86 9.59 7.68Albany 51,980 7.49 390.20 7.51 7.49La Grande 13,026 7.44 126.06 9.68 7.44Hillsboro 99,393 6.42 759.80 7.64 7.36Eugene 160,561 7.29 1445.11 9.00 7.29Tigard 50,787 3.77 2.11 0.09 297.65 5.86 6.91Sherwood 18,978 3.83 2.11 124.00 6.53 6.88Springfield 60,263 6.88 408.54 6.78 6.88Pendleton 16,904 6.86 159.78 9.45 6.86Salem 161,637 6.84 1158.90 7.17 6.84Redmond 27,941 4.49 1.75 0.37 206.00 7.37 6.61Bend 84,080 4.97 1.60 587.18 6.98 6.57Forest Grove 23,096 4.27 1.28 169.35 7.33 6.49Grants Pass 35,272 6.32 225.38 6.39 6.32Lake Oswego 37,999 5.35 347.30 9.14 6.29McMinnville 33,393 6.22 204.95 6.14 6.22Corvallis 54,953 5.92 434.84 7.91 5.92Wilsonville 22,026 2.65 2.11 187.21 8.50 5.70Tualatin 26,907 2.52 2.11 0.09 166.35 6.18 5.66West Linn 26,289 2.56 2.11 169.18 6.44 5.61Newberg 22,692 4.63 0.91 159.93 7.05 5.54Medford 78,557 5.30 463.00 5.89 5.30The Dalles 15,162 3.02 2.10 138.00 9.10 5.12Ashland 20,684 4.41 261.55 12.65 4.41Keizer 37,303 2.08 2.04 125.00 3.35 4.13Average FTE for All Listed Cities 7.63Average Tax Rate for All Listed Cities 6.77
Notes:
Source Documents include:
· US Census Population Estimates, July 1, 2014, (V2014) as displayed on 4.04.2016
·
· 2015-16 Budget Documents for all listed Cities and Fire Districts (FTE data), direct contact and/or Annual Report info. utilized where FTE data is not present in budget documents
ComparativeTaxRate&FTEbyCity
Tax rate calculation does not take into account Roadway Districts, Water Districts, Library Districts, or Port Authorities, which exist in a number of the above referenced cities.Total Tax Rate includes 0.77 Metro Tri-Met tax as applicable to cities in the PDX Metro area. Details available on request.
Jurisdiction
2015-2016 Tax Roll from County Assessor for Benton, Clackamas, Deschutes, Douglas, Jackson, Klamath, Lane, Linn, Marion, Multnomah, Union, Washington, and Yamhill Counties
43

Budget
Summary
Budget Overview & Highlights............................................................................... X
All Funds Combined ............................................................................................... X
Resources & Requirements by Fund Type ............................................................. X
Fund Descriptions & Summary by Fund ................................................................ X
Consolidated Fund Summary ................................................................................ X
Capital Expenditures .............................................................................................. X
Fund Balances ........................................................................................................ X
Staffing History ...................................................................................................... X
Staffing Allocations ................................................................................................ X
Employee Benefits ................................................................................................. X
Department Summaries ........................................................................................ X
44

BudgetOverview The following provides an overview of the fiscal year 2016-17 Budget as a supplement to the
Citywide Budget summaries by fund found in this section.
The total budget for fiscal year 2016-17 is $38,063,700 a 1% increase from the current year
projections primarily due to an increase in intergovernmental revenue and charges for services
offset by a decline in taxes and assessment and licenses and fees. The City’s total operating
budget, excluding transfers and debt proceeds, is $24,740,100
REVENUES
The City of Keizer is a full service organization and receives revenue from a number of sources
and for a variety of purposes. The largest source of ongoing revenue is charges for services
including water, sewer and stormwater charges. Property taxes make up the next largest revenue
source.
Revenue projections for fiscal year 2016-17 total $24,740,100 (excluding transfers and debt
proceeds). Revenue trends are described in detail starting on page 31.
EXPENDITURES
Expenditures for fiscal year 2016-17 total $29,136,300 (excluding transfers and contingency).
Personnel Services
City services are labor intensive operations including public safety and water, sewer and
stormwater utilities. Consequently, personnel services make up the largest operating expense
and include salaries and benefits. Personnel services reflect an overall increase of 4% primarily
due to salary and wage increases of 1.5% for unrepresented employees and 2.0% for employees
represented by the Local 320 and 2.5% (staggered 1.5% July 1st and 1.0% January 1st) for
employees represented by the Keizer Police Association. In addition, the budget includes a 7%
increase in medical insurance premiums. Employees from the City’s two labor groups, Keizer
Police Association and Local 320, contribute 5% to their health and dental insurance premiums
45
BudgetOverview while non-represented staff contributes 10%. The City’s share of the cost for employee health
and dental insurance is estimated at $2.0 million.
Materials & Services
Materials and Services expenditures include administrative costs, a variety of contractual
services, and operating and maintenance costs.
Capital Outlay
The City’s total capital outlay budget for fiscal year 2016-17 is $6,420,400 of which $2,265,200 is
for routine expenditures and $4,155,200 is for non-routine expenditures. A summary of total
capital expenditures is on page 61.
Debt Service
Citywide debt service is budgeted at $1,834,800 and includes the following payments:
Keizer Station Local Improvement District - $1.6 million Water Fund - $229 thousand
Transfers
The fiscal year 2016-17 Budget includes three routine transfers totaling $823,800. A $406,400
transfer from the Street Fund to the Stormwater Fund covers the cost of maintaining public
street impervious surfaces. A $400,000 transfer from the Water Fund to the Water Facility Fund
will go toward capital improvements. A $17,400 transfer from the General Fund to the Water
Fund sharing the proceeds from the cell tower in Bair Park.
FUND BALANCES
The City’s reserves and fund balances consist of restricted funds for specific purposes and
planned future expenditures, set aside for emergencies and unforeseen circumstances and for
operating capital. The City’s total projected Ending Fund Balance is $7,474,300. Projections by
fund are on pages 62-64.
46

BudgetHighlights
The fiscal year 2016-17 City of Keizer Budget was developed per the City’s Financial Policies and City Council directives, and is balanced in accordance with state budget law. The total budget is $38,063,700 and includes $6,420,400 in capital spending and $1,834,800 in debt service payments.
Since incorporating in 1982 the City of Keizer (the “City”) has embraced the philosophy that the City should keep costs and services to a minimum by providing City services to the community in a coordinated, efficient and least cost fashion. This philosophy has enabled the City to continue to provide basic services, such as public safety and community development, while maintaining the City’s infrastructure (park, street, water, sewer and stormwater) at a time when other cities were forced to make drastic cuts in response to the challenging economic environment that continues to face our country. In response to the challenging economic environment that began in fiscal year 2008-09 the City reduced its discretionary operating expenses in line with the reduction in projected revenues. These reductions allowed the City, in the short term, to continue to provide the existing services with minimal disruptions. During fiscal year 2014-15, in response to a stabilizing economic environment, the City continued to add back some of the expenses that had been previously eliminated or reduced, including the hire of a new Code Compliance Officer. The Police Department reinstated one-half of its traffic team by hiring a traffic officer (a position that had been frozen since 2009) and reassigning duties amongst its staff. The City also created and hired a new Network Support position to assist with the increasing workload in the Information Systems Division and provide critical back up to primary computer functions. The predominant short term factors that influence the decisions made in the development of the fiscal year 2016-17 budget include:
1. The City Council’s short term goals 2. Marginal increases in general fund revenues, and 3. Limited capital outlay for the Police vehicle fleet and information system upgrades in prior years.
While stable economic indicators continue, the City is mindful to ensure that all increases in service level are sustainable into the near future. The City uses long-range planning tools to assist in this endeavor (pages 173-183). The following is a summary of the financial highlights of the 2016-17 fiscal year budget. FINANCIAL AND BUDGET TRENDS The City uses ‘moderate’ assumptions in its revenue and expenditure projections as opposed to more aggressive or conservative estimates. The City believes this is the appropriate balance between mitigating risk and allowing the city to provide a responsible level of service.
47
BudgetHighlights
As shown on page 30, the City averages 0.6% growth in its population rate per year. The City expects an increase in growth over the next several years at 1.5% annually. The Consumer Price Index in Oregon for 2015 was up 0.4% over 2014. These marginal economic increases were factored into the City’s budget projections. REVENUES The City is expecting overall operating revenues to decrease 1% over the prior year. The primary revenue increase is for intergovernmental and charges for services offset by a decrease in taxes and assessments and licenses and fees. Property Taxes Property tax revenues are the General Fund’s single most important revenue source and support operating programs such as Police, Municipal Court, Parks, Community Development and Administration. The City has a permanent tax rate of $2.0838 per $1,000 of assessed value, which cannot increase under the current Oregon law. The City is expecting property tax revenue to increase approximately 4% in fiscal year 2016-17 as compared to fiscal year 2015-16. The increase is attributed to a 3% increase in assessed value and a 1% increase for new construction. Assessments Assessments are expected to decrease by 46% in fiscal year 2016-17 as compared to fiscal year 2015-16 as the result of a property owner in the Keizer Station Local Improvement District paying off their entire assessment of approximately $680,000 in fiscal year 2015-16. Intergovernmental Revenues Intergovernmental Revenues are expected to increase 15% in fiscal year 2016-17 as compared to fiscal year 2015-16 primarily from a grant the City expects to receive from the Oregon Parks and Recreation Department Grant for $456,800 to help fund restrooms, pathways and fall protection surfacing at the “Big Toy” in Keizer Rapids Park.
Charges for Services Charges for services are expected to increase approximately 4%. The increase is attributed to: a proposed 4% water rate increase a proposed $0.50 per ESU Storm Water rate increase an expected 3% sewer rate increase. The City of Salem, who manages the regional sewer system,
sets the sewer rates for the City of Keizer.
If approved, the rate increases would go into effect January 2017. Rate increases are needed to sustain service levels and fund capital improvements in the Water system as provided for in the Capital Improvement Plan. OPERATING EXPENDITURES In total, the City’s operating expenditures, which include personnel services and materials and services are expected to increase 3%.
48

BudgetHighlights
Personnel Services Personnel Services include employee salaries and wages, retirement benefits and health and welfare benefits. The City anticipates a $378 thousand increase in personnel services expense in fiscal year 2016-17 as compared to fiscal year 2015-16. A summary of employee benefit costs City-wide is provided on page 69. Salaries and Wages Employee salary and wages comprise the largest category of personnel services. Salaries and wages are expected to increase $123 thousand in fiscal year 2016-17 as compared to fiscal year 2015-16 projections. The City is subject to collective bargaining agreements with the Keizer Police Association (“KPA”) and the Laborers International Union of North America, Local 320 (“Local 320"). The KPA collective bargaining agreement provides for a 2.5% annual increase staggered with a 1.5% increase effective July 1st and a 1.0% increase effective January 1st. The Local 320 collective bargaining agreement provides for a 2.0% annual increase effective July 1st.
For employees not subject to the provisions of a collective bargaining agreement salaries and wages are projected to increase 1.5%. The City strives to provide a consistent wage and salary adjustment to all employees, represented and unrepresented alike, however a reduced adjustment is projected for unrepresented employees to help balance the General Fund budget.
The budgeted regular status full-time equivalents for fiscal year 2016-17 will be 94 employees as compared to 95 employees in fiscal year 2015-16. One vacant police officer position will be recommended for reinstatement once sustainable funding is identified. Retirement Benefits Retirement benefits provided to City employees are remaining the same but the cost of those benefits will increase approximately $34 thousand in fiscal year 2016-17 as compared to fiscal year 2015-16. The primary reason is the increase in salaries and wages which serves as the base for calculating the retirement benefits. Health and Welfare Benefits Health and welfare benefits provided to city employees will remain the same however, the cost to provide those benefits is expected to increase approximately 10% in fiscal year 2016-17 as compared to fiscal year 2015-16. Health insurance premiums will increase 7% and dental insurance premiums will increase 9%. Consistent with fiscal year 2015-16 represented and non-represented employees will be required to pay 5% and 10%, respectively, of the cost of the medical and dental insurance premiums. The City is limited in its ability to eliminate or reduce specific health and welfare benefits provided as doing so would be a violation of the terms of the collective bargaining agreement for represented employees. In addition given the total number of employees, creating separate health and welfare benefit packages for unrepresented employees in which the specific benefits could be modified would likely result in the loss of the pooled rate structure and an increase in administrative costs that would offset any potential premium expense savings. However, should rates increase beyond sustainable levels, the City will have to consider potentially significant changes, which would include collaboration and bargaining with employees and the two unions representing City employees.
49

BudgetHighlights
Materials and Services Materials and services are expected to increase $0.2 million from $9.8 million in fiscal year 2015-16 to $10.0 million in fiscal year 2016-17. The primary reasons for the increase in materials and services is due to the sewer rate increase by the City of Salem and rising costs such as liability insurance and contractual services.
NON-OPERATING EXPENDITURES Non-operating expenditures which include capital outlay and debt service are expected to increase $4.0 million in fiscal year 2016-17 as compared to fiscal year 2015-16.
Capital Outlay Capital outlay costs are expected to increase $4.2 million from $2.2 million in fiscal year 2015-16 to $6.4 million in fiscal year 2016-17. The City has appropriated over $2.5 million for development of the I-5 Chemawa southbound on-ramp should the Oregon Department of Transportation proceed with this project. Capital improvements in the Streets and Stormwater programs will also increase over fiscal year 2015-16. Debt Service Payments of principal and interest on the City’s debt obligations is expected to decrease from $2.6 million to $1.8 million as the result of a one-time principal payment of approximately $675,000 that occurred in fiscal year 2015-16 that will not recur in fiscal year 2016-17. As with recent past fiscal years, fiscal year 2016-17 will present the City with a challenging economic environment in which to operate. However, new development in the area is promising, bolstering property values and the economy in general. The fiscal year 2016-17 Budget will ensure the City continues to operate in a financially stable manner.
50

AllFundsCombinedRevenues (net eliminations)*
Expenditures (net eliminations)*
ACTUAL ACTUAL BUDGETED PROJECTED PROPOSED APPROVED ADOPTED % CHANGE2013-14 2014-15 2015-16 2015-16 2016-17 2016-17 2016-17 FROM PROJ
12 Beginning Balance: 17,187,311$ 11,605,639$ 11,318,400$ 11,803,700$ 12,020,200$ 12,020,200$ 12,020,200$ 2%3 Revenues:4 Taxes & Assessments 10,397,781 6,894,782 6,643,800 6,714,300 6,304,100 6,304,100 6,304,100 -6%5 Licenses & Fees 3,034,840 3,473,489 3,612,700 3,788,000 3,095,300 3,095,300 3,095,300 -18%6 Intergovernmental 3,263,887 3,358,800 3,670,300 3,434,800 3,952,000 3,952,000 3,952,000 15%7 Fines & Forfeits 448,092 388,858 419,000 393,000 393,000 393,000 393,000 0%8 Charges for Services 8,620,911 9,083,330 9,580,200 9,552,300 9,934,400 9,934,400 9,934,400 4%9 Miscellaneous 1,655,291 1,364,339 1,260,000 1,226,600 1,069,300 1,069,300 1,069,300 -13%
10 Total Revenues: 27,420,802 24,563,599 25,186,000 25,109,000 24,748,100 24,748,100 24,748,100 -1%11 Other Resources:12 Debt Proceeds 3,817,323 71,477 310,000 135,000 479,600 479,600 479,600 255%13 Transfers In 540,717 698,336 699,900 695,500 823,800 823,800 823,800 18%14 Total Other Resources 4,358,040 769,813 1,009,900 830,500 1,303,400 1,303,400 1,303,400 57%15 TOTAL RESOURCES 48,966,153 36,939,051 37,514,300 37,743,200 38,071,700 38,071,700 38,071,700 1%16 REQUIREMENTS:17 Expenditures:18 Personnel Services 9,079,885 9,694,372 10,641,100 10,453,600 10,831,900 10,831,900 10,831,900 4%19 Materials & Services 8,820,950 8,777,064 10,305,600 9,804,100 10,057,200 10,062,360 10,062,360 3%20 Capital Outlay 5,644,874 2,691,662 6,093,700 2,175,300 6,420,400 6,420,400 6,420,400 195%21 Debt Service 13,274,088 3,273,957 2,597,800 2,594,400 1,834,800 1,834,800 1,834,800 -29%22 Total Expenditures: 36,819,797 24,437,054 29,638,200 25,027,400 29,144,300 29,149,460 29,149,460 16%23 Other Requirements:24 Transfers Out 540,717 698,336 699,900 695,500 823,800 823,800 823,800 18%25 Contingency - - 539,100 - 629,300 629,300 629,300 26 Total Other Requirements 540,717 698,336 1,239,000 695,500 1,453,100 1,453,100 1,453,100 109%27 Fund Balance:28 Restricted 8,576,258 8,709,712 4,850,800 9,399,700 5,581,600 5,581,600 5,581,600 -41%29 Committed 355,281 399,731 204,800 356,700 213,500 213,500 213,500 -40%30 Assigned 435,148 441,794 247,200 412,400 248,600 248,600 248,600 -40%31 Unassigned 2,238,952 2,252,424 1,334,300 1,851,500 1,430,600 1,425,440 1,425,440 -23%32 Total Fund Balance 11,605,639 11,803,660 6,637,100 12,020,300 7,474,300 7,469,140 7,469,140 -38%33 TOTAL REQUIREMENTS 48,966,153$ 36,939,051$ 37,514,300$ 37,743,200$ 38,071,700$ 38,071,700$ 38,071,700$ 1%
Notes:*
RESOURCES:
As shown on the schedule on the following page, eliminations are for internal service fund transactions which have been eliminated in the consolidated schedules so that the transactions would not be duplicated.
Beginning Balances32%
Taxes & Assessments
17%Licenses & Fees 8%
Intergovernmental10%
Fines & Forfeits 1%
Charges for Services 27%
Miscellaneous 3% Debt Proceeds
1%
General Fund22%
Special Revenue Funds16%
Debt Service Funds4%
Internal Services Fund9%
Enterprise Funds27%
Fund Balance & Contingency
22%
51

12 Beginning Balance: 1,851,500$ 1,224,900$ 3,948,800$ 644,000$ 130,600$ 2,685,800$ -$ 12,020,200$3 Revenues:4 Taxes & Assessments 5,036,900 - - 491,200 - 776,000 - 6,304,100 5 Licenses & Fees 2,773,500 12,100 145,800 - - - - 3,000,900 6 Intergovernmental 1,171,800 2,161,000 619,200 - - - - 3,952,000 7 Fines & Forfeits 393,000 - - - - - - 393,000 8 Charges for Services 8,000 - - 180,000 3,567,000 - (3,567,000) 10,028,800 9 Miscellaneous 166,100 1,500 50,600 7,200 - 832,000 - 1,069,300
10 Total Revenues: 9,549,300 2,174,600 815,600 678,400 3,567,000 1,608,000 (3,567,000) 24,748,100 11 Other Resources:12 Debt Proceeds - 175,000 - - - - - 479,600 13 Transfers In - - - - - - - 823,800 14 Total Other Resources - 175,000 - - - - - 1,303,400 15 TOTAL RESOURCES 11,400,800 3,574,500 4,764,400 1,322,400 3,697,600 4,293,800 (3,567,000) 38,071,700 16 REQUIREMENTS:17 Expenditures:18 Personnel Services 6,443,100 133,100 - 92,800 2,510,100 - - 10,831,900 19 Materials & Services 3,245,860 777,500 164,400 580,000 896,800 - (3,567,000) 10,062,360 20 Capital Outlay 219,000 1,728,900 3,145,200 281,300 78,600 - - 6,420,400 21 Debt Service - - - - - 1,606,000 - 1,834,800 22 Total Expenditures: 9,907,960 2,639,500 3,309,600 954,100 3,485,500 1,606,000 (3,567,000) 29,149,460 23 Other Requirements:24 Transfers Out 17,400 406,400 - - - - - 823,800 25 Contingency 50,000 45,500 50,000 36,000 212,000 - - 629,300 26 Total Other Requirements 67,400 451,900 50,000 36,000 212,000 - - 1,453,100 27 Fund Balance:28 Restricted - 483,100 1,404,800 329,900 100 2,687,800 - 5,581,700 29 Committed - - - - - - - 213,400 30 Assigned - - - 2,400 - - - 248,600 31 Unassigned 1,425,440 - - - - - - 1,425,440 32 Total Fund Balance 1,425,440 483,100 1,404,800 332,300 100 2,687,800 - 7,469,140 33 TOTAL REQUIREMENTS 11,400,800$ 3,574,500$ 4,764,400$ 1,322,400$ 3,697,600$ 4,293,800$ (3,567,000)$ 38,071,700$
Governmental Funds Proprietary FundsGeneral Fund Enterprise FundsSpecial Revenue Funds Major Funds
Major Funds Water FundStreet Fund Water Facility Fund
Nonmajor Governmental Funds Sewer FundPublic Education Government Access Fund Stormwater FundLaw Enforcement Fund Nonmajor FundsHousing Rehabilitation Fund Community Center FundEnergy Assistance Fund Street Lighting District FundPark Improvement Fund Sewer Reserve FundTrans Improvement Fund Internal Service FundOff-Site Transportation Fund Administrative Services Fund
Debt Service FundsKeizer Station Local Improvement District Fund
RESOURCES:
GeneralSpecial
RevenueNonmajor
GovernmentalNonmajor Enterprise
Internal Service
Debt Service
Resource&RequirementSummarybyFundType
Eliminations Total
Budgets for governments are broken into funds, based on the sources of revenue dedicated to each service. For example, the state fuel taxes can only be used for street improvements and maintenance, so a separate "Street Fund" is used to account for those dollars, to keep them separate from other city operations.
69,500 - -
9,840,800
Major Enterprise
1,534,600$
-
11,900 9,922,200
1,128,400 12,585,200
304,600 823,800
1,652,800 7,964,800
967,400 228,800
10,813,800
400,000 235,800
635,800
12,585,200$
676,000 213,400 246,200
- 1,135,600
52

FundDescriptions
The City’s budget is made up of Governmental Funds, Proprietary Funds (business-like activities) and a Debt Service Fund. Governmental Funds are normally supported by taxes and intergovernmental revenues while Proprietary Funds rely to a significant extent on fees and charges for services. Debt Service Funds account for the accumulation of resources for, and the payment of long-term debt principal and interest. The following is a brief description and purpose of each of the City’s budgeted funds. GOVERNMENTAL FUNDS General Fund The General Fund is the chief operating fund of the City and accounts for all financial resources except those required to be accounted for in another fund. Principal sources of revenue are property taxes, franchise fees, and intergovernmental revenues such as Cigarette and Liquor Tax. General Fund’s primary expenditures are for Public Safety, Park Operations, Community Development and General Government Special Revenue Funds Street Fund The Street Fund provides quality streets, lighting, traffic signals, sidewalks, and bike paths. The primary source of revenue is State Fuel Taxes, which are apportioned by the State based on population. Fuel tax revenues are restricted by constitutional limits and are to be used for street maintenance and improvements. Public Education Government The Public Education Government Fund (PEG) is set up to account for PEG franchise fees assessed on cable television bills. The fees are to be used exclusively for providing governmental cable programming. Legislative action taken in fiscal year 2007-08 continues to threaten PEG revenues. Should revenues cease by the end of the fiscal year, the ending fund balance will be sufficient to pay monthly broadcasting expenses the following year. Law Enforcement Grant Revenues in the Law Enforcement Grant Fund are from state and federal grants with an occasional private sector grant. The appropriate uses of the funds are specifically described by each grant. Housing Rehabilitation The original source of revenues in the Housing Services Fund was from a State Community Development Block Grant. Uses were restricted to creating loans for housing rehabilitation projects. The original grant was completely expended in fiscal year 1998. Over the next several years loans were repaid and sufficient cash became available to reestablish the program benefiting low/moderate income households within the Keizer community. This program was combined with the Energy Efficiency Revolving Loan Fund to more effectively serve qualified participants.
53

FundDescriptions
Energy Efficiency Revenues for the Energy Efficiency Fund were from the Recovery Act – Energy Efficiency and Conservation Block Grant. Uses for these funds are restricted for energy efficiency improvements within the community. The City elected to develop a revolving loan fund to complement its Housing Rehabilitation loan program. The Energy Efficiency loans will be restricted to permanent enhancements that improve energy efficiency within the residential home of low/moderate income households. Park Improvement The Park Improvement Fund was established to account for Systems Development Charges (SDC’s) designated for park improvements. These fees are collected from new residential development in the City. Improvements are included in the City Council adopted Parks Master Plan and expenditures follow the adopted SDC Methodology. Transportation Improvement The Transportation Improvement Fund was established to account for Systems Development Charges (SDC’s) designated for transportation improvements. These fees are collected from new development in the City. Improvements are included in the City Council adopted Transportation Master Plan and expenditures follow the adopted SDC Methodology. Off-Site Transportation The Off-Site Transportation Fund was created for future transportation improvement projects in connection with Keizer Station Areas B and C. The resources are from developer fees required to be paid as set forth in the Keizer Station Master Plan orders. PROPRIETARY FUNDS Enterprise Funds Water Revenues in the Water fund are derived from user charges. The City’s charter designates this as a dedicated fund to be used solely for water related services. The water system is managed by the Public Works Department to provide safe, low cost, high quality drinking water that meets or exceeds state and federal regulations. Water Facility The Water Facility Replacement Reserve was established for replacement and construction of new facilities needed to provide water production, storage, and distribution. Revenue consists of System Development Charges, water usage charges transferred from the Water Operating Fund, and revenue bonds. Expenditures are intended to enhance the ability to provide the water needed to serve the community within the existing Urban Growth Boundary consistent with the City Council adopted Water System Master Plan Update. Sewer The City of Keizer is a part of a regional sewer system managed by the City of Salem. Salem sets the sewer rates for the regional system. Keizer appoints Council and Staff liaisons to attend the Regional Task Force meetings. City of Keizer staff manages the billing function and remit Sewer Charges to City of Salem each month.
54

FundDescriptions
Stormwater The Stormwater Fund was established to meet the Federal Clean Water Act and Safe Drinking Water Act. Revenues in the Stormwater Fund are derived from user charges. The City’s stormwater regulatory programs are administered by the State of Oregon through the Department of Environmental Quality (DEQ). The City has three regulatory programs which allow the City to manage stormwater through discharge to local waterways, overland flow, and injection into the ground. The City maintains compliance of the regulatory programs by implementing the requirements of state approved management plans for the municipal separate storm sewer system (MS4), the underground injection control (UIC) devices, and the Total Maximum Daily Load (TMDL) Implementation Plan. The City is the permittee for the National Pollutant Discharge Elimination System (NPDES) permit, the Water Pollution Control Facilities (WPCF) permit, and is a designated management agency for the Willamette Basin TMDL. Community Center The City of Keizer Community Center is a state of the art facility intended to accommodate the cultural, educational, professional, recreational, and economic needs of its citizens and the community. Rental fees help cover the operation and management of the center. The Center is not currently self-sustaining and relies on General Fund support, including an Interfund transfer and full use of Transient Occupancy Tax revenues, to help pay operating costs. Street Lighting Districts The Street Lighting District Fund accounts for the Street Lighting Districts and Local Improvement Districts from establishment and construction, through billing and recording the liens with the county tax collector. Sewer Reserve The Sanitary Sewer Reserve Fund was established to cover areas not served by existing sewer lines. The Sewer Reserve is a systems development based fund used to reimburse developers for sewer trunk line improvement extensions and City constructed growth driven sewer capacity improvements outlined in the Sanitary Sewer Master Plan. Internal Services Funds Administrative Services The Administrative Services Fund accounts for the financing of goods and/or services provided to various City funds on a cost-reimbursement basis. Administrative Services are provided by General Administration (City Council and Non-departmental), City Manager’s Office, City Attorney’s Office, City Records Department, Human Resources Department, Finance, Public Works Administration and Civic Center Facilities. The Fund is replenished from the City’s operating funds as Charges for Services using various cost allocation plans based on anticipated benefits received. DEBT SERVICE FUND Keizer Station Local Improvement District The Keizer Station Local Improvement Fund accounts for the improvements to the Keizer Station Development Project. The cost of the improvements has been assessed to those property owners who directly benefit from the project. The assessments received are used to pay off the long-term debt scheduled for maturity on June 1, 2031.
55

ACTUAL ACTUAL BUDGETED PROJECTED PROPOSED APPROVED ADOPTEDFUND 2013-14 2014-15 2015-16 2015-16 2016-17 2016-17 2016-17
10,714,090$ 11,087,525$ 11,690,100$ 11,616,600$ 11,400,800$ 11,400,800$ 11,400,800$
Street 3,570,901 3,359,577 3,240,200 3,472,300 3,574,500 3,574,500 3,574,500 Urban Renewal Project 3,842,518 71,477 - - - - - Urban Renewal Program 617,550 51,837 - - - - - Public Government Education 328,766 370,798 358,800 366,500 386,700 386,700 386,700 Law Enforcement Grant 3,000 8,325 30,000 - 30,000 30,000 30,000 Housing Rehabilitation 44,001 14,455 58,700 13,800 43,800 43,800 43,800 Energy Efficiency 20,439 3,808 17,300 2,400 17,400 17,400 17,400 Park Improvement 444,798 748,020 901,900 945,800 1,453,300 1,453,300 1,453,300 Transportation Improvement 2,175,283 2,416,363 2,591,300 2,639,600 2,709,800 2,709,800 2,709,800 Off-Site Transportation 52,903 53,017 98,500 123,400 123,400 123,400 123,400
Water 3,167,621 3,393,896 3,506,000 3,539,000 3,658,900 3,658,900 3,658,900 Water Facility 854,911 962,959 990,200 844,000 799,400 799,400 799,400 Sewer 5,429,784 5,583,794 5,809,200 5,805,200 5,974,200 5,974,200 5,974,200 Stormwater 1,674,139 1,778,663 1,869,500 1,909,800 2,152,700 2,152,700 2,152,700 Community Center 119,441 169,719 189,500 225,000 266,300 266,300 266,300 Street Lighting District 748,259 826,907 714,100 795,300 787,800 787,800 787,800 Sewer Reserve 98,832 154,877 271,100 235,100 268,300 268,300 268,300
Administrative Services 2,309,850 3,297,809 3,630,500 3,504,800 3,697,600 3,697,600 3,697,600
Keizer Station LID 8,126,496 4,369,183 5,047,300 5,048,700 4,293,800 4,293,800 4,293,800 Urban Renewal Tax Increment 6,817,131 1,356,662 - - - - - Total 51,160,713$ 40,079,671$ 41,014,200$ 41,087,300$ 41,638,700$ 41,638,700$ 41,638,700$
This schedule does not eliminate charges for services from the administrative services fund to the City's operating funds and therefore the Total double counts those expenditures.The purpose of the schedule is to show each fund's total requirements in relation to the total budget as a whole.
General
Special Revenue Funds:
Enterprise Funds
Internal Services Fund
Debt Service Funds
Budgets for governments are broken into funds, based on the sources of revenue dedicated to each service. For example, the state fuel taxes can only be used for street improvements and maintenance, so a separate "Street Fund" is used to account for those dollars, to keep them separate from other city operations. All funds presented below are appropriated.
AllFundsSummarybyFund
Notes:
56

ACTUAL BUDGETED BUDGET ACTUAL BUDGETED BUDGET ACTUAL BUDGETED BUDGET ACTUAL BUDGETED BUDGET ACTUAL BUDGETED BUDGET2014-15 2015-16 2016-17 2014-15 2015-16 2016-17 2014-15 2015-16 2016-17 2014-15 2015-16 2016-17 2014-15 2015-16 2016-17
Beginning Balance: 2,238,952$ 2,144,900$ 1,851,500$ 1,191,140$ 1,126,600$ 1,224,900$ -$ -$ -$ 51,837$ -$ -$ 2,861,526$ 3,146,100$ 3,948,800$Revenues:
Taxes & Assessments 4,534,152 4,835,900 5,036,900 3,696 - - - - - - - - - - - Licenses & Fees 2,668,491 2,720,200 2,773,500 26,236 12,100 12,100 - - - - - - 497,879 628,500 145,800 Intergovernmental 1,062,148 1,339,100 1,171,800 2,131,377 2,100,000 2,161,000 - - - - - - 165,276 231,200 619,200 Fines & Forfeits 388,858 419,000 393,000 - - - - - - - - - - - - Charges for Services 5,549 17,500 8,000 - - - - - - - - - - - - Miscellaneous 184,375 213,500 166,100 7,129 1,500 1,500 - - - - - - 90,105 50,700 50,600
Total Revenues: 8,843,573 9,545,200 9,549,300 2,168,437 2,113,600 2,174,600 - - - - - - 753,260 910,400 815,600 Other Resources:
Debt Proceeds - - - - - 175,000 71,477 - - - - - - - - Transfers In 5,000 - - - - - - - - - - - - - -
Total Other Resources 5,000 - - - - 175,000 71,477 - - - - - - - - TOTAL RESOURCES 11,087,525 11,690,100 11,400,800 3,359,577 3,240,200 3,574,500 71,477 - - 51,837 - - 3,614,786 4,056,500 4,764,400 REQUIREMENTS:
Expenditures: - - - - - - - - - - - - - - - Personnel Services 5,866,150 6,431,000 6,443,100 104,917 128,000 133,100 - - - - - - - - - Materials & Services 2,581,365 3,781,100 3,245,860 600,077 772,600 777,500 70,976 - - 51,837 - - 107,888 174,300 164,400 Capital Outlay 335,550 66,900 219,000 1,052,484 1,310,200 1,728,900 501 - - - - - 307,045 3,250,400 3,145,200 Debt Service - - - - - - - - - - - - - - -
Total Expenditures: 8,783,065 10,279,000 9,907,960 1,757,478 2,210,800 2,639,500 71,477 - - 51,837 - - 414,933 3,424,700 3,309,600 Other Requirements:
Transfers Out 52,036 21,800 17,400 341,300 372,500 406,400 - - - - - - 5,000 - - Contingency - 50,000 50,000 - 45,300 45,500 - - - - - - - 50,000 50,000
Total Other Requirements 52,036 71,800 67,400 341,300 417,800 451,900 - - - - - - 5,000 50,000 50,000 Fund Balance:
Restricted - - - 1,260,800 611,600 483,100 - - - - - - 3,194,853 581,800 1,404,800 Committed - 5,000 - - - - - - - - - - - - - Assigned - - - - - - - - - - - - - - - Unassigned 2,252,424 1,334,300 1,425,440 - - - - - - - - - - - -
Total Fund Balance 2,252,424 1,339,300 1,425,440 1,260,800 611,600 483,100 - - - - - - 3,194,853 581,800 1,404,800 TOTAL REQUIREMENTS 11,087,525$ 11,690,100$ 11,400,800$ 3,359,577$ 3,240,200$ 3,574,500$ 71,477$ -$ -$ 51,837$ -$ -$ 3,614,786$ 4,056,500$ 4,764,400$
Continued
RESOURCES:
NonMajorSpecialRevenueFunds
StreetFundUrbanRenewalProjectFund
GeneralFundUrbanRenewal
ProgramIncomeFund
MajorSpecialRevenueFunds
ConsolidatedFundSummary
57

ACTUAL BUDGETED BUDGET ACTUAL BUDGETED BUDGET ACTUAL BUDGETED BUDGET ACTUAL BUDGETED BUDGET2014-15 2015-16 2016-17 2014-15 2015-16 2016-17 2014-15 2015-16 2016-17 2014-15 2015-16 2016-17
Beginning Balance: 671,481$ 598,200$ 698,500$ 556,092$ 311,000$ 239,000$ 224,671$ 246,000$ 226,000$ 435,147$ 422,500$ 371,100$ Revenues: - - - - - - - - - - - -
Taxes & Assessments - - - - - - - - - - - - Licenses & Fees 92,814 69,500 69,500 105,561 - - - - - - - - Intergovernmental - - - - - - - - - - - - Fines & Forfeits - - - - - - - - - - - - Charges for Services 2,603,493 2,812,400 2,865,000 - 73,700 59,400 5,358,906 5,562,800 5,747,800 999,539 1,072,500 1,168,600 Miscellaneous 17,947 8,500 8,500 1,306 45,500 1,000 217 400 400 2,676 2,000 2,000
Total Revenues: 2,714,254 2,890,400 2,943,000 106,867 119,200 60,400 5,359,123 5,563,200 5,748,200 1,002,215 1,074,500 1,170,600 Other Resources:
Debt Proceeds - - - - 310,000 100,000 - - - - - 204,600 Transfers In 8,161 17,400 17,400 300,000 250,000 400,000 - - - 341,300 372,500 406,400
Total Other Resources 8,161 17,400 17,400 300,000 560,000 500,000 - - - 341,300 372,500 611,000 TOTAL RESOURCES 3,393,896 3,506,000 3,658,900 962,959 990,200 799,400 5,583,794 5,809,200 5,974,200 1,778,663 1,869,500 2,152,700 REQUIREMENTS:
Expenditures: - - - - - - - - - - - - Personnel Services 829,429 908,700 959,800 - - - 2,916 3,500 3,700 579,174 647,100 689,300 Materials & Services 1,283,559 1,437,100 1,441,000 - - - 5,341,846 5,529,200 5,737,100 570,600 668,900 786,700 Capital Outlay 64,845 99,500 83,200 646,445 706,500 544,500 - - - 187,095 259,700 339,700 Debt Service 233,915 231,500 228,800 - - - - - - - - -
Total Expenditures: 2,411,748 2,676,800 2,712,800 646,445 706,500 544,500 5,344,762 5,532,700 5,740,800 1,336,869 1,575,700 1,815,700 Other Requirements:
Transfers Out 300,000 250,000 400,000 - - - - 55,600 - - - - Contingency - 125,000 125,000 - - - - 16,200 20,000 - 46,600 90,800
Total Other Requirements 300,000 375,000 525,000 - - - - 71,800 20,000 - 46,600 90,800 Fund Balance:
Restricted 682,148 454,200 421,100 316,514 283,700 254,900 - - - - - - Committed - - - - - - 239,032 204,700 213,400 - - - Assigned - - - - - - - - - 441,794 247,200 246,200 Unassigned - - - - - - - - - - - -
Total Fund Balance 682,148 454,200 421,100 316,514 283,700 254,900 239,032 204,700 213,400 441,794 247,200 246,200 TOTAL REQUIREMENTS 3,393,896$ 3,506,000$ 3,658,900$ 962,959$ 990,200$ 799,400$ 5,583,794$ 5,809,200$ 5,974,200$ 1,778,663$ 1,869,500$ 2,152,700$
Continued
ConsolidatedFundSummary
StormwaterFund
MajorEnterpriseFunds
RESOURCES:
WaterFund WaterFacilityFund SewerFund
58

ACTUAL BUDGETED BUDGET ACTUAL BUDGETED BUDGET ACTUAL BUDGETED BUDGET ACTUAL BUDGETED BUDGET2014-15 2015-16 2016-17 2014-15 2015-16 2016-17 2014-15 2015-16 2016-17 2014-15 2015-16 2016-17
Beginning Balance: 377,973$ 508,800$ 644,000$ 130,610$ 130,600$ 130,600$ 2,685,746$ 2,683,700$ 2,685,800$ 180,463$ -$ -$ Revenues:
Taxes & Assessments 450,398 365,000 491,200 - - - 730,738 1,442,900 776,000 1,175,799 - - Licenses & Fees 82,508 - - - - - - - - - - - Intergovernmental - - - - - - - - - - - - Fines & Forfeits - - - - - - - - - - - - Charges for Services 115,844 223,700 180,000 3,140,620 3,499,900 3,567,000 - - - - - - Miscellaneous 80,905 17,200 7,200 26,579 - - 952,699 920,700 832,000 400 - -
Total Revenues: 729,655 605,900 678,400 3,167,199 3,499,900 3,567,000 1,683,437 2,363,600 1,608,000 1,176,199 - - Other Resources:
Debt Proceeds - - - - - - - - - - - - Transfers In 43,875 60,000 - - - - - - - - - -
Total Other Resources 43,875 60,000 - - - - - - - - - - TOTAL RESOURCES 1,151,503 1,174,700 1,322,400 3,297,809 3,630,500 3,697,600 4,369,183 5,047,300 4,293,800 1,356,662 - - REQUIREMENTS:
Expenditures:Personnel Services 59,212 67,200 92,800 2,252,574 2,455,600 2,510,100 - - - - - - Materials & Services 522,090 576,000 580,000 787,447 866,300 896,800 - - - - - - Capital Outlay 607 273,500 281,300 97,089 127,000 78,600 - - - - - - Debt Service - - - - - - 1,683,380 2,366,300 1,606,000 1,356,662 - -
Total Expenditures: 581,909 916,700 954,100 3,137,110 3,448,900 3,485,500 1,683,380 2,366,300 1,606,000 1,356,662 - - Other Requirements:
Transfers Out - - - - - - - - - - - - Contingency - 24,500 36,000 - 181,500 212,000 - - - - - -
Total Other Requirements - 24,500 36,000 - 181,500 212,000 - - - - - - Fund Balance:
Restricted 569,595 233,500 329,900 - - - 2,685,803 2,681,000 2,687,800 - - - Committed - - - 160,699 100 100 - - - - - - Assigned - - 2,400 - - - - - - - - - Unassigned - - - - - - - - - - - -
Total Fund Balance 569,595 233,500 332,300 160,699 100 100 2,685,803 2,681,000 2,687,800 - - - TOTAL REQUIREMENTS 1,151,503$ 1,174,700$ 1,322,400$ 3,297,809$ 3,630,500$ 3,697,600$ 4,369,183$ 5,047,300$ 4,293,800$ 1,356,662$ -$ -$
Continued
RESOURCES:
NonMajorEnterpriseFunds
InternalServiceFund DebtServiceFunds
AdministrativeServicesKeizerStationLocalImprovementDistricts
UrbanRenewalTaxIncrement
ConsolidatedFundSummary
59

ACTUAL BUDGETED BUDGET ACTUAL BUDGETED BUDGET ACTUAL BUDGETED BUDGET ACTUAL BUDGETED BUDGET ACTUAL BUDGETED BUDGET2014-15 2015-16 2016-17 2014-15 2015-16 2016-17 2014-15 2015-16 2016-17 2014-15 2015-16 2016-17 2014-15 2015-16 2016-17
Beginning Balance: 6,343,455$ 6,417,600$ 7,025,200$ 2,395,974$ 2,217,100$ 2,309,200$ 2,866,209$ 2,683,700$ 2,685,800$ -$ -$ -$ 11,605,639$ 11,318,400$ 12,020,200$ Revenues:
Taxes & Assessments 4,537,848 4,835,900 5,036,900 450,398 365,000 491,200 1,906,537 1,442,900 776,000 6,894,783 6,643,800 6,304,100 Licenses & Fees 3,192,606 3,360,800 2,931,400 280,883 69,500 69,500 - - - 3,473,489 3,430,300 3,000,900 Intergovernmental 3,358,800 3,670,300 3,952,000 - - - - - - 3,358,800 3,670,300 3,952,000 Fines & Forfeits 388,858 419,000 393,000 - - - - - - 388,858 419,000 393,000 Charges for Services 5,549 17,500 8,000 12,218,401 13,245,000 13,587,800 - - - (3,140,620) (3,499,900) (3,567,000) 9,083,330 9,762,600 10,028,800 Miscellaneous 281,609 265,700 218,200 129,630 73,600 19,100 953,099 920,700 832,000 1,364,339 1,260,000 1,069,300
Total Revenues: 11,765,270 12,569,200 12,539,500 13,079,313 13,753,100 14,167,600 2,859,636 2,363,600 1,608,000 (3,140,620) (3,499,900) (3,567,000) 24,563,600 25,186,000 24,748,100 Other Resources:
Debt Proceeds 71,477 - 175,000 - 310,000 304,600 - - - 71,477 310,000 479,600 Transfers In 5,000 - - 693,336 699,900 823,800 - - - 698,336 699,900 823,800
Total Other Resources 76,477 - 175,000 693,336 1,009,900 1,128,400 - - - 769,813 1,009,900 1,303,400 TOTAL RESOURCES 18,185,203 18,986,800 19,739,700 16,168,623 16,980,100 17,605,200 5,725,845 5,047,300 4,293,800 (3,140,620) (3,499,900) (3,567,000) 36,939,052 37,514,300 38,071,700 REQUIREMENTS:
Expenditures:Personnel Services 5,971,067 6,559,000 6,576,200 3,723,305 4,082,100 4,255,700 - - - 9,694,372 10,641,100 10,831,900 Materials & Services 3,412,143 4,728,000 4,187,760 8,505,541 9,077,500 9,441,600 - - - (3,140,620) (3,499,900) (3,567,000) 8,777,065 10,305,600 10,062,360 Capital Outlay 1,695,580 4,627,500 5,093,100 996,082 1,466,200 1,327,300 - - - 2,691,662 6,093,700 6,420,400 Debt Service - - - 233,915 231,500 228,800 3,040,042 2,366,300 1,606,000 3,273,957 2,597,800 1,834,800
Total Expenditures: 11,078,790 15,914,500 15,857,060 13,458,843 14,857,300 15,253,400 3,040,042 2,366,300 1,606,000 (3,140,620) (3,499,900) (3,567,000) 24,437,055 29,638,200 29,149,460 Other Requirements:
Transfers Out 398,336 394,300 423,800 300,000 305,600 400,000 - - - 698,336 699,900 823,800 Contingency - 145,300 145,500 - 393,800 483,800 - - - - 539,100 629,300
Total Other Requirements 398,336 539,600 569,300 300,000 699,400 883,800 - - - - - - 698,336 1,239,000 1,453,100 Fund Balance:
Restricted 4,455,653 1,193,400 1,887,900 1,568,257 971,400 1,005,900 2,685,803 2,681,000 2,687,800 8,709,712 4,845,800 5,581,600 Committed - 5,000 - 399,731 204,800 213,500 - - - 399,731 209,800 213,500 Assigned - - - 441,794 247,200 248,600 - - - 441,794 247,200 248,600 Unassigned 2,252,424 1,334,300 1,425,440 - - - - - - 2,252,424 1,334,300 1,425,440
Total Fund Balance 6,708,076 2,532,700 3,313,340 2,409,781 1,423,400 1,468,000 2,685,803 2,681,000 2,687,800 11,803,660 6,637,100 7,469,140 TOTAL REQUIREMENTS 18,185,203$ 18,986,800$ 19,739,700$ 16,168,623$ 16,980,100$ 17,605,200$ 5,725,845$ 5,047,300$ 4,293,800$ (3,140,620)$ (3,499,900)$ (3,567,000)$ 36,939,052$ 37,514,300$ 38,071,700$
ConsolidatedFundSummary
RESOURCES:
ProprietaryFunds DebtServiceFunds TotalAllFundsEliminationsGovernmentalFunds
60

1 General Fund $ 152,200 2 15,100 3 Street Fund 96,700 4 800,000 5 157,200 6 Park Improvement Fund 10,000 7 Public Education Government 25,000 8 Law Enforcement Grants 30,000 9 Water Fund 52,700
10 30,500 11 Stormwater Fund 14,700 12 325,000 13 Community Center Fund Furnishings 28,000 14 Administrative Services 28,600 15 50,000 16 Water Facility Fund 400,000 17 49,500 18 Total Routine Capital Outlay 2,265,200 19 20 General Fund 51,700 21 Street Fund 675,000 22 Park Improvement Fund 506,800 23 Transportation Improvement Fund 450,000
2,000,000 24 Off-Site Transportation Fund 123,400
25 Water Facility Fund 95,000 26 Sewer Reserve Fund 253,300 27 Total Non-Routine Capital Outlay 4,155,200 28 Total Capital Outlay Expenditures $ 6,420,400
20 The property owners will be responsible for maintaining the improvements to Area B.21
22
23
24 The property owners will be responsible for maintaining the improvements to Area B and Area C.25
26
Storm sewer pipe extension or repair
Television equipment
The Oregon Department of Transportation will be responsible for maintaining the I-5 Chemawa Southbound on-ramp once it is completed.
Annual maintenance for the filter plant at Lacey Court is expected to be between $5,000 and $7,500 and will be paid from the Water Operating Fund supported by user charges.Once the trunk line improvements are completed, City of Salem will be responsible for the operating costs as this is a part of a regional sewer system managed by the City of Salem. These improvements have not been identified so operating costs are not known. However, once identified these costs will be reflected in the City of Keizer's sewer rates in the Sewer Operating Fund.
Impact of Non-Routine Capital Outlay on Operating Costs
Street Improvements include design, permit fees, and intial construction to replace the bridge over Claggett Creek on Dearborn Ave NE.'Big Toy' play structure surfacing will replace the bark chips and will actually reduce annual maintenance costs since the chips will not need replacing each year.
Keizer Station Area B and Area C development costs for project commitments to property owners
Engineering design for the improvements to the I-5/Chemawa Southbound on-ramp
Water facility improvements to be identified during FY16-17
Construction of I-5/Chemawa southbound on-ramp
Area B Development CostsStreet Improvements for bridge over Claggett Creek on Dearborn Ave NE
Maintenance costs for the routine Capital Outlay expenditures listed above are included in the on-going maintenance budgets for the funds identified. There are no additional impacts on the operating budget for these items.
Routine Capital Outlay
Equipment, vehicles and minor improvements
Police equipment
Water Meters
Street improvements to be identified during FY16-17Street resurfacing
Sewer trunk line improvement to be identified during FY16-17
Computer equipmentOffice furniture & equipment
Vehicles and equipment
Equipment, vehicles and minor improvements
Non-Routine Capital Outlay
Park equipment and minor park improvements
Supply & treatment costs for the installation of a filter plant at Lacey Court
Transmission & distribution mains
'Big Toy' play structure surfacing at Keizer Rapids Park
Police equipment
CapitalExpendituresCapital assets include land, right-of-way, buildings, improvements, equipment, infrastructure, and other tangible and intangible assets costing $5,000 or more and used in operations that have initial useful lives extending beyond two years. Routine capital outlay items listed below may include items less than $5,000 for budget purposes. However, these items are generally not capitalized for financial reporting purposes.
Park improvements to be identified during FY16-17
61

FundBalance
General Fund19%
Special Revenue
Funds25%
Enterprise Funds20%
Debt Service Funds36%
Fund Balance refers to the difference between assets and liabilities. The Governmental Accounting Standards Board (GASB) has established a scheme for reporting fund balance into five different classifications as follows:
Non-Spendable – cannot be spent (legally restricted or in unspendable form) Restricted – Externally imposed (law, creditor, bond covenant) Committed – Constraints approved by City Council Assigned – Constrained by intent by City Council or by the City Manager or by a body to which
City Council delegates the authority Unassigned – available to spend, unrestricted
The City’s reserves consist of restricted funds for specific purposes and planned future expenditures, set aside for emergencies and unforeseen circumstances, and cash flow. Combined, the City’s total budgeted contingency and projected Ending
Fund Balance for fiscal year 2016-17 is $7,469,140. The reserves in all Funds meet policy minimums for contingencies and ending fund balances, The City expects cash balances in all funds to be adequate during the year to cover expenses with the exception of the Water Facility fund, in which a loan will be needed for capital improvements.
Beginning Fund Balances in non-operating funds are typically appropriated for the upcoming budget year. Oregon Budget Law does not allow for the appropriation of Fund Balance and Reserves during the fiscal year and since these funds are dedicated for specific purposes the City needs to allow for the use of the funds should circumstances permit. The exception is when bond covenants require the City to maintain reserves for debt service.
The change in Ending Fund Balance for each fund is provided on the following page.
Ending Fund Balance by Fund TypeFiscal Year 2016-17
62

Governmental Funds:1,851,500$ 9,549,300$ 9,975,360$ 1,425,440$ (426,060)$ -23%
Street 1,224,900 2,174,600 3,091,400 483,100 (741,800) -61%Public Education Government 253,800 132,900 178,200 208,500 (45,300) -18%Law Enforcement Grant - 30,000 30,000 - -Housing Rehabilitation 13,800 30,000 43,800 - (13,800) -100%Energy Efficiency 2,400 15,000 17,400 - (2,400) -100%Park Improvement 915,800 537,500 516,800 936,500 20,700 2%Transportation Improvement 2,639,600 70,200 2,450,000 259,800 (2,379,800) -90%Off-Site Transportation 123,400 - 123,400 - (123,400) -100%
5,173,700 2,990,200 6,451,000 1,887,900 (3,285,800) -64%7,025,200$ 12,539,500$ 16,426,360$ 3,313,340$ (3,711,860)$ -53%
Park Improvement Fund - The 2016-17 ending fund balance is $20,700 more than the beginning fund balance. Available fund balance is being used for the Keizer Rapids Park "Big Toy" which is a one-time capital expenditure.
Transportation Improvement Fund - The 2016-17 ending fund balance is $2,379,800 less than the beginning fund balance. Available fund balance is being used for engineering design for the I-5 southbound on-ramp and for unanticipated expenses should the State of Oregon authorize construction of the on-ramp during the fiscal year.Off-Site Transportation Fund - The 2016-17 ending fund balance is $123,400 less than the beginning fund balance. Available fund balance is being used for transportation improvement projects in Keizer Station Areas B and C.
% Change
Street Fund - The 2016-17 ending fund balance is $741,800 less than the beginning fund balance. Available fund balance is being used for one time infrastructure improvements.
Public Education Government Fund - The 2016-17 ending fund balance is $45,300 less than the beginning fund balance. Available fund balance is being used for contingency.Housing Rehabilitation Fund - The 2016-17 ending fund balance is $13,800 less the beginning fund balance. Available fund balance is being used for housing rehabilitation loans to qualifying low-income homeowners.
Energy Efficiency Fund - The 2016-17 ending fund balance is $2,400 less than the beginning fund balance. Available fund balance is being used for energy efficiency loans to qualifying low-income homeowners.
General Fund - The 2016-17 ending fund balance is $426,060 less than the beginning fund balance. Available fund balance is being used for repayment to taxing jurisdictions, contingency, to replenish the General Fund's share of reserves in the Administrative Services Fund and for operating expenses.
ChangeinFundBalanceBeginningFundBalancetoEndingFundBalance
Change in Fund
Balance
Total Special Revenue FundsTotal Governmental Funds
Fund July 1, 2016 June 30, 2017
Expenditures & Transfers
OutRevenues & Transfers In
General Special Revenue Funds:
63

% Change
ChangeinFundBalanceBeginningFundBalancetoEndingFundBalance
Change in Fund
BalanceFund July 1, 2016 June 30, 2017
Expenditures & Transfers
OutRevenues & Transfers In
Water 698,500 2,943,000 3,237,800 421,100 (277,400) -40%Water Facility 239,000 560,400 544,500 254,900 15,900 7%Sewer 226,000 5,748,200 5,760,800 213,400 (12,600) -6%Stormwater 371,100 1,781,600 1,906,500 246,200 (124,900) -34%Community Center 41,300 225,000 263,900 2,400 (38,900) -94%Street Lighting District 369,600 418,200 472,900 314,900 (54,700) -15%Sewer Reserve 233,100 35,200 253,300 15,000 (218,100) -94%
2,178,600 11,711,600 12,439,700 1,467,900 (710,700) -33%
Administrative Services 130,600 3,567,000 3,697,500 100 (130,500) -100%2,309,200 15,278,600 16,137,200 1,468,000 (841,200) -36%
Keizer Station LID 2,685,800 1,608,000 1,606,000 2,687,800 2,000 0%2,685,800 1,608,000 1,606,000 2,687,800 2,000 0%
12,020,200$ 29,426,100$ 34,169,560$ 7,469,140$ (4,551,060)$ -38%
Debt Service Funds
Sewer Reserve Fund - The 2016-17 ending fund balance is $218,100 less than the beginning fund balance. Available fund balance is being used for sewer line extensions.
Administrative Services Fund - The 2016-17 ending fund balance is $130,500 less than the beginning fund balance. Available fund balance is being used for contingency.
Keizer Station Local Improvement District Fund - The 2016-17 ending fund balance is $2,000 more than the beginning fund balance. This fund is used to collect assessment payments from property owners at Keizer Station Area A. Assessment proceeds are used to repay the debt issued to pay infrastructure costs which benefited these property owners.
Water Fund - The 2016-17 ending fund balance is $277,400 less than the beginning fund balance. Available fund balance is being used for contingency and for a transfer to the Water Facility Fund to pay for future infrastructure.
Water Facility Fund - The 2016-17 ending fund balance is $15,900 more than the beginning fund balance. This fund is used to build and replace the City's water infrastructure.
Sewer Fund - The 2016-17 ending fund balance is $12,600 less than the beginning fund balance. Available fund balance is being used for a one-time transfer to the Street Lighting District Fund to repay it for energy rebates.
Proprietary Funds:Enterprise Funds
Total Enterprise Funds
Total Proprietary Funds
Total Debt Service FundsTotal All Funds
Internal Services Fund
Stormwater Fund - The 2016-17 ending fund balance is $124,900 less than the beginning fund balance. Available fund balance is being used for contingency and for increased operating costs. Community Center Fund - The 2016-17 ending fund balance is $38,900 less than the beginning fund balance.
Street Lighting District Fund - The 2016-17 ending fund balance is $54,700 less than the beginning fund balance. Available fund balance is being used for increased electricity costs. The Street Lighting District Fund operates on a reimbursement basis. Electricity is paid in Year One and assessed on the tax rolls in Year Two. The reduced fund balance by the end of 2016-17 is expected to be adequate operating capital for the following year.
64

Budget FY12-13
Budget FY13-14
Budget FY14-15
Budget FY15-16
Budget FY16-17
CITY MANAGERCity Manager 1.0 1.0 1.0 1.0 1.0 9,679$ - 12,631$ Total City Manager 1.0 1.0 1.0 1.0 1.0
CITY ATTORNEYAttorney 1.0 1.0 1.0 1.0 1.0 8,779$ - 11,454$ Legal Assistant 1.0 1.0 1.0 1.0 1.0 3,652$ - 4,763$ Total City Attorney 2.0 2.0 2.0 2.0 2.0
CITY RECORDERCity Recorder 1.0 1.0 1.0 1.0 1.0 5,136$ - 6,701$
* Deputy City Recorder 1.0 1.0 1.0 1.0 1.0 3,836$ - 5,004$ Event Center Coordinator 0.0 1.0 1.0 1.0 1.0 $ 3,155 - 4,115$ Total City Recorder 2.0 3.0 3.0 3.0 3.0
HUMAN RESOURCESHuman Resources Director 1.0 1.0 1.0 1.0 1.0 7,963$ - 10,393$
* Human Resources Generalist 1.0 1.0 1.0 1.0 1.0 4,657$ - 6,077$ Total Human Resources 2.0 2.0 2.0 2.0 2.0
FINANCEFinance Director 1.0 1.0 1.0 1.0 1.0 7,963$ - 10,393$
* Assistant Controller 1.0 1.0 1.0 1.0 1.0 6,554$ - 8,549$ Network Administrator 1.0 1.0 1.0 1.0 1.0 5,136$ - 6,701$ Network Support 0.0 0.0 1.0 1.0 1.0 4,436$ - 5,786$
* Accounting Technician 1.0 1.0 1.0 1.0 1.0 3,314$ - 4,328$ * Utility Billing Technician 1.0 1.0 1.0 1.0 1.0 3,479$ - 4,540$ * Utility Billing Clerks 2.5 2.5 2.75 2.9 2.9 3,007$ - 3,924$
Court Clerk II 1.0 1.0 1.0 1.0 1.0 3,155$ - 4,115$ Court Clerk I 0.5 0.5 0.25 0.1 0.1 3,007$ - 3,924$
* Administrative Specialist 1.0 1.0 1.0 1.0 1.0 3,007$ - 3,924$ Total Finance 10.0 10.0 11.0 11.0 11.0
StaffingHistoryandPayRangesMonthly Salary Range
(1.0 FTE)
*Classified as Administrative Support in line-item budgets
65

Budget FY12-13
Budget FY13-14
Budget FY14-15
Budget FY15-16
Budget FY16-17
StaffingHistoryandPayRangesMonthly Salary Range
(1.0 FTE)COMMUNITY DEVELOPMENT
Community Development Director 1.0 1.0 1.0 1.0 1.0 7,963$ - 10,393$ Senior Planner 1.0 1.0 1.0 1.0 1.0 5,136$ - 6,701$ Planner 1.0 1.0 1.0 1.0 1.0 4,436$ - 5,786$ Code Compliance Officer 0.0 0.0 1.0 1.0 1.0 3,652$ - 4,763$
* Permit Specialist 1.0 1.0 1.0 1.0 1.0 3,479$ - 4,540$ Total Community Development 4.0 4.0 5.0 5.0 5.0
PUBLIC WORKSPublic Works Director 1.0 1.0 1.0 1.0 1.0 7,963$ - 10,393$ Facility Maintenance 1.0 1.0 1.0 1.0 1.0 3,479$ - 4,540$ Municipal Utility Worker I - Parks 1.0 1.0 1.0 1.0 1.0 3,233$ - 4,219$ Parks & Facilities Division Manager 1.0 1.0 1.0 1.0 1.0 4,657$ - 6,077$ Municipal Utility Worker I - General 8.0 8.0 8.0 8.0 8.0 3,233$ - 4,219$ Municipal Utility Worker II - General 3.0 3.0 3.0 3.0 3.0 3,746$ - 4,888$ Municipal Utility Worker II - Customer Service 1.0 1.0 1.0 1.0 1.0 3,566$ - 4,652$ Municipal Utility Worker II - Stormwater 0.0 1.0 1.0 1.0 1.0 3,746$ - 4,888$ Water Division Manager 1.0 1.0 1.0 1.0 1.0 5,136$ - 6,701$ Street & Stormwater Operations Division Manager 1.0 1.0 1.0 1.0 1.0 5,136$ - 6,701$ Project Manager 1.0 1.0 1.0 1.0 1.0 5,136$ - 6,701$
Environmental & Technical Division Manager 1.0 1.0 1.0 1.0 1.0 5,136$ - 6,701$ Environmental Program Technician 2.0 2.0 2.0 2.0 2.0 4,228$ - 5,515$ Senior Environmental Program Technician 1.0 1.0 1.0 1.0 1.0 4,657$ - 6,077$
* Permit Specialist 1.0 1.0 1.0 1.0 1.0 3,479$ - 4,540$ Total Public Works 24.0 25.0 25.0 25.0 25.0
*Classified as Administrative Support in line-item budgets
66
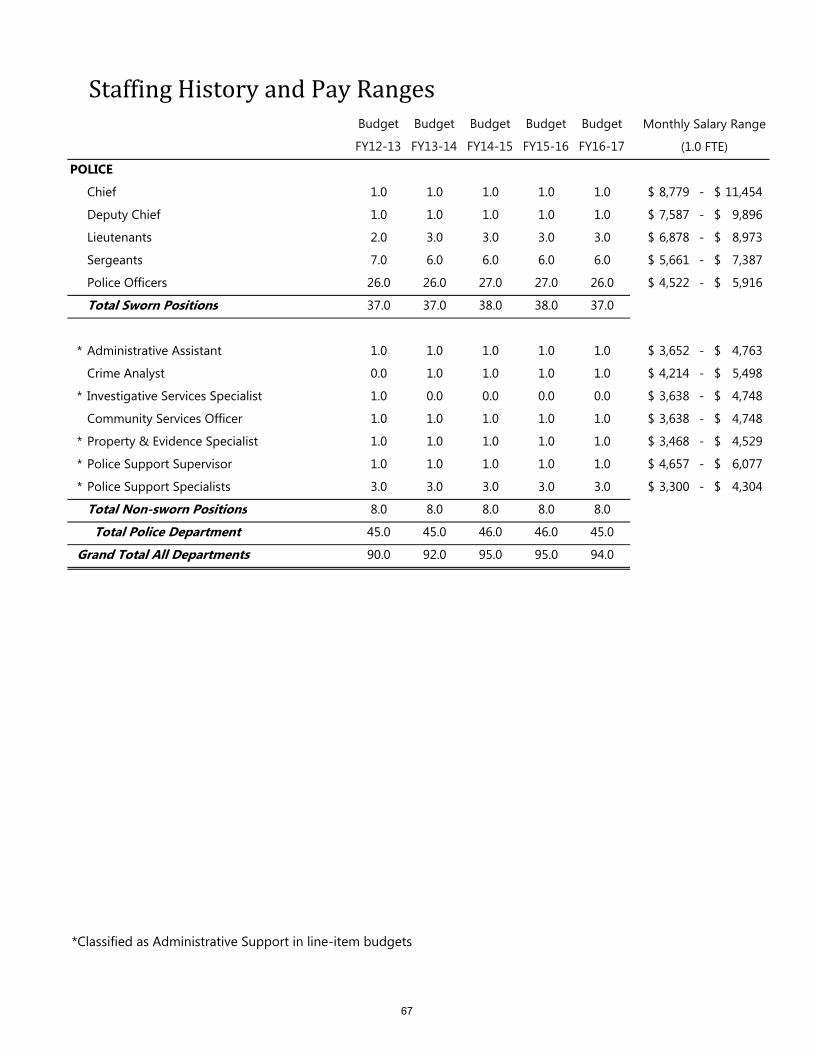
Budget FY12-13
Budget FY13-14
Budget FY14-15
Budget FY15-16
Budget FY16-17
StaffingHistoryandPayRangesMonthly Salary Range
(1.0 FTE)POLICE
Chief 1.0 1.0 1.0 1.0 1.0 8,779$ - 11,454$ Deputy Chief 1.0 1.0 1.0 1.0 1.0 7,587$ - 9,896$ Lieutenants 2.0 3.0 3.0 3.0 3.0 6,878$ - 8,973$ Sergeants 7.0 6.0 6.0 6.0 6.0 5,661$ - 7,387$ Police Officers 26.0 26.0 27.0 27.0 26.0 4,522$ - 5,916$ Total Sworn Positions 37.0 37.0 38.0 38.0 37.0
* Administrative Assistant 1.0 1.0 1.0 1.0 1.0 3,652$ - 4,763$ Crime Analyst 0.0 1.0 1.0 1.0 1.0 4,214$ - 5,498$
* Investigative Services Specialist 1.0 0.0 0.0 0.0 0.0 3,638$ - 4,748$ Community Services Officer 1.0 1.0 1.0 1.0 1.0 3,638$ - 4,748$
* Property & Evidence Specialist 1.0 1.0 1.0 1.0 1.0 3,468$ - 4,529$ * Police Support Supervisor 1.0 1.0 1.0 1.0 1.0 4,657$ - 6,077$ * Police Support Specialists 3.0 3.0 3.0 3.0 3.0 3,300$ - 4,304$
Total Non-sworn Positions 8.0 8.0 8.0 8.0 8.0 Total Police Department 45.0 45.0 46.0 46.0 45.0
Grand Total All Departments 90.0 92.0 95.0 95.0 94.0
*Classified as Administrative Support in line-item budgets
67

StaffingAllocationsCommunity
General Street PEG Center Sewer Water SLD StormwaterFund Fund Fund Fund Fund Fund Fund Fund Total
CITY MANAGER'S OFFICECity Manager 74.0% 6.0% 0.3% 1.3% 2.3% 9.6% 0.3% 6.2% 100.0%
CITY ATTORNEYAttorney Staff 82.2% 8.4% 0.6% 1.3% 1.5% 3.2% 0.3% 2.5% 100.0%
HUMAN RESOURCES Human Resource Staff 65.7% 3.7% 0.1% 1.2% 3.1% 15.9% 0.3% 10.0% 100.0%
FINANCE Finance and Accounting Staff 46.7% 8.5% 0.6% 0.6% 17.9% 17.9% 2.0% 5.8% 100.0%Administrative Specialist 14.4% 2.6% 0.0% 70.0% 5.4% 5.4% 0.6% 1.6% 100.0%Utility Billing Staff 0.0% 0.0% 0.0% 0.0% 47.0% 43.0% 0.0% 10.0% 100.0%Court Clerk 100.0% 0.0% 0.0% 0.0% 0.0% 0.0% 0.0% 0.0% 100.0%Network Support Staff 66.4% 3.6% 0.2% 1.2% 2.9% 15.6% 0.3% 9.8% 100.0%
PUBLIC WORKSDirector 7.0% 40.0% 0.0% 0.0% 5.0% 25.0% 5.0% 18.0% 100.0%Public Works Permit Specialist 0.0% 43.0% 0.0% 0.0% 12.0% 30.0% 10.0% 5.0% 100.0%Stormwater Program Staff 0.0% 0.0% 0.0% 0.0% 0.0% 0.0% 0.0% 100.0% 100.0%Municipal Utility Worker I - Parks 100.0% 0.0% 0.0% 0.0% 0.0% 0.0% 0.0% 0.0% 100.0%Municipal Utility Worker I - Stormwater 0.0% 0.0% 0.0% 0.0% 0.0% 0.0% 0.0% 100.0% 100.0%Municipal Utility Worker I - Water, Stormwater 0.0% 0.0% 0.0% 0.0% 0.0% 75.0% 0.0% 25.0% 100.0%Municipal Utility Worker I - Street, Water 0.0% 75.0% 0.0% 0.0% 0.0% 25.0% 0.0% 0.0% 100.0%Municipal Utility Worker II - Street, Stormwater 0.0% 25.0% 0.0% 0.0% 0.0% 0.0% 0.0% 75.0% 100.0%Municipal Utility Worker I & II - Water 0.0% 0.0% 0.0% 0.0% 0.0% 100.0% 0.0% 0.0% 100.0%Project Manager 0.0% 25.0% 0.0% 0.0% 0.0% 65.0% 0.0% 10.0% 100.0%Water Division Manager 0.0% 0.0% 0.0% 0.0% 0.0% 100.0% 0.0% 0.0% 100.0%Street & Stormwater Operations Division Manager 0.0% 40.0% 0.0% 0.0% 0.0% 0.0% 0.0% 60.0% 100.0%Parks & Facilities Division Manager 100.0% 0.0% 0.0% 0.0% 0.0% 0.0% 0.0% 0.0% 100.0%Facility Maintenance Staff 65.7% 3.7% 0.1% 1.2% 3.1% 15.9% 0.3% 10.0% 100.0%
CITY RECORDERCity Recorder Staff 69.2% 6.1% 0.3% 6.1% 2.3% 9.5% 0.3% 6.2% 100.0%Community Center Coordinator 0.0% 0.0% 0.0% 100.0% 0.0% 0.0% 0.0% 0.0% 100.0%
COMMUNITY DEVELOPMENTCommunity Development Director 87.0% 10.0% 0.0% 0.0% 1.0% 1.0% 0.0% 1.0% 100.0%Senior Planner 97.0% 0.0% 0.0% 0.0% 1.0% 1.0% 0.0% 1.0% 100.0%Associate Planner 87.0% 10.0% 0.0% 0.0% 1.0% 1.0% 0.0% 1.0% 100.0%Code Enforcement 85.0% 15.0% 0.0% 0.0% 0.0% 0.0% 0.0% 0.0% 100.0%Permit Specialist 100.0% 0.0% 0.0% 0.0% 0.0% 0.0% 0.0% 0.0% 100.0%
POLICEAll staff 100.0% 0.0% 0.0% 0.0% 0.0% 0.0% 0.0% 0.0% 100.0%
68

ACTUAL ACTUAL BUDGETED PROJECTED PROPOSED APPROVED ADOPTED % CHANGE % CHANGE
LINE ITEM 2013-14 2014-15 2015-16 2015-16 2016-17 2016-17 2016-17BUDGETED
2015-16PROJECTED
2015-16
1 Vehicle Allowance 4,200$ 4,200$ 4,200$ 4,200$ 4,200$ 4,200$ 4,200$ 0% 0%2 Stipends & Certifications 47,043 46,605 60,200 56,800 80,100 80,100 80,100 33% 41%3 Wellness 14,667 17,330 35,300 24,400 35,000 35,000 35,000 -1% 43%4 Medicare & Social Security 103,702 105,148 105,600 108,900 112,000 112,000 112,000 6% 3%5 Retirement 1,141,266 1,230,178 1,601,100 1,561,600 1,595,700 1,595,700 1,595,700 0% 2%6 Insurance Benefits 1,522,284 1,655,571 1,856,400 1,801,100 1,979,500 1,979,500 1,979,500 7% 10%7 Workers Compensation 52,791 74,476 63,500 65,000 66,700 66,700 66,700 5% 3%
2,885,953$ 3,133,507$ 3,726,300$ 3,622,000$ 3,873,200$ 3,873,200$ 3,873,200$ 4% 7%
Notes:12
3
4
56
7 Workers Compensation costs are based on a percentage of eligible wage and salary by employee class. Class rates are developed using claims experience in those classes. Class rates are not expected to increase more than 7% over FY15-16 rates for the City.
Beginning FY12-13 the City established a wellness program for Police Department staff as a result of union negotiations. The program pays $250 to each employee who passes a fitness test. The test is offered twice a year. Beginning with FY13-14 the City offers a Wellness program to City Hall and Public Works employees. These employees are eligible for up to $400 annually for meeting fitness benchmarks. The success of the wellness program is reflected in the lower-than-average increase in the City's health insurance premiums for FY16-17.Medicare costs are 1.45% of eligible wages and deferred compensation contributions. Social security is paid to newly hired and temporary employees who are not otherwise eligible for retirement benefits.Benefits are paid as a percentage of wages and salaries, therefore costs increase as a result of wage, salary, and merit increases.Non-represented employees are required to pay 10% and represented employees are required to pay 5% of the cost of the medical and dental insurance premiums. In FY16-17, the City's health insurance will increase 7% and dental insurance premiums will increase 9%. The City pays the full cost of life insurance ($60,000 in coverage per employee) and long-term disability premium. No increase is anticipated in FY16-17 for these premiums, however, premiums are based on salaries and wages and will be adjusted accordingly.
SummaryofEmployeeBenefits
Vehicle Allowance is for the City Manager as established in an employment contract.The increase in the FY16-17 Budget from FY15-16 projected is due to a change in how the Police Department handles on-call time. The new collective bargaining agreement provides for a stipend in lieu of the previously provided compensatory time-off.
2013‐14 2014‐15 2015‐16 2015‐16 2016‐17 2016‐17 2016‐17
ACTUAL ACTUAL BUDGETED PROJECTED PROPOSED APPROVED ADOPTED
Workers Compensation
Insurance Benefits
Retirement
Medicare & Social Security
Wellness
Stipends & Certifications
Vehicle Allowance
69

CityManager’sOffice
OVERVIEW The City Manager is the Chief Executive Officer for the City of Keizer and Urban Renewal Agency. This position provides the Mayor and City Councilors with information, implements policies adopted by the Council, and manages the City operations in an effective and efficient manner. The City Manager oversees all departments, which provide services to the citizens of Keizer. These Departments include City Recorder, Community Development, Finance, Human Resources, Public Works, and Police. The City Manager is appointed by, reports to and serves at the pleasure of the City Council under contract. The City Manager is the primary liaison with other local Municipal, State and Federal agencies. PRIMARY FUNCTIONS Provides organizational leadership Performs City Charter duties
o Advise council on affairs and needs of the city o Ensure administration of all ordinances o Ensure franchises, leases, contracts, permits and privileges granted by the city are fulfilled o Prepare and submit the annual budget o Supervise operations of city utilities
Performs City Council duties o Recommend policy, program enhancements and public services o Keep mayor and city council informed o Develop and manage policies and procedures o Achieve fiscal objectives through budgets o Active in community relations
Directs the City Management Team Performs strategic planning
COUNCIL GOALS ASSIGNED The City Manager is involved in accomplishing all short and long term council goals either directly or through leadership of management staff. COMMUNITY INVOLVEMENT Chamber of Commerce Rotary
ADVISORY COMMITTEES Keizer Channel 23 Long-Range Planning Committee Budget Committee Fire District Meetings Little League Task Force
WORKLOAD INDICATORS
Workload Indicators FY 11-12 FY 12-13 FY 13-14 FY 14-15
FY 15-16 City Council and URA Board meetings 39 42 34 32 28 Total Expenditures $32 million $26 million $37 million $24 million $24 million City-wide FTE 90.5 90.0 92.0 95 95
70

CityManager’sOffice
HIGHLIGHTS Worked to promote development of new commercial and residential properties. Accomplished all short-term City Council goals that were able to be accomplished.
GOALS AND INITIATIVES Strengthen public safety Improve parks support and capacity Stabilize funding capacity Promote economic development Complete Periodic Review and proceed with urban growth boundary expansion measures Complete council goals
TOTAL EXPENDITURES $225,700 1.O FTE
Personnel Services $219,400 Materials & Services $6,300
ALLOCATION OF CITY MANAGER’S COSTS Costs are allocated based on a blend of full-time equivalents and time spent on projects. A time tracking mechanism, managed by the Legal Department staff, is used and the results are categorized by operating fund. A three-year rolling is used as the basis for allocating costs which helps smooth out spikes in workload in any given year. General $ 167,000
Street 13,500
PEG 700
Community Center 2,900
Sewer 5,200
Water 21,700
SLD 700
Stormwater 14,000
$ 225,700
Personnel Services
95%
Materials & Services
3%
General Street
Community Center
PEG
Sewer Water
SLD Stormwater
71

CityManager’sOffice
PROFESSIONAL CODE OF ETHICS Because caring for and tendering the public trust is of critical importance, Professional Managers are bound by a code of ethics that guides their actions on a daily basis. These ethical standards are listed below: Tenet 1. Be dedicated to the concepts of effective and democratic local government by responsible elected officials and believe that Professional General Management is essential to the achievement of this objective. Tenet 2. Affirm the dignity and worth of the services rendered by government and maintain a constructive, creative, and practical attitude toward local government affairs and a deep sense of social responsibility as a trusted public servant. Tenet 3. Be dedicated to the highest ideals of honor and integrity in all public and personal relationships in order that the member may merit the respect and confidence of the elected officials, of other officials and employees, and of the public. Tenet 4. Recognize that the chief function of local government at all times is to serve the best interests of all of the people. Tenet 5. Submit policy proposals to elected officials; provide them with facts and advice on matters of policy as a basis for making decisions and setting community goals; and uphold and implement local government policies adopted by elected officials. Tenet 6. Recognize that elected representatives of the people are entitled to the credit for the establishment of local government policies; responsibility for policy execution rests with the members. Tenet 7. Refrain from all political activities which undermine public confidence in professional administrators. Refrain from participation in the election of the members of the employing legislative body. Tenet 8. Make it a duty to continually improve the member's professional ability and to develop the competence of associates in the use of management techniques. Tenet 9. Keep the community informed on local government affairs; encourage communication between the citizens and all local government officers; emphasize friendly and courteous service to the public; and seek to improve the quality and image of public service. Tenet 10. Resist any encroachment on professional responsibilities, believing the member should be free to carry out official policies without interference, and handle each problem without discrimination on the basis of principle and justice. Tenet 11. Handle all matters of personnel on the basis of merit so that fairness and impartiality govern a member's decisions, pertaining to appointments, pay adjustments, promotions, and discipline. Tenet 12. Seek no favor; believe that personal aggrandizement or profit secured by confidential information or by misuse of public time is dishonest.
72

CityAttorney’sOffice
OVERVIEW The City Attorney is a Charter officer, answering directly to the City Council. The City Attorney’s Office is responsible for most legal matters involving the City, and also oversees the efforts of outside counsel for matters requiring special expertise. The City Attorney’s Office provides legal advice and representation to the City Council, the City Manager, City staff and various City boards and committees. The Office provides advice at public meetings, including legislative and quasi-judicial hearings of the City Council and Planning Commission. PRIMARY FUNCTIONS Constitutional law Municipal law Land use Public contracting Public records requests Public meetings Code enforcement Real estate transactions Municipal court prosecution
ADVISORY COMMITTEES Planning Commission
COUNCIL GOALS ASSIGNED Take appropriate steps to liquidate any Keizer
Station Area-A property foreclosed upon and refund the River Road Renaissance program after completing a review of the programs goals and proposed projects. (City Attorney to assist staff on property liquidation.)
Explore and determine policy direction regarding Urban Growth Boundary expansion. (City Attorney to assist staff on legal issues.)
Sidewalk Local Improvement District (LID) program. (City Attorney to draft program outline/ possible new ordinance.)
Identify and develop stable funding mechanism to support parks (City Attorney to draft documents and assist staff on legal issues.)
TOTAL EXPENDITURES $289,100 2.O FTE Personnel Services $276,700 Materials & Services $12,400
WORKLOAD INDICATORS
Workload Indicators
FY 11-12
FY 12-13
FY 13-14
FY 14-15
FY 15-16 est.
City Council and URA Board meetings 39 42 34 32
28
City Ordinances/ Orders reviewed and adopted 21 20 15 36
30
City Resolutions reviewed and adopted 104 121 90 109
100
Planning Commission Meetings 11 9 11 10
11
Personnel Services
95%
Materials & Services
5%
73

CityAttorney’sOffice
ALLOCATION OF LEGAL COSTS The City Attorney’s Office tracks time spent on various projects and categorizes the results by operating fund. A rolling three-year average is used as the basis for allocating costs which helps smooth out spikes in workload in any given year.
HIGHLIGHTS Assisted in land use matters relating to UGB expansion/annexation/zone change and comprehensive plan
change for a portion of Keizer Rapids Park property Assisted in development of the Public Art Program Assisted in development of medical/recreational marijuana facilities regulations Assisted in land use matters relating to Keizer Station Area C Master Plan
GOALS AND INITIATIVES Provide legal support for: The priorities established in the City Council’s adopted goals Continue to provide first class service to City Council, staff, committees and the public Always treat citizens with respect and civility even when they have interests contrary to City interests Be proactive in identifying problem scenarios in advance
General
Street
Community Center
PEG Sewer Water SLD StormwaterGeneral $ 237,600
Street 24,300PEG 1,700Community Center 3,800Sewer 4,300Water 9,300SLD 900Stormwater 7,200
$ 289,100
74

CityRecorder’sDepartment
OVERVIEW The City Recorder’s Department is responsible for the overall administration, coordination and evaluation of all City Recorder and Community Center functions. The City Recorder staff serves as the Clerk of the City Council and related committees and commissions, Records Manager and City Elections Official. This Department is responsible for a variety of highly confidential and sensitive information. PRIMARY FUNCTIONS Clerk of Keizer City Council Community Center management Risk management (except Personnel) Volunteer program management Elections officer Records management Special Event Permit/Liquor Licensing Public Information Access
o Website o Social Media
ADVISORY COMMITTEES The City Recorder’s Department provides support services to the following city committees: Audit Committee Budget Committees Keizer Urban Renewal Agency Keizer Economic Development Commission Keizer Points of Interest Committee Keizer Public Arts Commission Keizer Festivals and Events Services Team Committee Keizer Parks and Recreation Advisory Committee Long-Range Planning Committee Planning Commission Stormwater Advisory Committee Traffic Safety/Bikeways/Pedestrian Committee Volunteer Coordinating Committee Various Task Forces established by City Council
COUNCIL GOALS ASSIGNED Assist in creating a task force to foster community engagement Assist in creating a Youth Council program Develop sustainable community center strategy Explore hiring a Volunteer Coordinator and investigate implementing a volunteer based code enforcement
and park patrol program to augment the City’s capabilities. (City Recorder to assist in hiring a Volunteer Coordinator)
75

CityRecorder’sDepartment
HIGHLIGHTS Provided elected officials, staff, and citizens of Keizer with information, both in an electronic and paper
format, on current and past proceedings within their City. Provided city volunteers with the support and educational information they needed to carry forth the goals
and objectives of the City. Continued development of a sustainable community center management plan.
GOALS AND INITIATIVES Developing marketing strategy for Community Center. Review and Update Community Center Rate Structure. Update Community Center Use Agreement. Update and Revise City Public Records policy. Review of the City’s Electronic Records Management Storage System to comply with the Criminal Justice
Information Systems. TOTAL EXPENDITURES $227,700 (Records Department) 2.O FTE (the Records Department also manages 1.0 FTE funded in the Community Center Fund)
Personnel Services $221,500 (Records Department) $96,900 (Community Center) Materials & Services $6,200 (Records Department) $128,100 (Community Center) Capital Outlay $4,600 (Community Center) Contingency $11,500 (Community Center)
General $ 157,600 Street 13,900 PEG 700 Community Center 13,900 Sewer 5,200 Water 21,600 SLD 700 Stormwater 14,100
$ 227,700
General
Street
PEG
Community Center
Sewer Water
SLDStormwater
76

CityRecorder’sDepartment
ALLOCATION OF CITY RECORDER COSTS Costs are allocated through a time tracking mechanism managed by the Legal Department staff and the results are categorized by operating
fund. A three-year rolling average is used as the basis for allocating costs which helps smooth out spikes in workload in any given year.
WORKLOAD INDICATORS
Workload Indicators FY 11-12 FY 12-13 FY 13-14 FY 14-15
FY15-16 est. Number of City Council and URA Board meetings 39 42 32 32 28 City and URA Ordinances reviewed and adopted 21 20 30 36 30 City and URA Resolutions reviewed and adopted 104 121 113 109 100 Planning Commission Meetings 11 9 11 10 11
77

HumanResources
OVERVIEW The Human Resources Department provides employment and personnel services to the City’s managers and employees as well as information and assistance to external customers and job applicants. The Department is responsible for a full range of comprehensive human resource (HR) services and programs to enhance the efficiency and effectiveness of the organization. PRIMARY FUNCTIONS Classification & Compensation Employee Benefits Employee & Labor Relations Employee Safety & Risk Management Health & Wellness HR Information System (HRIS) & Intranet HR Policies & Procedures HR Records Administration & Management Performance Evaluation Recruitment & Selection Workforce Planning
ADVISORY COMMITTEES Personnel Policy Committee
HIGHLIGHTS Certified HR staff to provide CPR/First Aid/AED training. Completed salary surveys for Keizer Police Association and Laborer’s International Union of North America
Local 320 classifications. Won national employer vs. employer challenge through competitive employee health & wellness team. Provided consultation on and participation in bargaining activities to implement new contracts. Won ‘Gold Safety Award’ by League of Oregon Cities (LOC) & Citycounty Insurance Services (CIS). Provided retirement training and support to employees for actual and planned retirements. Facilitated national recruitment resulting in competitive pool and successful hire of new Finance Director. Added job descriptions and pay schedules to HR Department web page. Revised City policy & practice and provided direction to staff as needed to incorporate new legislation in
healthcare reform, “ban the box,” expanded sick leave legislation and veteran’s preference legal rulings. Completed classification review Event Center Coordinator, collected initial class data for Citizen
Information & Engagement Specialist. Provided City data and advice to the PSU Center for Public Service Total Employee Cost of Compensation
Program (TECC) as a Founding and Advisory Member. Provided information and advocacy for municipal HR priorities through membership on the LOC HR
Legislative Policy Committee.
GOALS AND INITIATIVES Transition to automated HR information system (HRIS) and online recruitment tools to better leverage
limited resources and staff, improve data analysis capacity and communication capacity with applicants. In partnership with Safety Committee, CIS and Leadership, completion of City of Keizer Safety Manual. Establish employee advisory committee to review the City’s health benefits programs. Continue and enhance development of Benefit Education and Training programs and materials to ensure
employees have access to information needed to make the best decisions possible.
78

HumanResources
TOTAL EXPENDITURES $302,400 2.O FTE Personnel Services $278,200 Materials & Services $24,200 OTHER BUDGETARY RESPONSIBILITIES
Wages & Salaries $6,961,300 Insurance Premiums $1,980,200 Retirement $1,596,400 Workers’ Compensation $66,700 Labor Attorney $36,000 Wellness Programs $35,000
ALLOCATION OF HUMAN RESOURCE COSTS Costs are allocated based on City-wide FTE allocations.
General $ 198,700
Street 11,200
PEG 300
Community Center 3,600
Sewer 9,400
Water 48,100
SLD 900
Stormwater 30,200
$ 302,400
General
Street
PEG
Community Center
Sewer
Water
SLDStormwater
Personnel Services
92%
Materials &
Services8%
79

HumanResources
Workload Indicators* FY 11-12 FY 12-13 FY 13-14 FY 14-15 FY 15-16 est.
Budgeted Positions Served 90.5 90 92 95 95
Recruitments Posted 5 9 11 11 8
Employment Applications Processed N/A N/A 409 393 200
Personnel Action Forms Completed N/A 173 200 184 230
FMLA/OFLA Claims Managed 20 15 23 22 30
Workers’ Compensation Claims Managed 5 7 4 5 4
It is important to note that increases in FMLA/OFLA and Worker’s Comp claims managed do not directly correlate with increased claims. A portion of the increases are related to improved communication and documentation of eligible events.
Performance Measures FY 11-12 FY 12-13 FY 13-14 FY 14-15 FY 15-16 est.
% of Regular Status Position Employees Who Pass Probation N/A 86% 100% 100% 100%
Percentage of Current Job Descriptions N/A N/A 99% 95% 100%
Percentage of Employees with Current Performance Evaluations 99% 100% 100% 100% 100%
Percentage of Employees Participating in Wellness Programs N/A 25% 62% 64% 65%
Performance Measures Comments: The percentage of employees who pass probation indicates the City’s performance in developing and
retaining a skilled workforce. However, it must be noted the City is also committed to releasing probationary employees during the probationary period if they are not able to meet the City’s standards.
N/A=Not Available. The City has just recently begun tracking workload indicators; therefore some information is not available for previous years.
80

FinanceDepartment
OVERVIEW The financial operations of the City are planned and directed by the Finance Department. It establishes and sustains controls over the City’s financial activities, and provides accurate, timely financial information to Council and Management. PRIMARY FUNCTIONS coordinates the annual budget preparation and administration analyzes the City’s financial condition invests and manages funds issues and manages debt ensures compliance with federal, state and local legal requirements recommends financial policies to the City Manager and Council maintains the integrity of the City’s accounting records prepares the annual Comprehensive Annual Financial Report facilitates the annual financial statement audit administers utility billing administers municipal court administers information technology supports Community Event Center provides general office administration
ADVISORY COMMITTEES Audit Committee Budget Committees Long-Range Planning Committee
COUNCIL GOALS ASSIGNED Explore and determine policy direction regarding the Urban Growth Boundary expansion Identify stable Parks funding mechanism to support both the construction of the Parks Master Plan CIP and
also operations and maintenance of the parks at an adequate level of service Fund Parks Employee – as soon as sustainable in budget Take appropriate steps to liquidate any Keizer Station Area A property foreclosed upon and refund the River
Road Renaissance program after completing a review of the program’s goals and proposed projects (Finance assist with financial aspects of this goal)
Communications Position/Volunteer Coordinator (assist with funding options) Sidewalk Local Improvement District Program (assist with financial requirements)
81

FinanceDepartment
NON-DEPARTMENTAL The Finance Director, Assistant Controller, Accounting Technician and Administrative Specialist provide for the overall administration of the Finance Department and financial management of the City. HIGHLIGHTS Continued facilitating the development and implementation of a sustainable General Fund revenues and
services plan Repaid interest bearing taxing jurisdictions remaining debt owed from Urban Renewal Ninth Amendment Completed cross training of Finance Director’s responsibilities Received the Certificate of Achievement for Excellence in Financial Reporting from the Government Finance
Officers Association Received the Distinguished Budget Presentation award from the Government Finance Officers Association. Completed the audit services request for proposal process
GOALS AND INITIATIVES I Explore and determine policy direction regarding the
Urban Growth Boundary expansion Identify stable Parks funding mechanism to support both
the construction of the Parks Master Plan CIP and also operations and maintenance of the parks at an adequate level of service
Fund Parks Employee – as soon as sustainable in budget Take appropriate steps to liquidate any Keizer Station
Area A property foreclosed upon and refund the River Road Renaissance program after completing a review of the program’s goals and proposed projects (Finance assist with financial aspects of this goal)
Communications Position/Volunteer Coordinator (assist with funding options)
Sidewalk Local Improvement District Program (assist with financial requirements) WORKLOAD INDICATORS
Workload Indicators Actual
FY 13-14 Actual
FY 14-15 Projected FY 15-16
Budgeted FY16-17
Property Taxes Levied $4.1 million $4.3 million $4.7 million $4.9 million
Tax Increment Levied $1.1 million $1.1 million $0 $0
City Funds/ Cost Centers 21/35 21/35 18/32 18/32
Total Budget $49 million $37 million $37 million $38 million
Debt Outstanding $20 million $18 million $17 million $16 million
Total Revenues $28 million $25 million $24 million $25 million
Total Expenditures $37 million $24 million $24 million $29 million
Personnel Services
93%
Materials &
Services7%
82

FinanceDepartment
TOTAL EXPENDITURES $453,000 Administrative Services Fund 4.O FTE Personnel Services $421,500 Materials & Services $31,500 ALLOCATION OF COSTS Costs are allocated based on a blend of revenues and expenditures city-wide except for the Office Assistant's time is allocated 70% to the Community Center as part of the position's regular duties. General $ 189,300 Street 34,400 PEG 2,300 Community Center 51,200 Sewer 72,000 Water 72,000 SLD 8,200 Stormwater 23,600
$ 453,000
General
Street
PEG
Community Center
Sewer
Water
SLD
Stormwater
83

FinanceDepartment
INFORMATION SYSTEMS The Information Technology Division supports the City’s software, hardware, telecommunication, and security systems’ needs. HIGHLIGHTS Assisted with the implementation of an advanced user authentication process in the Police Department as
required by the Department of Justice CJIS requirements Replaced two aging servers GOALS AND INITIATIVES Continue to ensure compliance with the Department of Justice CJIS requirements
WORKLOAD INDICATORS
Workload Indicators FY 11-12 FY 12-13 FY 13-14 FY 14-15
FY 15-16 est. Computer Workstations supported 120 123 123 157 157Telephones supported 110 110 110 110 110City facilities networked 2 2 2 2 2
TOTAL EXPENDITURES $443,700 Administrative Services Fund 2.O FTE Personnel Services $211,700 Materials & Services $182,000 Capital Outlay $50,000
ALLOCATION OF COSTS Costs are allocated based on FTE allocations charged to each operating fund except software and hardware costs are based on dollars expended by fund. General $ 288,000 Street 12,900 PEG 400 Community Center 9,800 Sewer 16,900 Water 58,100 SLD 1,300 Stormwater 56,300
$ 443,700
General
Street
PEG
Community Center
Sewer
Water
SLD Stormwater
Personnel Services
48%
Materials &
Services41%
Capital Outlay11%
84

FinanceDepartment
UTILITY BILLING Utility Billing operates and maintains the billing function for the City’s water, sewer, and stormwater utilities. The City bills active accounts bi-monthly, billing one-half of the City one month and alternating billing the other half of the City the following month. Emphasis is on excellence in customer service by addressing needs and concerns with a caring attitude on a consistent basis. HIGHLIGHTS Continued commitment to providing excellent customer service
GOALS AND INITIATIVES Continue to maintain staff customer service skills through customer service training classes TOTAL EXPENDITURES $414,500 Administrative Services Fund 4.0 FTE Personnel Services $305,500 Materials & Services $109,000 ALLOCATION OF COSTS Costs are allocated based on effort expended in managing the separate elements of the utility accounts; 47% sewer, 43% water and 10% stormwater. Sewer $ 194,800 Water 178,200 Stormwater 41,500
$ 414,500
Personnel Services
74%
Materials &
Services26%
Sewer
Water
Stormwater
85
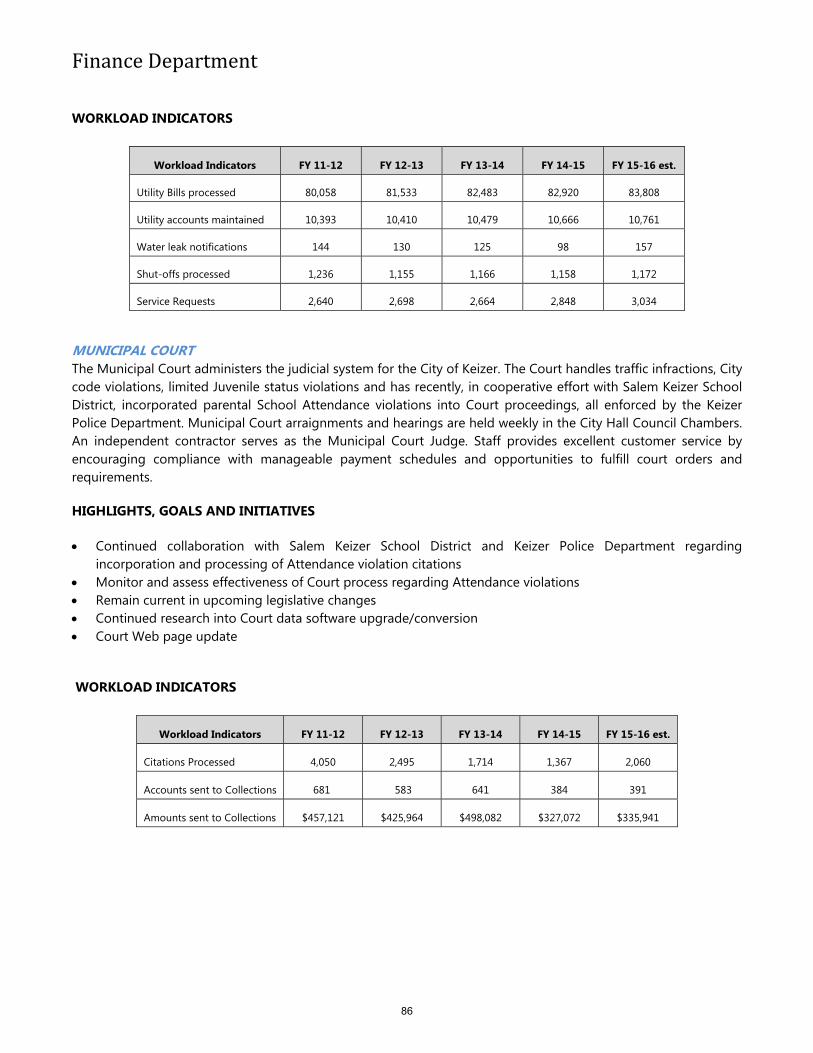
FinanceDepartment
WORKLOAD INDICATORS
Workload Indicators FY 11-12 FY 12-13 FY 13-14 FY 14-15
FY 15-16 est.
Utility Bills processed 80,058 81,533 82,483 82,920 83,808
Utility accounts maintained 10,393 10,410 10,479 10,666 10,761
Water leak notifications 144 130 125 98 157
Shut-offs processed 1,236 1,155 1,166 1,158 1,172
Service Requests 2,640 2,698 2,664 2,848 3,034 MUNICIPAL COURT The Municipal Court administers the judicial system for the City of Keizer. The Court handles traffic infractions, City code violations, limited Juvenile status violations and has recently, in cooperative effort with Salem Keizer School District, incorporated parental School Attendance violations into Court proceedings, all enforced by the Keizer Police Department. Municipal Court arraignments and hearings are held weekly in the City Hall Council Chambers. An independent contractor serves as the Municipal Court Judge. Staff provides excellent customer service by encouraging compliance with manageable payment schedules and opportunities to fulfill court orders and requirements. HIGHLIGHTS, GOALS AND INITIATIVES Continued collaboration with Salem Keizer School District and Keizer Police Department regarding
incorporation and processing of Attendance violation citations Monitor and assess effectiveness of Court process regarding Attendance violations Remain current in upcoming legislative changes Continued research into Court data software upgrade/conversion Court Web page update WORKLOAD INDICATORS
Workload Indicators FY 11-12 FY 12-13 FY 13-14 FY 14-15
FY 15-16 est.
Citations Processed 4,050 2,495 1,714 1,367 2,060
Accounts sent to Collections 681 583 641 384 391
Amounts sent to Collections $457,121 $425,964 $498,082 $327,072 $335,941
86

FinanceDepartment
The City experienced a significant increase in municipal court fines in fiscal year 2015-16 as the result of the Police Department reinstating one-half of the Traffic Safety Unit. TOTAL EXPENDITURES $205,300 FTE 1.0 Personnel Services $88,500 Materials & Services $116,800
$100,000
$150,000
$200,000
$250,000
$300,000
ACTUAL2013-14
ACTUAL2014-15
BUDGETED2015-16
PROJECTED2015-16
PROPOSED2016-17
Fines & Fees
Municipal Court FinesPast Due Collections
PersonnelServices43%
Materials&Services57%
87

CommunityDevelopment
OVERVIEW The Community Development Department provides a variety of services that are important to the economic wellbeing and quality of life of Keizer businesses and residents. Services include managing the City development activities, Economic Development activities, community plans, building permit processes, and enforcing City codes. Long-range planning activities include policy issues regarding management of the Comprehensive Plan, State Planning requirements including Transportation Planning, Urban Growth Boundary issues, and Economic Development. Specific plans such as Master Plans, developing code revisions and ordinance development are developed to achieve council goals. Current planning activities include services to the public for development relative to zoning, land divisions, and floodplain management and shoreline protection. Code Enforcement regulates zoning violations, solid waste, noxious weeds, parking violations, ROW vegetation, and unsafe housing issues, parking enforcement, and graffiti abatement. Building Permit Administration connects development with other appropriate staff within the City, and to Marion County. COUNCIL GOALS ASSIGNED Explore and determine Policy direction regarding
Urban Growth Boundary expansion Revisit and update infill standards Review and assess the River Road Renaissance
program
ADVISORY COMMITTEES Planning Commission Business Advisory Commission Keizer Chamber of Commerce liaison Keizer Public Arts Commission
PRIMARY FUNCTIONS Building permits State and Federal Grants Long-range and Current land use planning Sign permits Transportation planning Code enforcement Economic Development
TOTAL EXPENDITURES $642,500 General Fund 5.O FTE Personnel Services $547,900 Materials & Services $94,600
Personnel Services
85%
Materials &
Services15%
WORKLOAD INDICATORS
Workload Indicators FY 11-12 FY 12-13 FY 13-14 FY 14-15
FY15-16
Land Use Applications 17 15 23 17 10
Building Permits Reviewed 152 202 183 225 205
Single Family Permits Issued 24 33 45 68 79
Multi-family Permits Issued 1 6 0 69 16 Valuation of
Permits Issued (in thousands) $13,036 $17,198 $26,236 $32,464 $63,159
88

CommunityDevelopment HIGHLIGHTS The Department continued updating sections of the Keizer Development Code with several Text Amendment projects outlined with the Planning Commission. Amendments take into consideration such things as Infill Standards and codes and parking standards. The Department continues to be actively involved in coordinating the development of the Keizer Station Area and support to City development plans and activities. Community Development also works on implementing the directives created in the State mandated periodic review of the city’s Comprehensive Plan. This process is necessary to plan for future development in the City and ensure there are adequate policies and goals in place to guide decisions regarding transportation, land supply issues (such as infill requirements and Urban Growth Boundary expansion), economic development, and public facilities needs for the next 20 year planning period. The completion of Keizer EOA/HNA generated direction from the State to address issues identified in those studies. The Community Development Department continues work on strengthening communication and coordination with other departments, agencies and jurisdictions to streamline the development process, eliminate business obstacles, and ensure effective administration of development code provisions while delivering a high level of customer support and assistance. GOALS AND INITIATIVES Work with Department of Land Conservation and Development and Oregon Department of Transportation to secure Transportation Growth Management funds to study and plan for meeting future land needs of the City. Develop effective regulatory tools to assist in meeting future growth needs through Keizer Development Code revisions, and implement additional tools for the City Council to use in addressing the difficult issues regarding urban development in the City of Keizer
89

PoliceDepartment
OVERVIEW The mission of the Keizer Police Department is to help the community maintain order while promoting safety and freedom and building public confidence.
DEPARTMENT-WIDE EMPLOYEES 37 sworn FTE, 8 non-sworn FTE
COUNCIL GOALS ASSIGNED Explore Public Safety funding mechanisms to fill frozen police positions and support an agreed upon level of service for the Police Department
TOTAL EXPENDITURES: $6,475,800 General Fund – Police Operations Personnel Services $5,644,200 Materials & Services $835,600
$152,200 General Fund – Revenue Sharing (capital outlay) $30,000 Law Enforcement Grant Fund (capital outlay)
Performance Measurements As modern policing strategies develop, agency performance measurements are changing, with a growing number of scholars and practitioners calling for the measurement of outcomes, not outputs. Outcomes are those things residents hope for and expect: confidence in their police department and safety in their community.
Output Measurements Outcome MeasurementsNumber of arrests and citations Perceptions of crime and disorder Number of calls for service Perceptions of risk of victimization Crime clearance rates Police legitimacy (satisfaction with the police)
Though not as discrete as outputs, we can measure outcomes. The police department is especially interested in the responses to survey questions. Those questions and their responses appear below. The responses are on a one-to-five scale. The totals below represent those who answered neutral, agree, or strongly agree.
2014 2017 2020I have confidence in police officers in general, not just Keizer police officers. 86.4% I have confidence in Keizer police officers, specifically. 89.4% I feel safe living in Keizer and in neighborhood. 93.2% I feel safe letting my child walk to school 73.5% I feel safe walking down my street during the day. 93.8% I feel safe walking down my street during the night. 78.2% Traffic congestion is a significant problem in Keizer. 72.6% Violations of traffic laws are a significant problem in Keizer. 63.6%
We also asked, How much time should Keizer police officers spend enforcing traffic laws? 22.8% responded “More”; 14.2% responded “Less”; and 63% responded “Already Just Right.”
Outputs are frequently measured as numbers and are often more indicative of workload than of the quality of work. Depending upon the variables, it is often difficult or imprudent to compare outputs between years or between agencies; nevertheless, they may tell a story, so some of them are included in the following table.
Personnel Services86%
Materials & Services
13%
Capital Outlay1%
90

PoliceDepartment
2012 2013 2014 2015Crimes Reported (Parts 1, 2, and 3) 4,424 4,242 3,527 3,574 Adult arrests 1,404 1,593 1,502 1,522 Juvenile referrals (for crimes and status offenses) 481 312 181 202 Violent crimes clearance rate (UCR*): AVG US cities pop. 25-50k 50.3% 50.2% 49.9% + Violent crimes clearance rate (NIBRS**): Keizer 70.8% 67.9% 70.4% 77.8% Property. crimes clearance rate (UCR***): AVG US cities pop. 25-50k 23.3% 24.0% 24.6% + Property crimes clearance rate (NIBRS****): Keizer 20.5% 21.9% 19.4% 22.6% Traffic injury crashes 66 66 56 71 Traffic citations (does not incl. multiple citations to same driver) 2,360 1,977 1,017 1503 Traffic written warnings 2,969 2,622 1,340 1501 Officers/1,000 residents: Oregon cities pop. 33-37,000 1.3 1.3 1.3 1.3 Officers/1,000 residents: Keizer 1.0 1.0 1.0 1.0
The FBI continues to collect and report crime data using the Uniform Crime Reporting Program, though many agencies, including Keizer, report crime data using the National Incident-Based Reporting System. For a better comparison of the two systems, the crimes included in the clearance rates are defined below:
* UCR: Murder, Non-negligent Manslaughter, Rape, Robbery, Aggravated Assault ** NIBRS: Aggravated Assault, Homicide, Rape, Robbery *** UCR: Burglary, Larceny-Theft, Motor Vehicle Theft **** NIBRS: Arson, Burglary (Business, Residence, and Other), Larceny, Motor Vehicle Theft + Information not yet published
91

PublicWorksDepartment
OVERVIEW The Public Works Department is responsible for providing efficient and sound infrastructure, facilities, and services regarding the City’s transportation, water, wastewater, stormwater, parks and building and property management. These services are required year round and are fundamental in supporting the quality of life enjoyed by residents, businesses and visitors. Capital Improvement projects for the various Divisions within the Department are managed by Division staff in coordination with contracted City Engineering firms. COUNCIL GOALS ASSIGNED Assist in identifying a stable funding mechanism for Parks to support both the construction of the Parks
Master Plan CIP and the operations and maintenance of the parks at an adequate level of service. Add another Parks employee to the Parks Division as soon as the cost is sustainable in the budget
PRIMARY FUNCTIONS Manages the activities and operations of the of the following Public Works systems:
a. Streets b. Water c. Stormwater d. Parks e. Facility Maintenance
Administers major Capital Improvement projects for all Public Works Divisions Facilitates and develops Master Plans Directs and monitors contract engineer, construction activities, operations maintenance of each Public Works
system and the regional sewer system and Street Lighting systems Manages the City’s Emergency Management function
ADVISORY COMMITTEES Parks and Recreation Advisory Committee Stormwater Advisory Committee Traffic/Bikeways/Pedestrian Safety Committee
PARKS DIVISION The Parks Division oversees the planning, development, management, and maintenance of over 239 acres of parks, natural and landscaped areas, a skate park, splash fountain, boat ramp and amphitheater. The Parks Division goal is to continue providing clean, safe open spaces and river access for structured and unstructured activities. HIGHLIGHTS Completed landscaping around The Big Toy at Keizer Rapids Park Resurfaced tennis court at Willamette Manor Added 200 yards of certified wood fiber to playgrounds for fall protection Replaced drinking fountain at Carlson Skate Park Added additional patio space at the Amphitheater Added 3 sand volleyball courts at Keizer Rapids Park
, TOTAL EXPENDITURES – $365,800 General Fund* *Parks Operating Fund Personnel Services $162,500 Materials & Services $188,200** Capital Outlay $15,100 **includes Parks Dedicated Funds
92

PublicWorksDepartment
PARK IMPROVEMENT FUND $537,500 – Revenues $516,800 Capital Outlay – planned projects INFRASTRUCTURE OPERATED AND MAINTAINED
19 Individual Parks Totaling 239 Acres 9 Play Structures Splash Fountain Boating Facility 5.44 Miles of Trails 13 Irrigation Systems
STREETS DIVISION The Street Division provides quality streets, lighting, traffic signals, sidewalks, and bike paths. The Division provides total right of way maintenance services for the City. The City contracts striping services with Marion County. Traffic signal system operations and maintenance is contracted with the City of Salem. HIGHLIGHTS Completed the Planning and Design of the Verda/Chemawa Roundabout Project for summer 2016
construction using Federal Grant funds and local matching funds Updated Pavement Condition Index Resurfaced 2.42 miles of various streets as indicated from the Pavement Condition Index (PCI) Continued construction of updated ADA wheel chair ramps Upgraded numerous street lights to LED Completed citywide traffic count update
TOTAL REVENUES – $2,174,600 primary source State Fuel tax
TOTAL EXPENDITURES – $2,462,500 Street Fund Personnel Services $133,100 Materials & Services $777,700 Capital Outlay $1,728,900 INFRASTRUCTURE OPERATED AND MAINTAINED
109.36 Miles of Streets 21 Traffic Signals 7 Bridges 1,800 Street Signs 1,378 Traffic Signs
Personnel Services
6% Materials &
Services32%Capital
Outlay62%
Personnel Services
47%
Materials &
Services49%
Capital Outlay
4%
93

PublicWorksDepartment
WATER DIVISION The Water Division provides safe, high quality, low cost drinking water that meets or exceeds state and federal regulations mandated by the Safe Drinking Water Act and the State of Oregon. The Water Division staff operates and maintains the production, treatment, and distribution system. HIGHLIGHTS Continue updating distribution system to ensure adequate volume and pressure delivery to residents Rehabilitated the Wiessner well and replaced the pump, motor, pump shaft and column Replaced 5 large meters with more accurate and efficient meters Continued the water main line replacement program Installed filter plant at Lacey Court well
TOTAL REVENUES (Water & Water Facility Funds) $3,520,800 - primarily user charges TOTAL EXPENDITURES – $2,712,900 Water Fund Personnel Services $959,800 Materials & Services $1,441,000 Capital Outlay $83,200 Debt Service $228,800 $544,500 Water Facility Fund (Capital Outlay) INFRASTRUCTURE OPERATED AND MAINTAINED
15 Individual Pump Station Facilities 3 Reservoirs 125.3 Miles of Pipe 890 Fire Hydrants 1,786 Valves 10,432 Service Connections
Personnel Services
35%
Materials & Services
53%
Capital Outlay
3%
Debt Service
9%
94

PublicWorksDepartment
STORMWATER DIVISION The Stormwater Division maintains and operates the City’s stormwater system and implements the Department of Environmental Quality approved management plans. The City’s 3 regulatory programs are mandated by the Federal Clean Water Act, the Safe Drinking Water Act, and the State of Oregon. The permits associated with these programs allow the City to discharge untreated stormwater to local waterways, overland flow, and injection into the ground. Adherence to permit conditions allows the City to remain in compliance with State and Federal law. HIGHLIGHTS Continued TV inspection of storm lines. Completed approximately 9% of the system – just under the 10%
measureable goal. Continued implementation of the 3 regulatory management plans Completed 2 stormwater realignment projects Continued repair work as identified by the TV inspection program Initiated the stormwater private facility inventory program Hosted 2 regional events related to stormwater – quality and management Participated as part of an advisory committee to DEQ for development of a new Phase II permit Conducted stormwater sampling in accordance with the state approved monitoring plan
TOTAL REVENUES – $1,781,600 - primarily user charges TOTAL EXPENDITURES – $1,815,700 Stormwater Fund Personnel Services $689,300 Materials & Services $786,700 Capital Outlay $339,700 INFRASTRUCTURE OPERATED AND MAINTAINED
72.4 Miles of Pipe 92 Underground Injection Control Systems (UIC’s) 1,414 Manholes 2,236 Catch Basins 112 Outfalls (Keizer owned and maintained) 148
Outfalls inspected annually 1.3 Acres Vegetated Stormwater Facilities
Personnel Services
38%Materials &
Services43%
Capital Outlay19%
95
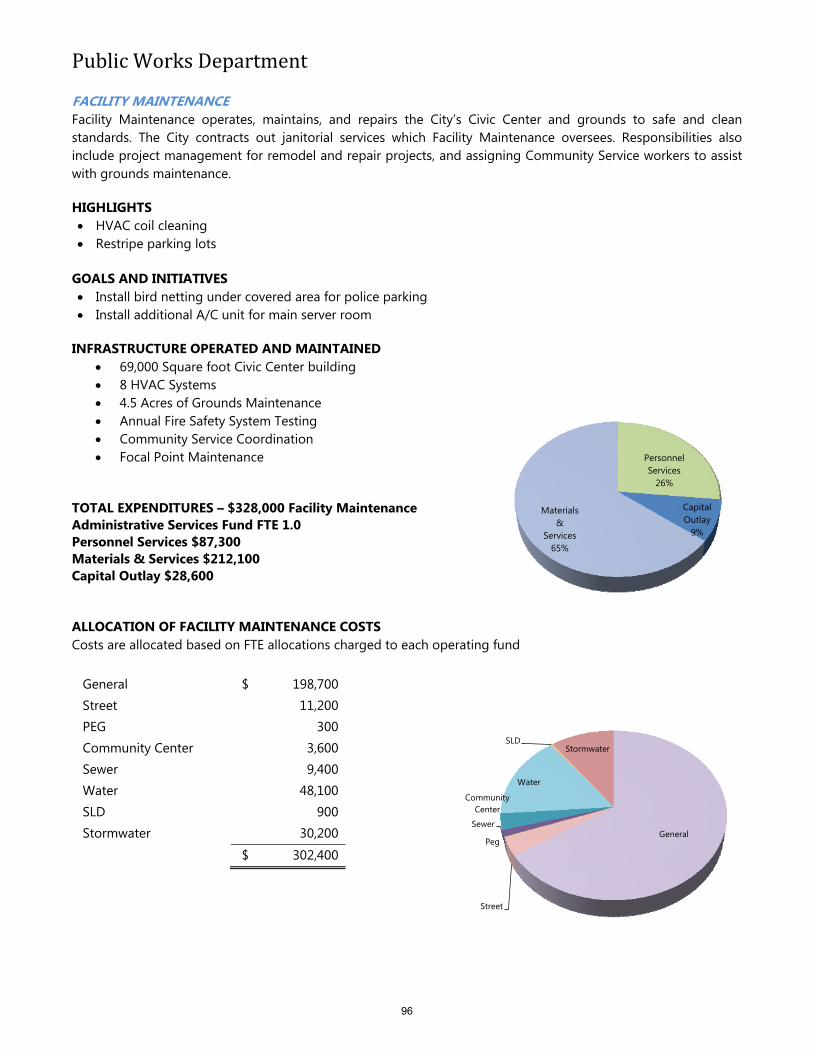
PublicWorksDepartment
FACILITY MAINTENANCE Facility Maintenance operates, maintains, and repairs the City’s Civic Center and grounds to safe and clean standards. The City contracts out janitorial services which Facility Maintenance oversees. Responsibilities also include project management for remodel and repair projects, and assigning Community Service workers to assist with grounds maintenance. HIGHLIGHTS HVAC coil cleaning Restripe parking lots
GOALS AND INITIATIVES Install bird netting under covered area for police parking Install additional A/C unit for main server room
INFRASTRUCTURE OPERATED AND MAINTAINED
69,000 Square foot Civic Center building 8 HVAC Systems 4.5 Acres of Grounds Maintenance Annual Fire Safety System Testing Community Service Coordination Focal Point Maintenance
TOTAL EXPENDITURES – $328,000 Facility Maintenance Administrative Services Fund FTE 1.0 Personnel Services $87,300 Materials & Services $212,100 Capital Outlay $28,600 ALLOCATION OF FACILITY MAINTENANCE COSTS Costs are allocated based on FTE allocations charged to each operating fund General $ 198,700 Street 11,200 PEG 300 Community Center 3,600 Sewer 9,400 Water 48,100 SLD 900 Stormwater 30,200
$ 302,400
General
Street
Peg
Community Center
Sewer
Water
SLDStormwater
Personnel Services
26%
Capital Outlay
9%
Materials &
Services65%
96

PublicWorksDepartment
PUBLIC WORKS NON-DEPARTMENTAL Beginnings in FY14-15 shared overhead costs are tracked in the Administrative Services fund and include those staff which supports all or most Public Works funds. Shared Materials and Services costs are also tracked in this cost center and include the Public Works Shop building costs and other overhead items such as auto insurance. TOTAL EXPENDITURES – $533,200 Public Works Administrative Services Fund 4.0 FTE Personnel Services $488,300 Materials & Services $44,900 ALLOCATION OF PUBLIC WORKS NON-DEPARTMENTAL COSTS Staff costs are allocated based on effort expended in managing and supporting each Public Works Division. Allocation of costs is authorized by Council Resolution. General $ 16,500 Street 178,800 Sewer 18,700 Water 171,300 Street Light Districts 22,400Stormwater 126,000
$ 533,700
General
Street
Sewer
Water
SLD
Stormwater
Personnel Services
91%
Materials &
Services9%
97

Funds & Departments
Administrative Services ......................................................................................... X
Public Works
Streets ................................................................................................................ X
Street Lighting Districts ...................................................................................... X
Transportation Improvements ........................................................................... X
Off‐Site Transportation ...................................................................................... X
Stormwater ........................................................................................................ X
Sewer ................................................................................................................. X
Water ................................................................................................................. X
Park Improvements ............................................................................................ X
General Fund ......................................................................................................... X
Urban Renewal ...................................................................................................... X
Other Funds ........................................................................................................... X
98

ACTUAL ACTUAL BUDGETED PROJECTED PROPOSED APPROVED ADOPTED % CHANGE2013-14 2014-15 2015-16 2015-16 2016-17 2016-17 2016-17 FROM PROJ
1 RESOURCES:2 Beginning Balance: 113,303$ 130,610 130,600$ 160,700$ 130,600$ 130,600$ 130,600$ -19%3 Revenues:4 Charges for Services:5 Charges for Services 2,194,559 3,140,620 3,499,900 3,344,100 3,567,000 3,567,000 3,567,000 7%6 Miscellaneous:7 Miscellaneous Revenue 1,988 26,579 - - - - - 8 Total Revenues 2,196,547 3,167,199 3,499,900 3,344,100 3,567,000 3,567,000 3,567,000 7%9 TOTAL RESOURCES 2,309,850 3,297,809 3,630,500 3,504,800 3,697,600 3,697,600 3,697,600 6%10 REQUIREMENTS:11 Expenditures:12 Personnel Services:13 City Manager 195,610 204,845 213,700 213,800 219,400 219,400 219,400 3%14 City Attorney's Office 239,867 253,583 270,700 270,500 276,700 276,700 276,700 2%15 City Recorder's Office 191,526 199,609 214,200 213,800 221,500 221,500 221,500 4%16 Human Resources 232,444 245,397 265,500 265,100 278,200 278,200 278,200 5%17 Finance - Non-Departmental 399,792 420,712 442,400 415,000 421,500 421,500 421,500 2%18 Finance - Information Systems 96,894 143,927 201,400 200,200 211,700 211,700 211,700 6%19 Finance - Utility Billing - 257,267 294,200 294,500 305,500 305,500 305,500 4%20 Civic Center Facilities 68,303 74,981 83,000 83,000 87,300 87,300 87,300 5%21 Public Works - 452,253 470,500 469,500 488,300 488,300 488,300 4%22 Total Personnel Services 1,424,436 2,252,574 2,455,600 2,425,400 2,510,100 2,510,100 2,510,100 3%23 Materials & Services:24 General Administration 263,288 231,680 261,300 258,100 268,200 268,200 268,200 4%25 City Manager 6,530 5,822 6,300 6,200 6,300 6,300 6,300 2%26 City Attorney's Office 6,758 4,196 13,100 8,000 12,400 12,400 12,400 55%27 City Recorder's Office 5,768 5,051 6,200 6,200 6,200 6,200 6,200 0%28 Human Resources 22,436 27,240 26,800 26,100 24,200 24,200 24,200 -7%29 Finance - Non-Departmental 29,990 28,538 29,500 28,600 31,500 31,500 31,500 10%30 Finance - Information Systems 146,636 112,611 155,500 145,500 182,000 182,000 182,000 25%31 Finance - Utility Billing - 93,077 106,000 102,000 109,000 109,000 109,000 7%32 Civic Center Facilities 194,736 234,650 214,100 207,400 212,100 212,100 212,100 2%33 Public Works - 44,582 47,500 42,200 44,900 44,900 44,900 6%34 Total Materials & Services 676,142 787,447 866,300 830,300 896,800 896,800 896,800 8%35 Capital Outlay:36 Finance - Information Systems 57,840 79,411 88,800 80,000 50,000 50,000 50,000 -38%37 Public Works Administration - 3,825 35,500 35,500 - - - -100%38 Civic Center Facilities 20,822 13,853 2,700 2,900 28,600 28,600 28,600 886%39 Total Capital Outlay 78,662 97,089 127,000 118,400 78,600 78,600 78,600 -34%40 Total Expenditures 2,179,240 3,137,110 3,448,900 3,374,100 3,485,500 3,485,500 3,485,500 3%41 Other Requirements:42 Contingencies - - 181,500 - 212,000 212,000 212,000 43 Fund Balance:44 Committed 130,610 160,699 100 130,700 100 100 100 -100%45 TOTAL REQUIREMENTS 2,309,850$ 3,297,809$ 3,630,500$ 3,504,800$ 3,697,600$ 3,697,600$ 3,697,600$ 6%
The Administrative Services Fund is an Internal Service Fund which is used to account for the financing of goods and/or services provided to various City funds on a cost-reimbursement basis.
Administrative Services are provided by the following activities: General Administration (City Council and Non-departmental), City Manager’s Office, City Attorney’s Office, City Records Department, Human Resources Department, Finance – Non-Departmental, Finance – Utility Billing, Finance - Information Systems, Public Works – Non-departmental and Public Works Civic Center Facilities (building maintenance).
The sources from which the fund shall be replenished: The City’s operating funds are charged for the services provided by the Administrative Services Fund based on various cost allocation plans. These plans are to be revised each year based on anticipated benefits received. The plans are based on a range of factors including number of personnel, percent of effort expended by administrative personnel to the benefiting fund, revenues and expenditures, information technology equipment costs, software costs and maintenance fees.
AdministrativeServicesFundSummary
99

AdministrativeServicesFundSummary-
ACTUAL ACTUAL BUDGETED PROJECTED PROPOSED APPROVED ADOPTED % CHANGE2013-14 2014-15 2015-16 2015-16 2016-17 2016-17 2016-17 FROM PROJ
* General Fund 1,361,709$ 1,472,639$ 1,731,600$ 1,637,500$ 1,699,900$ 1,699,900$ 1,699,900$ 4%
Street Fund 107,227 286,330 311,600 303,100 313,900 313,900 313,900 4%PEG Fund 3,239 3,400 2,300 2,200 6,700 6,700 6,700 205%
* Community Center Fund 58,656 82,189 82,300 78,000 93,400 93,400 93,400 20%Sewer Fund 109,923 297,796 324,600 315,500 347,500 347,500 347,500 10%Water Fund 278,240 606,929 675,100 650,200 688,000 688,000 688,000 6%Street Light Districts Fund 13,753 28,323 35,900 34,900 37,100 37,100 37,100 6%Stormwater Fund 147,210 285,998 336,000 322,700 380,500 380,500 380,500 18%
* Urban Renewal Fund 114,603 77,017 - - - - - Adjustments - - 500 - - - - Total Allocation by Fund 2,194,560$ 3,140,621$ 3,499,900$ 3,344,100$ 3,567,000$ 3,567,000$ 3,567,000$ 7%
*In FY14-15 the Community Center Fund did not have sufficient cash to pay the full cost of Administrative Service Charges so $3,166 was paid by the General Fund. The Urban Renewal Project Fund was closed out in FY14-15 so charges totaling $11,338 were paid by the General Fund.
The increase in the Stormwater, Water, Sewer and Street Funds in fiscal year 2014-15 is due to the new Utility Billing and Public Works cost centers in the Administrative Services Fund. In prior years, Utility Billing and Public Works administrative costs were allocated directly to these funds.
CHARGES FOR SERVICES BY FUND
2013‐14 2014‐15 2015‐16 2015‐16 2016‐17 2016‐17 2016‐17
ACTUAL ACTUAL BUDGETED PROJECTED PROPOSED APPROVED ADOPTED
Urban Renewal Fund
Stormwater Fund
Street Light Districts Fund
Water Fund
Sewer Fund
Community Center Fund
PEG Fund
Street Fund
General Fund
100

ACTUAL ACTUAL BUDGETED PROJECTED PROPOSED APPROVED ADOPTED % CHANGE2013-14 2014-15 2015-16 2015-16 2016-17 2016-17 2016-17 FROM PROJ
1 RESOURCES:2 Beginning Balance: $ 4 $ 4 $ - $ - $ - $ - $ - 3 Revenues:4 Charges for Services:5 Administrative Service Charges 202,140 210,671 220,000 220,000 225,700 225,700 225,700 3%6 TOTAL RESOURCES 202,144 210,675 220,000 220,000 225,700 225,700 225,700 3%7 REQUIREMENTS:8 Expenditures:9 Personnel Services:10 City Manager 139,835 147,642 147,500 147,500 151,600 151,600 151,600 3%11 Vehicle Allowance 4,200 4,200 4,200 4,200 4,200 4,200 4,200 0%12 Cell Phone Stipend - - - - - - - 13 Wellness 207 386 400 400 400 400 400 0%14 Medicare 2,218 2,315 2,400 2,400 2,400 2,400 2,400 0%15 Retirement 32,694 32,965 39,600 39,600 39,900 39,900 39,900 1%16 Insurance Benefits 16,340 17,207 19,400 19,400 20,600 20,600 20,600 6%17 Workers Compensation 116 130 200 300 300 300 300 0%18 Total Personnel Services 195,610 204,845 213,700 213,800 219,400 219,400 219,400 3%19 Materials & Services:20 Meetings, Travel & Training 6,230 5,522 6,000 5,900 6,000 6,000 6,000 2%21 Liability Insurance 300 300 300 300 300 300 300 0%22 Total Materials & Services 6,530 5,822 6,300 6,200 6,300 6,300 6,300 2%23 Total Expenditures: 202,140 210,667 220,000 220,000 225,700 225,700 225,700 3%24 Fund Balance:25 Committed for Operations 4 8 - - - - - 26 TOTAL REQUIREMENTS 202,144$ 210,675$ 220,000$ 220,000$ 225,700$ 225,700$ 225,700$ 3%
CityManager'sOffice
The City Manager is the Chief Executive Officer for the City of Keizer and Urban Renewal Agency. This position provides the Mayor and City Councilors with information, implements policies adopted by the Council, and manages the City operations in an effective and efficient manner. The City Manager oversees all departments, which provide services to the citizens of Keizer. These Departments include City Recorder, Community Development, Finance, Human Resources, Public Works, and Police. The City Manager is appointed by, reports to and serves at the pleasure of the City Council under contract. The City Manager is the primary liaison with other local Municipal, State and Federal agencies.
Costs are allocated based on a blend of full-time equivalents and time spent on projects as authorized in Council Resolution. A time tracking mechanism, managed by the Legal Department staff, is used and the results are categorized by operating fund. A three-year rolling average is used as the basis for allocating costs which helps smooth out spikes in workload in any given year.
101

CityManager'sOffice
ACTUAL ACTUAL BUDGETED PROJECTED PROPOSED APPROVED ADOPTED
2013-14 2014-15 2015-16 2015-16 2016-17 2016-17 2016-17General Fund 139,751$ 151,124$ 168,800$ 168,800$ 167,000$ 167,000$ 167,000$ 74.0%Street Fund 9,283 10,170 11,900 11,900 13,500 13,500 13,500 6.0%Public Education Government Fund - - 100 100 700 700 700 0.3%Community Center Fund 4,192 3,013 2,500 2,500 2,900 2,900 2,900 1.3%Sewer Fund 4,292 5,025 4,900 4,900 5,200 5,200 5,200 2.3%Water Fund 18,168 19,182 19,400 19,400 21,700 21,700 21,700 9.6%Street Light Districts Fund 799 365 600 600 700 700 700 0.3%Stormwater Fund 10,881 11,238 11,800 11,800 14,000 14,000 14,000 6.2%Urban Renewal Fund 14,774 10,554 - - - - - Adjustments - - - - - - - TOTAL CHARGES BY FUND 202,140$ 210,671$ 220,000$ 220,000$ 225,700$ 225,700$ 225,700$ 100.0%
Budget Notes:Expenditures:
9
For additional information on employee benefits see the Summary of Fringe Benefits in the Supplemental Section.
SUMMARY OF CITY MANAGER'S OFFICE CHARGES BY FUND
FTE/ Project Time
The Budget provides a 1.5% salary increase for all non-represented staff. In addition step increases for those eligible as provided for in the City Personnel Policies.
2013‐14 2014‐15 2015‐16 2015‐16 2016‐17 2016‐17 2016‐17
ACTUAL ACTUAL BUDGETED PROJECTED PROPOSED APPROVED ADOPTED
Urban Renewal Fund
Stormwater Fund
Street Light Districts Fund
Water Fund
Sewer Fund
Community Center Fund
Public Education Government Fund
Street Fund
General Fund
102

ACTUAL ACTUAL BUDGETED PROJECTED PROPOSED APPROVED ADOPTED % CHANGE2013-14 2014-15 2015-16 2015-16 2016-17 2016-17 2016-17 FROM PROJ
1 RESOURCES:2 Beginning Balance: $ 56 $ - $ - $ - $ - $ - $ - 3 Revenues:4 Charges for Services:5 Administrative Service Charges 246,569 257,778 283,800 278,500 289,100 289,100 289,100 4%6 TOTAL RESOURCES 246,625 257,778 283,800 278,500 289,100 289,100 289,100 4%7 REQUIREMENTS:8 Expenditures:9 Personnel Services:10 Attorney 126,846 133,903 135,500 135,500 137,500 137,500 137,500 1%11 Administrative Support 51,198 54,058 56,400 56,400 57,200 57,200 57,200 1%12 Cell Phone Stipend 660 660 900 900 900 900 900 0%13 Wellness 114 304 600 300 800 800 800 167%14 Medicare 2,767 2,928 3,000 3,000 3,000 3,000 3,000 0%15 Retirement 25,375 27,163 35,300 35,300 35,800 35,800 35,800 1%16 Insurance Benefits 32,681 34,318 38,800 38,800 41,200 41,200 41,200 6%17 Workers Compensation 226 249 200 300 300 300 300 0%18 Total Personnel Services 239,867 253,583 270,700 270,500 276,700 276,700 276,700 2%19 Materials & Services: 20 Meetings, Travel & Training 5,320 3,731 8,500 6,000 8,400 8,400 8,400 40%21 Legal Services Contracts 348 440 3,500 1,000 3,500 3,500 3,500 250%22 Law Library Maintenance 1,090 25 1,100 1,000 500 500 500 -50%23 Total Materials & Services 6,758 4,196 13,100 8,000 12,400 12,400 12,400 55%24 Total Expenditures: 246,625 257,779 283,800 278,500 289,100 289,100 289,100 4%25 Fund Balance:26 Committed for Operations - (1) - - - - - 27 TOTAL REQUIREMENTS 246,625$ 257,778$ 283,800$ 278,500$ 289,100$ 289,100$ 289,100$ 4%
CityAttorney'sOffice
The City Attorney is a Charter officer, answering directly to the City Council. The City Attorney’s Office is responsible for most legal matters involving the City, and also oversees the efforts of outside counsel for most matters requiring special expertise.The City Attorney’s Office provides legal advice and representation to the City Council, the City Manager, City staff and various City boards and committees. The Office provides advice at public meetings, including legislative and quasi-judicial hearings of the City Council and Planning Commission.
The City Attorney’s Office tracks time spent on various projects and categorizes the results by operating fund. A rolling three-year average is used as the basis for allocating costs.
103
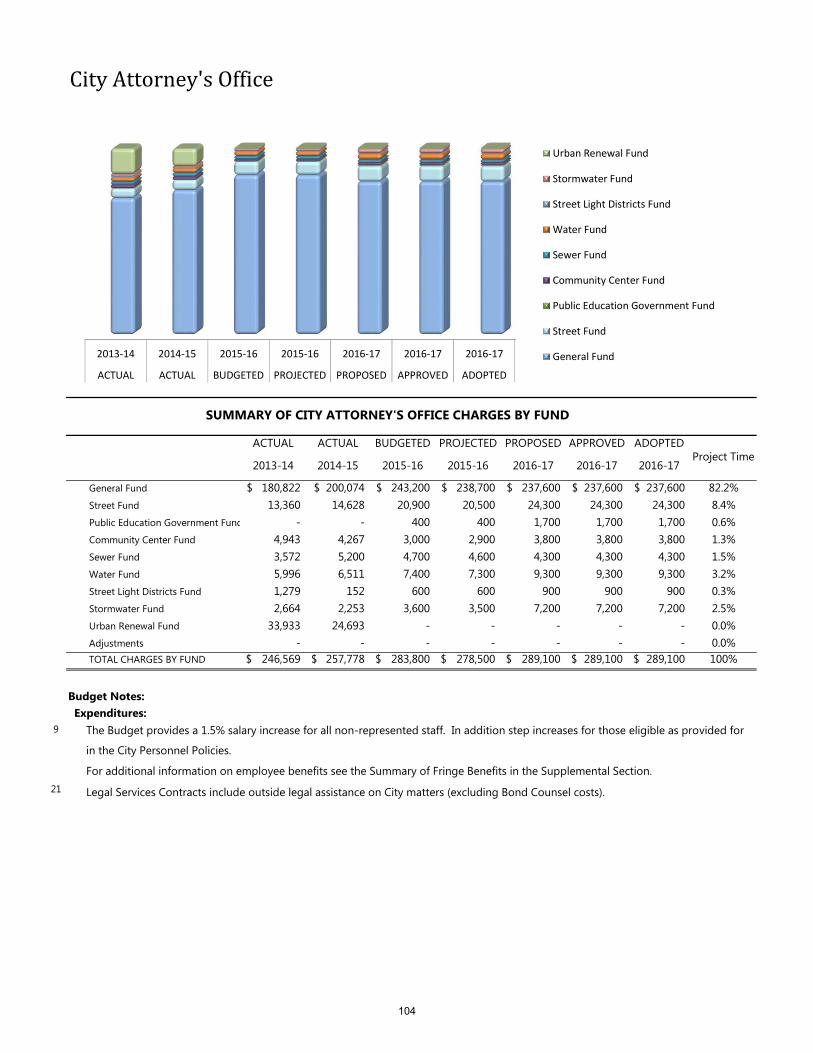
CityAttorney'sOffice
ACTUAL ACTUAL BUDGETED PROJECTED PROPOSED APPROVED ADOPTED
2013-14 2014-15 2015-16 2015-16 2016-17 2016-17 2016-17
General Fund 180,822$ 200,074$ 243,200$ 238,700$ 237,600$ 237,600$ 237,600$ 82.2%Street Fund 13,360 14,628 20,900 20,500 24,300 24,300 24,300 8.4%Public Education Government Fund - - 400 400 1,700 1,700 1,700 0.6%Community Center Fund 4,943 4,267 3,000 2,900 3,800 3,800 3,800 1.3%Sewer Fund 3,572 5,200 4,700 4,600 4,300 4,300 4,300 1.5%Water Fund 5,996 6,511 7,400 7,300 9,300 9,300 9,300 3.2%Street Light Districts Fund 1,279 152 600 600 900 900 900 0.3%Stormwater Fund 2,664 2,253 3,600 3,500 7,200 7,200 7,200 2.5%Urban Renewal Fund 33,933 24,693 - - - - - 0.0%Adjustments - - - - - - - 0.0%TOTAL CHARGES BY FUND 246,569$ 257,778$ 283,800$ 278,500$ 289,100$ 289,100$ 289,100$ 100%
Budget Notes:Expenditures:
9
21 Legal Services Contracts include outside legal assistance on City matters (excluding Bond Counsel costs).
The Budget provides a 1.5% salary increase for all non-represented staff. In addition step increases for those eligible as provided for in the City Personnel Policies. For additional information on employee benefits see the Summary of Fringe Benefits in the Supplemental Section.
SUMMARY OF CITY ATTORNEY'S OFFICE CHARGES BY FUND
Project Time
2013‐14 2014‐15 2015‐16 2015‐16 2016‐17 2016‐17 2016‐17
ACTUAL ACTUAL BUDGETED PROJECTED PROPOSED APPROVED ADOPTED
Urban Renewal Fund
Stormwater Fund
Street Light Districts Fund
Water Fund
Sewer Fund
Community Center Fund
Public Education Government Fund
Street Fund
General Fund
104

ACTUAL ACTUAL BUDGETED PROJECTED PROPOSED APPROVED ADOPTED % CHANGE2013-14 2014-15 2015-16 2015-16 2016-17 2016-17 2016-17 FROM PROJ
1 RESOURCES:2 Beginning Balance: $ 57 $ - $ - $ - $ - $ - $ - 3 Revenues:4 Charges for Services:5 Administrative Service Charges 197,237 204,662 220,400 220,000 227,700 227,700 227,700 4%6 TOTAL RESOURCES 197,294 204,662 220,400 220,000 227,700 227,700 227,700 4%7 REQUIREMENTS:8 Expenditures:9 Personnel Services:10 City Recorder 80,220 82,237 83,300 83,300 84,500 84,500 84,500 1%11 Administrative Support 52,158 55,102 57,500 57,500 60,100 60,100 60,100 5%12 Cell Phone Stipend 605 660 900 900 900 900 900 0%13 Wellness 289 333 800 300 800 800 800 167%14 Medicare 2,050 2,128 2,200 2,200 2,300 2,300 2,300 5%15 Retirement 23,360 24,583 30,500 30,500 31,400 31,400 31,400 3%16 Insurance Benefits 32,681 34,318 38,800 38,800 41,200 41,200 41,200 6%17 Workers Compensation 163 248 200 300 300 300 300 0%18 Total Personnel Services 191,526 199,609 214,200 213,800 221,500 221,500 221,500 4%19 Materials & Services:20 Meetings, Travel & Training 5,768 5,051 6,200 6,200 6,200 6,200 6,200 0%21 Total Expenditures: 197,294 204,660 220,400 220,000 227,700 227,700 227,700 4%22 Fund Balance:23 Committed for Operations - 2 - - - - - 24 TOTAL REQUIREMENTS 197,294$ 204,662$ 220,400$ 220,000$ 227,700$ 227,700$ 227,700$ 4%
CityRecordsDepartment
The City Recorder’s Department is responsible for the overall administration, coordination and evaluation of all City Recorder and Event Center functions. The City Recorder staff serves as the Clerk of the City Council and related committees and commissions, Records Manager and City Elections Official. This Department is responsible for a variety of highly confidential and sensitive information.
Costs are primarily allocated through a time tracking mechanism managed by the Legal Department staff and the results are categorized by operating fund. A three-year rolling average is used as the basis for allocating costs which helps smooth out spikes in workload in any given year. An adjustment is made for the Community Center activity since the City Recorder manages that program. The allocation methodology is authorized by Council Resolution.
105
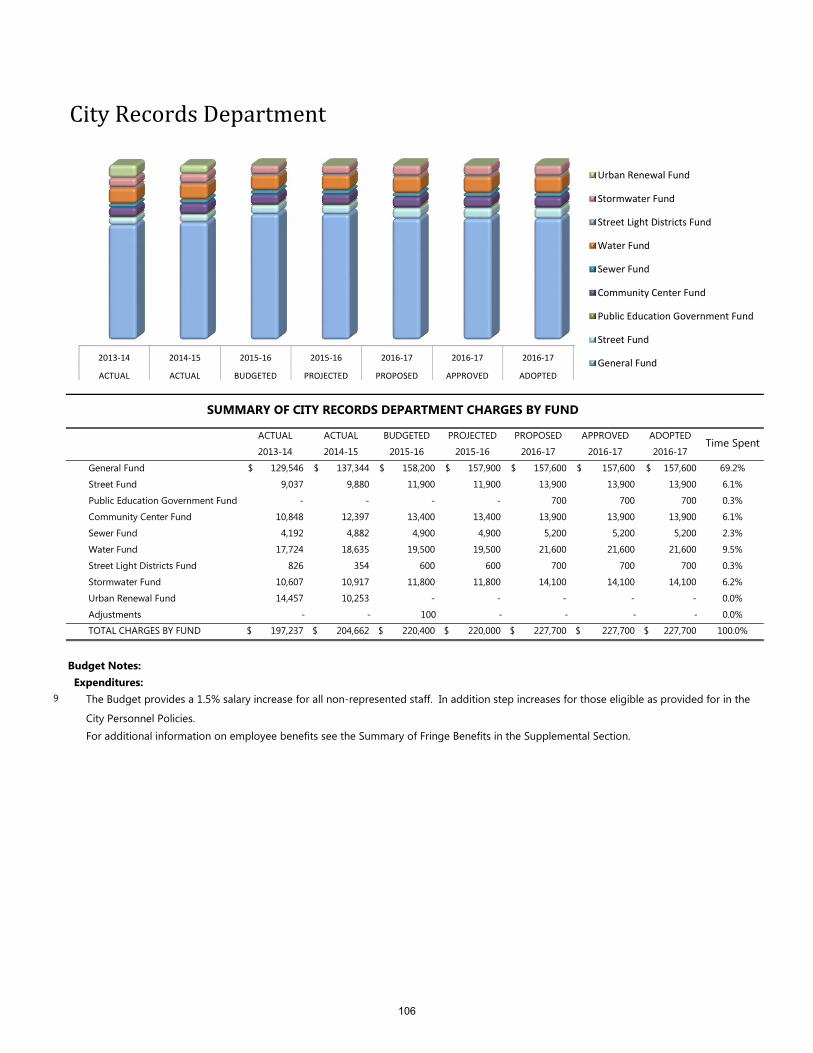
CityRecordsDepartment
ACTUAL ACTUAL BUDGETED PROJECTED PROPOSED APPROVED ADOPTED2013-14 2014-15 2015-16 2015-16 2016-17 2016-17 2016-17
General Fund 129,546$ 137,344$ 158,200$ 157,900$ 157,600$ 157,600$ 157,600$ 69.2%Street Fund 9,037 9,880 11,900 11,900 13,900 13,900 13,900 6.1%Public Education Government Fund - - - - 700 700 700 0.3%Community Center Fund 10,848 12,397 13,400 13,400 13,900 13,900 13,900 6.1%Sewer Fund 4,192 4,882 4,900 4,900 5,200 5,200 5,200 2.3%Water Fund 17,724 18,635 19,500 19,500 21,600 21,600 21,600 9.5%Street Light Districts Fund 826 354 600 600 700 700 700 0.3%Stormwater Fund 10,607 10,917 11,800 11,800 14,100 14,100 14,100 6.2%Urban Renewal Fund 14,457 10,253 - - - - - 0.0%Adjustments - - 100 - - - - 0.0%TOTAL CHARGES BY FUND 197,237$ 204,662$ 220,400$ 220,000$ 227,700$ 227,700$ 227,700$ 100.0%
Budget Notes:Expenditures:
9
Time Spent
SUMMARY OF CITY RECORDS DEPARTMENT CHARGES BY FUND
The Budget provides a 1.5% salary increase for all non-represented staff. In addition step increases for those eligible as provided for in the City Personnel Policies. For additional information on employee benefits see the Summary of Fringe Benefits in the Supplemental Section.
2013‐14 2014‐15 2015‐16 2015‐16 2016‐17 2016‐17 2016‐17
ACTUAL ACTUAL BUDGETED PROJECTED PROPOSED APPROVED ADOPTED
Urban Renewal Fund
Stormwater Fund
Street Light Districts Fund
Water Fund
Sewer Fund
Community Center Fund
Public Education Government Fund
Street Fund
General Fund
106

ACTUAL ACTUAL BUDGETED PROJECTED PROPOSED APPROVED ADOPTED % CHANGE2013-14 2014-15 2015-16 2015-16 2016-17 2016-17 2016-17 FROM PROJ
1 RESOURCES:2 Beginning Balance: 3,074$ -$ -$ -$ -$ -$ -$ 3 Revenues:4 Charges for Services:5 Administrative Service Charges 251,806 272,637 292,300 291,200 302,400 302,400 302,400 4%6 TOTAL RESOURCES 254,880 272,637 292,300 291,200 302,400 302,400 302,400 4%7 REQUIREMENTS:8 Expenditures:9 Personnel Services:10 Administrative Support 57,851 61,283 63,900 63,900 66,800 66,800 66,800 5%11 Human Resources Director 105,277 111,165 115,800 115,800 121,100 121,100 121,100 5%12 Cell Phone Stipend 1,000 900 900 900 900 900 900 0%13 Wellness Program 275 327 800 300 800 800 800 167%14 Medicare/Social Security 2,541 2,670 2,800 2,800 2,900 2,900 2,900 4%15 Retirement 32,645 34,472 42,300 42,300 44,200 44,200 44,200 4%16 Insurance Benefits 32,681 34,318 38,800 38,800 41,200 41,200 41,200 6%17 Workers Compensation 174 262 200 300 300 300 300 0%18 Total Personnel Services 232,444 245,397 265,500 265,100 278,200 278,200 278,200 5%1920 Safety & Wellness 6,837 5,558 8,700 7,000 7,000 7,000 7,000 0%21 Meetings, Travel & Training 5,636 5,856 7,500 6,500 6,600 6,600 6,600 2%22 Labor Attorney -- City-wide 3,164 10,091 5,000 7,000 5,000 5,000 5,000 -29%23 Contractual Services 5,839 4,244 3,400 3,400 3,600 3,600 3,600 6%24 Medical Testing 960 1,491 1,700 1,700 1,600 1,600 1,600 -6%25 Recruitment - - 500 500 400 400 400 -20%26 Total Materials & Services 22,436 27,240 26,800 26,100 24,200 24,200 24,200 -7%27 Total Expenditures: 254,880 272,637 292,300 291,200 302,400 302,400 302,400 4%28 Fund Balance:29 Committed for Operations - - - - - - - 30 Total Fund Balance - - - - - - - 31 TOTAL REQUIREMENTS 254,880$ 272,637$ 292,300$ 291,200$ 302,400$ 302,400$ 302,400$ 4%
Materials & Services:
The Human Resources Department provides responsive employment and personnel services to the City’s managers and employees as well as providing information and assistance to external customers and job applicants. The Department is responsible for a full range of comprehensive human resource services and programs to enhance the efficiency and effectiveness of the organization.
The Human Resource Department costs are allocated based on City-wide FTE allocations as authorized by Council Resolution.
HumanResourcesDepartment
107

HumanResourcesDepartment
ACTUAL ACTUAL BUDGETED PROJECTED PROPOSED APPROVED ADOPTED2013-14 2014-15 2015-16 2015-16 2016-17 2016-17 2016-17
General Fund 163,488$ 179,544$ 198,000$ 197,300$ 198,700$ 198,700$ 198,700$ 65.7%Street Fund 9,430 10,851 10,100 10,100 11,200 11,200 11,200 3.7%Public Education Government Fund - - - - 300 300 300 0.1%Community Center Fund 5,274 3,286 3,400 3,400 3,600 3,600 3,600 1.2%Sewer Fund 7,055 7,506 8,200 8,200 9,400 9,400 9,400 3.1%Water Fund 39,133 42,762 44,000 43,800 48,100 48,100 48,100 15.9%Street Light Districts Fund 804 783 800 800 900 900 900 0.3%Stormwater Fund 24,362 26,704 27,700 27,600 30,200 30,200 30,200 10.0%Urban Renewal Fund 2,260 1,201 - - - - - 0.0%Adjustments - - 100 - - - - TOTAL CHARGES BY FUND 251,806$ 272,637$ 292,300$ 291,200$ 302,400$ 302,400$ 302,400$ 100.00%
Budget Notes:Expenditures:
9 The Budget provides a 1.5% all non-represented and represented staff, respectively. In addition step increases for those eligible as provided for in the City Personnel Policies. For additional information on employee benefits see the Summary of Fringe Benefits in the Supplemental Section.
FTE
SUMMARY OF HUMAN RESOURCES DEPARTMENT CHARGES BY FUND
2013‐14 2014‐15 2015‐16 2015‐16 2016‐17 2016‐17 2016‐17
ACTUAL ACTUAL BUDGETED PROJECTED PROPOSED APPROVED ADOPTED
Urban Renewal Fund
Stormwater Fund
Street Light Districts Fund
Water Fund
Sewer Fund
Community Center Fund
Public Education Government Fund
Street Fund
General Fund
108

ACTUAL ACTUAL BUDGETED PROJECTED PROPOSED APPROVED ADOPTED % CHANGE2013-14 2014-15 2015-16 2015-16 2016-17 2016-17 2016-17 FROM PROJ
1 RESOURCES:2 Beginning Balance: 2,300$ -$ -$ -$ -$ -$ -$ 3 Revenues:4 Charges for Services:5 Administrative Service Charges 427,482 449,255 471,900 443,600 453,000 453,000 453,000 2%6 TOTAL RESOURCES 429,782 449,255 471,900 443,600 453,000 453,000 453,000 2%7 REQUIREMENTS:8 Expenditures:9 Personnel Services:
10 Administrative Support 173,074 181,197 181,900 157,000 172,100 172,100 172,100 10%11 Finance Director 111,687 117,930 122,900 121,000 104,500 104,500 104,500 -14%12 Overtime 452 - - - - - - 13 Wellness 580 562 1,300 500 1,600 1,600 1,600 220%14 Medicare 4,383 4,608 4,800 4,800 4,600 4,600 4,600 -4%15 Retirement 44,023 47,367 55,800 55,800 57,700 57,700 57,700 3%16 Insurance Benefits 65,265 68,541 75,300 75,300 80,400 80,400 80,400 7%17 Workers Compensation 328 507 400 600 600 600 600 0%18 Total Personnel Services 399,792 420,712 442,400 415,000 421,500 421,500 421,500 2%19 Materials & Services:20 Office Materials and Supplies 59 574 - - - - 21 Meetings, Travel & Training 4,146 2,179 3,000 2,500 4,000 4,000 4,000 60%22 Audit Fees 25,785 25,785 26,500 26,100 27,500 27,500 27,500 5%23 Total Materials & Services 29,990 28,538 29,500 28,600 31,500 31,500 31,500 10%24 Total Expenditures: 429,782 449,250 471,900 443,600 453,000 453,000 453,000 2%25 Fund Balance:26 Committed for Operations - 5 - - - - - 27 Total Fund Balance - 5 - - - - - 28 TOTAL REQUIREMENTS 429,782$ 449,255$ 471,900$ 443,600$ 453,000$ 453,000$ 453,000$ 2%
The financial operations of the City are planned and directed by the Finance Department. It establishes and sustains controls over the City’s financial activities, and provides accurate, timely financial information to Council and Management. Costs are allocated based on a blend of revenues and expenditures city-wide except for the Office Assistant's time is allocated 70% to the Community Center as part of the position's regular duties. The Allocation methodology is authorized by Council Resolution.
Finance‐Non‐Departmental
109

Finance‐Non‐Departmental
ACTUAL ACTUAL BUDGETED PROJECTED PROPOSED APPROVED ADOPTED
2013-14 2014-15 2015-16 2015-16 2016-17 2016-17 2016-17General Fund 165,818$ 192,438$ 228,600$ 215,000$ 189,300$ 189,300$ 189,300$ 41.8%Street Fund 32,763 41,521 32,000 30,100 34,400 34,400 34,400 7.6%Public Education Government Fund - - 1,800 1,700 2,300 2,300 2,300 0.5%Community Center Fund 45,232 48,126 45,100 42,400 51,200 51,200 51,200 11.3%Sewer Fund 60,707 60,467 68,700 64,600 72,000 72,000 72,000 15.9%Water Fund 60,707 60,467 68,700 64,600 72,000 72,000 72,000 15.9%Street Light Districts Fund 7,007 6,539 7,700 7,200 8,200 8,200 8,200 1.8%Stormwater Fund 16,056 13,953 19,100 18,000 23,600 23,600 23,600 5.2%Urban Renewal Fund 39,192 25,744 - - - - - 0.0%Adjustments - - 200 - - - - 0.0%TOTAL CHARGES BY FUND 427,482$ 449,255$ 471,900$ 443,600$ 453,000$ 453,000$ 453,000$ 100.00%
Budget Notes:Expenditures:
9
Average Revenue/ Expense
SUMMARY OF FINANCE NON-DEPARTMENTAL CHARGES BY FUND
The Budget provides a 1.5% wage and salary increase for all non-represented. In addition step increases for those eligible as provided for in the City Personnel Policies. For additional information on employee benefits see the Summary of Fringe Benefits in the Supplemental Section.
2013‐14 2014‐15 2015‐16 2015‐16 2016‐17 2016‐17 2016‐17
ACTUAL ACTUAL BUDGETED PROJECTED PROPOSED APPROVED ADOPTED
Urban Renewal Fund
Stormwater Fund
Street Light Districts Fund
Water Fund
Sewer Fund
Community Center Fund
Public Education Government Fund
Street Fund
General Fund
110

ACTUAL ACTUAL BUDGETED PROJECTED PROPOSED APPROVED ADOPTED % CHANGE2013-14 2014-15 2015-16 2015-16 2016-17 2016-17 2016-17 FROM PROJ
1 RESOURCES:2 Beginning Balance: 2,455$ -$ -$ -$ -$ -$ -$ 3 Revenues:4 Charges for Services:5 Administrative Service Charges 298,915 335,951 445,700 425,700 443,700 443,700 443,700 4%6 TOTAL RESOURCES 301,370 335,951 445,700 425,700 443,700 443,700 443,700 4%7 REQUIREMENTS:8 Expenditures:9 Personnel Services:
10 Network Support 65,897 98,671 133,400 133,400 139,400 139,400 139,400 4%11 Temporary Help 3,058 272 - - - - - 12 Cell Phone Stipend 660 660 1,800 900 1,800 1,800 1,800 100%13 Wellness - - 400 - 800 800 800 14 Medicare 1,257 1,552 2,100 2,100 2,200 2,200 2,200 5%15 Retirement 9,563 12,433 24,800 24,800 25,900 25,900 25,900 4%16 Insurance Benefits 16,341 30,112 38,700 38,700 41,200 41,200 41,200 6%17 Workers Compensation 118 227 200 300 400 400 400 33%18 Total Personnel Services 96,894 143,927 201,400 200,200 211,700 211,700 211,700 6%19 Materials & Services:20 Travel & Training 458 44 1,000 500 1,000 1,000 1,000 100%21 Contractual Services 82 41 - - - - - 22 Telephone 14,364 14,228 16,000 16,000 17,000 17,000 17,000 6%23 Computer Software & Maintenance 111,395 76,961 116,500 105,000 140,000 140,000 140,000 33%24 Office Equipment Maintenance 20,337 21,337 22,000 24,000 24,000 24,000 24,000 0%25 Total Materials & Services 146,636 112,611 155,500 145,500 182,000 182,000 182,000 25%26 Capital Outlay:27 Computer Hardware 57,840 79,411 88,800 80,000 50,000 50,000 50,000 -38%28 Total Expenditures: 301,370 335,949 445,700 425,700 443,700 443,700 443,700 4%29 Fund Balance:30 Committed for Operations - 2 - - - - - 31 Total Fund Balance - 2 - - - - - 32 TOTAL REQUIREMENTS 301,370$ 335,951$ 445,700$ 425,700$ 443,700$ 443,700$ 443,700$ 4%
Finance‐InformationSystems
The Information Technology Division supports the City’s software, hardware, telecommunication, and security systems needs.Costs are allocated based on FTE allocations charged to each operating fund except software and hardware costs are based on dollars expended by fund as authorized by Council Resolution.
111

Finance‐InformationSystems
ACTUAL ACTUAL BUDGETED PROJECTED PROPOSED APPROVED ADOPTED2013-14 2014-15 2015-16 2015-16 2016-17 2016-17 2016-17
General Fund 199,711$ 233,495$ 300,500$ 287,100$ 288,000$ 288,000$ 288,000$ 64.9%Street Fund 10,457 11,086 20,700 19,800 12,900 12,900 12,900 2.9%PEG Fund 400 400 400 0.1%Community Center Fund 5,042 4,409 7,800 7,400 9,800 9,800 9,800 2.2%Sewer Fund 13,392 13,630 10,600 10,100 16,900 16,900 16,900 3.8%Water Fund 41,348 44,660 68,900 65,800 58,100 58,100 58,100 13.1%Street Light Districts Fund 1,099 832 1,000 1,000 1,300 1,300 1,300 0.3%Stormwater Fund 23,207 25,713 36,100 34,500 56,300 56,300 56,300 12.7%Urban Renewal Fund 4,659 2,126 - - - - - 0.0%Adjustments - - 100 - - - - 0.0%TOTAL CHARGES BY FUND 298,915$ 335,951$ 445,700$ 425,700$ 443,700$ 443,700$ 443,700$ 100.0%
Budget Notes:Expenditures:
9
23
27
Allocation
The decrease in Computer Hardware is the result of not needing to buy computers and servers during the current year as the computer and server upgrade project was completed in the prior year.
The Budget provides a 1.5% wage and salary increase for all non-represented staff. In addition step increases for those eligible as provided for in the City Personnel Policies. For additional information on employee benefits see the Summary of Fringe Benefits in the Supplemental Section.The increase in Computer Software & Maintenance is primarily for Public Works GIS, Eledata and Pitometry software for the Stormwater Fund.
SUMMARY OF FINANCE - INFORMATION SYSTEM CHARGES BY FUND
2013‐14 2014‐15 2015‐16 2015‐16 2016‐17 2016‐17 2016‐17
ACTUAL ACTUAL BUDGETED PROJECTED PROPOSED APPROVED ADOPTED
Urban Renewal Fund
Stormwater Fund
Street Light DistrictsFundWater Fund
Sewer Fund
Community Center Fund
112

ACTUAL ACTUAL BUDGETED PROJECTED PROPOSED APPROVED ADOPTED % CHANGE2013-14 2014-15 2015-16 2015-16 2016-17 2016-17 2016-17 FROM PROJ
1 RESOURCES:2 Beginning Balance: -$ -$ -$ -$ -$ -$ -$ 3 Revenues:4 Charges for Services:5 Administrative Service Charges - 350,344 400,200 396,600 414,500 414,500 414,500 5%6 TOTAL RESOURCES - 350,344 400,200 396,600 414,500 414,500 414,500 5%7 REQUIREMENTS:8 Expenditures:9 Personnel Services:10 Administrative Support - 168,555 179,200 179,200 183,800 183,800 183,800 3%11 Overtime - - - 500 500 500 500 0%12 Wellness - 286 1,600 800 1,600 1,600 1,600 100%13 Medicare - 2,590 2,800 2,800 2,900 2,900 2,900 4%14 Retirement - 20,906 32,900 32,900 33,800 33,800 33,800 3%15 Insurance Benefits - 59,938 77,300 77,300 82,400 82,400 82,400 7%16 Workers Compensation - 4,992 400 1,000 500 500 500 -50%17 Total Personnel Services - 257,267 294,200 294,500 305,500 305,500 305,500 4%18 Materials & Services:19 Postage & Printing - 53,708 52,000 52,000 53,500 53,500 53,500 3%20 Contractual Services - 39,328 52,000 50,000 53,500 53,500 53,500 7%21 Meetings, Travel & Training - 41 2,000 - 2,000 2,000 2,000 22 Total Materials & Services - 93,077 106,000 102,000 109,000 109,000 109,000 7%23 Total Expenditures - 350,344 400,200 396,500 414,500 414,500 414,500 5%24 Fund Balance:25 Committed for Operations - - - - - - - 26 Total Fund Balance - - - - - - - 27 TOTAL REQUIREMENTS -$ 350,344$ 400,200$ 396,500$ 414,500$ 414,500$ 414,500$ 5%
Utility Billing operates and maintains the billing function for the City’s water, sewer, and stormwater utilities. The City bills active accounts bi-monthly, billing one-half of the City one month and alternating billing the other half of the City the following month. Emphasis is on excellence in customer service by addressing needs and concerns with a caring attitude on a consistent basis.Costs are allocated based on effort expended in managing the separate elements of the utility accounts; 47% sewer, 43% water and 10% stormwater. Allocation of costs is authorized by Council Resolution.
*Note: The Finance - Utility Billing unit was a new cost center beginning FY14-15. These costs were previously accounted for directly in the Public Works funds referenced above.
Finance‐UtilityBilling
113

Finance‐UtilityBilling
ACTUAL ACTUAL BUDGETED PROJECTED PROPOSED APPROVED ADOPTED
2013-14 2014-15 2015-16 2015-16 2016-17 2016-17 2016-17
Sewer Fund -$ 164,662$ 188,100$ 186,400$ 194,800$ 194,800$ 194,800$ 47%Water Fund - 150,648 172,100 170,500 178,200 178,200 178,200 43%Stormwater Fund - 35,034 40,000 39,700 41,500 41,500 41,500 10%Adjustments - - - - - - - TOTAL CHARGES BY FUND -$ 350,344$ 400,200$ 396,600$ 414,500$ 414,500$ 414,500$ 100%
Budget Notes:
Expenditures:9
20For additional information on employee benefits see the Summary of Fringe Benefits in the Supplemental Section.Contractual services are primarily for credit card fee charges.
The Utility Billing function was previously budgeted proportionately to the Sewer, Water and Stormwater funds. These costs have been compiled and moved to the Administrative Services Fund to better track the costs of utility billing.
The Budget provides a 1.5% salary increase for all non-represented staff. In addition step increases for those eligible as provided for in the City Personnel Policies.
SUMMARY OF FINANCE - UTILITY BILLING CHARGES BY FUND
Utility Account
Allocation
2013‐14 2014‐15 2015‐16 2015‐16 2016‐17 2016‐17 2016‐17
ACTUAL ACTUAL BUDGETED PROJECTED PROPOSED APPROVED ADOPTED
StormwaterFund
Water Fund
Sewer Fund
114

ACTUAL ACTUAL BUDGETED PROJECTED PROPOSED APPROVED ADOPTED % CHANGE2013-14 2014-15 2015-16 2015-16 2016-17 2016-17 2016-17 FROM PROJ
1 RESOURCES:2 Beginning Balance: -$ -$ -$ -$ -$ -$ -$ 3 Revenues: 4 Charges for Services: 5 Administrative Service Charges - 500,743 553,500 547,200 533,200 533,200 533,200 -3%6 TOTAL RESOURCES - 500,743 553,500 547,200 533,200 533,200 533,200 -3%7 REQUIREMENTS:8 Expenditures:9 Personnel Services:10 Public Works Director - 107,929 112,500 112,500 117,600 117,600 117,600 5%11 Municipal Utility Workers - 151,699 154,700 154,700 158,600 158,600 158,600 3%12 Administrative Support - 51,349 53,700 53,700 54,500 54,500 54,500 1%13 Cell Phone and Clothing Stipend - 2,120 2,200 2,400 2,700 2,700 2,700 13%14 Wellness - 547 1,400 1,000 1,600 1,600 1,600 60%15 Medicare - 4,768 5,900 5,100 5,100 5,100 5,100 0%16 Retirement - 44,293 58,100 58,100 61,000 61,000 61,000 5%17 Insurance Benefits - 85,679 77,300 77,300 82,400 82,400 82,400 7%18 Workers Compensation - 3,869 4,700 4,700 4,800 4,800 4,800 2%19 Total Personnel Services - 452,253 470,500 469,500 488,300 488,300 488,300 4%20 Materials & Services:21 Shop Operations and Supplies - 12,363 10,500 9,700 10,500 10,500 10,500 8%22 Meetings, Travel & Training - 331 500 500 500 500 500 0%23 Public Notices - 56 - - - 24 Labor Attorney - 84 5,000 500 1,000 1,000 1,000 100%25 Janitorial Services - 4,846 5,000 5,000 5,000 5,000 5,000 0%26 Shop Utilities - 8,478 9,000 9,000 9,000 9,000 9,000 0%27 Telephone, Telemetry & Fire Alarm - 4,180 1,600 1,600 1,600 1,600 1,600 0%28 Insurance - Auto - 13,044 14,100 14,100 15,500 15,500 15,500 10%29 Operating Materials - 1,200 - - - - - 30 Medical Testing - 1,800 1,800 1,800 1,800 1,800 0%31 Total Materials & Services - 44,582 47,500 42,200 44,900 44,900 44,900 6%32 Capital Outlay:33 Shop Improvements - 3,825 35,500 35,500 - - - -100%34 Total Expenditures - 500,660 553,500 547,200 533,200 533,200 533,200 -3%35 Fund Balance:36 Committed for Operations - 83 - - - - - 37 Total Fund Balance - 83 - - - - - 38 TOTAL REQUIREMENTS -$ 500,743$ 553,500$ 547,200$ 533,200$ 533,200$ 533,200$ -3%
The Public Works Department is responsible for providing efficient and sound infrastructure, facilities, and services regarding the City’s transportation, water, wastewater, stormwater, parks and building and property management. These services are required year round and are fundamental in supporting the quality of life enjoyed by residents, businesses and visitors. The Public Works - Non Departmental cost center tracks costs shared by all Public Works funds and includes those staff costs for services provided to multiple funds.
Staff costs are allocated based on effort expended in managing and supporting each Public Works Division. Allocation of costs is authorized by Council Resolution.
*Note: The Public Works - Non-Departmental unit was a new cost center beginning FY14-15. These costs were previously accounted for directly in the Public Works operating funds including General Fund Parks, Street, Water, Sewer, Street Light Districts, and Stormwater.
PublicWorks‐Non‐Departmental
115
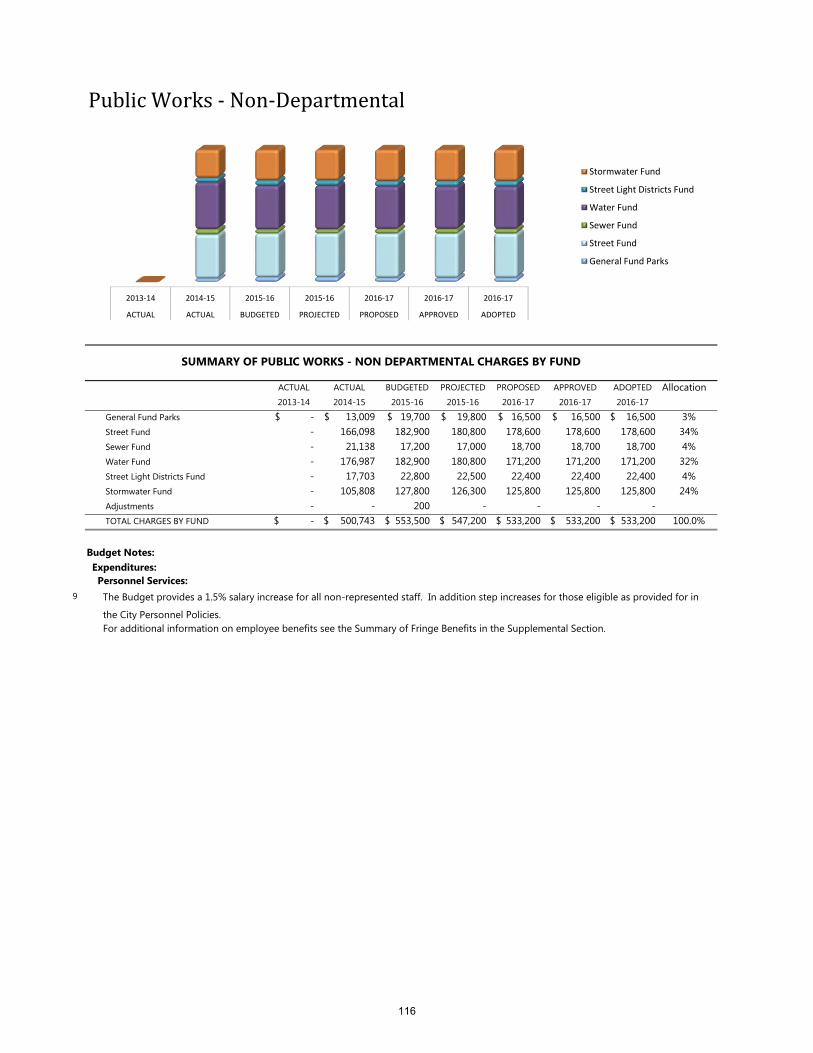
PublicWorks‐Non‐Departmental
ACTUAL ACTUAL BUDGETED PROJECTED PROPOSED APPROVED ADOPTED Allocation2013-14 2014-15 2015-16 2015-16 2016-17 2016-17 2016-17
General Fund Parks -$ 13,009$ 19,700$ 19,800$ 16,500$ 16,500$ 16,500$ 3%Street Fund - 166,098 182,900 180,800 178,600 178,600 178,600 34%Sewer Fund - 21,138 17,200 17,000 18,700 18,700 18,700 4%Water Fund - 176,987 182,900 180,800 171,200 171,200 171,200 32%Street Light Districts Fund - 17,703 22,800 22,500 22,400 22,400 22,400 4%Stormwater Fund - 105,808 127,800 126,300 125,800 125,800 125,800 24%Adjustments - - 200 - - - - TOTAL CHARGES BY FUND -$ 500,743$ 553,500$ 547,200$ 533,200$ 533,200$ 533,200$ 100.0%
Budget Notes:Expenditures:Personnel Services:
9 The Budget provides a 1.5% salary increase for all non-represented staff. In addition step increases for those eligible as provided for in the City Personnel Policies. For additional information on employee benefits see the Summary of Fringe Benefits in the Supplemental Section.
SUMMARY OF PUBLIC WORKS - NON DEPARTMENTAL CHARGES BY FUND
2013‐14 2014‐15 2015‐16 2015‐16 2016‐17 2016‐17 2016‐17
ACTUAL ACTUAL BUDGETED PROJECTED PROPOSED APPROVED ADOPTED
Stormwater Fund
Street Light Districts Fund
Water Fund
Sewer Fund
Street Fund
General Fund Parks
116

ACTUAL ACTUAL BUDGETED PROJECTED PROPOSED APPROVED ADOPTED % CHANGE2013-14 2014-15 2015-16 2015-16 2016-17 2016-17 2016-17 FROM PROJ
1 RESOURCES:2 Beginning Balance:3 Restricted for Civic Center Improvements 98,807$ 130,600$ 130,600$ 130,600$ 130,500$ 130,500$ 130,500$ 0%4 Unrestricted - - - - - - - 5 Total Beginning Balances 98,807 130,600 130,600 130,600 130,500 130,500 130,500 0%6 Revenues:7 Charges for Services:8 Administrative Service Charges 315,654 323,499 301,300 293,200 339,500 339,500 339,500 16%9 TOTAL RESOURCES 414,461 454,099 431,900 423,800 470,000 470,000 470,000 11%
10 REQUIREMENTS:11 Expenditures:12 Personnel Services:13 Municipal Utility Worker 3,682 5,557 5,900 5,900 6,200 6,200 6,200 5%14 Facility Maintenance Technician 39,651 41,864 43,700 43,700 45,700 45,700 45,700 5%15 Overtime - - 400 400 400 400 400 0%16 Clothing Allowance 400 440 500 500 500 500 500 0%17 Wellness 159 250 500 500 500 500 500 0%18 Medicare 675 740 800 800 800 800 800 0%19 Retirement 6,228 6,914 9,300 9,300 9,700 9,700 9,700 4%20 Insurance Benefits 17,211 18,806 21,300 21,300 22,700 22,700 22,700 7%21 Workers Compensation - 410 600 600 800 800 800 33%22 Unemployment Insurance 297 - - - - - - 23 Total Personnel Services 68,303 74,981 83,000 83,000 87,300 87,300 87,300 5%24 Materials & Services:25 Materials & Supplies 48 69 - - - - - 26 Contractual Services 9,202 7,214 9,600 9,600 9,600 9,600 9,600 0%27 Janitorial Services 59,637 60,226 62,000 62,000 62,000 62,000 62,000 0%28 Utilities 103,391 100,026 105,000 101,000 105,000 105,000 105,000 4%29 Equipment Maintenance & Replacement 10,565 59,125 25,000 25,000 25,000 25,000 25,000 0%30 Maintenance Supplies 5,656 5,290 8,000 5,300 6,000 6,000 6,000 13%31 Janitorial Supplies 6,237 2,700 4,500 4,500 4,500 4,500 4,500 0%32 Total Materials & Services 194,736 234,650 214,100 207,400 212,100 212,100 212,100 2%33 Capital Outlay:34 Civic Center Improvements 20,822 13,853 2,700 2,900 28,600 28,600 28,600 886%35 Total Expenditures 283,861 323,484 299,800 293,300 328,000 328,000 328,000 12%36 Other Requirements:37 Contingency:38 Operating Contingency - - 1,500 - 1,500 1,500 1,500 39 Civic Center Improvements - - 130,500 - 140,500 140,500 140,500 40 Total Contingency - - 132,000 - 142,000 142,000 142,000
The Civic Center Facility Fund accounts for operations and maintenance of the Civic Center. Facility Maintenance staff will continue to maintain the facility at a level that allows maximum efficiency of all staff. The Facility Maintenance staff will continue refining the programming of the HVAC units for the changing seasons as well as the lighting system in an efficient manner. General and preventive maintenance of the 68,000 sq. ft. building and 4.5 acres of exterior grounds will continue to be addressed throughout the year.
Costs are allocated based on FTE allocations charged to each operating fund as authorized by Council Resolution.
PublicWorks‐CivicCenterFacilities
117

PublicWorks‐CivicCenterFacilities
ACTUAL ACTUAL BUDGETED PROJECTED PROPOSED APPROVED ADOPTED % CHANGE2013-14 2014-15 2015-16 2015-16 2016-17 2016-17 2016-17 FROM PROJ
41 Fund Balance:42 Committed for Civic Center Improvements 130,600 130,615 - 130,500 - - - -100%43 Committed for Operations - - - - - - - 44 Total Fund Balance 130,600 130,615 - 130,500 - - - -100%45 TOTAL REQUIREMENTS 414,461$ 454,099$ 431,800$ 423,800$ 470,000$ 470,000$ 470,000$ 11%
ACTUAL ACTUAL BUDGETED PROJECTED PROPOSED APPROVED ADOPTED2013-14 2014-15 2015-16 2015-16 2016-17 2016-17 2016-17
General Fund 204,941$ 213,039$ 204,100$ 198,500$ 223,000$ 223,000$ 223,000$ 65.7%Street Fund 11,821 12,875 10,400 10,100 12,600 12,600 12,600 3.7%PEG Fund - - - - 300 300 300 0.1%Community Center Fund 6,612 3,899 3,500 3,400 4,100 4,100 4,100 1.2%Sewer Fund 8,844 8,907 8,500 8,300 10,500 10,500 10,500 3.1%Water Fund 49,055 50,739 45,400 44,200 54,000 54,000 54,000 15.9%Street Light Districts Fund 1,009 929 900 900 1,000 1,000 1,000 0.3%Stormwater Fund 30,539 31,686 28,600 27,800 34,000 34,000 34,000 10.0%Urban Renewal Fund 2,833 1,425 - - - - - 0.0%Adjustments - - (100) - - - - TOTAL CHARGES BY FUND 315,654$ 323,499$ 301,300$ 293,200$ 339,500$ 339,500$ 339,500$ 100.0%
Budget Notes: .Expenditures:
Personnel Services:12
Materials & Services:2629
Capital Outlay:34
PUBLIC WORKS - SUMMARY OF FACILITY MAINTENANCE CHARGES BY FUND
The Budget provides a 1.5% wage and salary increase for all non-represented staff. In addition step increases for those eligible as provided for in the City Personnel Policies.
Contractual services includes $2,000 for bark blown in around Civic Center.
For additional information on employee benefits see the Summary of Fringe Benefits in the Supplemental Section.
FTE
Equipment Maintenance & Replacement costs include lighting ballast replacements.
Civic Center Improvements includes replacing the A/C unit for the main server room, bird netting for the Police covered parking area, upgrading the control system for the lobby speakers, and purchase of a Gator type unit for maintaining the grounds around the Civic Center.
2013‐14ACTUAL
2014‐15ACTUAL
2015‐16BUDGETED
2015‐16PROJECTED
2016‐17PROPOSED
2016‐17APPROVED
2016‐17ADOPTED
Urban Renewal Fund
Stormwater Fund
Street Light DistrictsFundWater Fund
Sewer Fund
Community Center Fund
118

ACTUAL ACTUAL BUDGETED PROJECTED PROPOSED APPROVED ADOPTED % CHANGE2013-14 2014-15 2015-16 2015-16 2016-17 2016-17 2016-17 FROM PROJ
1 RESOURCES:2 Beginning Balance: 6,550$ 6$ -$ 30,100$ 100$ 100$ 100$ -100%3 Revenues:4 Charges for Services:5 Administrative Service Charges 254,756 235,080 310,800 228,100 338,200 338,200 338,200 48%6 Miscellaneous:7 Interest 1,988 26,579 - - - - - 8 TOTAL RESOURCES 263,294 261,665 310,800 258,200 338,300 338,300 338,300 31%9 REQUIREMENTS:10 Expenditures:11 Materials & Services:12 Office Materials & Supplies 17,616 27,036 27,000 28,000 28,000 28,000 28,000 0%13 Postage & Printing 20,561 18,276 25,200 20,000 30,000 30,000 30,000 50%14 Association Memberships 48,241 50,526 51,000 52,000 53,000 53,000 53,000 2%15 City Council Expenses 4,857 9,715 9,000 9,000 9,000 9,000 9,000 0%16 Committee Meeting Expense 249 354 500 500 500 500 500 0%17 Public Notices 722 962 1,000 1,000 1,000 1,000 1,000 0%18 Contractual Services 895 669 1,100 1,100 1,200 1,200 1,200 9%19 Liability Insurance 169,616 123,680 146,000 146,000 145,000 145,000 145,000 -1%20 Miscellaneous Expense 531 462 500 500 500 500 500 0%21 Total Materials & Services 263,288 231,680 261,300 258,100 268,200 268,200 268,200 4%22 Total Expenditures 263,288 231,680 261,300 258,100 268,200 268,200 268,200 4%23 Other Requirements: - 24 Contingency: - 25 Liability Retro Plan - - 49,500 - 70,000 70,000 70,000 26 Fund Balance: - 27 Committed for Operations 6 29,985 - 100 100 100 100 0%28 TOTAL REQUIREMENTS 263,294$ 261,665$ 310,800$ 258,200$ 338,300$ 338,300$ 338,300$ 31%
General Administration tracks City-Wide shared costs. Costs are charged to each operating fund based on the full-time equivalents (FTE) of that fund as authorized in Council Resolution.
GeneralAdministration
119

GeneralAdministration
ACTUAL ACTUAL BUDGETED PROJECTED PROPOSED APPROVED ADOPTED2013-14 2014-15 2015-16 2015-16 2016-17 2016-17 2016-17
General Fund 151,404$ 152,572$ 210,500$ 154,400$ 222,200$ 222,200$ 222,200$ 65.7%Street Fund 11,035 9,221 10,800 7,900 12,500 12,500 12,500 3.7%PEG Fund 300 300 300 0.1%Community Center Fund 6,172 2,792 3,600 2,600 4,100 4,100 4,100 1.2%Sewer Fund 8,256 6,379 8,800 6,500 10,500 10,500 10,500 3.1%Water Fund 45,794 36,338 46,800 34,300 53,800 53,800 53,800 15.9%Street Light Districts Fund 941 666 900 700 1,000 1,000 1,000 0.3%Stormwater Fund 28,509 22,692 29,500 21,700 33,800 33,800 33,800 10.0%Urban Renewal Fund 2,645 1,021 - - - - - 0.0%Adjustments - - (100) - - - 0.0%TOTAL CHARGES BY FUND 254,756$ 231,681$ 310,800$ 228,100$ 338,200$ 338,200$ 338,200$ 100.0%
FTE
SUMMARY OF CITY-WIDE ADMINISTRATIVE CHARGES BY FUND
2013‐14 2014‐15 2015‐16 2015‐16 2016‐17 2016‐17 2016‐17
ACTUAL ACTUAL BUDGETED PROJECTED PROPOSED APPROVED ADOPTED
Urban Renewal Fund
Stormwater Fund
Street Light DistrictsFundWater Fund
Sewer Fund
Community Center Fund
120

GeneralAdministrationBudget Notes:
Expenditures:1314
15
18
19
25 As explained in the Liability Insurance line item, the City's risk exposure for participating in the "Retro Plan" equates to 37.5% of the premiums paid on General and Auto liability. Premiums paid on property and auto damage are not part of the "Retro Plan".
The City's Liability Insurance is expected to increase 9%. Premiums cover, Property, General and Auto liability. The City participates in a "Retro Plan" agreement on its General and Auto liability insurance premiums. Under this plan, premium contributions are 75% of the base premium amount with a maximum exposure of 112.5%. Because of the City's good claims loss experience it saves money by participating in this plan, although it does assume additional risk. Auto insurance premiums are paid from the Police Operating budget and Public Works budgets. FY16-17 projections expect premium rates to increase 9% over FY15-16. Liability insurance includes insuring art pieces included as part of the City's Art Walk Program. The premium is estimated at $750 annually. The deductibles are based on the value. If the value of the art is $7,500 or under, the City's deductible is $2,500. If the value is over $7,500, the deductible is $5,000. Deductibles will be paid from General Fund resources.
Contractual Services include the ASCAP and BMI licenses. American Society of Composers, Authors & Publishers (ASCAP ) licenses the right to perform songs and musical works created and owned by publishers who are ASCAP members. Broadcast Music, Inc. (BMI), a global leader in rights management, collects license fees from businesses that use music, which it distributes as royalties to songwriters, composers & music publishers. Licenses apply to the City's on-hold telephone music and Amphitheater performances.
Funding provides for 5 council members to attend the fall League of Oregon Cities conference and the Mayor to attend the annual Mayor's Association Conference.
The increase in Postage and Printing is to provide for a citizen survey.Association Memberships include organizations such as the Council of Governments, League of Oregon Cities, Chamber of Commerce, & local newspaper subscriptions.
121

Accomplishments for FY15-16·
·
·
·
·
Goals for FY16-17·
·
·
·
·
ACTUAL ACTUAL BUDGETED PROJECTED PROPOSED APPROVED ADOPTED % CHANGE2013-14 2014-15 2015-16 2015-16 2016-17 2016-17 2016-17 FROM PROJ
1 RESOURCES:2 Beginning Balance:3 Unrestricted Beginning Balance 1,440,562$ 1,189,868$ 1,126,600$ 1,260,800$ 1,224,900$ 1,224,900$ 1,224,900$ -3%4 Bike Safety Donations 1,738 1,272 - - - - 5 Total Beginning Balances 1,442,300 1,191,140 1,126,600 1,260,800 1,224,900 1,224,900 1,224,900 -3%6 Revenues:7 Taxes & Assessments:8 Assessments 2,007 3,696 - - - - - 9 Licenses & Fees:
10 Planning Construction Fees 16,768 19,096 7,500 53,000 7,500 7,500 7,500 -86%11 Driveway Permit Fees 4,410 7,140 4,600 6,500 4,600 4,600 4,600 -29%12 Total Licenses & Fees 21,178 26,236 12,100 59,500 12,100 12,100 12,100 -80%13 Intergovernmental:14 Grants 393 - - - - - - 15 State Fuel Tax 2,100,979 2,131,377 2,100,000 2,150,000 2,161,000 2,161,000 2,161,000 1%16 Total Intergovernmental 2,101,372 2,131,377 2,100,000 2,150,000 2,161,000 2,161,000 2,161,000 1%17 Miscellaneous:18 Bike Safety Donations 359 236 - 500 - - - -100%19 Assessment Interest 178 169 - - - - - 20 Interest 2,449 2,054 1,500 1,500 1,500 1,500 1,500 0%21 Miscellaneous Revenue 1,058 4,671 - - - - - 22 Total Miscellaneous 4,044 7,129 1,500 2,000 1,500 1,500 1,500 -25%23 Other Revenue Sources:24 Loan - - - - 175,000 175,000 175,000 23 TOTAL RESOURCES 3,570,901 3,359,577 3,240,200 3,472,300 3,574,500 3,574,500 3,574,500 3%
PublicWorks
StreetFundThe Street Fund is managed by the Public Works Department to provide quality streets, lighting, traffic signals, sidewalks, and bike paths. The primary source of revenue is State Fuel Taxes, which are apportioned by the State based on population. Fuel tax revenues are restricted by constitutional limits and are to be used for street maintenance and improvements (Const. IX § 3). The Street Fund’s share of drainage system maintenance and repair costs is an annual assessment of Stormwater fees. The City currently contracts striping services with Marion County. Traffic Signal System operation and maintenance is contracted with the City of Salem.
Complete design, obtain permits, and begin construction of the bridge replacement over Claggett Creek on Dearborn Avenue NE
Resurfaced approximately 2.4 miles of city streetsRevised sign replacement program
Completed citywide traffic count update
Updated ADA ramps at 12 locationsReplaced pathway lighting to Country Glen
CompletE the Verda/Chemawa Roundabout projectContinue the ADA ramp replacement programMaintain the street sign replacement programContinue annual resurfacing of various City streets
Personnel Services
5%Materials
& Services
29%Capital Outlay66%
122

PublicWorks
StreetFundACTUAL ACTUAL BUDGETED PROJECTED PROPOSED APPROVED ADOPTED % CHANGE2013-14 2014-15 2015-16 2015-16 2016-17 2016-17 2016-17 FROM PROJ
24 REQUIREMENTS:25 Expenditures:26 Personnel Services:27 Public Works Director 40,891 - - - - - - 28 Municipal Utility Workers 84,199 43,752 48,600 48,600 50,800 50,800 50,800 5%29 Community Development Director 11,849 12,146 12,300 12,300 12,500 12,500 12,500 2%30 Code Compliance Officer - - 7,000 7,000 7,200 7,200 7,200 3%31 Administrative Support 20,956 - - - - - - 32 Overtime 3,159 5,235 5,200 3,000 5,200 5,200 5,200 73%33 Parade Overtime - - 2,200 1,900 1,100 1,100 1,100 -42%34 Duty Pay 6,525 7,835 7,800 7,800 7,800 7,800 7,800 0%35 Clothing Allowance/Cell Phone Stipend 1,187 490 700 300 500 500 500 67%36 Wellness 154 14 500 500 500 500 500 0%37 Medicare 2,575 1,067 1,200 1,200 1,300 1,300 1,300 8%38 Retirement 24,348 11,088 16,900 16,900 16,900 16,900 16,900 0%39 Insurance Benefits 46,507 21,795 24,200 24,200 27,800 27,800 27,800 15%40 Workers Compensation 1,572 1,494 1,400 1,400 1,500 1,500 1,500 7%41 Total Personnel Services 243,922 104,917 128,000 125,100 133,100 133,100 133,100 6%42 Materials & Services:43 Helmets 825 - 1,200 1,200 - - - -100%44 Postage & Printing 25 - - - - - - 45 Meetings, Travel & Training 998 1,149 1,500 1,000 1,500 1,500 1,500 50%46 Public Notices - - 500 500 500 500 500 0%47 Labor Attorney 126 - - - - - - 48 Administrative Services Charges 107,227 286,330 311,600 303,100 313,900 313,900 313,900 4%49 Contractual Services 59,037 95,074 139,000 120,000 123,000 123,000 123,000 3%50 Parade Traffic Control 2,358 1,059 2,700 2,700 2,700 2,700 2,700 0%51 Engineering Services 26,863 13,298 25,000 25,000 50,000 50,000 50,000 100%52 Traffic Engineering SDC Review - 7,624 5,000 - 5,000 5,000 5,000 53 Janitorial 472 (3) - - - - - 54 Utilities 1,288 - - 200 300 300 300 50%55 Telephone 882 523 - - - - - 56 Auto Insurance 427 - - - - - - 57 Gasoline/Diesel 2,894 2,650 2,500 2,500 2,500 2,500 2,500 0%58 Equipment Maintenance 3,318 815 5,000 1,000 5,000 5,000 5,000 400%59 Sidewalk Maintenance 1,550 125 5,000 7,400 5,000 5,000 5,000 -32%60 Operating Materials and Supplies 10,715 9,316 15,000 15,000 15,000 15,000 15,000 0%61 Street Maintenance & Repair 104,122 89,989 155,000 155,000 155,000 155,000 155,000 0%62 Street Light Utilities 68,003 57,665 65,000 54,000 60,000 60,000 60,000 11%63 Traffic Light Utilities 22,929 24,326 28,000 25,000 28,000 28,000 28,000 12%64 Medical Testing 193 274 200 200 200 200 200 0%65 Rental Property Expenses 799 - 500 - - - - 66 MPO Support/ SKATS 6,969 9,863 9,900 9,900 9,900 9,900 9,900 0%67 Total Materials & Services 422,020 600,077 772,600 723,700 777,500 777,500 777,500 7%
123

PublicWorks
StreetFundACTUAL ACTUAL BUDGETED PROJECTED PROPOSED APPROVED ADOPTED % CHANGE2013-14 2014-15 2015-16 2015-16 2016-17 2016-17 2016-17 FROM PROJ
68 Capital Outlay:69 Heavy Equipment/Vehicles 7,678 26,080 - - 1,300 1,300 1,300 70 Street Improvements 74,675 501,797 300,000 175,000 675,000 675,000 675,000 286%71 Infill and ADA Sidewalk Completions 26,952 25,150 25,000 25,000 25,000 25,000 25,000 0%72 Street Resurfacing 631,106 497,910 800,000 825,000 800,000 800,000 800,000 -3%73 Signage & Signal Upgrades 62,691 - 20,000 - 20,000 20,000 20,000 74 Field Equipment - 1,547 1,100 1,100 5,400 5,400 5,400 391%75 Area B Development Costs - - 45,000 - 45,000 45,000 45,000 76 Unanticipated Expense - - 119,100 - 157,200 157,200 157,200 77 Total Capital Outlay 803,102 1,052,484 1,310,200 1,026,100 1,728,900 1,728,900 1,728,900 68%78 Debt Service:79 Principal 594,000 - - - - - - 80 Interest 6,080 - - - - - - 81 Total Debt Service 600,080 - - - - - - 82 Total Expenditures 2,069,124 1,757,478 2,210,800 1,874,900 2,639,500 2,639,500 2,639,500 41%83 Other Requirements:84 Contingency: - 85 Operating Contingency - - 45,300 - 45,500 45,500 45,500 86 Transfers Out: - 87 Stormwater Fund 310,637 341,300 372,500 372,500 406,400 406,400 406,400 9%88 Fund Balance:89 Restricted Property Sales Proceeds 143,100 143,100 143,100 - 143,100 143,100 143,100 90 Restricted for Street Improvements - - 50,000 - 50,000 50,000 50,000 91 Restricted for Operations 1,048,040 1,117,700 418,500 1,224,900 290,000 290,000 290,000 -76%92 Total Fund Balance 1,191,140 1,260,800 611,600 1,224,900 483,100 483,100 483,100 -61%93 TOTAL REQUIREMENTS 3,570,901$ 3,359,577$ 3,240,200$ 3,472,300$ 3,574,500$ 3,574,500$ 3,574,500$ 3%
124

PublicWorks
StreetFund
ACTUAL ACTUAL BUDGETED PROJECTED PROPOSED APPROVED ADOPTED % CHANGE2013-14 2014-15 2015-16 2015-16 2016-17 2016-17 2016-17 FROM PROJ
City-Wide Administration 11,035$ 9,221$ 10,800$ 7,900$ 12,500$ 12,500$ 12,500$ 58%City Manager 9,283 10,170 11,900 11,900 13,500 13,500 13,500 13%Information Systems 10,457 11,086 20,700 19,800 12,900 12,900 12,900 -35%Attorney's Office 13,360 14,628 20,900 20,500 24,300 24,300 24,300 19%City Recorder 9,037 9,880 11,900 11,900 13,900 13,900 13,900 17%Human Resources 9,430 10,851 10,100 10,100 11,200 11,200 11,200 11%Finance 32,763 41,521 32,000 30,100 34,400 34,400 34,400 14%Facility Maintenance 11,821 12,875 10,400 10,100 12,600 12,600 12,600 25%Public Works - 166,098 182,900 180,800 178,600 178,600 178,600 -1%Adjustments 41 - - - - - - Administrative Services Charges 107,227$ 286,330$ 311,600$ 303,100$ 313,900$ 313,900$ 313,900$ 4%
Budget Notes:Revenues:
15
Expenditures:Personnel Services:
26
2728
31
Materials & Services:47
48
50
53
54
55
56
Capital Outlay:70
7385
86
The Budget provides a 1.5% and a 2.0% wage and salary increase for all non-represented and represented staff, respectively. In addition step increases for those eligible as provided for in the Union Contract and City Personnel Policies.
Summary of Administrative Service Fund Charges
Signage upgrades are to replace protective and permissive left turn signal heads on River Road.The contingency is 5% of operating costs including personnel services and materials and services.
For additional information on employee benefits see the Summary of Fringe Benefits in the Supplemental Section.
The Public Works Director, one Municipal Utility Worker and the Administrative Service positions are budgeted in the Public Works section of the Administrative Services Fund and costs are charged back to the Street Fund based on estimated time spent in the Division.
Labor Attorney Costs are included in the Public Works Administrative Services Fund.
The League of Oregon Cities notes that state highway shared revenues are projecting a 0.5% increase next year. The League also noted that in recent years state projections have exceeded actual revenues.
The transfer to the Stormwater Fund is the Street Fund's share of stormwater costs. The Stormwater Fund rate slope provides for a $0.50 per ESU rate increase effective January 1, 2017.
Street Improvements include design, permit fees, and intial construction to replace the bridge over Claggett Creek on Dearborn Ave NE.
Janitorial, utilities, telephone and auto insurance costs have been moved to the Public Works Administration Fund.
Contractual Services include $75,000 for pavement markings, $48,000 for routine costs such as landscape maintenance and right of way mowing.
Administrative Service Charges increased primarily due to personnel service increases associated with salary and wage, retirement and insurance expenses.
125

ACTUAL ACTUAL BUDGETED PROJECTED PROPOSED APPROVED ADOPTED % CHANGE
2013-14 2014-15 2015-16 2015-16 2016-17 2016-17 2016-17 FROM PROJ1 RESOURCES:2 Beginning Balance: 294,651$ 305,847$ 346,500$ 414,700$ 369,600$ 369,600$ 369,600$ -11%3 Revenues:4 Taxes & Assessments:5 Lighting District Assessments 413,282 450,398 305,000 318,000 411,200 411,200 411,200 29%6 Miscellaneous:7 Interest Earnings/Miscellaneous 7,426 70,662 7,000 7,000 7,000 7,000 7,000 0%8 Transfers:9 Transfer from Sewer Fund 32,900 - 55,600 55,600 - - - 10 Total Revenues 453,608 521,060 367,600 380,600 418,200 418,200 418,200 10%11 TOTAL RESOURCES 748,259 826,907 714,100 795,300 787,800 787,800 787,800 -1%12 REQUIREMENTS:13 Expenditures:14 Personnel Services:15 Public Works Director 5,111 - - - - - - 16 Administrative Support Staff 4,874 - - - - - - 17 Cell Phone Stipend 66 - - - - - - 18 Wellness 14 - - - - - - 19 Medicare 152 - - - - - - 20 Retirement 1,233 - - - - - - 21 Insurance Benefits 3,094 - - - - - - 22 Workers Compensation 128 - - - - - - 23 Total Personnel Services 14,672 - - - - - - 24 Materials & Services:25 Public Notices 566 670 800 800 800 800 800 0%26 Administrative Services Charges 13,753 28,322 35,900 34,900 37,100 37,100 37,100 6%27 Engineering Costs 1,929 1,061 3,000 3,000 3,000 3,000 3,000 0%28 Lighting Costs 409,884 375,289 416,500 385,000 405,000 405,000 405,000 5%29 Street Lighting Maintenance - KS Area A 1,608 5,651 2,000 2,000 2,000 2,000 2,000 0%30 Miscellaneous Expense - 1,197 - - - - - 31 Total Materials & Services 427,740 412,190 458,200 425,700 447,900 447,900 447,900 5%32 Total Expenditures 442,412 412,190 458,200 425,700 447,900 447,900 447,900 5%33 Other Requirements:34 Contingency - - 23,000 - 25,000 25,000 25,000 35 Fund Balance:36 Restricted:37 Pole Replacement at KS Area A - 31,200 31,200 31,200 31,200 31,200 31,200 0%38 Pole Replacement Option B Districts - - - - 10,000 10,000 10,000 39 Restricted for Operations 305,847 383,518 201,700 338,400 273,700 273,700 273,700 40 Total Restricted Fund Balance 305,847 414,718 232,900 369,600 314,900 314,900 314,900 41 TOTAL REQUIREMENTS 748,259$ 826,907$ 714,100$ 795,300$ 787,800$ 787,800$ 787,800$ -1%
PublicWorks
StreetLightingDistrictFund
The Street Lighting District Fund accounts for the Street Lighting Districts and Local Improvement Districts from establishment and construction, through billing and recording the liens with the county tax collector. The City has approximately 200 Lighting Districts. The City Recorder Department, the Finance Department and the Public Works Department share the responsibility for managing the activities in this fund.
126

PublicWorks
StreetLightingDistrictFund
ACTUAL ACTUAL BUDGETED PROJECTED PROPOSED APPROVED ADOPTED % CHANGE2013-14 2014-15 2015-16 2015-16 2016-17 2016-17 2016-17 FROM PROJ
City-Wide Administration 941$ 666$ 900$ 700$ 1,000$ 1,000$ 1,000$ 43%City Manager 799 365 600 600 700 700 700 17%Information Systems 1,099 832 1,000 1,000 1,300 1,300 1,300 30%Attorney's Office 1,279 152 600 600 900 900 900 50%City Recorder 826 354 600 600 700 700 700 17%Human Resources 804 783 800 800 900 900 900 13%Finance 7,007 6,539 7,700 7,200 8,200 8,200 8,200 14%Facility Maintenance 1,009 929 900 900 1,000 1,000 1,000 11%Public Works - 17,703 22,800 22,500 22,400 22,400 22,400 0%Adjustments (11) (1) - - - - - Administrative Services Charges 13,753$ 28,322$ 35,900$ 34,900$ 37,100$ 37,100$ 37,100$ 6%
Budget Notes:Revenues:
5
9
Expenditures:14
26
28
The transfer from the Sewer Fund is to transfer electricity rebates previously recorded in the Sewer fund to the Street Lighting District where the electricity expenditures were recorded. The credits will reduce future assessment amounts for Salem Electric customers.
The City is expecting two additional street lighting districts to form in FY2016-17.
The Street Lighting District Fund operates on a reimbursement basis. Electricity is paid in Year One and assessed on the tax rolls in Year Two. The decrease in Lighting District Assessments is due to applying electricity rebate credits received during
Personnel service costs were for various Public Works staff time spent on Street Lighting District issues. These costs have been moved to the Public Works Administrative Services fund and are charged back to the Street Lighting District Fund.Administrative Service Charges increased primarily due to personnel service increases associated with salary and wage, retirement and insurance expenses.
Summary of Administrative Service Fund Charges
127

ACTUAL ACTUAL BUDGETED PROJECTED PROPOSED APPROVED ADOPTED % CHANGE2013-14 2014-15 2015-16 2015-16 2016-17 2016-17 2016-17 FROM PROJ
1 RESOURCES:2 Beginning Balance: 1,980,235$ 2,175,283$ 2,369,900$ 2,416,400$ 2,639,600$ 2,639,600$ 2,639,600$ 9%3 Revenues:4 Licenses & Fees:5 System Development Fees 162,448 236,101 216,900 218,700 65,700 65,700 65,700 -70%6 Miscellaneous:7 Interest 5,894 4,979 4,500 4,500 4,500 4,500 4,500 0%8 Total Revenues 168,342 241,080 221,400 223,200 70,200 70,200 70,200 -69%9 Other Resources:10 Sewer Reserve Fund Loan Repayment 26,706 - - - - - - 11 Total Other Resources 26,706 - - - - - - 12 TOTAL RESOURCES 2,175,283 2,416,363 2,591,300 2,639,600 2,709,800 2,709,800 2,709,800 3%13 REQUIREMENTS:14 Expenditures:15 Capital Outlay:16 Improvements - - 450,000 - 450,000 450,000 450,000 17 Unanticipated Expenses - - 1,750,000 - 2,000,000 2,000,000 2,000,000 18 Total Capital Outlay - - 2,200,000 - 2,450,000 2,450,000 2,450,000 19 Total Expenditures20 Fund Balance:21 Restricted for Improvements 2,175,283 2,416,363 391,300 2,639,600 259,800 259,800 259,800 -90%22 TOTAL REQUIREMENTS 2,175,283$ 2,416,363$ 2,591,300$ 2,639,600$ 2,709,800$ 2,709,800$ 2,709,800$ 3%
Revenues:5 The System Development Fee projections for FY16-17 assume 50 new single family homes developed during the year.
Expenditures:16 Improvement costs are for engineering design for the I-5 Chemawa southbound on-ramp.
PublicWorks
TransportationImprovementFund
The Transportation Improvement Fund accounts for system development fees (SDC) designated for transportation improvements resulting from development. The fee varies depending on the land use being developed and the location of the development. The fees are adjusted each July using a blended rate of the Northwest Construction index and the change in undeveloped land values in the Keizer area. These fees can be located on the City’s web site.
Recommendations for expenditures in FY16-17:Begin Engineering design for the improvements to the I-5/Chemawa Southbound on-ramp. ODOT is currently taking the lead planning and designing these improvements. Estimated cost includes the City’s share of permits and project management.
128

ACTUAL ACTUAL BUDGETED PROJECTED PROPOSED APPROVED ADOPTED % CHANGE2013-14 2014-15 2015-16 2015-16 2016-17 2016-17 2016-17 FROM PROJ
1 RESOURCES:2 Beginning Balance: 52,754$ 52,903$ 53,000$ 53,000$ 123,400$ 123,400$ 123,400$ 133%3 Revenues:4 Licenses & Fees:5 Off-Site Transportation Fees - - 45,500 70,400 - - - -100%6 Miscellaneous:7 Interest 149 114 - - - - - 8 Total Revenues 149 114 - - - - - 9 TOTAL RESOURCES 52,903 53,017 98,500 123,400 123,400 123,400 123,400 0%
10 REQUIREMENTS:11 Expenditures:12 Capital Outlay:13 Off-Site Transportation Improvements - - 98,500 - 123,400 123,400 123,400 14 Fund Balance:15 Restricted for Improvements 52,903 53,017 - 123,400 - - - -100%16 TOTAL REQUIREMENTS 52,903$ 53,017$ 98,500$ 123,400$ 123,400$ 123,400$ 123,400$ 0%
Budget Notes:Revenues:
5Expenditures:
13
The Off-Site Transportation Fund was created for future transportation improvement projects in connection with Keizer Station Areas B and C. The resources are from developer fees required to be paid as set forth in the Keizer Station Master Plan orders.
Off‐SiteTransportationImprovementFund
Off-Site Transportation Fees are charges on developers in lieu of constructing certain transportation improvements.
PublicWorks
Off-Site Transportation Improvements are projects that are identified in the Keizer Station Area B and C master plan orders.
129
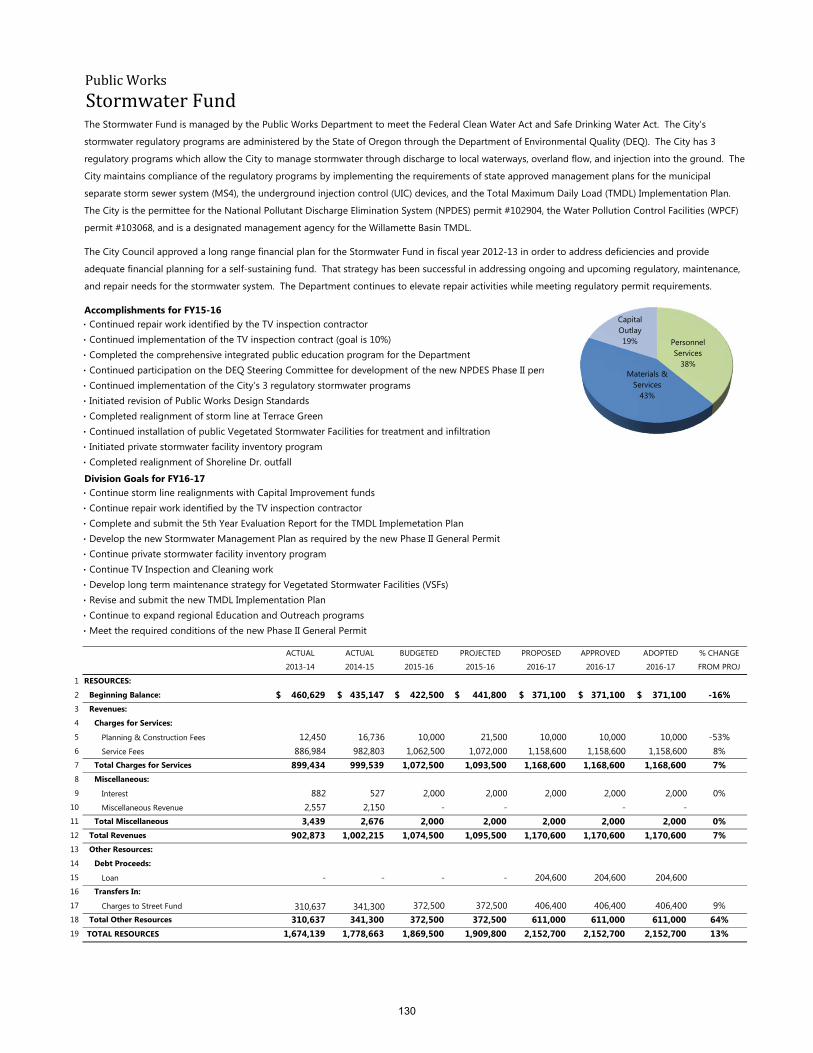
Accomplishments for FY15-16·
·
·
·
·
·
·
·
·
·
Division Goals for FY16-17·
·
·
·
·
·
·
·
·
·
ACTUAL ACTUAL BUDGETED PROJECTED PROPOSED APPROVED ADOPTED % CHANGE2013-14 2014-15 2015-16 2015-16 2016-17 2016-17 2016-17 FROM PROJ
1 RESOURCES:2 Beginning Balance: 460,629$ 435,147$ 422,500$ 441,800$ 371,100$ 371,100$ 371,100$ -16%3 Revenues:4 Charges for Services:5 Planning & Construction Fees 12,450 16,736 10,000 21,500 10,000 10,000 10,000 -53%6 Service Fees 886,984 982,803 1,062,500 1,072,000 1,158,600 1,158,600 1,158,600 8%7 Total Charges for Services 899,434 999,539 1,072,500 1,093,500 1,168,600 1,168,600 1,168,600 7%8 Miscellaneous:9 Interest 882 527 2,000 2,000 2,000 2,000 2,000 0%
10 Miscellaneous Revenue 2,557 2,150 - - - - 11 Total Miscellaneous 3,439 2,676 2,000 2,000 2,000 2,000 2,000 0%12 Total Revenues 902,873 1,002,215 1,074,500 1,095,500 1,170,600 1,170,600 1,170,600 7%13 Other Resources:14 Debt Proceeds:15 Loan - - - - 204,600 204,600 204,600 16 Transfers In:17 Charges to Street Fund 310,637 341,300 372,500 372,500 406,400 406,400 406,400 9%18 Total Other Resources 310,637 341,300 372,500 372,500 611,000 611,000 611,000 64%19 TOTAL RESOURCES 1,674,139 1,778,663 1,869,500 1,909,800 2,152,700 2,152,700 2,152,700 13%
Continue private stormwater facility inventory programContinue TV Inspection and Cleaning workDevelop long term maintenance strategy for Vegetated Stormwater Facilities (VSFs)Revise and submit the new TMDL Implementation PlanContinue to expand regional Education and Outreach programs
Continued participation on the DEQ Steering Committee for development of the new NPDES Phase II permitContinued implementation of the City’s 3 regulatory stormwater programsInitiated revision of Public Works Design Standards
Initiated private stormwater facility inventory program
Completed realignment of storm line at Terrace GreenContinued installation of public Vegetated Stormwater Facilities for treatment and infiltration
Meet the required conditions of the new Phase II General Permit
Completed realignment of Shoreline Dr. outfall
Continue storm line realignments with Capital Improvement fundsContinue repair work identified by the TV inspection contractorComplete and submit the 5th Year Evaluation Report for the TMDL Implemetation PlanDevelop the new Stormwater Management Plan as required by the new Phase II General Permit
Continued repair work identified by the TV inspection contractorContinued implementation of the TV inspection contract (goal is 10%)Completed the comprehensive integrated public education program for the Department
PublicWorks
StormwaterFundThe Stormwater Fund is managed by the Public Works Department to meet the Federal Clean Water Act and Safe Drinking Water Act. The City’s stormwater regulatory programs are administered by the State of Oregon through the Department of Environmental Quality (DEQ). The City has 3 regulatory programs which allow the City to manage stormwater through discharge to local waterways, overland flow, and injection into the ground. The City maintains compliance of the regulatory programs by implementing the requirements of state approved management plans for the municipal separate storm sewer system (MS4), the underground injection control (UIC) devices, and the Total Maximum Daily Load (TMDL) Implementation Plan. The City is the permittee for the National Pollutant Discharge Elimination System (NPDES) permit #102904, the Water Pollution Control Facilities (WPCF) permit #103068, and is a designated management agency for the Willamette Basin TMDL.
The City Council approved a long range financial plan for the Stormwater Fund in fiscal year 2012-13 in order to address deficiencies and provide adequate financial planning for a self-sustaining fund. That strategy has been successful in addressing ongoing and upcoming regulatory, maintenance, and repair needs for the stormwater system. The Department continues to elevate repair activities while meeting regulatory permit requirements.
Personnel Services
38%Materials &
Services43%
Capital Outlay19%
130

PublicWorks
StormwaterFundACTUAL ACTUAL BUDGETED PROJECTED PROPOSED APPROVED ADOPTED % CHANGE2013-14 2014-15 2015-16 2015-16 2016-17 2016-17 2016-17 FROM PROJ
20 REQUIREMENTS:21 Expenditures:22 Personnel Services:23 Public Works Director 18,401 - - - - - - 24 Municipal Utility Workers 178,542 150,570 158,800 158,800 164,400 164,400 164,400 4%25 Community Development Staff 1,905 1,975 2,100 2,100 2,200 2,200 2,200 5%26 Administrative Support 18,007 - - - - - - 27 Environmental Program Staff 212,071 218,531 236,700 236,700 252,200 252,200 252,200 7%28 Overtime 1,658 1,285 4,800 1,400 3,000 3,000 3,000 114%29 Duty Pay 6,525 7,835 7,800 7,800 7,800 7,800 7,800 0%30 Cell Phone - Clothing Allowances 1,427 1,209 1,300 1,300 2,200 2,200 2,200 69%31 Wellness 879 1,469 2,800 2,800 2,800 2,800 2,800 0%32 Medicare 7,170 5,875 6,300 6,300 6,600 6,600 6,600 5%33 Retirement 69,455 64,965 86,800 86,800 91,400 91,400 91,400 5%34 Insurance Benefits 138,555 122,169 134,600 134,600 151,500 151,500 151,500 13%35 Workers Compensation 7,217 3,290 5,100 5,100 5,200 5,200 5,200 2%36 Total Personnel Services 661,812 579,174 647,100 643,700 689,300 689,300 689,300 7%37 Materials & Services:38 Postage & Printing 5,031 - - - - - - 39 Concrete 1,850 - 3,000 3,000 3,000 3,000 3,000 0%40 Rock & Backfill 699 1,298 1,200 1,000 1,500 1,500 1,500 50%41 Paving 2,415 3,050 4,500 3,500 4,800 4,800 4,800 37%42 Meetings, Travel & Training 8,454 6,380 7,000 7,000 8,000 8,000 8,000 14%43 Public Notices 10 80 - - - - - 44 Labor Attorney 50 - - - - - - 45 Administrative Services Charges 147,210 286,338 336,000 322,700 380,500 380,500 380,500 18%46 Contractual Services 109,407 95,091 113,300 113,300 159,200 159,200 159,200 41%47 Engineering Services 11,001 18,990 20,000 30,000 45,000 45,000 45,000 50%48 Janitorial 785 (6) - - - - - 49 Utilities 1,737 513 - - - - - 50 Storm Drain Utilities 5,421 4,694 5,500 5,500 5,500 5,500 5,500 0%51 Telephone 2,430 1,583 - - - - - 52 Auto Insurance 4,098 267 - - - - - 53 Gasoline 2,057 2,429 2,200 2,500 3,000 3,000 3,000 20%54 Diesel Fuel 6,209 4,384 10,000 5,500 8,000 8,000 8,000 45%55 Vehicle Maintenance 3,444 1,419 3,500 700 3,500 3,500 3,500 400%56 Equipment Maintenance 6,546 8,279 14,000 8,500 14,000 14,000 14,000 65%57 Storm Sewer Dumping Costs 65 - - - - - - 58 Permit Renewal & Registration Fees 850 3,032 4,000 4,000 4,000 4,000 4,000 0%59 Plant Maintenance 5,808 6,229 12,500 8,900 12,500 12,500 12,500 40%60 Pump Maintenance - 3,626 10,000 2,500 10,000 10,000 10,000 300%61 Operating Materials & Supplies 10,170 18,901 12,800 10,000 12,800 12,800 12,800 28%62 Street Sweeping 105,225 96,602 98,000 98,000 98,000 98,000 98,000 0%63 Medical Testing 349 309 400 400 400 400 400 0%64 Lab Tests 3,692 4,060 8,000 4,500 9,000 9,000 9,000 100%65 Consumer Confidence Report/ Public Education 874 3,055 3,000 1,500 4,000 4,000 4,000 167%66 Total Materials & Services 445,887 570,600 668,900 633,000 786,700 786,700 786,700 24%
131
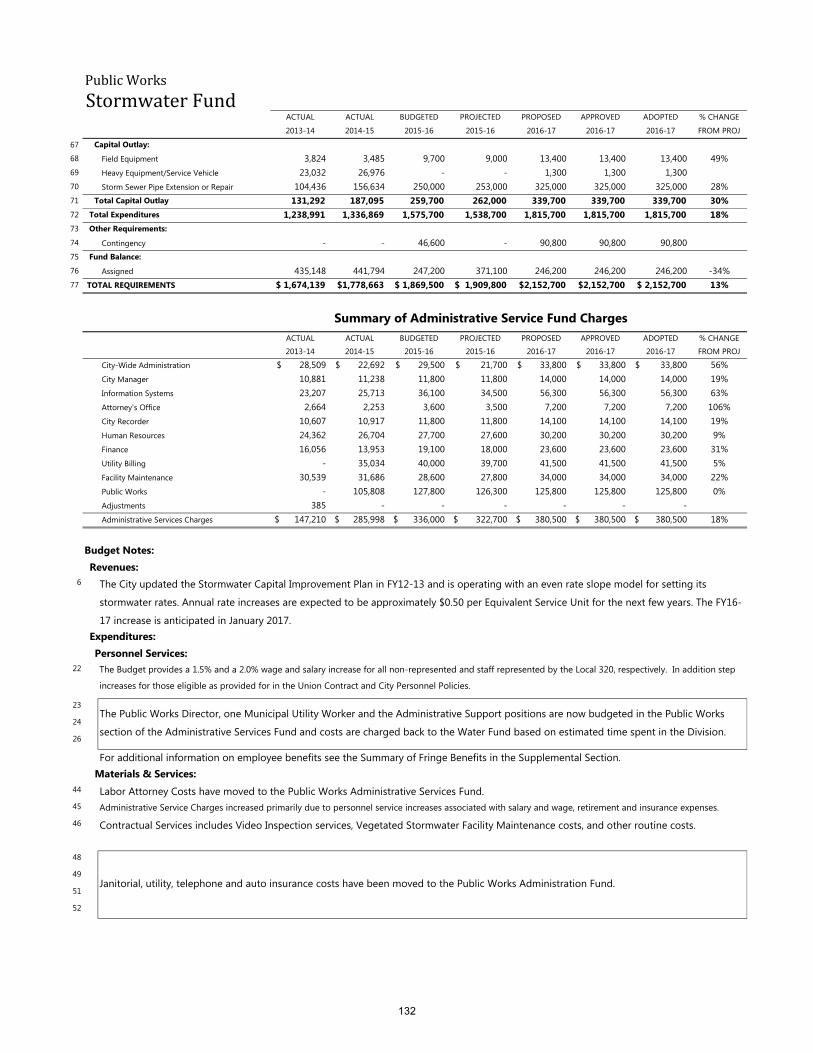
PublicWorks
StormwaterFundACTUAL ACTUAL BUDGETED PROJECTED PROPOSED APPROVED ADOPTED % CHANGE2013-14 2014-15 2015-16 2015-16 2016-17 2016-17 2016-17 FROM PROJ
67 Capital Outlay: 68 Field Equipment 3,824 3,485 9,700 9,000 13,400 13,400 13,400 49%69 Heavy Equipment/Service Vehicle 23,032 26,976 - - 1,300 1,300 1,300 70 Storm Sewer Pipe Extension or Repair 104,436 156,634 250,000 253,000 325,000 325,000 325,000 28%71 Total Capital Outlay 131,292 187,095 259,700 262,000 339,700 339,700 339,700 30%72 Total Expenditures 1,238,991 1,336,869 1,575,700 1,538,700 1,815,700 1,815,700 1,815,700 18%73 Other Requirements:74 Contingency - - 46,600 - 90,800 90,800 90,800 75 Fund Balance:76 Assigned 435,148 441,794 247,200 371,100 246,200 246,200 246,200 -34%77 TOTAL REQUIREMENTS 1,674,139$ 1,778,663$ 1,869,500$ 1,909,800$ 2,152,700$ 2,152,700$ 2,152,700$ 13%
ACTUAL ACTUAL BUDGETED PROJECTED PROPOSED APPROVED ADOPTED % CHANGE2013-14 2014-15 2015-16 2015-16 2016-17 2016-17 2016-17 FROM PROJ
City-Wide Administration 28,509$ 22,692$ 29,500$ 21,700$ 33,800$ 33,800$ 33,800$ 56%City Manager 10,881 11,238 11,800 11,800 14,000 14,000 14,000 19%Information Systems 23,207 25,713 36,100 34,500 56,300 56,300 56,300 63%Attorney's Office 2,664 2,253 3,600 3,500 7,200 7,200 7,200 106%City Recorder 10,607 10,917 11,800 11,800 14,100 14,100 14,100 19%Human Resources 24,362 26,704 27,700 27,600 30,200 30,200 30,200 9%Finance 16,056 13,953 19,100 18,000 23,600 23,600 23,600 31%Utility Billing - 35,034 40,000 39,700 41,500 41,500 41,500 5%Facility Maintenance 30,539 31,686 28,600 27,800 34,000 34,000 34,000 22%Public Works - 105,808 127,800 126,300 125,800 125,800 125,800 0%Adjustments 385 - - - - - - Administrative Services Charges 147,210$ 285,998$ 336,000$ 322,700$ 380,500$ 380,500$ 380,500$ 18%
Budget Notes:Revenues:
6
Expenditures:Personnel Services:
22
23
24
26
Materials & Services:44
45
46
48
49
51
52
Janitorial, utility, telephone and auto insurance costs have been moved to the Public Works Administration Fund.
Administrative Service Charges increased primarily due to personnel service increases associated with salary and wage, retirement and insurance expenses.
The Budget provides a 1.5% and a 2.0% wage and salary increase for all non-represented and staff represented by the Local 320, respectively. In addition step increases for those eligible as provided for in the Union Contract and City Personnel Policies.
Contractual Services includes Video Inspection services, Vegetated Stormwater Facility Maintenance costs, and other routine costs.
Summary of Administrative Service Fund Charges
The City updated the Stormwater Capital Improvement Plan in FY12-13 and is operating with an even rate slope model for setting its stormwater rates. Annual rate increases are expected to be approximately $0.50 per Equivalent Service Unit for the next few years. The FY16-17 increase is anticipated in January 2017.
For additional information on employee benefits see the Summary of Fringe Benefits in the Supplemental Section.
Labor Attorney Costs have moved to the Public Works Administrative Services Fund.
The Public Works Director, one Municipal Utility Worker and the Administrative Support positions are now budgeted in the Public Works section of the Administrative Services Fund and costs are charged back to the Water Fund based on estimated time spent in the Division.
132

ACTUAL ACTUAL BUDGETED PROJECTED PROPOSED APPROVED ADOPTED % CHANGE2013-14 2014-15 2015-16 2015-16 2016-17 2016-17 2016-17 FROM PROJ
RESOURCES:1 Beginning Balance: 248,216$ 224,671$ 246,000$ 239,000$ 226,000$ 226,000$ 226,000$ -5%2 Revenues:3 Charges for Services:4 Plan/Construction Fees 3,035 2,626 - - - - - 5 Salem Sewer Billing 4,879,208 5,030,099 5,202,000 5,205,000 5,387,000 5,387,000 5,387,000 3%6 Sewer Administration Fee 299,041 326,181 360,800 360,800 360,800 360,800 360,800 0%7 Total Charges for Services 5,181,284 5,358,906 5,562,800 5,565,800 5,747,800 5,747,800 5,747,800 3%8 Miscellaneous:9 Miscellaneous 252 99 - - - - -
10 Interest Earnings 32 118 400 400 400 400 400 0%11 Total Miscellaneous 284 217 400 400 400 400 400 0%12 Total Revenues 5,181,568 5,359,123 5,563,200 5,566,200 5,748,200 5,748,200 5,748,200 3%13 TOTAL RESOURCES 5,429,784 5,583,794 5,809,200 5,805,200 5,974,200 5,974,200 5,974,200 3%14 REQUIREMENTS:15 Expenditures:16 Personnel Services:17 Public Works Director 5,111 - - - - - - 18 Community Development Staff 1,905 1,976 2,100 2,100 2,200 2,200 2,200 5%19 Administrative Support 79,030 - - - - - - 20 Overtime 34 - - - - - - 21 Cell Phone Stipend 75 9 100 100 100 100 100 0%22 Wellness 55 4 100 100 100 100 100 0%23 Medicare 1,537 30 100 100 100 100 100 0%24 Retirement 11,009 454 600 600 600 600 600 0%25 Insurance Benefits 30,554 382 400 400 500 500 500 25%26 Workers Compensation 270 61 100 100 100 100 100 0%27 Total Personnel Services 129,580 2,916 3,500 3,500 3,700 3,700 3,700 6%28 Materials & Services:29 Postage & Printing 23,123 - - - - - - 30 Meetings, Travel & Training 121 - - - - - - 31 Public Notices 45 64 100 100 100 100 100 0%32 Administrative Services Charges 109,923 299,394 324,600 315,500 347,500 347,500 347,500 10%33 Contractual Services 17,804 1 - - - - - 34 Engineering Services 1,083 695 500 500 500 500 500 0%35 Salem Sewer Payments 4,890,534 5,041,692 5,202,000 5,202,000 5,387,000 5,387,000 5,387,000 4%36 Emergency Management Expense - - 1,000 1,000 1,000 1,000 1,000 0%37 Miscellaneous Expense - - 1,000 1,000 1,000 1,000 1,000 0%38 Total Materials & Services 5,042,633 5,341,846 5,529,200 5,520,100 5,737,100 5,737,100 5,737,100 4%39 Total Expenditures 5,172,213 5,344,762 5,532,700 5,523,600 5,740,800 5,740,800 5,740,800 4%40 Other Requirements:41 Contingency - - 16,200 - 20,000 20,000 20,000 42 Transfer to SLD Fund 32,900 - 55,600 55,600 - - - -100%43 Total Other Requirements 32,900 - 71,800 55,600 20,000 20,000 20,000 -64%44 Fund Balance:45 Committed for Future Operations 224,671 239,032 204,700 226,000 213,400 213,400 213,400 -6%46 TOTAL REQUIREMENTS 5,429,784$ 5,583,794$ 5,809,200$ 5,805,200$ 5,974,200$ 5,974,200$ 5,974,200$ 3%
The City of Keizer is a part of a regional sewer system managed by the City of Salem. Salem sets the sewer rates for the regional system. Keizer appoints Council and Staff liaisons to attend the Regional Task Force meetings. City of Keizer staff manages the billing function and remit Sewer Charges to City of Salem each month.
PublicWorks
SewerFund
133
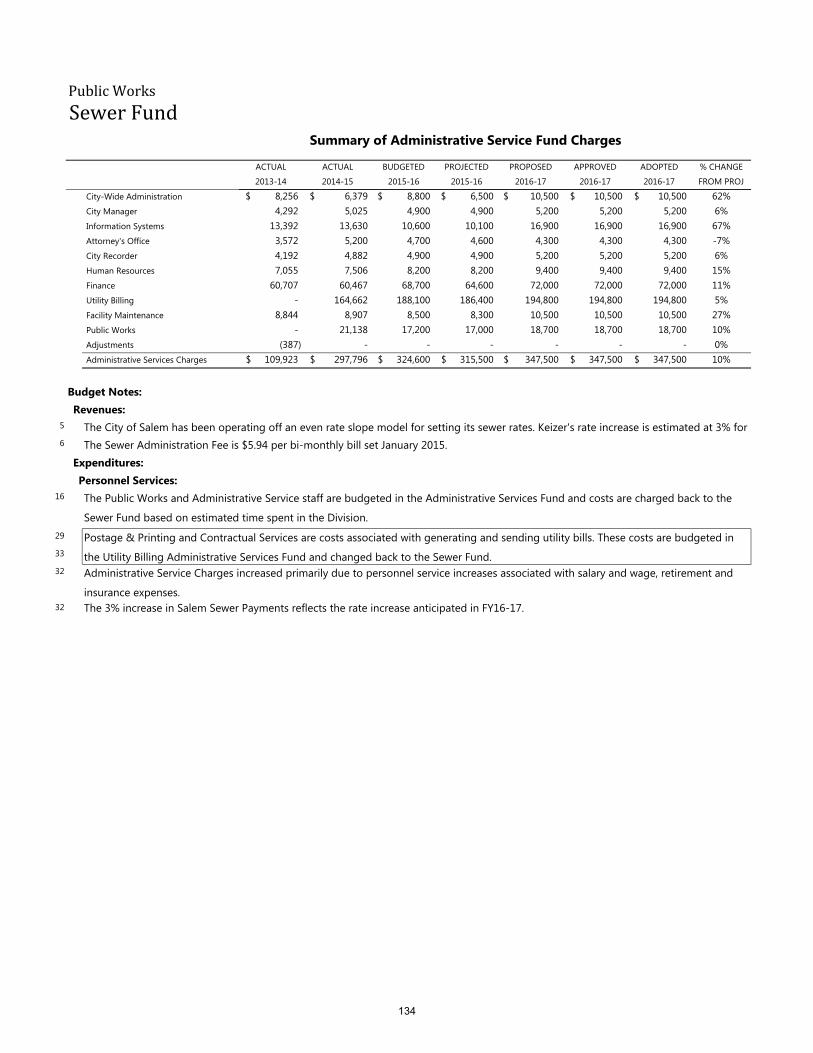
PublicWorks
SewerFund
ACTUAL ACTUAL BUDGETED PROJECTED PROPOSED APPROVED ADOPTED % CHANGE2013-14 2014-15 2015-16 2015-16 2016-17 2016-17 2016-17 FROM PROJ
City-Wide Administration 8,256$ 6,379$ 8,800$ 6,500$ 10,500$ 10,500$ 10,500$ 62%City Manager 4,292 5,025 4,900 4,900 5,200 5,200 5,200 6%Information Systems 13,392 13,630 10,600 10,100 16,900 16,900 16,900 67%Attorney's Office 3,572 5,200 4,700 4,600 4,300 4,300 4,300 -7%City Recorder 4,192 4,882 4,900 4,900 5,200 5,200 5,200 6%Human Resources 7,055 7,506 8,200 8,200 9,400 9,400 9,400 15%Finance 60,707 60,467 68,700 64,600 72,000 72,000 72,000 11%Utility Billing - 164,662 188,100 186,400 194,800 194,800 194,800 5%Facility Maintenance 8,844 8,907 8,500 8,300 10,500 10,500 10,500 27%Public Works - 21,138 17,200 17,000 18,700 18,700 18,700 10%Adjustments (387) - - - - - - 0%Administrative Services Charges 109,923$ 297,796$ 324,600$ 315,500$ 347,500$ 347,500$ 347,500$ 10%
Budget Notes:Revenues:
5
6
Expenditures:Personnel Services:
16
29
33
32
32 The 3% increase in Salem Sewer Payments reflects the rate increase anticipated in FY16-17.
Administrative Service Charges increased primarily due to personnel service increases associated with salary and wage, retirement and insurance expenses.
The City of Salem has been operating off an even rate slope model for setting its sewer rates. Keizer's rate increase is estimated at 3% for The Sewer Administration Fee is $5.94 per bi-monthly bill set January 2015.
The Public Works and Administrative Service staff are budgeted in the Administrative Services Fund and costs are charged back to the Sewer Fund based on estimated time spent in the Division.Postage & Printing and Contractual Services are costs associated with generating and sending utility bills. These costs are budgeted in the Utility Billing Administrative Services Fund and changed back to the Sewer Fund.
Summary of Administrative Service Fund Charges
134

ACTUAL ACTUAL BUDGETED PROJECTED PROPOSED APPROVED ADOPTED % CHANGE2013-14 2014-15 2015-16 2015-16 2016-17 2016-17 2016-17 FROM PROJ
1 RESOURCES:2 Beginning Balance: -$ 72,126$ 162,200$ 154,900$ 233,100$ 233,100$ 233,100$ 50%3 Revenues:4 Licenses & Fees:5 System Development Fee 98,771 82,508 108,700 80,000 35,000 35,000 35,000 -56%6 Miscellaneous:7 Interest 61 243 200 200 200 200 200 0%8 Total Revenues 98,832 82,751 108,900 80,200 35,200 35,200 35,200 -56%9 TOTAL RESOURCES 98,832 154,877 271,100 235,100 268,300 268,300 268,300 14%10 REQUIREMENTS:11 Expenditures:12 Capital Outlay:13 Sewer Line Extensions - - - - 75,000 75,000 75,000 14 Unanticipated Expense - - 270,500 2,000 178,300 178,300 178,300 8815%15 Total Capital Outlay - - 270,500 2,000 253,300 253,300 253,300 12565%16 Other Requirements:17 Transfers Out:18 Transportation Fund Interfund Loan 26,706 - - - - - - 19 Fund Balance:20 Restricted for Improvements 72,126 154,877 600 233,100 15,000 15,000 15,000 -94%21 TOTAL REQUIREMENTS 98,832$ 154,877$ 271,100$ 235,100$ 268,300$ 268,300$ 268,300$ 14%
Budget Notes:Revenues:
5 The System Development Fee projections for FY16-17 assumes the 5 acres of development.
PublicWorks
SewerReserveFund
The Sanitary Sewer Reserve Fund was established in 1994 to cover areas not served by existing sewer lines. The Sewer Reserve is a systems development based fund used to reimburse developers for sewer trunk line improvement extensions and City constructed growth driven sewer capacity improvements outlined in the Sanitary Sewer Master Plan.
135

Accomplishments for FY15-16· Continued updating distribution system to ensure adequate volume and pressure delivery to residents· Continued developing a comprehensive integrated public education program with the Stormwater Division· Completed waterline relocation for roundabout· Updated (3) 4" meters and (2) 6" meters to more efficient and accurate meters· Repaired 15 Water Main leaks· Rehabilitated Keizer Station and Weissner Wells
Division Goals for FY15-20· Continue updating distribution system to ensure adequate volume and pressure delivery to residents· Continue developing a comprehensive integrated public education program with the Stormwater Division· Continue replacement of large meters to a more accurate and efficient meters.
ACTUAL ACTUAL BUDGETED PROJECTED PROPOSED APPROVED ADOPTED % CHANGE2013-14 2014-15 2015-16 2015-16 2016-17 2016-17 2016-17 FROM PROJ
1 RESOURCES:2 Beginning Balance: 633,892$ 671,481$ 598,200$ 682,100$ 698,500$ 698,500$ 698,500$ 2%3 Revenues:4 Taxes & Assessments:5 Assessments 350 - - - - - - 6 Licenses & Fees:7 Planning & Construction Fees 11,535 11,422 10,000 12,500 10,000 10,000 10,000 -20%8 Service Fees 20,413 27,041 15,000 25,000 15,000 15,000 15,000 -40%9 Diesel Fuel Sales 31,961 27,787 37,000 25,000 37,000 37,000 37,000 48%
10 Live Tap Reimbursement 18,505 26,565 7,500 18,500 7,500 7,500 7,500 -59%11 Total Licenses & Fees 82,414 92,814 69,500 81,000 69,500 69,500 69,500 -14%12 Charges for Services:13 Water Sales 2,437,562 2,603,493 2,812,400 2,750,000 2,865,000 2,865,000 2,865,000 4%14 Miscellaneous:15 Interest 1,662 1,506 1,000 1,000 1,000 1,000 1,000 0%16 Miscellaneous 5,167 16,441 7,500 7,500 7,500 7,500 7,500 0%17 Total Miscellaneous 6,829 17,947 8,500 8,500 8,500 8,500 8,500 0%18 Other Resources:19 Transfers In:20 Transfer from Park Improvement Fund 6,574 - - - - - - 21 Transfer from Park Operations Fund - 8,161 17,400 17,400 17,400 17,400 17,400 22 Total Transfers In 6,574 8,161 17,400 17,400 17,400 17,400 17,400 0%23 TOTAL RESOURCES 3,167,621 3,393,896 3,506,000 3,539,000 3,658,900 3,658,900 3,658,900 3%
PublicWorks
The Water fund promotes public education and outreach through the annual Consumer Confidence Report, instruction at local grade schools, and also by hosting a Public Services Fair each year.
WaterFund
Revenues in the Water fund are derived from user charges. The City’s charter designates this as a dedicated fund to be used solely for water related services. The water system is managed by the Public Works Department to provide safe, low cost, high quality drinking water that meets or exceeds state and federal regulations.The Water Division operates under the Oregon Administrative Rules for Public Water Systems enforced by the Oregon Health Authority (OHA), Drinking Water Services (DWS) that administer and enforce drinking water quality standards for public water systems in the state of Oregon.
Personnel Services
35%
Materials & Services
53%
Capital Outlay
3%
Debt Service
9%
136

PublicWorks
WaterFundACTUAL ACTUAL BUDGETED PROJECTED PROPOSED APPROVED ADOPTED % CHANGE2013-14 2014-15 2015-16 2015-16 2016-17 2016-17 2016-17 FROM PROJ
24 REQUIREMENTS:25 Expenditures:26 Personnel Services:27 Public Works Director 25,557 - - - - - - 28 Municipal Utility Workers 532,646 517,627 538,700 538,700 557,200 557,200 557,200 3%29 Community Development Staff 1,905 1,975 2,100 2,100 2,200 2,200 2,200 5%30 Administrative Support 81,574 - - - - - - 31 Overtime 23,900 15,253 19,500 16,000 19,500 19,500 19,500 22%32 Duty Pay 13,050 15,670 15,600 15,600 15,600 15,600 15,600 0%33 Cell Phone/Clothing Allowance 4,602 4,009 5,200 4,500 5,000 5,000 5,000 11%34 Wellness 518 1,256 4,200 4,200 4,100 4,100 4,100 -2%35 Medicare 10,603 8,461 8,600 8,600 8,900 8,900 8,900 3%36 Retirement 93,810 78,008 112,900 112,900 115,300 115,300 115,300 2%37 Insurance Benefits 220,740 180,100 193,500 193,500 223,300 223,300 223,300 15%38 Unemployment 5,070 - - - - - - 39 Workers Compensation 7,498 7,071 8,400 8,400 8,700 8,700 8,700 4%40 Total Personnel Services 1,021,473 829,429 908,700 904,500 959,800 959,800 959,800 6%41 Materials & Services:42 Postage & Printing 21,586 - - - - - - 43 Concrete 4,870 4,753 10,000 7,600 10,000 10,000 10,000 32%44 Rock & Backfill 4,564 3,904 5,500 2,000 4,500 4,500 4,500 125%45 Paving 14,710 7,912 16,500 7,100 10,000 10,000 10,000 41%46 Sequestering Agent 24,186 14,402 10,500 10,500 10,500 10,500 10,500 0%47 Fluoride 9,658 16,063 10,500 10,500 10,500 10,500 10,500 0%48 Meetings, Travel & Training 14,376 12,994 15,000 15,000 15,000 15,000 15,000 0%49 Public Notices 194 276 300 300 300 300 300 0%50 Labor Attorney 327 - - - - - - 51 Administrative Services Charges 278,240 608,391 675,100 650,200 688,000 688,000 688,000 6%52 Contractual Services 24,233 16,437 25,000 13,000 17,500 17,500 17,500 35%53 Flagging 1,804 2,645 3,000 4,000 5,000 5,000 5,000 25%54 Engineering Services 19,786 22,639 25,000 15,000 35,000 35,000 35,000 133%55 Janitorial 2,126 (22) - - - - - 56 Electricity 215,200 224,437 230,000 233,000 240,000 240,000 240,000 3%57 Natural Gas 2,382 2,410 2,500 2,500 2,500 2,500 2,500 0%58 Telephone 6,004 3,336 - - - - - 59 Telemetry 10,436 2,848 10,000 10,000 10,000 10,000 10,000 0%60 Auto Insurance 5,464 - - - - - - 61 Gasoline 17,381 15,412 18,000 13,000 18,000 18,000 18,000 38%62 Diesel Fuel 42,381 37,234 50,000 32,000 45,000 45,000 45,000 41%63 Vehicle Maintenance 7,923 21,354 22,000 20,000 20,000 20,000 20,000 0%64 Equipment Maintenance 16,202 8,043 12,000 12,000 12,000 12,000 12,000 0%65 Plant Maintenance 63,807 44,947 45,000 45,000 45,000 45,000 45,000 0%66 Live Taps 13,135 28,700 10,000 18,000 10,000 10,000 10,000 -44%67 Pump House Maintenance 13,067 12,395 10,000 10,000 10,000 10,000 10,000 0%68 Pump Maintenance 43,916 33,889 65,000 65,000 65,000 65,000 65,000 0%69 Operating Materials & Supplies 23,199 19,530 30,000 30,000 30,000 30,000 30,000 0%70 Medical Testing 1,448 990 1,200 1,200 1,200 1,200 1,200 0%71 Water Mains 18,699 36,024 35,000 40,000 25,000 25,000 25,000 -38%72 Lab Tests 58,818 36,894 49,000 49,000 50,000 50,000 50,000 2%73 Contract Meter Reading 35,420 36,104 38,000 37,500 38,000 38,000 38,000 1%74 Consumer Confidence Report 7,863 8,502 12,000 12,000 12,000 12,000 12,000 0%75 Miscellaneous (3) 118 1,000 - 1,000 1,000 1,000 76 Total Materials & Services 1,023,402 1,283,559 1,437,100 1,365,400 1,441,000 1,441,000 1,441,000 6%
137

PublicWorks
WaterFundACTUAL ACTUAL BUDGETED PROJECTED PROPOSED APPROVED ADOPTED % CHANGE2013-14 2014-15 2015-16 2015-16 2016-17 2016-17 2016-17 FROM PROJ
77 Capital Outlay: 78 Field Equipment 1,575 11,156 10,500 10,500 21,700 21,700 21,700 107%79 Water Meters 23,117 45,081 50,000 50,000 30,500 30,500 30,500 -39%80 Heavy Equipment/Vehicle 31,583 8,609 30,000 28,600 23,400 23,400 23,400 -18%81 Unanticipated Expense - - 9,000 - 7,600 7,600 7,600 82 Total Capital Outlay 56,275 64,845 99,500 89,100 83,200 83,200 83,200 -7%83 Debt Service:84 Principal 170,000 180,000 185,000 185,000 190,000 190,000 190,000 3%85 Interest 61,090 53,915 46,500 46,500 38,800 38,800 38,800 -17%86 Total Debt Service 231,090 233,915 231,500 231,500 228,800 228,800 228,800 -1%87 Total Expenditures 2,332,240 2,411,748 2,676,800 2,590,500 2,712,800 2,712,800 2,712,800 5%88 Other Requirements:89 Contingency - - 125,000 - 125,000 125,000 125,000 90 Transfer to Water Facility Replacement Reserve 163,900 300,000 250,000 250,000 400,000 400,000 400,000 60%91 Total Other Requirements 163,900 300,000 375,000 250,000 525,000 525,000 525,000 110%92 Fund Balance:93 Restricted for Operations 671,481 682,148 454,200 698,500 421,100 421,100 421,100 -40%94 TOTAL REQUIREMENTS 3,167,621$ 3,393,896$ 3,506,000$ 3,539,000$ 3,658,900$ 3,658,900$ 3,658,900$ 3%
ACTUAL ACTUAL BUDGETED PROJECTED PROPOSED APPROVED ADOPTED % CHANGE2013-14 2014-15 2015-16 2015-16 2016-17 2016-17 2016-17 FROM PROJ
City-Wide Administration 45,794$ 36,338$ 46,800$ 34,300$ 53,800$ 53,800$ 53,800$ 57%City Manager 18,168 19,182 19,400 19,400 21,700 21,700 21,700 12%Information Systems 41,348 44,660 68,900 65,800 58,100 58,100 58,100 -12%Attorney's Office 5,996 6,511 7,400 7,300 9,300 9,300 9,300 27%City Recorder 17,724 18,635 19,500 19,500 21,600 21,600 21,600 11%Human Resources 39,133 42,762 44,000 43,800 48,100 48,100 48,100 10%Finance 60,707 60,467 68,700 64,600 72,000 72,000 72,000 11%Utility Billing - 150,648 172,100 170,500 178,200 178,200 178,200 5%Facility Maintenance 49,055 50,739 45,400 44,200 54,000 54,000 54,000 22%Public Works - 176,987 182,900 180,800 171,200 171,200 171,200 -5%Adjustments 315 1 - - - - - Administrative Service Charges 278,240$ 606,930$ 675,100$ 650,200$ 688,000$ 688,000$ 688,000$ 6%
Summary of Administrative Service Fund Charges
138
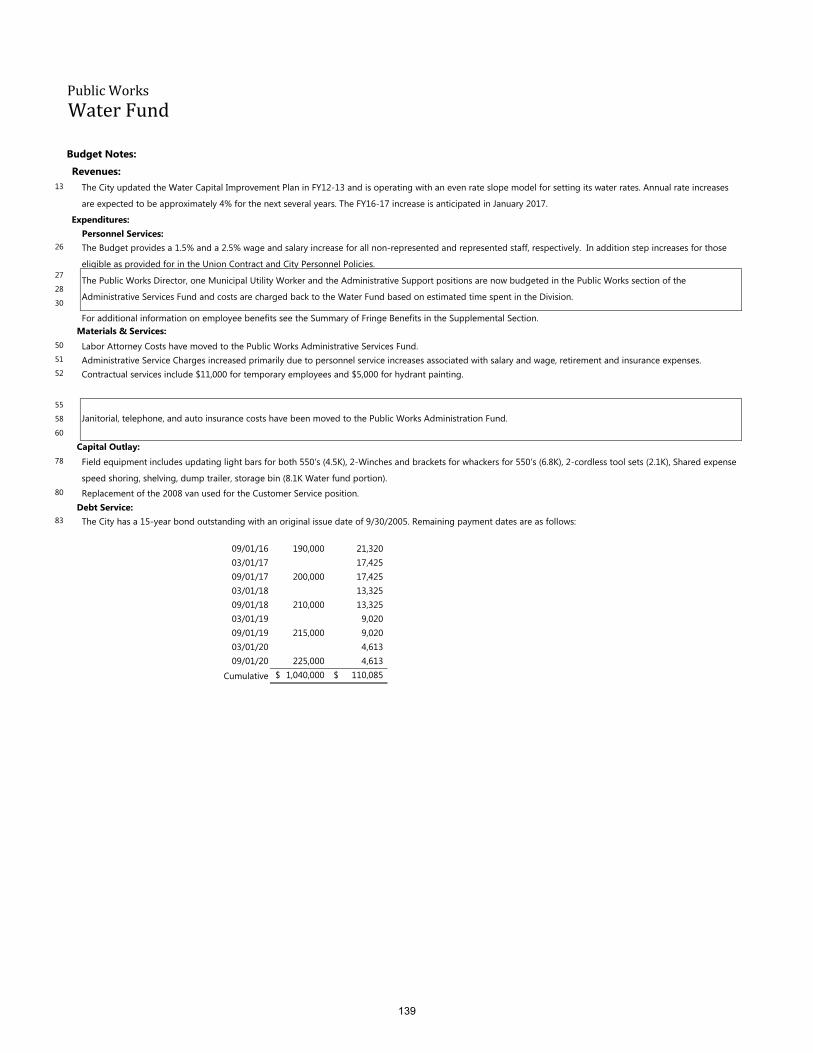
PublicWorks
WaterFund
Budget Notes:Revenues:
13
Expenditures:Personnel Services:
26
272830
Materials & Services:505152
555860
Capital Outlay:78
80Debt Service:
83
09/01/16 190,000 21,320 03/01/17 17,425 09/01/17 200,000 17,425 03/01/18 13,325 09/01/18 210,000 13,325 03/01/19 9,020 09/01/19 215,000 9,020 03/01/20 4,613 09/01/20 225,000 4,613
Cumulative 1,040,000$ 110,085$
For additional information on employee benefits see the Summary of Fringe Benefits in the Supplemental Section.
The Budget provides a 1.5% and a 2.5% wage and salary increase for all non-represented and represented staff, respectively. In addition step increases for those eligible as provided for in the Union Contract and City Personnel Policies.
The City updated the Water Capital Improvement Plan in FY12-13 and is operating with an even rate slope model for setting its water rates. Annual rate increases are expected to be approximately 4% for the next several years. The FY16-17 increase is anticipated in January 2017.
The Public Works Director, one Municipal Utility Worker and the Administrative Support positions are now budgeted in the Public Works section of the Administrative Services Fund and costs are charged back to the Water Fund based on estimated time spent in the Division.
Replacement of the 2008 van used for the Customer Service position.
The City has a 15-year bond outstanding with an original issue date of 9/30/2005. Remaining payment dates are as follows:
Labor Attorney Costs have moved to the Public Works Administrative Services Fund.
Janitorial, telephone, and auto insurance costs have been moved to the Public Works Administration Fund.
Contractual services include $11,000 for temporary employees and $5,000 for hydrant painting.Administrative Service Charges increased primarily due to personnel service increases associated with salary and wage, retirement and insurance expenses.
Field equipment includes updating light bars for both 550's (4.5K), 2-Winches and brackets for whackers for 550's (6.8K), 2-cordless tool sets (2.1K), Shared expense speed shoring, shelving, dump trailer, storage bin (8.1K Water fund portion).
139

Projects completed FY15-16· Installed a filter plant at Lacey Court Well for hydrogen sulfide issues· Continued steel watermain replacement program
Capital Improvements Planned FY16-17· Continued steel watermain replacement program· Installation of 3 monitoring wells· Abandon the Lauderback well
ACTUAL ACTUAL BUDGETED PROJECTED PROPOSED APPROVED ADOPTED % CHANGE2013-14 2014-15 2015-16 2015-16 2016-17 2016-17 2016-17 FROM PROJ
1 RESOURCES:2 Beginning Balance: 636,995$ 556,092$ 311,000$ 316,500$ 239,000$ 239,000$ 239,000$ -24%3 Revenues:4 Licenses & Fees:5 System Development Fees 51,963 105,561 73,700 97,000 59,400 59,400 59,400 -39%6 Miscellaneous:7 Interest 2,003 1,306 2,000 2,000 1,000 1,000 1,000 -50%8 Miscellaneous 50 - 43,500 43,500 - - - -100%9 Total Miscellaneous 2,053 1,306 45,500 45,500 1,000 1,000 1,000 -98%10 Total Revenues 54,016 106,867 119,200 142,500 60,400 60,400 60,400 -58%11 Other Resources:12 Debt Proceeds:13 Loan - - 310,000 135,000 100,000 100,000 100,000 -26%14 Transfers In:15 Transfer from Water Fund 163,900 300,000 250,000 250,000 400,000 400,000 400,000 60%16 Total Other Resources 163,900 300,000 560,000 385,000 500,000 500,000 500,000 30%17 TOTAL RESOURCES 854,911 962,959 990,200 844,000 799,400 799,400 799,400 -5%18 REQUIREMENTS:19 Expenditures:20 Capital Outlay:21 Supply/Treatment 62,639 114,358 175,000 200,000 95,000 95,000 95,000 -53%22 Transmission & Distribution Mains 227,620 412,747 400,000 400,000 400,000 400,000 400,000 0%23 General Plant 8,560 119,341 - 5,000 - - - -100%24 Unanticipated Expenses - - 131,500 - 49,500 49,500 49,500 25 Total Capital Outlay 298,819 646,445 706,500 605,000 544,500 544,500 544,500 -10%26 Fund Balance:27 Restricted for Debt Service Requirements 234,100 - 234,100 234,100 234,100 234,100 234,100 0%28 Restricted for Improvements 321,992 316,514 49,600 4,900 20,800 20,800 20,800 324%29 Total Fund Balance 556,092 316,514 283,700 239,000 254,900 254,900 254,900 7%30 TOTAL REQUIREMENTS 854,911$ 962,959$ 990,200$ 844,000$ 799,400$ 799,400$ 799,400$ -5%
Budget Notes:Revenues:
5
Expenditures:21
PublicWorks
WaterFacilityReplacementFund
The System Development Fee projections for FY16-17 assume 50 new single family homes, and 2 two inch meters for Area C apartments.The City intends to finance its capital improvements over the next several years to help smooth water rates charged to customers.
Supply & Treatment costs are for the installation of three new monitoring wells, and abandonment of the Lauderback well.
The water Facility Replacement Reserve was established for replacement and construction of new facilities needed to provide water production, storage, and distribution.Revenue consists of System Development Charges, water usage charges transferred from the Water Operating Fund, and revenue bonds.Expenditures listed in the 2015/2016 Capital Improvements are intended to enhance the ability to provide the water needed to serve the community within the existing Urban Growth Boundary consistent with the City Council adopted 2012 Water System Master Plan Update.
140

Improvements in FY15-16Completion of landscaping improvements around the Big Toy at Keizer Rapids Park and preliminary design costs for grant application.Improvements Planned for FY16-17Restrooms, fall protection surfacing for Big Toy, and paved pathways at Keizer Rapids Park.
ACTUAL ACTUAL BUDGETED PROJECTED PROPOSED APPROVED ADOPTED % CHANGE2013-14 2014-15 2015-16 2015-16 2016-17 2016-17 2016-17 FROM PROJ
1 RESOURCES:2 Beginning Balance: 388,606$ 371,698$ 460,200$ 471,900$ 915,800$ 915,800$ 915,800$ 94%3 Revenues:4 Licenses & Fees:5 System Development Fees 45,051 261,778 366,100 454,000 80,100 80,100 80,100 -82%6 Intergovernmental:7 Grants - 30,000 75,000 - 456,800 456,800 456,800 8 Miscellaneous:9 Interest 879 1,006 600 600 600 600 600 0%10 Donations 10,262 83,538 - 19,300 - - - -100%11 Total Miscellaneous 11,141 84,544 600 19,900 600 600 600 -97%12 Total Revenues 56,192 376,322 441,700 473,900 537,500 537,500 537,500 13%13 TOTAL RESOURCES 444,798 748,020 901,900 945,800 1,453,300 1,453,300 1,453,300 54%14 REQUIREMENTS:15 Expenditures:16 Capital Outlay:17 Grant Expenditures 40,666 - 75,000 - 456,800 456,800 456,800 18 Improvements 25,860 276,098 200,000 30,000 50,000 50,000 50,000 67%19 Unanticipated Expenses:20 ADA Access to Amphitheater - - 10,000 - 10,000 10,000 10,000 21 "New" SDC Money - - 616,900 - - - - 22 Total Unanticipated Expenses - - 626,900 - 10,000 10,000 10,000 23 Total Capital Outlay 66,526 276,098 901,900 30,000 516,800 516,800 516,800 1623%24 Other Requirements:25 Transfers Out:26 Transfer to Water Fund 6,574 - - - - - - 27 Fund Balance:28 Restricted for Improvements 371,698 471,922 - 915,800 936,500 936,500 936,500 2%29 TOTAL REQUIREMENTS 444,798$ 748,020$ 901,900$ 945,800$ 1,453,300$ 1,453,300$ 1,453,300$ 54%
Budget Notes:Revenues:
57
Expenditures:1718
The Park Improvement Fund was established to account for Systems Development Charges (SDC’s) designated for park improvements. These fees are collected from new residential development in the City. Improvements are included in the City Council adopted Parks Master Plan and expenditures follow the adopted SDC Methodology.
PublicWorks
ParkImprovementFund
Capital outlay expenditures are for Keizer Rapids Park project.
The City intends to apply for a grant with the Oregon Parks and Recreation Department to help fund restrooms, pathways, and fall protection surfacing at the "Big Toy" in Keizer Rapids Park.
The System Development Fee projections for FY16-17 assumes 50 new single family homes during the year.
141
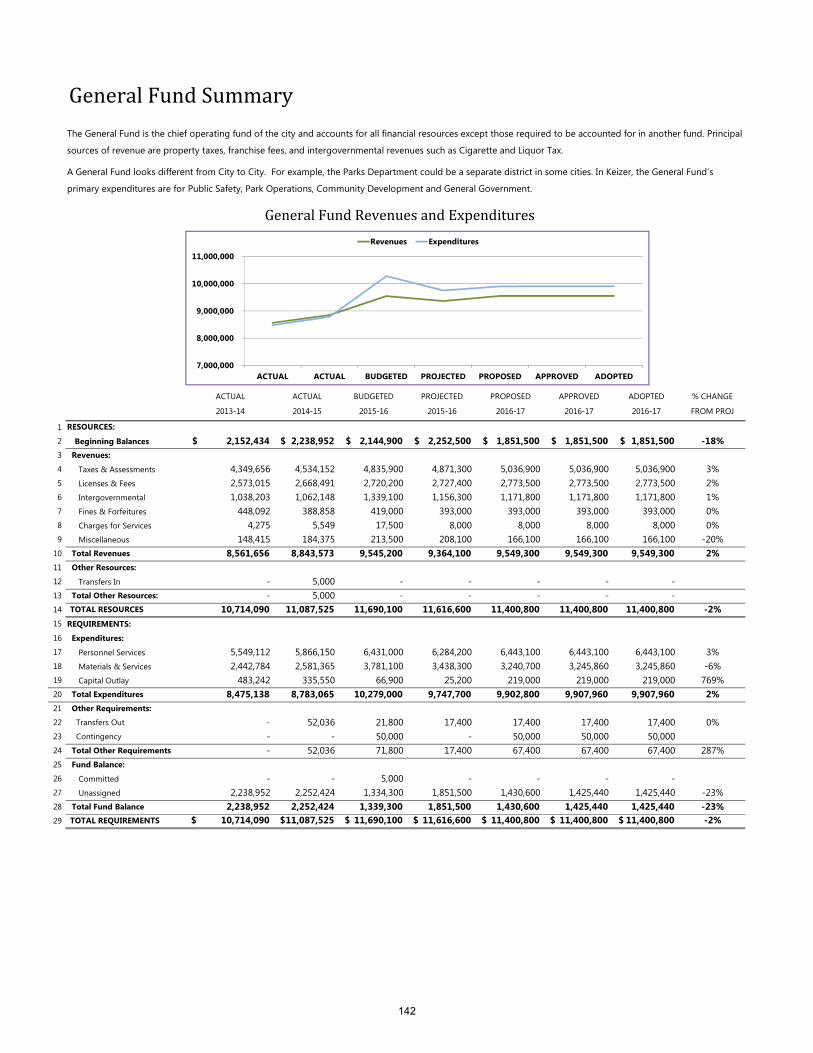
ACTUAL ACTUAL BUDGETED PROJECTED PROPOSED APPROVED ADOPTED % CHANGE2013-14 2014-15 2015-16 2015-16 2016-17 2016-17 2016-17 FROM PROJ
12 Beginning Balances 2,152,434$ 2,238,952$ 2,144,900$ 2,252,500$ 1,851,500$ 1,851,500$ 1,851,500$ -18%3 Revenues:4 Taxes & Assessments 4,349,656 4,534,152 4,835,900 4,871,300 5,036,900 5,036,900 5,036,900 3%5 Licenses & Fees 2,573,015 2,668,491 2,720,200 2,727,400 2,773,500 2,773,500 2,773,500 2%6 Intergovernmental 1,038,203 1,062,148 1,339,100 1,156,300 1,171,800 1,171,800 1,171,800 1%7 Fines & Forfeitures 448,092 388,858 419,000 393,000 393,000 393,000 393,000 0%8 Charges for Services 4,275 5,549 17,500 8,000 8,000 8,000 8,000 0%9 Miscellaneous 148,415 184,375 213,500 208,100 166,100 166,100 166,100 -20%
10 Total Revenues 8,561,656 8,843,573 9,545,200 9,364,100 9,549,300 9,549,300 9,549,300 2%11 Other Resources:12 Transfers In - 5,000 - - - - - 13 Total Other Resources: - 5,000 - - - - - 14 TOTAL RESOURCES 10,714,090 11,087,525 11,690,100 11,616,600 11,400,800 11,400,800 11,400,800 -2%1516 Expenditures:17 Personnel Services 5,549,112 5,866,150 6,431,000 6,284,200 6,443,100 6,443,100 6,443,100 3%18 Materials & Services 2,442,784 2,581,365 3,781,100 3,438,300 3,240,700 3,245,860 3,245,860 -6%19 Capital Outlay 483,242 335,550 66,900 25,200 219,000 219,000 219,000 769%20 Total Expenditures 8,475,138 8,783,065 10,279,000 9,747,700 9,902,800 9,907,960 9,907,960 2%21 Other Requirements:22 Transfers Out - 52,036 21,800 17,400 17,400 17,400 17,400 0%23 Contingency - - 50,000 - 50,000 50,000 50,000 24 Total Other Requirements - 52,036 71,800 17,400 67,400 67,400 67,400 287%25 Fund Balance:26 Committed - - 5,000 - - - - 27 Unassigned 2,238,952 2,252,424 1,334,300 1,851,500 1,430,600 1,425,440 1,425,440 -23%28 Total Fund Balance 2,238,952 2,252,424 1,339,300 1,851,500 1,430,600 1,425,440 1,425,440 -23%29 TOTAL REQUIREMENTS 10,714,090$ 11,087,525$ 11,690,100$ 11,616,600$ 11,400,800$ 11,400,800$ 11,400,800$ -2%
RESOURCES:
REQUIREMENTS:
GeneralFundRevenuesandExpenditures
The General Fund is the chief operating fund of the city and accounts for all financial resources except those required to be accounted for in another fund. Principal sources of revenue are property taxes, franchise fees, and intergovernmental revenues such as Cigarette and Liquor Tax.
A General Fund looks different from City to City. For example, the Parks Department could be a separate district in some cities. In Keizer, the General Fund’s primary expenditures are for Public Safety, Park Operations, Community Development and General Government.
GeneralFundSummary
7,000,000
8,000,000
9,000,000
10,000,000
11,000,000
ACTUAL ACTUAL BUDGETED PROJECTED PROPOSED APPROVED ADOPTED
Revenues Expenditures
142

Revenues by Major Category
Expenditures by Major Category
GeneralFundRevenues&ExpendituresSummary
Taxes & Assessments
53%Licenses & Fees
29%
Intergovernmental12%
Miscellaneous0.4%
Intergovernmental 7%
Fines & Forfeits2.8%
Personnel Services
65%
Materials & Services
33%
Capital Outlay
2%
Contingency 1%
Expenditures by Function
Administration21%
Parks4%
Public Safety65%
Community Development
6%
Revenue Sharing1%
Municipal Court2%
Contingency1%
143
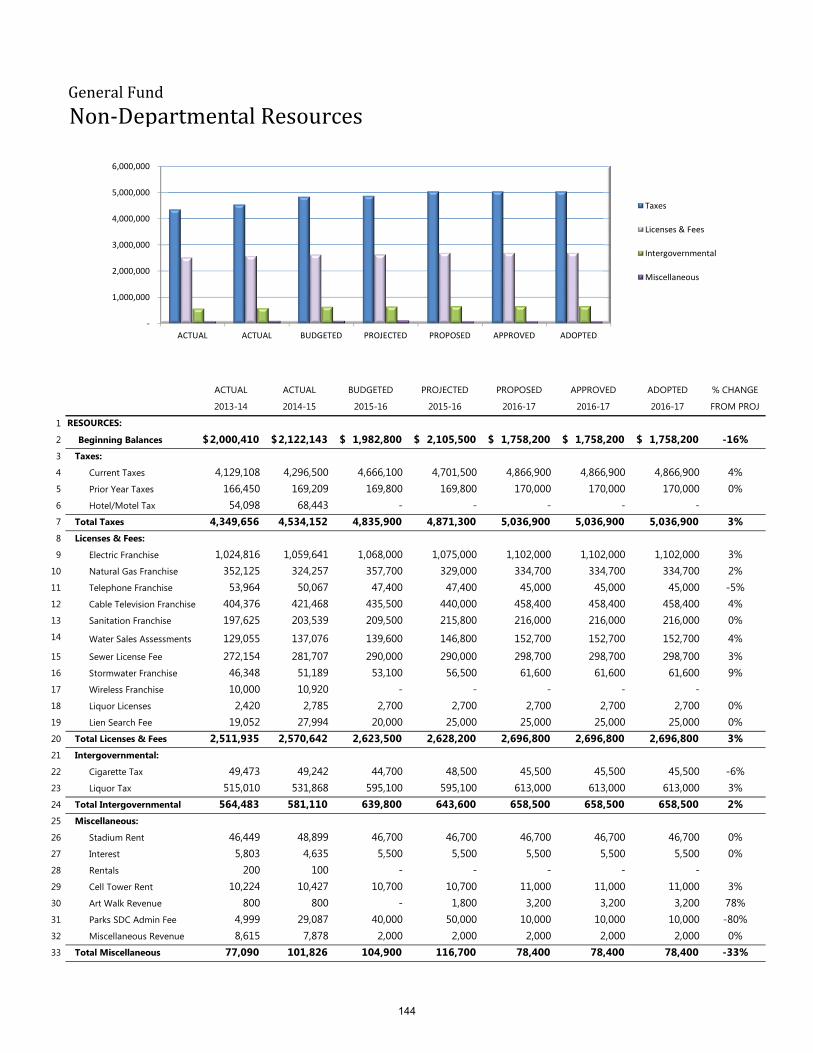
ACTUAL ACTUAL BUDGETED PROJECTED PROPOSED APPROVED ADOPTED % CHANGE2013-14 2014-15 2015-16 2015-16 2016-17 2016-17 2016-17 FROM PROJ
12 Beginning Balances 2,000,410$ 2,122,143$ 1,982,800$ 2,105,500$ 1,758,200$ 1,758,200$ 1,758,200$ -16%3 Taxes:4 Current Taxes 4,129,108 4,296,500 4,666,100 4,701,500 4,866,900 4,866,900 4,866,900 4%5 Prior Year Taxes 166,450 169,209 169,800 169,800 170,000 170,000 170,000 0%6 Hotel/Motel Tax 54,098 68,443 - - - - - 7 Total Taxes 4,349,656 4,534,152 4,835,900 4,871,300 5,036,900 5,036,900 5,036,900 3%8 Licenses & Fees:9 Electric Franchise 1,024,816 1,059,641 1,068,000 1,075,000 1,102,000 1,102,000 1,102,000 3%
10 Natural Gas Franchise 352,125 324,257 357,700 329,000 334,700 334,700 334,700 2%11 Telephone Franchise 53,964 50,067 47,400 47,400 45,000 45,000 45,000 -5%12 Cable Television Franchise 404,376 421,468 435,500 440,000 458,400 458,400 458,400 4%13 Sanitation Franchise 197,625 203,539 209,500 215,800 216,000 216,000 216,000 0%14 Water Sales Assessments 129,055 137,076 139,600 146,800 152,700 152,700 152,700 4%15 Sewer License Fee 272,154 281,707 290,000 290,000 298,700 298,700 298,700 3%16 Stormwater Franchise 46,348 51,189 53,100 56,500 61,600 61,600 61,600 9%17 Wireless Franchise 10,000 10,920 - - - - - 18 Liquor Licenses 2,420 2,785 2,700 2,700 2,700 2,700 2,700 0%19 Lien Search Fee 19,052 27,994 20,000 25,000 25,000 25,000 25,000 0%20 Total Licenses & Fees 2,511,935 2,570,642 2,623,500 2,628,200 2,696,800 2,696,800 2,696,800 3%21 Intergovernmental:22 Cigarette Tax 49,473 49,242 44,700 48,500 45,500 45,500 45,500 -6%23 Liquor Tax 515,010 531,868 595,100 595,100 613,000 613,000 613,000 3%24 Total Intergovernmental 564,483 581,110 639,800 643,600 658,500 658,500 658,500 2%25 Miscellaneous:26 Stadium Rent 46,449 48,899 46,700 46,700 46,700 46,700 46,700 0%27 Interest 5,803 4,635 5,500 5,500 5,500 5,500 5,500 0%28 Rentals 200 100 - - - - - 29 Cell Tower Rent 10,224 10,427 10,700 10,700 11,000 11,000 11,000 3%30 Art Walk Revenue 800 800 - 1,800 3,200 3,200 3,200 78%31 Parks SDC Admin Fee 4,999 29,087 40,000 50,000 10,000 10,000 10,000 -80%32 Miscellaneous Revenue 8,615 7,878 2,000 2,000 2,000 2,000 2,000 0%33 Total Miscellaneous 77,090 101,826 104,900 116,700 78,400 78,400 78,400 -33%
RESOURCES:
GeneralFund
Non‐DepartmentalResources
‐
1,000,000
2,000,000
3,000,000
4,000,000
5,000,000
6,000,000
ACTUAL ACTUAL BUDGETED PROJECTED PROPOSED APPROVED ADOPTED
Taxes
Licenses & Fees
Intergovernmental
Miscellaneous
144

GeneralFund
Non‐DepartmentalResources
ACTUAL ACTUAL BUDGETED PROJECTED PROPOSED APPROVED ADOPTED % CHANGE2013-14 2014-15 2015-16 2015-16 2016-17 2016-17 2016-17 FROM PROJ
34 Transfers In: 35 From PEG Fund - 5,000 - - - - - 36 Total Transfers In - 5,000 - - - - - 37 TOTAL RESOURCES 9,503,574$ 9,914,874$ 10,186,900$ 10,365,300$ 10,228,800$ 10,228,800$ 10,228,800$ -1%
Budget Notes:4
9
1011
1213141516172223
City Utility assessments and fees are expected to increase commensurate with the rate increases anticipated in FY16-17.
The City's Wireless agreement with Clear Wireless ended during FY14-15.The League of Oregon Cities reports that the State projects a 6% decline in Cigarette Tax revenues and a 3% increase in Liquor Tax revenues. Both trends are a result of sales and are not due to legislative changes in the tax or allocation of the tax.
Property Tax Revenues are expected to increase 4%; 1% from new construction based on permits processed in FY15-16 and 3.0% from increased valuation. Marion County projects a tentative 4% increase overall, however, official estimates are not available at this time.PGE anticipates a 1% rate increase effective July 2016 which will primarily impact FY2017-18, in addition financial analysts are projecting a 3-4% increase in overall revenue for calendar years 2016 and 2017. In October 2015 Salem Electric increased the residential basic charge from $8.00 to $10.00 per meter which resulted in an approximately 1% revenue increase, this increase is expected to continue into 2016-17.
NW Natural Gas has requested a 1.7% increase during 2015-16 which will primarily impact FY2016-17.Telephone franchise revenues continue to decline as more users switch from landlines to cellular phones which are not subject to franchise tax. FY16-17 revenue projections are based on a 5% reduction over FY15-16 projected revenues, consistent with the current downward trend.Comcast is projecting a 4% increase overall in cable television revenues during calendar year 2016.Sanitation franchise operators implimented a 5% rate increase in FY2015-16, no additional rate increases are anticipated for FY2016-17.
145

ACTUAL ACTUAL BUDGETED PROJECTED PROPOSED APPROVED ADOPTED % CHANGE2013-14 2014-15 2015-16 2015-16 2016-17 2016-17 2016-17 FROM PROJ
1 TOTAL REQUIREMENTS:2 3 Materials & Services: 4 Public Notices 780$ 906$ 1,400$ 1,400$ 1,400$ 1,400$ 1,400$ 0%5 Art Walk Artists' Stipends 1,140 800 1,500 1,800 3,200 3,200 3,200 78%6 Public Art Commission - 326 1,000 1,000 1,000 3,500 3,500 250%7 Civic Center Art - - 500 500 500 500 500 0%8 Points of Interest Commission - - - - - 1,860 1,860 9 Legal Services 1,484 355 18,900 5,000 18,900 18,900 18,900 278%
10 Administrative Services Charges 1,361,709 1,487,143 1,731,600 1,637,500 1,699,900 1,699,900 1,699,900 4%11 Contractual Services 11,807 12,229 11,900 15,000 38,000 38,000 38,000 153%12 Keizer Chamber Support 3,560 - 1,500 1,500 1,500 1,500 1,500 0%13 Holiday Lights 9,800 4,581 20,000 15,100 - - - -100%14 Off-Site Property Maintenance 5,021 6,735 7,500 7,500 7,500 7,500 7,500 0%15 Neighborhood Associations 1,104 1,322 1,000 1,000 1,000 1,200 1,200 20%16 SK Schools Tax Payment 33,515 33,515 541,900 541,900 209,000 209,000 209,000 -61%17 Volunteer Recognition 67 187 200 200 200 200 200 0%18 Keizer Community Library - 7,403 7,400 7,400 7,400 8,000 8,000 8%19 After School Programs 5,000 6,000 6,000 6,000 6,000 6,000 6,000 0%20 Miscellaneous 500 612 1,000 - 1,000 1,000 1,000 21 Emergency Management 203 - 1,000 - 1,000 1,000 1,000 22 Total Materials & Services 1,435,690 1,562,114 2,354,300 2,242,800 1,997,500 2,002,660 2,002,660 -11%23 Capital Outlay 24 Area B Development Costs - 41,700 - 51,700 51,700 51,700 25 Total Expenditures 1,435,690 1,562,114 2,396,000 2,242,800 2,049,200 2,054,360 2,054,360 -8%26 Other Requirements:27 Contingencies:28 General Contingency - - 50,000 - 50,000 50,000 50,000 29 Transfers Out:30 Community Center Fund - 43,875 4,400 - - - - 31 Water Fund - 8,161 17,400 17,400 17,400 17,400 17,400 0%32 Total Transfers Out - 52,036 21,800 17,400 17,400 17,400 17,400 0%33 TOTAL REQUIREMENTS 1,435,690$ 1,614,151$ 2,467,800$ 2,260,200$ 2,116,600$ 2,121,760$ 2,121,760$ -6%
Expenditures:
GeneralFund
Non‐DepartmentalRequirements
400,000 600,000 800,000
1,000,000 1,200,000 1,400,000 1,600,000 1,800,000 2,000,000 2,200,000 2,400,000 2,600,000
2013-14 2014-15 2015-16 2015-16 2016-17 2016-17 2016-17
ACTUAL ACTUAL BUDGETED PROJECTED PROPOSED APPROVED ADOPTED
Materials & Services
146

GeneralFund
Non‐DepartmentalRequirements
ACTUAL ACTUAL BUDGETED PROJECTED PROPOSED APPROVED ADOPTED % CHANGE2013-14 2014-15 2015-16 2015-16 2016-17 2016-17 2016-17 FROM PROJ
City-Wide Administration 151,404$ 152,572$ 210,500$ 154,400$ 222,200$ 222,200$ 222,200$ 44%City Manager 139,751 151,124 168,800 168,800 167,000 167,000 167,000 -1%Information Systems 199,711 233,495 300,500 287,100 288,000 288,000 288,000 0%Attorney's Office 180,822 200,074 243,200 238,700 237,600 237,600 237,600 0%City Recorder 129,546 137,344 158,200 157,900 157,600 157,600 157,600 0%Human Resources 163,488 179,544 198,000 197,300 198,700 198,700 198,700 1%Finance 165,818 192,438 228,600 215,000 189,300 189,300 189,300 -12%Facility Maintenance 204,941 213,039 204,100 198,500 223,000 223,000 223,000 12%Public Works - 13,009 19,700 19,800 16,500 16,500 16,500 -17%Adjustments 26,228 14,504 - - - - - Administrative Services Charges 1,361,709$ 1,487,143$ 1,731,600$ 1,637,500$ 1,699,900$ 1,699,900$ 1,699,900$ 4%
Budget Notes:
9
10
11
16
Legal Services include $10,000 for outside legal counsel who specialize in telecom, to prepare a master telecom ordinance, inclusive of all telecom providers doing business in Keizer. The City currently has an exclusive agreement with CenturyLink (aka Qwest) and does not have a master telecom ordinance. Another $8,900 is appropriated for bond counsel's assistance in closing out the North River Road Urban Renewal District.Administrative Service Charges increased primarily from personnel service increases associated with salary and wage, retirement and insurance expenses.
The City's outstanding debt to the Salem-Keizer School District is $1,252,204.74, interest exempt, due in fiscal year 2022-2023. Additional annual property tax revenues from the closure of the district will be sufficient to pay off this debt in equal installments for the next six years.
Summary of Administrative Service Fund Charges
Contractual services includes recurring lien search fees and credit card processing fees of $15,000. In addition $23,000 is include to payoff outstanding property tax liens associated with property acquired by the Urban Renewal District in the Keizer Station area.
147

Accomplishments for FY 2015-16Resurface Willamette Manor Tennis Court
Division Goal for FY 2016-17Resurface South Parking Lot at Claggett Creek Park
ACTUAL ACTUAL BUDGETED PROJECTED PROPOSED APPROVED ADOPTED % CHANGE2013-14 2014-15 2015-16 2015-16 2016-17 2016-17 2016-17 FROM PROJ
Revenues:Licenses & Fees:
1 Park Reservation Fees 3,513$ 3,580$ 2,700$ 3,200$ 2,700$ 2,700$ 2,700$ -16%2 Miscellaneous:3 Park Rental Income 25,013 40,144 58,800 52,900 52,000 52,000 52,000 -2%4 Little League Reimbursement - - - 5,000 - - - -100%5 Total Miscellaneous 25,013 40,144 58,800 57,900 52,000 52,000 52,000 -10%6 Total Resources 28,526 43,724 61,500 61,100 54,700 54,700 54,700 -10%7 Expenditures:8 Personnel Services:9 Public Works Director 7,156 - - - - - -
10 Municipal Utility Workers 67,442 92,230 93,200 93,200 97,400 97,400 97,400 5%11 Overtime 152 9,222 600 600 600 600 600 0%12 Clothing/Phone Stipends 486 760 800 800 1,600 1,600 1,600 100%13 Wellness - 124 800 800 800 800 800 0%14 Medicare - Social Security 1,179 1,572 1,500 1,500 1,600 1,600 1,600 7%15 Retirement 10,663 14,652 20,700 18,000 18,800 18,800 18,800 4%16 Insurance Benefits 32,714 32,598 36,700 36,700 40,300 40,300 40,300 10%17 Workers Compensation 681 806 1,300 1,300 1,400 1,400 1,400 8%18 Total Personnel Services 120,473 151,963 155,600 152,900 162,500 162,500 162,500 6%
GeneralFundParkOperations
The Public Works Department Parks Division is funded by City policy using general fund revenues. Additional revenue for Parks operations will also be provided from the rental of property purchased at 1590 Chemawa Road North and includes rental of a house and lease of a filbert orchard. Additional revenue will come from the lease of property in Bair Park for a cellular communications tower. The Parks Division goal is to continue providing clean, safe, open spaces and river access for structured and unstructured recreation.
The Parks Division has two full-time employees and supplements staffing in the summer months through a temporary agency. The primary focus of Parks Staff is on maintenance of the Parks system with emphasis on mowing, garbage collection, and maintenance of the various park amenities. Repair or replacement of broken and/or damaged play structures, drinking fountains, and other amenities occur as needed with available funding. The Splash Fountain located at Chalmers Jones Park will operate on the same schedule as the last budget cycle. This additional operation is available because of increased funding for temporary employees.
Personnel Services
47%
Materials &
Services49%
Capital Outlay
4%
148

GeneralFundParkOperations
ACTUAL ACTUAL BUDGETED PROJECTED PROPOSED APPROVED ADOPTED % CHANGE2013-14 2014-15 2015-16 2015-16 2016-17 2016-17 2016-17 FROM PROJ
19 Materials & Services:20 Parks Materials & Supplies 16,168 23,935 30,000 30,000 30,000 30,000 30,000 0%21 Meetings, Travel & Training 219 789 1,500 1,000 1,500 1,500 1,500 50%22 Public Notices 307 152 - 400 400 400 400 0%23 Contractual Services 71,507 71,363 70,000 81,800 82,200 82,200 82,200 0%24 Utilities 4,688 3,923 4,700 3,900 4,200 4,200 4,200 8%25 Telephone 1,858 1,269 1,700 1,300 1,500 1,500 1,500 15%26 Auto Insurance 1,537 59 - - - - - 27 Gasoline 6,226 7,621 7,500 6,500 7,500 7,500 7,500 15%28 Vehicle Maintenance 2,069 2,438 2,500 3,000 3,500 3,500 3,500 17%29 Equipment Maintenance 3,102 4,090 4,000 4,000 4,000 4,000 4,000 0%30 Medical Testing 274 185 - - - - - 31 Grant Program - 2,930 20,000 20,000 20,000 20,000 20,000 0%32 Park Rental Program Expenses 4,548 2,479 6,000 6,000 6,000 6,000 6,000 0%33 Little League Park Maintenance 20,957 10,049 15,000 10,000 6,000 6,000 6,000 -40%34 Total Materials & Services 133,460 131,283 162,900 167,900 166,800 166,800 166,800 -1%35 Capital Outlay:36 Field Equipment 9,899 4,209 3,000 3,000 4,000 4,000 4,000 33%37 Capital Improvements 18,287 3,261 11,000 11,000 11,100 11,100 11,100 1%38 Total Capital Outlay 28,186 7,470 14,000 14,000 15,100 15,100 15,100 8%39 Reserves:40 Grant Program Reserve - - 5,000 - - - - 41 Total Requirements 282,119$ 290,716$ 337,500$ 334,800$ 344,400$ 344,400$ 344,400$ 3%
Budget Notes:Expenditures:
7
Personnel Services:8
9
Materials & Services:3133
Capital Outlay:37
Little League Park Maintenance includes $2,000 for porta potties, $2,400 for fertilization and weed control, $1,000 for restroom supplies, $600 for equipment maintenance (mower).
The Budget provides a 1.5% and a 2.0% wage and salary increase for all non-represented and staff represented by the Local 320, respectively. In addition step increases for those eligible as provided for in the Union Contract and City Personnel Policies.
Grant funds will be allocated to citizen sponsored projects and are to be approved by the Parks Board.
Capital improvements include resurfacing the south parking lot at Claggett Creek Park.
Parks General Support Resources equal at least 2.5% of General Fund budgeted revenues as is the policy of the City. The FY16-17 budget is 3.6% of budgeted revenues.
The Public Works Director is budgeted in the Public Works section of the Administrative Services Fund and costs are charged back to the General Fund.For additional information on employee benefits see the Summary of Fringe Benefits in the Supplemental Section.
149

ACTUAL ACTUAL BUDGETED PROJECTED PROPOSED APPROVED ADOPTED % CHANGE2013-14 2014-15 2015-16 2015-16 2016-17 2016-17 2016-17 FROM PROJ
1 RESOURCES:2 Beginning Balances:3 Dog Park Donations 528$ 528$ -$ -$ -$ -$ -$ 4 Recreation Donations 314 - - - - - - 5 Park Donations 1,494 5,590 - - - - - 6 Developers Tree Reimbursements 4,889 4,889 4,700 8,300 - - - -100%7 Boat Ramp Grant 165 - - - - - - 8 Keizer Rotary Amphitheater Fees 7,638 8,275 7,500 6,700 - - - -100%9 Total Beginning Balances 15,028 19,282 12,200 15,000 - - - -100%
10 Revenues:11 Intergovernmental:12 MAP Boat Ramp Grant 4,100 4,100 4,100 4,700 4,700 4,700 4,700 0%13 Charges for Services:14 Amphitheater Rental Fees 3,752 2,951 2,500 3,000 3,000 3,000 3,000 0%15 Miscellaneous:16 Dog Park Donations - 1,600 - - - - - 17 Park Donations 8,752 925 - - - - - 18 Developers Tree Reimbursements - 3,723 - - - - - 19 Total Miscellaneous 8,752 6,248 - - - - - 20 Total Resources 31,632 32,580 18,800 22,700 7,700 7,700 7,700 -66%21 Expenditures:22 Materials & Services:23 Dog Park Projects - 2,200 600 600 - - - -100%24 Recreation Projects 2,915 2,000 2,000 2,000 2,000 2,000 2,000 0%25 Park Projects 4,656 4,016 - - - - - 26 Boat Ramp Maintenance 3,115 5,945 4,100 4,100 4,700 4,700 4,700 15%27 Developers Tree Expenses - 240 4,700 4,700 4,700 4,700 4,700 0%28 Keizer Rotary Amphitheater 3,114 4,463 10,000 10,000 10,000 10,000 10,000 0%29 Total Materials & Services 13,800 18,865 21,400 21,400 21,400 21,400 21,400 0%30 Total Expenditures 13,800$ 18,865$ 21,400$ 21,400$ 21,400$ 21,400$ 21,400$ 0%
Budget Notes:Expenditures:
28 Upon completion of the concert series, $2,000 will be paid to the operator as a general sponsorship/stipend in support of the amphitheater concert series.
GeneralFundParkDedicatedFunds
150

ACTUAL ACTUAL BUDGETED PROJECTED PROPOSED APPROVED ADOPTED % CHANGE2013-14 2014-15 2015-16 2015-16 2016-17 2016-17 2016-17 FROM PROJ
1 Revenues:2 Licenses & Fees:3 Sign Permits 2,785$ 5,400$ 4,000$ 4,000$ 4,000$ 4,000$ 4,000$ 0%4 Land Use Application Fees 12,373 24,356 18,000 5,000 18,000 18,000 18,000 260%5 Building Fees - Zoning 25,326 36,613 45,000 50,000 30,000 30,000 30,000 -40%6 Permit Administrative Fee 17,083 24,827 25,000 35,000 20,000 20,000 20,000 -43%7 Facility Fee - 3,074 2,000 2,000 2,000 2,000 2,000 0%8 Total Licenses & Fees 57,567 94,269 94,000 96,000 74,000 74,000 74,000 -23%9 Intergovernmental:
10 Grants - - 165,000 - - - - 11 Charges for Services:12 Nuisance Abatement 523 2,598 15,000 5,000 5,000 5,000 5,000 0%13 Total Revenues 58,090 96,867 274,000 101,000 79,000 79,000 79,000 -22%14 Expenditures:15 Personnel Services:16 Community Development Director 103,090 105,654 106,900 106,900 108,600 108,600 108,600 2%17 Code Compliance Officer - 9,435 39,600 39,600 40,700 40,700 40,700 3%18 Planning Staff 130,260 137,877 145,000 145,000 149,300 149,300 149,300 3%19 Administrative Support 48,734 51,490 53,700 53,700 54,500 54,500 54,500 1%20 Stormwater Technician 1,948 2,150 2,700 2,700 3,000 3,000 3,000 11%21 Overtime - - 2,500 - 1,000 1,000 1,000 22 Cell Phone Stipend 1,487 1,593 1,800 3,400 3,400 3,400 3,400 0%23 Wellness 548 1,074 1,900 1,400 1,900 1,900 1,900 36%24 Medicare 4,355 4,721 5,500 5,500 5,500 5,500 5,500 0%25 Retirement 52,377 57,300 82,600 79,500 81,200 81,200 81,200 2%26 Insurance Benefits 63,524 77,623 91,800 91,800 97,700 97,700 97,700 6%27 Workers Compensation 483 645 900 1,100 1,100 1,100 1,100 0%28 Total Personnel Services 406,806 449,562 534,900 530,600 547,900 547,900 547,900 3%
include services to the public for development relative to zoning, land dividing, and floodplain management. Code Enforcement regulates zoning violations, solid waste, noxious weeds and unsafe housing issues. Building Permit Administration connects development with other appropriate staff within the City, and to Marion County, implementing the new statewide permit system.
The Community Development Department provides a variety of services that are important to the economic wellbeing and quality of life of Keizer businesses and residents. Services include managing the City development activities, Urban Renewal activities, community plans, building permit processes, and enforcing City codes. Long-range planning activities include policy issues regarding management of the Comprehensive Plan, State Planning requirements including Periodic Review, Transportation Planning, and development of specific plans such as Master Plans, developing code revisions and ordinance development. Current planning activities
GeneralFundCommunityDevelopment
Personnel Services
85%
Materials &
Services15%
151

GeneralFundCommunityDevelopment
ACTUAL ACTUAL BUDGETED PROJECTED PROPOSED APPROVED ADOPTED % CHANGE2013-14 2014-15 2015-16 2015-16 2016-17 2016-17 2016-17 FROM PROJ
29 Materials & Services:30 Mapping Supplies & Services 185 212 500 200 300 300 300 50%31 Uniforms - 472 700 400 500 500 500 25%32 Postage & Printing - 117 3,000 500 3,000 3,000 3,000 500%33 Meetings, Travel & Training 385 745 7,200 2,000 7,200 7,200 7,200 260%34 Public Notices 2,663 2,376 2,500 2,500 2,500 2,500 2,500 0%35 Hearings Officer 3,250 3,000 4,000 1,500 3,500 3,500 3,500 133%36 Auto Insurance 427 463 1,000 1,000 1,100 1,100 1,100 10%37 Gasoline & Vehicle Maintenance 930 444 2,000 1,000 1,000 1,000 1,000 0%38 Nuisance Abatement 6,993 3,615 15,000 5,000 5,000 5,000 5,000 0%39 Operating Equipment - 505 1,700 500 500 500 500 0%40 Medical Testing - 43 - - - - - 41 Land Conservation Grant 1,572 - - - - - - 42 TGM Grant - - 165,000 - - - - 43 UGB Land Use Analysis - - 35,000 - 70,000 70,000 70,000 44 Total Materials & Services 16,405 11,992 237,600 14,600 94,600 94,600 94,600 548%45 Total Expenditures 423,211$ 461,553$ 772,500$ 545,200$ 642,500$ 642,500$ 642,500$ 18%
Budget Notes:Revenues:
56
Expenditures:Personnel Services:
15
Materials & Services:3334
43
Meetings, Travel & Training includes $5,000 for a national conference and $1,600 for memberships plus $600 for the Code Compliance training and memberships.Funding is provided for the periodic review order compliance for the UGB expansion project.
Postage & Printing costs provide for a mass mailing should legal mandates require one in FY16-17.
Building Fees and Permit Administration Fees will increase due to Keizer Station Area C and Area D building activity and new subdivision applications.
For additional information on employee benefits see the Summary of Fringe Benefits in the Supplemental Section.
The Budget provides a 1.5% for all non-represented staff, respectively. In addition step increases for those eligible as provided for in the City Personnel Policies.
152

ACTUAL ACTUAL BUDGETED PROJECTED PROPOSED APPROVED ADOPTED % CHANGE2013-14 2014-15 2015-16 2015-16 2016-17 2016-17 2016-17 FROM PROJ
1 Revenues:2 Intergovernmental:3 Peer Court JABG Grant 4,845$ 3,340$ -$ -$ -$ -$ -$ 4 Fines & Forfeits:5 Municipal Court Fines 213,959 148,592 225,000 225,000 225,000 225,000 225,000 0%6 Past Due Collections 182,033 172,208 165,000 165,000 165,000 165,000 165,000 0%7 Peer Court Fees 5,230 1,874 3,000 3,000 3,000 3,000 3,000 - 8 Total Fines & Forfeits 401,222 322,674 393,000 393,000 393,000 393,000 393,000 - 9 Miscellaneous:
10 Peer Court Donations - 3,278 11,200 11,200 11,200 11,200 11,200 11 Interest Past Due Collections - - 18,600 1,500 1,500 1,500 1,500 12 Total Miscellaneous - 3,278 29,800 12,700 12,700 12,700 12,700 - 13 Total Revenues 406,067 329,292 422,800 405,700 405,700 405,700 405,700 0%
GeneralFundFinance‐MunicipalCourtThe Municipal Court administers the judicial system for the City of Keizer. The Court handles traffic infractions, City code violations and limited Juvenile status violations into Court proceedings, all enforced by the Keizer Police Department. Municipal Court arraignments and hearings are held weekly in the City Hall Council Chambers. An independent contractor serves as the Municipal Court Judge. Staff provides excellent customer service by encouraging compliance with manageable payment schedules and opportunities to fulfill court orders and requirements.
$100,000
$150,000
$200,000
$250,000
$300,000
$350,000
$400,000
$450,000
$500,000
$550,000
$600,000
2013-14 2014-15 2015-16 2015-16 2016-17 2016-17 2016-17
ACTUAL ACTUAL BUDGETED PROJECTED PROPOSED APPROVED ADOPTED
Fines & FeesMunicipal Court Fines Past Due Collections Total
153

GeneralFundFinance‐MunicipalCourt
ACTUAL ACTUAL BUDGETED PROJECTED PROPOSED APPROVED ADOPTED % CHANGE2013-14 2014-15 2015-16 2015-16 2016-17 2016-17 2016-17 FROM PROJ
14 Expenditures:15 Personnel Services:16 Court Clerks 69,259 59,517 53,100 53,100 53,500 53,500 53,500 1%17 Overtime 687 280 500 500 500 500 500 0%18 Wellness 191 307 500 500 500 500 500 0%19 Medicare 1,078 924 900 900 900 900 900 0%20 Retirement 9,953 8,639 10,000 10,000 10,200 10,200 10,200 2%21 Insurance Benefits 24,559 25,715 21,400 21,400 22,700 22,700 22,700 6%22 Workers Compensation 135 136 100 100 200 200 200 100%23 Total Personnel Services 105,862 95,518 86,500 86,500 88,500 88,500 88,500 2%24 Materials & Services:25 Materials & Supplies 343 700 500 500 500 500 500 0%26 Meetings, Travel & Training 548 100 1,000 500 1,000 1,000 1,000 100%27 Judge's Services 15,367 14,098 16,000 16,000 16,000 16,000 16,000 0%28 Other Contractual Services 5,238 5,239 7,500 7,500 7,500 7,500 7,500 0%29 Peer Court 22,470 20,837 24,700 24,700 24,700 24,700 24,700 0%30 Collections Cost 525 733 800 800 800 800 800 0%31 Interagency Assessments 66,105 42,242 72,300 62,000 66,300 66,300 66,300 7%32 Total Materials & Services 110,596 83,949 122,800 112,000 116,800 116,800 116,800 4%33 Total Expenditures 216,458$ 179,467$ 209,300$ 198,500$ 205,300$ 205,300$ 205,300$ 3%
Budget Notes:5
Expenditures:Personnel Services:
15
Materials & Services:31
The Budget provides a 1.5% salary increase for all non-represented staff. In addition step increases for those eligible as provided for in the City Personnel Policies. For additional information on employee benefits see the Summary of Fringe Benefits in the Supplemental Section.
Interagency Assessments are approximately 17% of citation revenue
Municipal Court Fines are expected to remain consistent with the prior year.
PersonnelServices43%
Materials&Services57%
154

ACTUAL ACTUAL BUDGETED PROJECTED PROPOSED APPROVED ADOPTED % CHANGE2013-14 2014-15 2015-16 2015-16 2016-17 2016-17 2016-17 FROM PROJ
RESOURCES:Beginning Balances:
1 Reserve Donations 2,079$ 2,379 2,600$ -$ -$ -$ -$ 2 K-9 Donations 6,645 12,575 14,500 18,800 16,600 16,600 16,600 -12%3 Civil/Criminal Forfeitures 128,272 82,573 132,800 113,200 76,700 76,700 76,700 -32%4 Total Beginning Balances 136,996 97,527 149,900 132,000 93,300 93,300 93,300 -29%5 Revenues:6 Intergovernmental:7 Special Duty Officers 2,555 2,504 5,000 3,000 3,000 3,000 3,000 0%8 School Resource Contract 149,606 154,328 159,700 163,500 168,000 168,000 168,000 3%9 Materials & Services Grants 5,289 5,500 17,900 17,900 5,000 5,000 5,000 -72%
10 Overtime Grants 10,727 1,872 2,000 3,000 2,000 2,000 2,000 -33%11 Total Intergovernmental 168,177 164,204 184,600 187,400 178,000 178,000 178,000 -5%12 Fines & Forfeits:13 Impound Fees 21,705 780 1,000 - - - - 14 Civil/Criminal Forfeitures 25,165 65,404 25,000 - - - - 15 Total Fines & Forfeits 46,870 66,184 26,000 - - - - 16 Miscellaneous:17 Police Testing Reimbursements 540 825 - 600 - - - -100%18 Reserve Officer Donations 300 300 - - - - - 19 Police Donations 1,750 3,136 - 400 - - - -100%20 K-9 Donations 17,728 9,303 - 800 8,000 8,000 8,000 900%21 Event Overtime Reimbursements - 3,413 5,000 4,000 - - - -100%22 Miscellaneous 17,242 15,903 15,000 15,000 15,000 15,000 15,000 0%23 Total Miscellaneous 37,560 32,879 20,000 20,800 23,000 23,000 23,000 11%24 TOTAL RESOURCES 389,603 360,794 380,500 340,200 294,300 294,300 294,300 -13%
GeneralFund
PoliceOperations
The mission of the Keizer Police Department is to help the community maintain order while promoting safety and freedom and building public confidence.
155

GeneralFund
PoliceOperations
ACTUAL ACTUAL BUDGETED PROJECTED PROPOSED APPROVED ADOPTED % CHANGE2013-14 2014-15 2015-16 2015-16 2016-17 2016-17 2016-17 FROM PROJ
25 Expenditures:26 Personnel Services:27 Chief of Police 102,755 115,562 120,400 120,400 125,800 125,800 125,800 4%28 Deputy Chief 106,716 112,368 117,000 117,000 118,800 118,800 118,800 2%29 Lieutenants 240,376 285,987 297,700 260,300 282,900 282,900 282,900 9%30 Sergeants 518,300 516,844 527,600 542,300 542,700 542,700 542,700 0%31 Police Officers 1,810,858 1,868,523 1,982,200 1,946,000 1,935,700 1,935,700 1,935,700 -1%32 Community Service
Officer/Evidence Specialist 37,848 40,082 44,200 34,000 44,200 44,200 44,200 30%33 Administrative Support 377,906 394,212 403,900 403,900 393,600 393,600 393,600 -3%34 Reserve Officers 649 - 1,500 - - - - 35 Overtime 126,466 122,070 130,400 156,000 156,000 156,000 156,000 0%36 Overtime - Grant Programs 12,784 10,142 12,000 12,000 12,000 12,000 12,000 0%37 Overtime - Community Events 7,300 9,321 8,800 8,800 5,500 5,500 5,500 -38%38 On Call Duty Pay - - - - 18,200 18,200 18,200 39 Clothing, Cell Phone Stipends 34,113 32,435 42,200 39,000 40,500 40,500 40,500 4%40 Wellness 10,684 10,086 16,700 10,000 15,000 15,000 15,000 50%41 Medicare SSI 57,911 56,567 53,900 58,000 60,000 60,000 60,000 3%42 Retirement & VEBA 691,750 738,012 933,700 900,000 912,000 912,000 912,000 1%43 Insurance Benefits 746,049 807,193 923,300 868,000 941,800 941,800 941,800 9%44 Workers Compensation 33,506 49,704 38,500 38,500 39,500 39,500 39,500 3%45 Total Personnel Services 4,915,971 5,169,107 5,654,000 5,514,200 5,644,200 5,644,200 5,644,200 2%
Personnel Services
86%
Materials & Services
13%
Capital Outlay
1%
156

GeneralFund
PoliceOperationsACTUAL ACTUAL BUDGETED PROJECTED PROPOSED APPROVED ADOPTED % CHANGE2013-14 2014-15 2015-16 2015-16 2016-17 2016-17 2016-17 FROM PROJ
46 Materials & Services:47 Office Materials & Supplies 9,705 - - - - - - 48 Cadet Program 852 507 2,500 2,500 2,500 2,500 2,500 0%49 Reserve Officer Program 690 13,370 21,000 21,000 21,000 21,000 21,000 0%50 K-9 Donation Expense 1,128 2,989 3,000 - 3,000 11,000 11,000 51 Clothing & Duty Gear 27,896 21,680 24,000 48,000 24,000 24,000 24,000 -50%52 Civil/Criminal Forfeiture Expense 13,749 1,095 36,500 37,500 5,000 5,000 5,000 -87%53 K-9 Program 3,150 4,779 5,000 5,500 13,500 5,500 5,500 0%54 Postage & Printing 3,529 - - - - - - 55 Association Memberships - 1,849 2,000 2,000 2,000 2,000 2,000 0%56 Meetings, Travel & Training 24,822 28,086 40,900 40,900 34,000 34,000 34,000 -17%57 Tuition Reimbursement - 1,424 3,000 - 3,000 3,000 3,000 58 Public Notices 192 684 500 500 500 500 500 0%59 Labor Attorney 32,687 54,779 40,000 60,000 30,000 30,000 30,000 -50%60 Contractual Services 1,892 8,882 6,500 4,500 5,000 5,000 5,000 11%61 Labor 3,421 4,537 - - - - - 62 Telephone/Internet Service 14,618 13,109 15,000 15,000 15,000 15,000 15,000 0%63 Auto Insurance 11,952 17,866 18,900 19,700 21,600 21,600 21,600 10%64 Office Equipment Rental 1,532 1,343 2,000 1,500 2,000 2,000 2,000 33%65 Gasoline 74,196 59,708 90,000 48,000 55,000 55,000 55,000 15%66 Vehicle Maintenance 15,549 35,540 32,000 28,000 32,000 32,000 32,000 14%67 Equipment Maintenance 3,505 956 2,000 1,000 3,500 3,500 3,500 250%68 Community Events Materials 2,639 810 1,800 800 3,000 3,000 3,000 275%69 Operating Materials 22,044 9,454 12,000 12,500 14,000 14,000 14,000 12%70 Ammo & Weapons 12,054 14,898 12,000 12,000 12,000 12,000 12,000 0%71 Durable Goods - 12,257 11,000 24,000 8,000 8,000 8,000 -67%72 Willamette Valley Comm Center 358,367 371,599 401,300 401,300 429,400 429,400 429,400 7%73 Salem Radio Bandwidth 31,164 28,728 30,800 30,800 34,000 34,000 34,000 10%74 RAIN 7,178 7,410 8,100 7,600 8,400 8,400 8,400 11%75 PRIORS 42,620 44,200 47,300 47,500 49,200 49,200 49,200 4%76 Investigations 8,752 6,238 10,000 5,500 10,000 10,000 10,000 82%77 Donation Expense - 2,355 - - - - - 78 Applicant Testing Expense 2,950 2,030 3,000 2,000 3,000 3,000 3,000 50%79 Total Materials & Services 732,833 773,163 882,100 879,600 843,600 843,600 843,600 -4%80 Capital Outlay:81 K-9 Dog 10,670 - - - - - - 82 Computer Equipment 6,800 - - - - - - 83 Furniture 17,273 - - - - - - 84 Uniforms & Equipment 15,002 14,719 - - - - - 85 Vehicles - 18,952 - - - - - 86 Total Capital Outlay 49,745 33,671 - - - - - 87 Total Expenditures 5,698,549$ 5,975,941$ 6,536,100$ 6,393,800$ 6,487,800$ 6,487,800$ 6,487,800$ 1%
157

GeneralFund
PoliceOperations
Budget Notes:Revenues:
8
14
Personnel Services:26
35
Materials & Services:4749
515456
5960
636571
Auto insurance premiums will increase up to 10%. The increases result from claim loss settlements from prior years.
FY16 included a second speed radar trailer ($8,000) and "go" bags for active shooter response ($10,000).
Office Materials & Supplies are tracked in the Administrative Services Fund, City-Wide Administration account.This line-item includes all direct costs associated with Reserve Officers, including training, uniforms, and equipment, to provide an accurate accounting of the cost of this program.
Postage & Printing costs are tracked in the Administrative Services Fund, City-Wide Administration account.
The Salem-Keizer School District contracts with the Keizer Police Department to provide School Resource Officers. The School District reimburses the City 40% of two School Resource Officer's yearly salary (1/2 the cost for 9.5 months of the school year), benefits & equipment needs and 20% of such costs for the sergeant who supervises the program.Civil Forfeiture can be used only to support law enforcement operations, not personnel costs, and may be spent on such costs as equipment, training, and investigations.
The change is a reflection of the price of gasoline from a conservative prediction of $3.50 for FY15 to $2.50 per gallon, times 21,000 gallons.
FY16 training expenses were offset by $10,600 in grants ($40,900 - 10,600 = $30,300). FY17 training includes one-time costs to send one member to the FBI National Academy and two members to a conference on Problem-Oriented Policing.
Increased costs reflect contracted chaplaincy services, professional services to computer forensics investigators, and the Oregon Accreditation Alliance, a law enforcement accrediting association.
The Budget provides a 1.5% wage and salary increase for all non-represented staff. Represented staff receive a 1.5% increase in July and a 1.0% increase in January as provided for in the Keizer Police Association Union Contract. In addition step increases for those eligible as provided for in the Union Contract and City Personnel Policies. Overtime costs are dependent upon after-hours investigations and court appearances. Training rarely incurs overtime. Overtime costs are about 6% of sworn staff wages.
Labor Attorney costs are for union negotiations including dispute resolution.
FY16 included $24,000 in rain/cold weather costs and pants, replacing similar ten-year old gear.
158
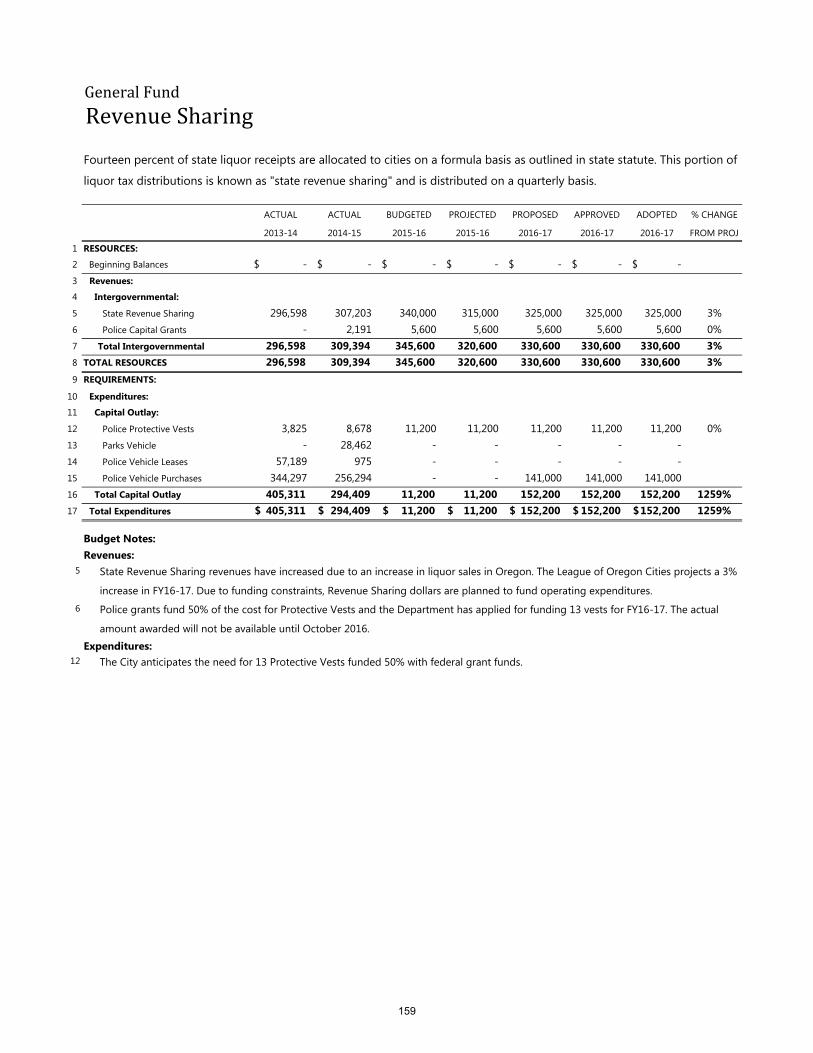
ACTUAL ACTUAL BUDGETED PROJECTED PROPOSED APPROVED ADOPTED % CHANGE
2013-14 2014-15 2015-16 2015-16 2016-17 2016-17 2016-17 FROM PROJ1 RESOURCES:2 Beginning Balances -$ -$ -$ -$ -$ -$ -$ 3 Revenues: 4 Intergovernmental:5 State Revenue Sharing 296,598 307,203 340,000 315,000 325,000 325,000 325,000 3%6 Police Capital Grants - 2,191 5,600 5,600 5,600 5,600 5,600 0%7 Total Intergovernmental 296,598 309,394 345,600 320,600 330,600 330,600 330,600 3%8 TOTAL RESOURCES 296,598 309,394 345,600 320,600 330,600 330,600 330,600 3%9 REQUIREMENTS:
10 Expenditures: 11 Capital Outlay:
12 Police Protective Vests 3,825 8,678 11,200 11,200 11,200 11,200 11,200 0%13 Parks Vehicle - 28,462 - - - - - 14 Police Vehicle Leases 57,189 975 - - - - - 15 Police Vehicle Purchases 344,297 256,294 - - 141,000 141,000 141,000 16 Total Capital Outlay 405,311 294,409 11,200 11,200 152,200 152,200 152,200 1259%17 Total Expenditures 405,311$ 294,409$ 11,200$ 11,200$ 152,200$ 152,200$ 152,200$ 1259%
Budget Notes: Revenues:
5
6
Expenditures:12
Fourteen percent of state liquor receipts are allocated to cities on a formula basis as outlined in state statute. This portion of liquor tax distributions is known as "state revenue sharing" and is distributed on a quarterly basis.
GeneralFund
RevenueSharing
State Revenue Sharing revenues have increased due to an increase in liquor sales in Oregon. The League of Oregon Cities projects a 3% increase in FY16-17. Due to funding constraints, Revenue Sharing dollars are planned to fund operating expenditures.Police grants fund 50% of the cost for Protective Vests and the Department has applied for funding 13 vests for FY16-17. The actual amount awarded will not be available until October 2016.
The City anticipates the need for 13 Protective Vests funded 50% with federal grant funds.
159

1 RESOURCES:2 Beginning Balance: 5,833,694$ 232,300$ -$ -$ -$ -$ -$ 3 Revenues:4 Taxes & Assessments 1,225,332 1,175,799 - - - - - 5 Miscellaneous 400,850 400 - - - - - 6 Total Revenues 1,626,182 1,176,199 - - - - - 7 Other Resources:8 Debt Proceeds 3,817,323 71,477 - - - - - 9 TOTAL RESOURCES 11,277,199 1,479,976 - - - - - 10 REQUIREMENTS:11 Expenditures:12 Materials & Services 317,537 122,813 - - - - - 13 Capital Outlay 3,725,193 501 - - - - - 14 Debt Service 7,002,168 1,356,662 - - - - - 15 Total Expenditures 11,044,898 1,479,976 - - - - - 16 Fund Balance:17 Restricted 232,301 - - - - - - 18 TOTAL REQUIREMENTS 11,277,199$ 1,479,976$ -$ -$ -$ -$ -$
UrbanRenewalDistrict
Summary
APPROVED 2016-17
ADOPTED 2016-17
% CHANGE FROM PROJ
ACTUAL 2013-14
ACTUAL 2014-15
BUDGETED 2015-16
PROJECTED 2015-16
PROPOSED 2016-17
The North River Road Urban Renewal Plan was completed in fiscal year 2014-15 and the District was closed.
160

1 RESOURCES:2 Beginning Balance: 616,090$ 51,837$ -$ -$ -$ -$ -$ 3 Revenues:4 Miscellaneous:5 Interest 1,460 - - - - - 6 Total Miscellaneous 1,460 - - - - - - 7 TOTAL RESOURCES 617,550 51,837 - - - - - 8 REQUIREMENTS:9 Expenditures:10 Materials & Services:11 Legal Services 200,129 126 - - - - - 12 Repayment to Taxing Jurisdictions - 51,711 - - - - - 13 Miscellaneous Expense 84 - - - - - - 14 Total Materials & Services 200,213 51,837 - - - - - 15 Debt Service:16 Assessment Payment on Foreclosures 365,500 - - - - - - 17 Total Expenditures 565,713 51,837 - - - - - 18 Fund Balance:19 Restricted 51,837 - - - - - - 20 TOTAL REQUIREMENTS 617,550$ 51,837$ -$ -$ -$ -$ -$
UrbanRenewalDistrict
ProgramIncomeFund
APPROVED 2016-17
ADOPTED 2016-17
% CHANGE FROM PROJ
ACTUAL 2013-14
ACTUAL 2014-15
BUDGETED 2015-16
PROJECTED 2015-16
PROPOSED 2016-17
The North River Road Urban Renewal Plan was completed in fiscal year 2014-15 and the District was closed.
161

1 RESOURCES:2 Beginning Balance: -$ -$ -$ -$ -$ -$ -$ 3 Revenues:4 Miscellaneous:5 Reimbursements 25,195 - - - - - - 6 Total Miscellaneous 25,195 - - - - - - 7 Total Revenues 25,195 - - - - - - 8 Other Resources:9 Debt Proceeds:
10 Loan Proceeds - 71,477 - - - - - 11 Bond Proceeds (from Tax Increment Fund 3,817,323 - - - - - - 12 Total Debt Proceeds 3,817,323 71,477 - - - - - 13 TOTAL RESOURCES 3,842,518 71,477 - - - - - 14 REQUIREMENTS:15 Expenditures:30 Materials & Services:31 Postage & Printing 528 - - - - - - 32 Association Memberships 516 516 - - - - - 33 Public Notices 296 786 - - - - - 34 Legal Services 1,102 846 - - - - - 35 Administrative Services Charges 114,603 65,678 - - - - - 36 Contractual Services - 2,870 - - - - - 37 Audit 250 250 - - - - - 38 Miscellaneous 29 30 - - - - - 39 Total Materials & Services 117,324 70,976 - - - - - 40 Capital Outlay:41 Property Acquisition & Development 3,725,193 501 - - - - - 42 Total Capital Outlay 3,725,193 501 - - - - - 43 Total Expenditures 3,842,517 71,477 - - - - - 44 Fund Balance:45 Restricted 1 - - - - - - 46 TOTAL REQUIREMENTS 3,842,518$ 71,477$ -$ -$ -$ -$ -$
The North River Road Urban Renewal Plan was completed in fiscal year 2014-15 and the District was closed.
UrbanRenewalDistrict
ProjectFund
% CHANGE FROM PROJ
ACTUAL 2013-14
ACTUAL 2014-15
BUDGETED 2015-16
PROJECTED 2015-16
PROPOSED 2016-17
APPROVED 2016-17
ADOPTED 2016-17
162

1 RESOURCES:2 Beginning Balance: 5,217,604$ 180,463$ -$ -$ -$ -$ -$ 3 Revenues:4 Taxes & Assessments:5 Tax Increment Revenue 1,098,053 1,112,116 - - - - - 6 Prior Year Taxes 127,279 63,683 - - - - - 7 Total Taxes & Assessments 1,225,332 1,175,799 - - - - - 8 Miscellaneous:9 Foreclosure Acquisition Funds 365,500 - - - - - - 10 Interest 8,695 400 - - - - - 11 Total Miscellaneous 374,195 400 - - - - - 12 Total Revenues13 TOTAL RESOURCES 6,817,131 1,356,662 - - - - - 14 REQUIREMENTS:15 Expenditures:16 Debt Service:17 Repayment of Tax Increment 1,364,593 - - - - - - 18 Bond Principal Payment (line of credit) 1,400,000 1,260,000 - - - - - 19 Interest on Line of Credit 54,752 25,185 - - - - - 20 Loan Payment (Project Fund) 3,817,323 71,477 - - - - - 21 Total Debt Service 6,636,668 1,356,662 - - - - - 22 Fund Balance:23 Restricted 180,463 - - - - - - 24 TOTAL REQUIREMENTS 6,817,131$ 1,356,662$ -$ -$ -$ -$ -$
UrbanRenewalDistrict
TaxIncrementFund
The North River Road Urban Renewal Plan was completed in fiscal year 2014-15 and the District was closed.
ACTUAL 2013-14
ACTUAL 2014-15
% CHANGE FROM PROJ
BUDGETED 2015-16
PROJECTED 2015-16
PROPOSED 2016-17
APPROVED 2016-17
ADOPTED 2016-17
163

ACTUAL ACTUAL BUDGETED PROJECTED PROPOSED APPROVED ADOPTED % CHANGE
2013-14 2014-15 2015-16 2015-16 2016-17 2016-17 2016-17 FROM PROJ1 RESOURCES:2 Beginning Balance: 11,071$ -$ 100$ -$ 41,300$ 41,300$ 41,300$ 3 Revenues:4 Taxes & Assessments:5 Hotel/Motel Tax - - 60,000 80,000 80,000 80,000 80,000 0%6 Charges for Services:7 Rental Fees 98,356 115,844 115,000 135,000 145,000 145,000 145,000 7%8 Miscellaneous:9 Donations 10,000 10,000 10,000 10,000 - - - -100%
10 Interest 14 - - - - - - 11 Total Miscellaneous 10,014 10,000 10,000 10,000 - - - -100%12 Total Revenues 108,370 125,844 185,000 225,000 225,000 225,000 225,000 0%13 Other Resources:14 Transfer from General Fund - 43,875 4,400 - - - - 15 TOTAL RESOURCES 119,441$ 169,719$ 189,500$ 225,000$ 266,300$ 266,300$ 266,300$ 18%16 REQUIREMENTS:17 Expenditures:18 Personnel Services:19 Event Center Coordinator 15,045 31,961 31,800 31,800 37,900 37,900 37,900 19%20 Temporary Help 12,458 13,504 20,000 20,000 21,500 21,500 21,500 8%21 Overtime Costs - 357 - - - - - 22 Cell Phone Stipend 275 660 900 900 900 900 900 0%23 Wellness - - - - 400 400 400 24 Medicare 1,251 1,632 800 800 900 900 900 13%25 Retirement 2,780 5,963 8,300 8,300 9,900 9,900 9,900 19%26 Insurance 2,788 4,760 4,800 4,800 20,600 20,600 20,600 329%27 Unemployment 105 - - - - - - 28 Workers Compensation 176 375 600 600 700 700 700 17%29 Total Personnel Services 34,878 59,212 67,200 67,200 92,800 92,800 92,800 38%
The City of Keizer Community Center is a state of the art facility intended to accommodate the cultural, educational, professional, recreational, and economic needs of its citizens and the community. Rental fees help cover the operation and management of the center. During the last fiscal year, the Center has hosted a variety of events. During the week, the Center is used by many of our City Committees and local community groups such as West Keizer Neighborhood Association, Claggett Creek Watershed Council, and Keizer sports associations. On weekends, the Center has served as the venue for weddings, quinceaneras, anniversary parties, and baby/bridal showers. Keizer Parks Foundation, Union Gospel Mission, Chamber of Commerce, and other non-profit organizations have used the facility for their fundraising ventures.
CommunityCenterFund
During the last couple of years, staff has worked towards making the Center self-sustaining. City Staff manage the scheduling and coordination of the facility. Staff provide tours, answer rental inquiries, assist clients with the necessary contractual requirements (insurance, catering requirements, etc.) room sets, audio needs, and other amenities to assure the client’s event is successful. Temporary event staffing is used to provide service during the event and upon completion of the event, cleaning and resetting the venue for the next event. During the last year, promotion of the Center has taken place at bridal shows, Chamber of Commerce, Travel Salem gatherings, and membership in the Mid-Willamette Valley Wedding Pro Association.
Personnel Services
37%
Materials & Services
52%
Capital Outlay11%
164

CommunityCenterFundACTUAL ACTUAL BUDGETED PROJECTED PROPOSED APPROVED ADOPTED % CHANGE2013-14 2014-15 2015-16 2015-16 2016-17 2016-17 2016-17 FROM PROJ
30 Materials & Services:31 Materials & Supplies 980 497 800 800 800 800 800 0%32 Association Memberships 15 15 500 500 500 500 500 0%33 Legal Notices 152 - 100 100 100 100 100 0%34 Administrative Services Fund 58,656 79,024 82,300 78,000 93,400 93,400 93,400 20%35 Contractual Services 8,525 13,261 13,000 13,000 14,000 14,000 14,000 8%36 Marketing Costs 586 1,047 6,000 6,000 6,000 6,000 6,000 0%37 Janitorial Services 4,679 4,758 4,400 4,400 4,400 4,400 4,400 0%38 Utilities 5,205 5,167 5,500 5,500 5,500 5,500 5,500 0%39 Equipment Maintenance & Repair - - - - 2,200 2,200 2,200 40 Janitorial Supplies 4,790 6,008 5,000 5,000 5,000 5,000 5,000 0%41 Medical Testing 360 123 200 200 200 200 200 0%42 Total Materials & Services 83,948 109,900 117,800 113,500 132,100 132,100 132,100 16%43 Capital Outlay:44 Furnishings & Fixtures 615 607 3,000 3,000 28,000 28,000 28,000 833%45 Total Expenditures 119,441 169,719 188,000 183,700 252,900 252,900 252,900 38%46 Other Requirements:47 Contingency - - 1,500 - 11,000 11,000 11,000 48 Fund Balance:49 Assigned - - - 41,300 2,400 2,400 2,400 -94%50 TOTAL REQUIREMENTS 119,441$ 169,719$ 189,500$ 225,000$ 266,300$ 266,300$ 266,300$ 18%
ACTUAL ACTUAL BUDGETED PROJECTED PROPOSED APPROVED ADOPTED % CHANGE2013-14 2014-15 2015-16 2015-16 2016-17 2016-17 2016-17 FROM PROJ
City-Wide Administration 6,172$ 2,792$ 3,600$ 2,600$ 4,100$ 4,100$ 4,100$ 58%City Manager 4,192 3,013 2,500 2,500 2,900 2,900 2,900 16%Information Systems 5,042 4,409 7,800 7,400 9,800 9,800 9,800 32%Attorney's Office 4,943 4,267 3,000 2,900 3,800 3,800 3,800 31%City Recorder 10,848 12,397 13,400 13,400 13,900 13,900 13,900 4%Human Resources 5,274 3,286 3,400 3,400 3,600 3,600 3,600 6%Finance 45,232 48,126 45,100 42,400 51,200 51,200 51,200 21%Facility Maintenance 6,612 3,899 3,500 3,400 4,100 4,100 4,100 21%Adjustments (29,659) (3,166) - - - - - Administrative Services Charges 58,656$ 79,023$ 82,300$ 78,000$ 93,400$ 93,400$ 93,400$ 20%
Budget Notes:7
19
34
35
44
47
Furnishings and fixtures is to provide for replacement tables/chairs ($2,000), floor tiles ($2,000), two projectors ($6,000), platform stage ($3,000) and sound system ($15,000).Contingency is approximately 5% of personnel services and materials and services.
Contractual Services are primarily for event security and this cost is reimbursed through rental fees.
Rental fees are expected to remain consistent with the previous year.
Summary of Administrative Service Fund Charges
The Event Center Coordinator position will transition to a regular status position during FY16-17.Funds were not sufficient to pay the full Administrative Services Charges, therefore the General Fund paid a portion of these costs in fiscal years 2013-14 and 2014-15.
165

ACTUAL ACTUAL BUDGETED PROJECTED PROPOSED APPROVED ADOPTED % CHANGE2013-14 2014-15 2015-16 2015-16 2016-17 2016-17 2016-17 FROM PROJ
1 RESOURCES:2 Beginning Balance: 206,728$ 243,379$ 232,000$ 237,400$ 253,800$ 253,800$ 253,800$ 7%3 Revenues:4 Intergovernmental:5 PEG Fees 121,312 126,951 126,200 128,500 132,400 132,400 132,400 3%6 Miscellaneous:7 Interest Earnings/Miscellaneous 726 468 600 600 500 500 500 -17%8 TOTAL RESOURCES 328,766 370,798 358,800 366,500 386,700 386,700 386,700 6%9 REQUIREMENTS:
10 Expenditures:11 Materials & Services:12 Public Notices - 64 - - 500 500 500 13 Administrative Costs 3,239 - 2,300 2,200 6,700 6,700 6,700 205%14 Production Services - 500 - - - - - 15 Broadcasting 81,000 96,900 96,000 96,000 96,000 96,000 96,000 0%16 Total Materials & Services 84,239 97,464 98,300 98,200 103,200 103,200 103,200 5%17 Capital Outlay:18 Television Equipment 1,148 30,947 20,000 14,500 25,000 25,000 25,000 72%19 Total Expenditures 85,387 128,411 118,300 112,700 128,200 128,200 128,200 14%20 Other Requirements:21 Contingency - - 50,000 - 50,000 50,000 50,000 22 Transfers Out - 5,000 - - - - - 23 Restricted for Operations 243,379 237,387 190,500 253,800 208,500 208,500 208,500 -18%24 Total Other Requirements 243,379 242,387 240,500 253,800 258,500 258,500 258,500 2%25 TOTAL REQUIREMENTS 328,766$ 370,798$ 358,800$ 366,500$ 386,700$ 386,700$ 386,700$ 6%
Budget Notes:Revenues:
5
Expenditures:1315
18
21
The Public Education Government Fund (PEG) is a Special Revenue Fund set up to account for PEG franchise fees assessed on cable television bills. The fees are to be used exclusively for providing governmental cable programming.
Legislative action taken in fiscal year 2007-2008 continues to threaten PEG revenues. Should revenues cease by the end of the fiscal year, the ending fund balance will be sufficient to pay monthly broadcasting expenses the following year.
PublicEducationGovernmentFund
Contingency is sufficient to cover a major equipment failure.Capital Outlay expenditures are for ongoing video and television upgrades.
PEG Fees are franchise fees assessed on Comcast cable television bills; revenues continue to trend slightly upward from year to year.
The Administrative Fee pays PEGs share of the City's network costs and general administration.Costs are $8,000 per month for cable broadcasting.
166
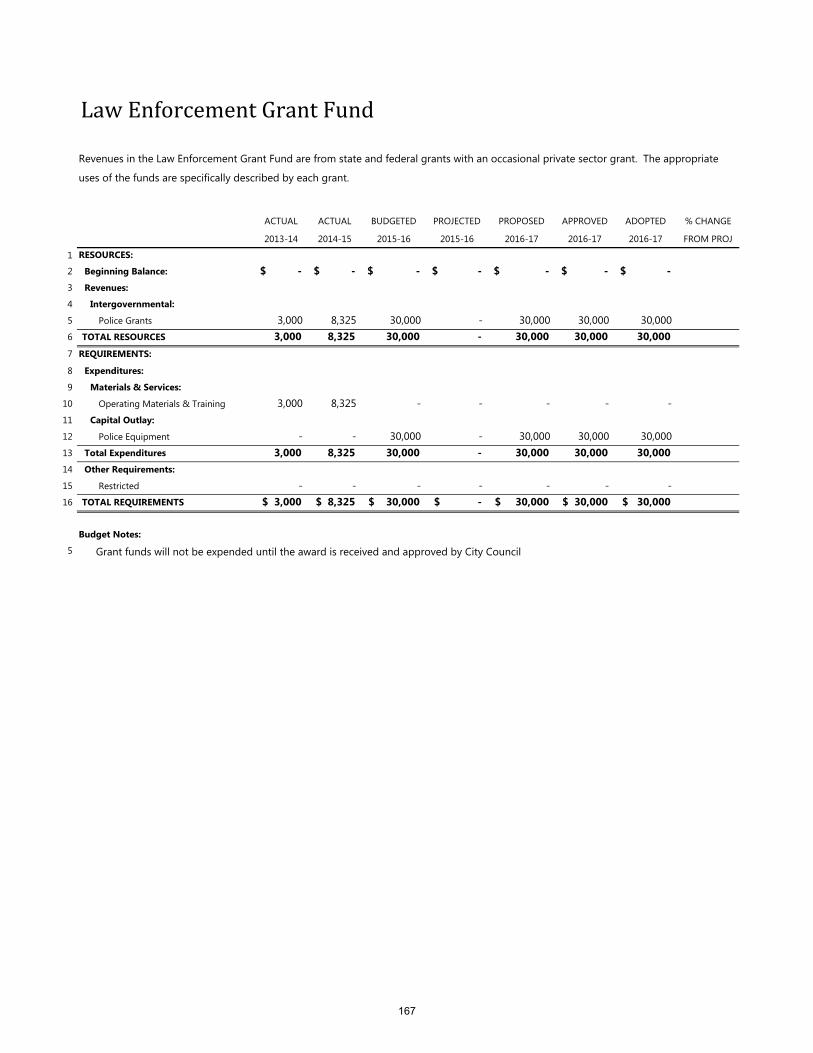
ACTUAL ACTUAL BUDGETED PROJECTED PROPOSED APPROVED ADOPTED % CHANGE2013-14 2014-15 2015-16 2015-16 2016-17 2016-17 2016-17 FROM PROJ
1 RESOURCES:2 Beginning Balance: -$ -$ -$ -$ -$ -$ -$ 3 Revenues:4 Intergovernmental:5 Police Grants 3,000 8,325 30,000 - 30,000 30,000 30,000 6 TOTAL RESOURCES 3,000 8,325 30,000 - 30,000 30,000 30,000 7 REQUIREMENTS:8 Expenditures:9 Materials & Services:
10 Operating Materials & Training 3,000 8,325 - - - - - 11 Capital Outlay:12 Police Equipment - - 30,000 - 30,000 30,000 30,000 13 Total Expenditures 3,000 8,325 30,000 - 30,000 30,000 30,000 14 Other Requirements:15 Restricted - - - - - - - 16 TOTAL REQUIREMENTS 3,000$ 8,325$ 30,000$ -$ 30,000$ 30,000$ 30,000$
Budget Notes:5 Grant funds will not be expended until the award is received and approved by City Council
LawEnforcementGrantFund
Revenues in the Law Enforcement Grant Fund are from state and federal grants with an occasional private sector grant. The appropriate uses of the funds are specifically described by each grant.
167
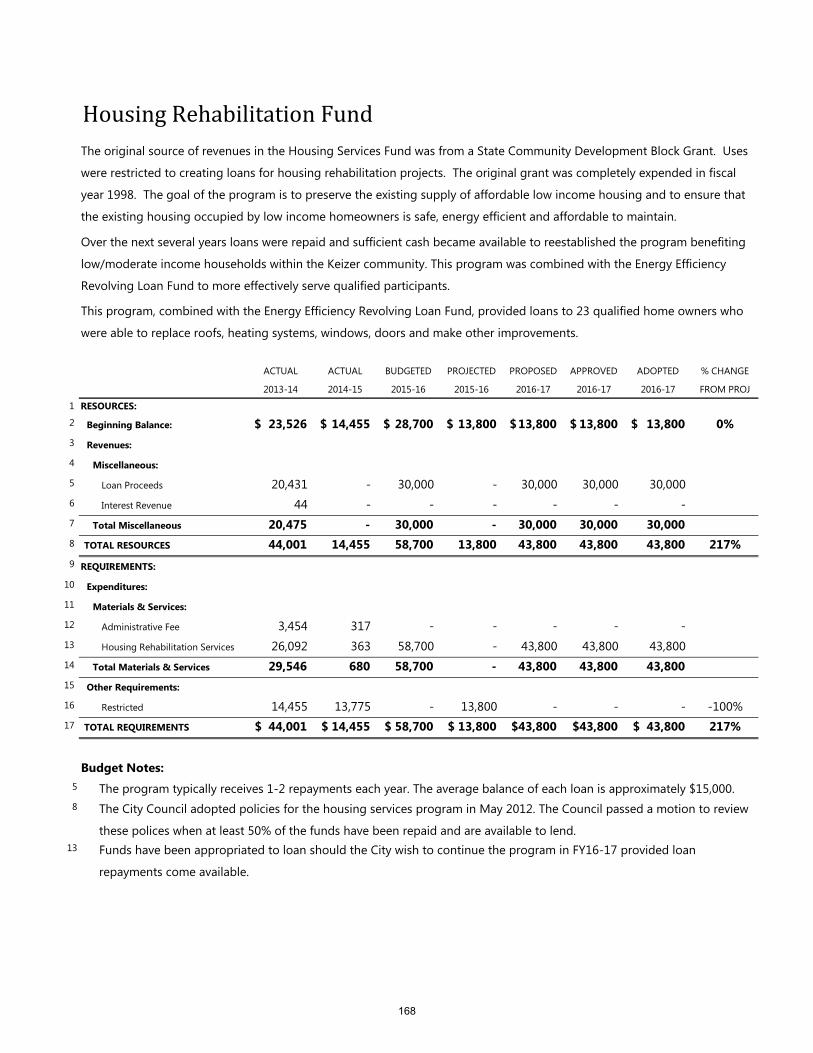
ACTUAL ACTUAL BUDGETED PROJECTED PROPOSED APPROVED ADOPTED % CHANGE2013-14 2014-15 2015-16 2015-16 2016-17 2016-17 2016-17 FROM PROJ
1 RESOURCES:2 Beginning Balance: 23,526$ 14,455$ 28,700$ 13,800$ 13,800$ 13,800$ 13,800$ 0%3 Revenues:4 Miscellaneous:5 Loan Proceeds 20,431 - 30,000 - 30,000 30,000 30,000 6 Interest Revenue 44 - - - - - - 7 Total Miscellaneous 20,475 - 30,000 - 30,000 30,000 30,000 8 TOTAL RESOURCES 44,001 14,455 58,700 13,800 43,800 43,800 43,800 217%9 REQUIREMENTS:
10 Expenditures:11 Materials & Services:12 Administrative Fee 3,454 317 - - - - - 13 Housing Rehabilitation Services 26,092 363 58,700 - 43,800 43,800 43,800 14 Total Materials & Services 29,546 680 58,700 - 43,800 43,800 43,800 15 Other Requirements:16 Restricted 14,455 13,775 - 13,800 - - - -100%17 TOTAL REQUIREMENTS 44,001$ 14,455$ 58,700$ 13,800$ 43,800$ 43,800$ 43,800$ 217%
Budget Notes:5
8
13 Funds have been appropriated to loan should the City wish to continue the program in FY16-17 provided loan repayments come available.
The program typically receives 1-2 repayments each year. The average balance of each loan is approximately $15,000.The City Council adopted policies for the housing services program in May 2012. The Council passed a motion to review these polices when at least 50% of the funds have been repaid and are available to lend.
The original source of revenues in the Housing Services Fund was from a State Community Development Block Grant. Uses were restricted to creating loans for housing rehabilitation projects. The original grant was completely expended in fiscal year 1998. The goal of the program is to preserve the existing supply of affordable low income housing and to ensure that the existing housing occupied by low income homeowners is safe, energy efficient and affordable to maintain.
Over the next several years loans were repaid and sufficient cash became available to reestablished the program benefiting low/moderate income households within the Keizer community. This program was combined with the Energy Efficiency Revolving Loan Fund to more effectively serve qualified participants.
This program, combined with the Energy Efficiency Revolving Loan Fund, provided loans to 23 qualified home owners who were able to replace roofs, heating systems, windows, doors and make other improvements.
HousingRehabilitationFund
168

ACTUAL ACTUAL BUDGETED PROJECTED PROPOSED APPROVED ADOPTED % CHANGE2013-14 2014-15 2015-16 2015-16 2016-17 2016-17 2016-17 FROM PROJ
1 RESOURCES:2 Beginning Balance: 20,402$ 3,808$ 2,300$ 2,400$ 2,400$ 2,400$ 2,400$ 0%3 Revenues:4 Miscellaneous:5 Loan Proceeds - - 15,000 - 15,000 15,000 15,000 6 Interest Revenue 37 - - - - - - 7 Total Miscellaneous 37 - 15,000 - 15,000 15,000 15,000 8 Total Revenues 37 - 15,000 - 15,000 15,000 15,000 9 TOTAL RESOURCES 20,439 3,808 17,300 2,400 17,400 17,400 17,400 625%
10 REQUIREMENTS:11 Expenditures:12 Materials & Services:13 Administrative Fee 1,476 143 - - - - - 14 Energy Efficiency Loans 15,156 1,276 17,300 - 17,400 17,400 17,400 15 Total Materials & Services 16,632 1,419 17,300 - 17,400 17,400 17,400 16 Fund Balance:17 Restricted 3,807 2,389 - 2,400 - - - -100%18 TOTAL REQUIREMENTS 20,439$ 3,808$ 17,300$ 2,400$ 17,400$ 17,400$ 17,400$ 625%
Budget Notes:
59
14
Revenues for the Energy Efficiency Fund were from the Recovery Act – Energy Efficiency and Conservation Block Grant. Uses for these funds are restricted for energy efficiency improvements within the community. The City elected to develop a revolving loan fund to complement its Housing Rehabilitation loan program. The Energy Efficiency loans will be restricted to permanent enhancements that improve energy efficiency within the residential home of low/moderate income households.
City staff will manage the program by accepting and approving qualified applications. City staff coordinates funds from the Housing Rehabilitation program to enhance the reach of this new program. Staff educates the public of these opportunities through the City’s website, Keizer 23 channel, local newsletters, the City of Keizer Facebook page and other media. This funding, combined with the Housing Services funds provided loans to 23 home owners who were able to make energy efficiency improvements to their homes.
EnergyEfficiencyRevolvingLoanFund
The program typically receives 1-2 repayments each year. The average balance of each loan is approximately $15,000.The City Council adopted policies for the Energy Efficiency Program in May 2012. The Council passed a motion to review these polices when at least 50% of the funds have been repaid and are available to lend.Funds have been appropriated to loan should the City wish to continue the program in FY16-17 provided loan repayments come available.
169

ACTUAL ACTUAL BUDGETED PROJECTED PROPOSED APPROVED ADOPTED % CHANGE2013-14 2014-15 2015-16 2015-16 2016-17 2016-17 2016-17 FROM PROJ
1 RESOURCES:2 Beginning Balance: 2,687,875$ 2,685,746$ 2,683,700$ 2,685,800$ 2,685,800$ 2,685,800$ 2,685,800$ 0%3 Revenues:4 Taxes & Assessments:5 Assessments 4,407,155 730,738 1,442,900 1,445,000 776,000 776,000 776,000 -46%6 Net foreclosure proceeds - - - - - - - 7 Total Taxes & Assessments 4,407,155 730,738 1,442,900 1,445,000 776,000 776,000 776,000 -46%8 Miscellaneous: 9 Interest 8,923 6,667 13,000 7,000 7,000 7,000 7,000 0%10 Assessment Interest 1,009,651 944,938 907,700 910,900 825,000 825,000 825,000 -9%11 Assessment Penalty 12,892 1,094 - - - - - 12 Total Miscellaneous 1,031,466 952,699 920,700 917,900 832,000 832,000 832,000 -9%13 TOTAL RESOURCES 8,126,496 4,369,183 5,047,300 5,048,700 4,293,800 4,293,800 4,293,800 -15%14 REQUIREMENTS: 15 Expenditures: 16 Debt Service: 17 Principal 4,300,000 770,000 1,490,000 1,490,000 810,000 810,000 810,000 -46%18 Interest 1,140,750 913,380 876,300 872,900 796,000 796,000 796,000 -9%19 Total Debt Service 5,440,750 1,683,380 2,366,300 2,362,900 1,606,000 1,606,000 1,606,000 -32%20 Total Expenditures 5,440,750 1,683,380 2,366,300 2,362,900 1,606,000 1,606,000 1,606,000 -32%21 Fund Balance: 22 Restricted Debt Reserve 2,685,746 2,685,803 2,681,000 2,685,800 2,687,800 2,687,800 2,687,800 0%23 TOTAL REQUIREMENTS 8,126,496$ 4,369,183$ 5,047,300$ 5,048,700$ 4,293,800$ 4,293,800$ 4,293,800$ -15%
During FY13-14 the City foreclosed on two properties which had been delinquent for over three years. Proceeds from the foreclosure were used to pay down on the City's debt. Currently, twenty-five commercial property owners owe assessments on the Keizer Station property development and all properties are current on assessment payments.
The Keizer Station Local Improvement Fund accounts for the improvements to the Keizer Station Development Project. The cost of the improvements has been assessed to those property owners who directly benefit from the project. The assessments received are used to pay off the long-term debt scheduled for maturity on June 1, 2031.
KeizerStationLIDFund
170

KeizerStationLIDFundBudget Notes:
Debt Service:16
22
Payment DatePrincipal Balance
Principal Payment
Interest Payment
Total Payment
12/1/2016 15,495,000 - 402,870 402,8706/1/2017 15,495,000 - 402,870 402,870
12/1/2017 15,495,000 - 402,870 402,8706/1/2018 15,495,000 - 402,870 402,870
12/1/2018 15,495,000 - 402,870 402,8706/1/2019 15,495,000 - 402,870 402,870
12/1/2019 15,495,000 - 402,870 402,8706/1/2020 15,495,000 - 402,870 402,870
12/1/2020 through 12/1/2030 15,495,000 - 8,460,270 8,460,270 6/1/2031 15,495,000 15,495,000 402,870 15,897,870
$15,495,000 $12,086,100 24,358,140
Bond covenants require the City to retain at least $2,681,000 in reserves
Debt Service Schedule
The City's debt obligation provides for annual interest payments on its outstanding debt each year through 2031 and one principal payment ($15,495,000 currently) due June 1, 2031. The original issue date was May 21, 2008. Semi-annual interest payments of $402,870 are due on 6/1 and 12/1 each year. The city may pay down the principal if assessment proceeds are available. The principal payment budgeted in FY16-17 assumes the City will receive the total amount of assessment payments due from each property owner.
171

Long
Range Planning
Introduction ........................................................................................................... X
General Fund ......................................................................................................... X
Civic Center Sinking Fund ...................................................................................... X
Stormwater & Water Fund .................................................................................... X
172

LongRangePlanning–Introduction Early in fiscal year 2010-11 the City began a comprehensive long-range planning process. The General Fund Long-Range Planning Task Force was established and staff developed a process for annually updating the General Fund Long-Range Plan. The Task Force is comprised of the same members as the Budget Committee and typically meets one to two months prior to the annual budget meetings. Beginning in fiscal year 2012-13 the City added long-range plans for its Water and Stormwater operations. Both utilities had updated capital improvement plans and long-range planning was essential to stabilizing customer rates. Each year the Task Force: receives an update from staff on year-to-date General Fund Revenue Status considers the variables to be used in developing the Long-Range Forecast
and provides forecast scenarios using the following risk factors: Conservative Moderate Aggressive
Through a consensus exercise the Task Force agreed on the level to be used for each variable in forecasting.
receives an updated issues list comprised of initiatives the City may wish to fund and has the Committee prioritize the issues
receives a summary of the Citizen Survey Results in the years one is conducted
173

12 Taxes & Assessments 4,835,900 4,875,800 5,055,000 5,257,000 5,467,000 3 Licenses & Fees 2,720,200 2,727,400 2,774,000 2,829,000 2,886,000 4 Intergovernmental 1,339,100 1,156,300 1,172,000 1,195,000 1,219,000 5 Fines & Forfeitures 419,000 393,000 393,000 401,000 409,000 6 Other 231,000 210,600 165,500 167,000 169,000 7 TOTAL REVENUES 9,545,200$ 9,363,100$ 9,559,500$ 9,849,000$ 10,150,000$ 89
10 Personnel Services11 Wages 4,300,200$ 4,226,600$ 4,348,200$ 4,556,900$ 4,670,800$ 12 Retirement 1,047,200 1,010,800 1,024,400 1,060,500 1,087,000 13 Health Insurance 1,083,600 1,049,900 1,072,700 1,179,400 1,296,800 14 Materials & Services 3,229,100 2,926,100 3,001,800 2,962,000 2,992,000 15 Capital Outlay 77,000 25,200 219,000 250,000 300,000 16 Overlapping Tax Jurisdiction Repaymen 541,900 541,900 209,000 209,000 209,000 17 Other - Transfers 71,800 17,400 17,400 17,400 17,400 18 TOTAL EXPENDITURES 10,350,800$ 9,797,900$ 9,892,500$ 10,235,200$ 10,573,000$ 1920 REVENUES IN EXCESS OF EXPENDITURES (805,600) (434,800) (333,000) (386,200) (423,000) 2122 BEGINNING FUND BALANCE 2,144,900 2,256,000 1,821,200 1,488,200 1,102,000 2324 ENDING FUND BALANCE 1,339,300$ 1,821,200$ 1,488,200$ 1,102,000$ 679,000$
Notes:· Historically the City has a favorable budget variance between $300,000 and $500,000
REVENUES:
BUDGETED 2015-16
General Fund Long Range ForecastCity of Keizer
Fiscal Year 2016-17
EXPENDITURES:
PROJECTED 2015-16
FORECASTED 2016-17
FORECASTED 2017-18
FORECASTED 2018-19
174

Conservative Moderate* Aggressive
FY15-16 Actual
FY16-17 Recommended
(1) 3.00% 4.00% 5.00% 4.20% 4.00%(2) Property Tax Uncollectables and Discounts 6.00% 5.50% 5.00% 5.00% 5.50%
Personnel Services Increase(3) Pay Matrix Increase - non-represented 3.00% 2.50% 2.00% 1.50% 1.50%(4) Attrition -1.00% -2.00% -3.00% -5.00% -2.00%(5) Retirement Cost Increases/(Decrease) 13.00% 10.00% 9.00% 20.00% 0.00%(6) Medical Insurance Premium Increase 12.00% 9.95% 8.00% 7.80% 6.70%(7) Materials & Services; Capital Outlay Increase 2.00% 1.00% 0.00% NA NA
*
(1)
(2)
(3)
(4)
(5)(6)
(7) The Bureau of Labor and Statistics shows a 0.7% all items index increase over the last 12 months (December 2015).
Based on 12/31/2014 PERS actuarial report projections for FY's 17-19. FY16-17 rates will be 3-4% below the long range projection as negotiated with the insurance carrier.
NA = Not Applicable as the annual budget is not prepared using a standard inflation factor.
City of Keizer permit applications show 1% growth from new construction. FY15-16 Marion County Assessor's data indicates a 4.08% increase in property valuation. Based on FY15-16 projected tax revenues collected over taxes assessed.
Based on the U.S Department of Labor, Bureau of Labor Statistics Consumer Price Index for Urban Wage Earners and Clerical Workers for Portland-Salem for non-represented employees. Represented employees based on current collective bargaining agreements. Based on ten-year average attrition.
Fiscal Year 2016-17
ACTUAL % CHANGE
Staff Recommendation for Long-Range Planning purposes.
LONG RANGE PROJECTIONS
Change in City-wide Assessed Property Valuation
General Fund Long Range Forecast Assumptions
175

Short Term Goals StatusExplore and determine policy direction regarding Urban Growth Boundary expansion
The periodic review order compliance for the UGB expansion project is included in the 2016-17 Proposed Budget
Parks Employee Not sustainable as part of the 2016-17 Proposed Budget
Police Officer(s) Not sustainable as part of the 2016-17 Proposed Budget
Stable Funding Mechanism for Parks Parks Matching Grant Program is included in the 2016-17 Proposed Budget, Park expenditures are at least 2.5% of General Fund revenues
Community Engagement/Creation of Task Force Citizen survey is included in the 2016-17 Proposed Budget
Develop Youth Council Program Budgetary impact not yet identifiedSports Facilitator Roundtable Budgetary impact not yet identifiedEvent Center Coordinator Transition from Limited Duration to Regular
The transition is anticipated in the 2016-17 Proposed Budget
Long Term Goals StatusLiquidate any Keizer Station Area A property foreclosed upon and refund the River Road Renaissance program
Properties are still subject to contractual restrictions which prevent the liquidation process
Communications Position/Volunteer Coordinator Not sustainable as part of the 2016-17 Budget
Sidewalk LID Program Budgetary impact not yet identifiedUrban Growth Boundary Issue The periodic review order compliance for the
UGB expansion project is funded for 16-17
City of KeizerGeneral Fund Long Range Forecast Initiative Update
Fiscal Year 2016-17
176
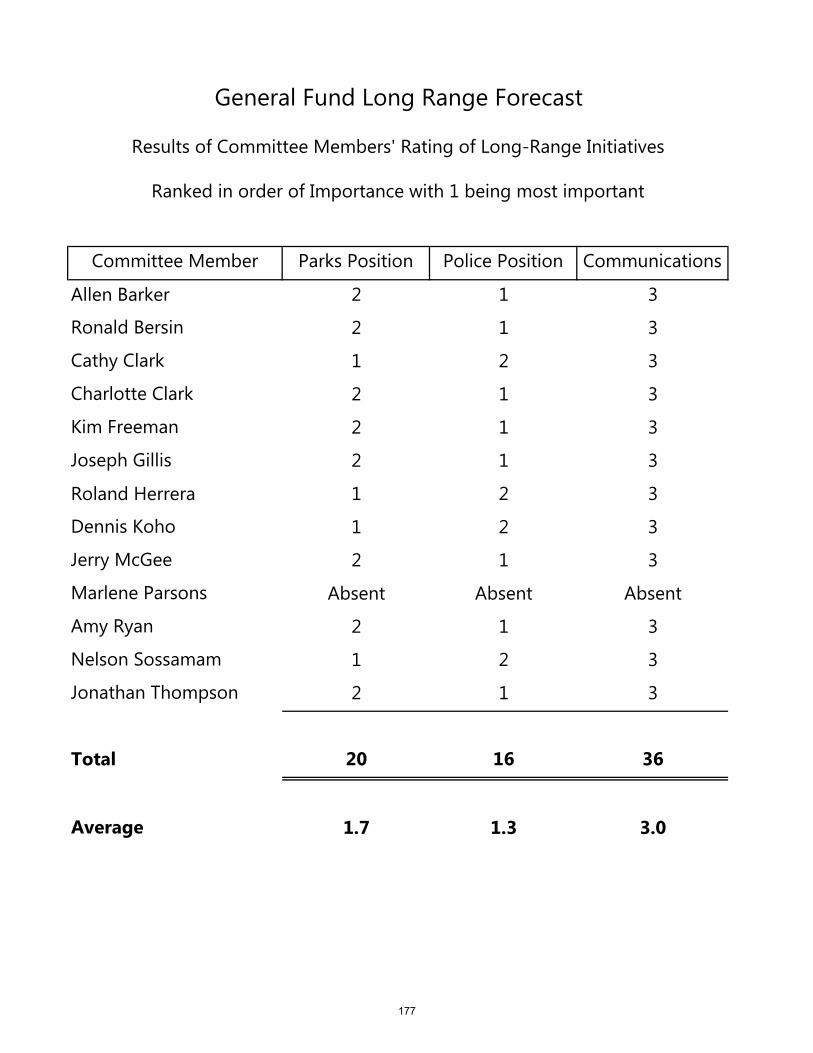
Committee Member Parks Position Police Position CommunicationsAllen Barker 2 1 3Ronald Bersin 2 1 3Cathy Clark 1 2 3Charlotte Clark 2 1 3Kim Freeman 2 1 3Joseph Gillis 2 1 3Roland Herrera 1 2 3Dennis Koho 1 2 3Jerry McGee 2 1 3Marlene Parsons Absent Absent AbsentAmy Ryan 2 1 3Nelson Sossamam 1 2 3Jonathan Thompson 2 1 3
Total 20 16 36
Average 1.7 1.3 3.0
General Fund Long Range Forecast
Results of Committee Members' Rating of Long-Range Initiatives
Ranked in order of Importance with 1 being most important
177

Sinking Fund Needs Life Expectancy
Current Day
Replacement Costs
Flooring ‐ Carpet for heavy traffic areas 5 years $5,000
Flooring ‐ Slate 25+ years $30,000
Slate Rock Maintenance 5 years $2,000
Roof (Window Weather striping) 20+ years $220,000
Parking Lot (Resurface) 25+ years $160,000
Lounge furniture (Break Room, Lobbies) 10+ years $50,000
Space Savers/Lockers (see attachment) 25+ years $230,500
Police Gates 25+ years replace the electrical $80,000
Sidewalks 25+ years $150,000
Supermarket Doors 15 years with regular maintenance $20,000
Trellis wood treatments/weather Treatments 3 years $1,000
Bark Dust around Civic Center Grounds 3 years $2,500
Generator 20+ with regular maintenance $160,000
Police Bathroom Remodel 20+ years $180,000
Police Training Room ‐ wall replacement 20+ with regular maintenance $20,000
Power point system (AV Council Chambers) 12 years $65,000
Reader Board Purchase in FY17‐18 $50,000
The schedule on the following page shows the replacement schedule for each item by fiscal year.
Long‐RangeFinancialPlanCivicCenterFacilitySinkingFundCosts
The schedule above shows the replacement item, life expectancy and replacement cost for the Civic Center Sinking
Fund.
178

Long‐RangeFinancialPlanCivicCenterFacilitySinkingFundScheduleTwentyYearReplacementSchedule
This schedule shows the replacement schedule for each Civic Center item by fiscal year.
FY15‐16 FY16‐17 FY17‐18 FY18‐19 FY19‐20 FY20‐21 FY21‐22 FY22‐23 FY23‐24 FY24‐25 FY25‐26 FY26‐27 FY27‐28 FY28‐29 FY29‐30 FY30‐31 FY31‐32 FY32‐33 FY33‐34 FY34‐35
Beginning Balance 130,500$ 130,500$ 210,500$ 240,800$ 300,800$ 323,800$ 404,100$ 424,100$ 504,100$ 559,400$ 617,400$ 697,400$ 777,700$ 862,700$ 917,700$ 361,000$ 446,000$ 526,000$ 606,300$ 601,300$
Annual Reserve 85,000 85,000 85,000 85,000 85,000 85,000 85,000 85,000 85,000 85,000 85,000 85,000 85,000 85,000 85,000 85,000 85,000 85,000 85,000
Replacement Expenses:
Carpets, heavy traffic 5,000 5,000 5,000 5,000
Floor, Slate 30,000
Roof 220,000
Parking Lot 160,000
Lounge Furniture 50,000 50,000
Space Savers 230,500
Police Gates 80,000
Sidewalks 150,000
Supermarket Doors 20,000
Trellis wood Treatments 5,000 5,000 5,000 5,000 5,000 5,000 5,000
Generator 160,000
Police Bathroom Remodel 180,000
Police Training Room 20,000
Power Point System 65,000 65,000
Replace Bark dust 4,700 4,700 4,700 4,700 4,700 4,700
Reseal Slate Rock 2,000 2,000 2,000 2,000
Reseal Civic Center Block 25,000 25,000 25,000 25,000
Civic Center Reader Board 50,000
Ending Balance 130,500$ 210,500$ 240,800$ 300,800$ 323,800$ 404,100$ 424,100$ 504,100$ 559,400$ 617,400$ 697,400$ 777,700$ 862,700$ 917,700$ 361,000$ 446,000$ 526,000$ 606,300$ 601,300$ 23,800$
*Current Day Replacement Cost
Annual Reserve Amount $85,000
The City will need to add $85,000 per year to the Sinking Fund Reserve to pay for needed replacement costs for the Civic Center
179

FY16-17
1 RESOURCES:2 Beginning Balance: 442,000$ 364,000$ 251,850$ 265,300$ 278,000$ 287,700$ 317,700$ 354,700$ 3 Service Fees 1,445,000 1,565,000 1,708,000 1,864,000 2,034,000 2,218,000 2,408,000 2,557,000 4 Other Revenues 23,000 12,000 16,000 17,000 18,000 19,000 19,000 19,000 5 Interfund Borrowing - 115,000 140,000 75,000 - - - - 6 TOTAL RESOURCES 1,910,000$ 2,056,000$ 2,115,850$ 2,221,300$ 2,330,000$ 2,524,700$ 2,744,700$ 2,930,700$ 78 REQUIREMENTS:9 Expenditures:
10 Personnel Services 644,000 688,000 757,000 833,000 916,000 1,008,000 1,109,000 1,220,000 11 Materials & Services 640,000 775,000 791,000 807,000 823,000 839,000 856,000 873,000 12 Capital Outlay 262,000 340,000 300,000 300,000 300,000 300,000 300,000 300,000 13 Debt Service - 1,150 2,550 3,300 3,300 60,000 125,000 155,000 14 Total Expenditures 1,546,000 1,804,150 1,850,550 1,943,300 2,042,300 2,207,000 2,390,000 2,548,000 15 Fund Balance:16 Unrestricted Fund Balance 364,000 251,850 265,300 278,000 287,700 317,700 354,700 382,700 17 TOTAL REQUIREMENTS 1,910,000$ 2,056,000$ 2,115,850$ 2,221,300$ 2,330,000$ 2,524,700$ 2,744,700$ 2,930,700$
Per ESU $ Increase % Increase 2016-17 $ 6.01 $ 0.50 9.1% 2017-18 $ 6.56 $ 0.55 9.2% 2018-19 $ 7.16 $ 0.60 9.1% 2019-20 $ 7.81 $ 0.65 9.1% 2020-21 $ 8.51 0.70$ 9.0% 2021-22 $ 9.21 0.70$ 8.2% 2022-23 $ 9.61 0.40$ 4.3%
ESUs Current Proposed Monthly Bi-Monthly AnnualSingle Family Residential 1 11.02$ 12.02$ 0.50$ 1.00$ 6.00$ Commercial 86 947.72$ 1,033.72$ 43.00$ 86.00$ 516.00$ School 94 1,035.88$ 1,129.88$ 47.00$ 94.00$ 564.00$ Apartment 44 484.88$ 528.88$ 22.00$ 44.00$ 264.00$
Conclusion: The update to the Stormwater Long-Range plan supports a $0.50 rate increase per ESU for FY16-17 as anticipated when the model was presented to the Long Range Planning Committee last year (April 2015).In order to maintain at least a 60-day cash supply to correspond with the bi-monthly stormwater billings the following rate increase per ESU with a January 1st effective date is required:
FORECASTED 2020-21
FORECASTED 2018-19
Bi-Monthly Bill Incremental Cost of Rate Increase Proposed 2016-17 Rate Increase Analysis
The City Council approved a long range financial plan for the Stormwater Fund in fiscal year 2012-13 in order to address deficiencies and provide adequate financial planning for a self-sustaining fund. That strategy has been successful in addressing ongoing and upcoming regulatory, maintenance, and repair needs for the stormwater system. The Department continues to elevate repair activities while meeting regulatory permit requirements. These costs comprise the on-going capital outlay line item shown in the schedule below. To ensure adequate funding for operations and improvements the long-range plan projects up to a $0.70 increase in the monthly ESU rate each year for the next five years. The City plans to adopt a formal Capital Improvement Program for its stormwater system once it has completed inspection of the system and can identify needed improvements.
FORECASTED 2021-22
Long Range Plan - Stormwater Summary
PROJECTED 2015-16
FORECASTED 2016-17
FORECASTED 2017-18
FORECASTED 2019-20
FORECASTED 2022-23
180

FY16-17
1 RESOURCES:2 Beginning Balance: 999,000$ 929,000$ 721,500$ 733,500$ 769,500$ 709,500$ 711,500$ 567,500$ 503,500$ 449,500$ 3 Water Sales 2,750,000 2,865,000 2,980,000 3,099,000 3,223,000 3,384,000 3,553,000 3,731,000 3,918,000 4,114,000 4 Loan * 135,000 100,000 100,000 85,000 - - - - - - 5 Other Revenues 250,000 85,500 89,000 93,000 97,000 101,000 105,000 109,000 113,000 118,000 6 TOTAL RESOURCES 4,134,000$ 3,979,500$ 3,890,500$ 4,010,500$ 4,089,500$ 4,194,500$ 4,369,500$ 4,407,500$ 4,534,500$ 4,681,500$ 7 8 REQUIREMENTS:9 Expenditures:
10 Personnel Services 905,000$ 960,000$ 1,056,000$ 1,109,000$ 1,220,000$ 1,281,000$ 1,409,000$ 1,480,000$ 1,628,000$ 1,710,000$ 11 Materials & Services 1,374,000 1,439,000 1,468,000 1,497,000 1,527,000 1,558,000 1,589,000 1,621,000 1,653,000 1,686,000 12 Capital Outlay 694,000 629,000 400,000 400,000 400,000 410,000 700,000 700,000 700,000 500,000 13 Debt Service 232,000 229,000 231,000 232,000 229,000 230,000 - - - - 14 Loan Principal * - - - - - - 100,000 100,000 100,000 120,000 15 Loan Interest * - 1,000 2,000 3,000 4,000 4,000 4,000 3,000 4,000 - 16 Total Expenditures 3,205,000 3,258,000 3,157,000 3,241,000 3,380,000 3,483,000 3,802,000 3,904,000 4,085,000 4,016,000 17 Fund Balance:18 Reserves 234,000 234,000 234,000 234,000 234,000 - - - - - 19 Fund Balance 695,000 487,500 499,500 535,500 475,500 711,500 567,500 503,500 449,500 665,500 20 TOTAL REQUIREMENTS 4,134,000$ 3,979,500$ 3,890,500$ 4,010,500$ 4,089,500$ 4,194,500$ 4,369,500$ 4,407,500$ 4,534,500$ 4,681,500$
Current Proposed Monthly Bi-Monthly Annual Residential (1300 ccf) 26.69$ 27.76$ 0.53$ 1.07$ $ 6.41 Multi-family (17500 ccf ) 245.91$ 255.75$ 4.92$ 9.84$ $ 59.02 Commercial (5100 ccf) 73.16$ 76.09$ 1.46$ 2.93$ $ 17.56
Conclusion: The update to the Water Services Long-Range plan supports a 4% rate increase for FY16-17 as anticipated when the model was presented to the Long Range Planning Committee last year (April 2015). Beginning in FY20-21 the rate increases to 5%.
The Water Fund Long Range Plan includes expenditure projections consistent with the Water System Capital Improvement Program adopted by the City Council.
Incremental Cost of Rate Increase Bi-Monthly Bill Proposed 2016-17 Rate Increase Analysis
* The loan assumes an interfund borrowing with an interest rate of 0.75%, the current rate of return provided by the Oregon State Treasurery.
Long Range Plan - Water Services SummaryPROJECTED
2015-16FORECASTED
2016-17FORECASTED
2017-18FORECASTED
2018-19FORECASTED
2019-20FORECASTED
2020-21FORECASTED
2021-22FORECASTED
2022-23FORECASTED
2024-25FORECASTED
2025-26
181

WaterSystem‐CapitalImprovementProgram
Phase I: 2013 - 2016
Wiessner-Ridge Drive Intertie $ 366,000 $ 227,600 Completed FY13-14Install low-volume “jockey” pump at Bair Park pump station 33,000 32,300 Completed FY14-15Hydrogeological Study for VOC Identification & Extent 79,000 88,000 Completed FY14-15
Continued Steel waterline replacement program 400,000 400,000 Completed FY14-15Three monitoring wells VOC sampling 324,000 75,000 Planned FY16-17Abandon Lauderback Well 60,000 20,000 Planned FY16-17
Continued Steel waterline replacement program 610,000 400,000 Completed FY15-16
Subtotal 1,982,000 1,316,100 10% Engineering & Administration 198,200 198,200 10% Contingency 198,200 198,200 Total Phase I $ 2,378,400 $ 1,712,500
Phase II: 2016 - 2021
Continue steel waterline replacement program $ 1,010,000 400,000 Planned FY16-1710% Engineering and Administration 101,000 10% Contingency 101,000 Total Phase II $ 1,212,000
Phase III: 2021 - 2027
1.25 Million Gallon Reservoir and 2000 GPM Pump Station (Site and timing TBD)
$ 1,750,000
Continue steel waterline replacement program 2,020,000 Subtotal 3,195,000 10% Engineering and Administration 319,500 10% Contingency 319,500 Total Phase III $ 3,834,000
Description Estimated Cost
Description Estimated Cost
Revised Cost Status
The Capital Improvement Plan (CIP) for the 2012 Keizer Water System Master Plan Update has been developed to coincide with the known and well-established strengths and historical success of the existing water system while recognizing the need to provide for future growth. In order to accommodate the projected growth and financial limitations, the CIP has been divided into four phases of implementation:
Description Estimated Cost Revised Cost Status
Install standby generator with automatic transfer switch at Reitz/Bair Park site
110,000 73,200 Completed FY14-15
182

Glossary
183
Glossary
ACCRUAL ACCOUNTING – A basis of accounting in which revenues are recognized in the accounting period in which they are earned, and expenditures are recognized in the period in which they are incurred. ACTUAL – Denotes revenues are recognized or received and expenditures incurred or recorded for a given period which is in contrast to “Budget” which denotes plans for a period. ADMINISTRATIVE SERVICES FUND – An Internal Services Fund which tracks City-wide shared expenditures including the offices and departments of the City Manager, City Attorney, City Recorder, Human Resources, Finance, Facility Maintenance and Public Works Administration. ADOPTED BUDGET – The financial plan adopted by the City Council, which forms the basis and limits for appropriations for the fiscal year. AD VALOREM TAX – A tax based on the assessed value of a property. ARRA (AMERICAN RECOVERY AND REINVESTMENT ACT) – On February 17, 2009 President Obama signed the American Recovery and Reinvestment Act or Stimulus Package to restart the economy. The package contains extensive funding for science, engineering research and infrastructure, and more limited funding for education, social sciences and the arts. APPROVED BUDGET – The budget recommended by the Budget Committee and reviewed by the City Council prior to adoption. APPROPRIATION – The legal authorization granted by the City Council to spend specific amounts of public funds for specific purposes during specific periods of time. ASSESSED VALUE – The portion of value of real or personal property which is taxable. It is the lesser of the property’s real market value or the constitutional value limit (Maximum Assessed Value – MAV). The value limit may increase 3% annually unless qualifying improvements or changes are made to the property. These improvements or changes allow the value limit to increase by more than 3%. AUDIT – A review of City accounts by an independent auditing firm to substantiate year-end fund balances, reserves, and cash in hand. BALLOT MEASURE 50 – In May 1997 voters approved Ballot Measure 50 which fundamentally changed the structure of property taxes in Oregon from a tax base system to a permanent tax rate. BOND – A written promise to pay a sum of money, called principal or face value at future date, called the maturity date, along with periodic interest paid at the specified percentage of the principal (interest rate). Bonds are typically used to finance long-term Capital Improvements. BUDGET – The City's financial plan for a period of one year. By statute, the budget must be balanced and include a statement of actual revenues and expenditures for each of the last two years. Also required are estimated revenues and expenditures for the current and forthcoming year. BUDGETARY BASIS – Budgets are adopted on a basis consistent with generally accepted accounting principles (GAAP), with the exception that neither depreciation nor amortization is budgeted and bond principal is subject to appropriation.
184

Glossary
BUDGET CALENDAR – The schedule of key dates which the City follows in the preparation and adoption of the budget. BUDGET COMMITTEE – The fiscal planning board of the local government, consisting of the Mayor and City Council plus an equal number of legal voters from the district. BUDGET MESSAGE – An explanation of the budget and the City’s financial priorities. Prepared by or under the direction of the City Manager. BUDGET OFFICER – Person appointed by the City Council to be responsible for assembling the budget. For City of Keizer, the Finance Director serves this role. BUDGET RESOLUTION – The budget is adopted each year by the City Council through passage of a Resolution. This Budget Resolution is the guiding document for compliance with budget law and for any necessary adjustments during the fiscal year. CAFR (COMPREHENSIVE ANNUAL FINANCIAL REPORT) – The complete annual financial report of the City that is prepared in conformity with generally accepted accounting principles. An independent auditing firm audits the financial statements in this annual report. CAPITAL BUDGET – The City’s budget for projects, major repairs, and improvements or additions to the City’s fixed assets (streets, sidewalks, roads, sewers, stormwater, parks, and buildings). CAPITAL OUTLAY – Items which generally have a useful life of one or more years and a cost of $5000 or more. Examples include machinery, land, furniture, computers, equipment, vehicles, and buildings. CASH MANAGEMENT – Management of cash necessary to pay for government services while investing temporary cash excesses in order to earn interest income. Cash management refers to the activities of forecasting inflows and outflows of cash, mobilizing cash to improve its availability for investment, establishing and maintaining banking relationships, and investing funds in order to achieve the highest return available for temporary cash balances. CHARGES FOR SERVICES – Includes a wide variety of fees charged for services provided to the public and other agencies. CITY COUNCIL – The legislative branch of the City composed of seven elected officials who serve a four-year term. CIP (CAPITAL IMPROVEMENT PLAN) – An allocation plan for capital expenditures to be incurred over several future years. It sets forth each capital project, identifying the expected beginning and ending date for each project, the amount to be expended in each year, and the method of financing those expenditures. CONTINGENCY – A special amount set aside for necessary unforeseen and unplanned expenses. Contingencies may not be spent without City Council approval via a Transfer Resolution or Supplemental Budget. CONTRACTUAL SERVICES – The costs related to services performed for the City by individuals, business, or utilities.
185

Glossary
DEBT SERVICE – The payment of general long-term debt, consisting of principal and interest payments. DEPARTMENT – A major administrative organizational unit of the City which indicates overall management responsibility for one or more divisions. DEPRECIATION – Expensing the cost of a capital asset over its useful life. DEVELOPMENT CODE AND STANDARDS – The City’s procedures and criteria for the review and approval of land development proposals. DIVISION OF TAXES – Division of taxes refers to the process of, and revenue from, apportioning tax to urban renewal agencies based on the relationship of the “excess” to “frozen value” (i.e. tax increment revenue). EMPLOYEE BENEFITS – Contributions made by a government to meet commitments or obligations for employee related expenses. Included is the government’s share of costs for social security and the various pensions, medical, dental, life insurance, workers’ compensation, and disability insurance. ENDING FUND BALANCE – As shown in the budget, an amount representing the difference between the resources received by the fund compared to the amount expended in the fund. This becomes the subsequent year’s beginning working capital or beginning fund balance. ENTERPRISE FUND – A fund established to account for operations financed and operated in a manner similar to private business enterprises. The City’s enterprise funds include Water, Sewer, Stormwater, Street Lighting District’s, and Community Center. ESU – (EQUIVALENT SERVICE UNIT) An area which is estimated to place approximately equal demand on the public stormwater facilities as defined in the Keizer Development Code as “Dwelling, single family”. One (1) ESU shall be equal to 3,000 square feet of impervious surface. EOC (EMERGENCY OPERATIONS CENTER) – Command center for coordination and intervention for citywide or regional emergencies. EXPENDITURES – The payment for goods and services, debt service, and Capital Outlay from a governmental fund. FINANCIAL AUDIT – A comprehensive examination of the accounting and financial information by a qualified auditing firm. The auditing firm examines whether funds are spent according to intended purpose, within appropriations, and as authorized. It also examines if revenues, expenses, assets, and liabilities are stated fairly. The auditing firm reports to the City Audit Committee. FISCAL YEAR – The twelve months beginning July 1 and ending June 30 of the following year. FTE (FULL-TIME EQUIVALENT) – An abbreviation for full-time equivalent employees. Staffing levels are measured in FTE to give a consistent comparison from year to year. FRANCHISE FEE – A fee charged each year to utilities as a payment in lieu of permit fees for the use of City streets. The fee is generally based on a percentage of revenues.
186

Glossary
FULL FAITH AND CREDIT BONDS – Long-term obligations that are payable solely from a designated source of revenue. They do not carry any taxing power. FUND – A fiscal and accounting entity with balancing revenues and appropriations. FUND BALANCE – The difference between fund assets and fund liabilities of governmental and similar trust funds. GAAP (GENERAL ACCEPTED ACCOUNTING PRINCIPLES) – Conventions, rules, and procedures used in performing accepted accounting practice and at a particular time. GASB (GOVERNMENTAL ACCOUNTING STANDARDS BOARD) – The body that establishes accounting principles for state and local governments. GENERAL FUND – Accounts for all financial resources except those required to be accounted for in another fund. GENERAL OBLIGATION BONDS – Long-term obligations backed by the “full faith and credit” pledge of the city’s general fund revenues. They carry an unlimited taxing power, require voter-approval, and are limited in total to 3% of the city’s true cash value. GFOA (GOVERNMENT FINANCE OFFICERS ASSOCIATION) – The premier association of the public-sector finance professionals and is dedicated to providing high-quality support to state and local governments. GIS (GEOGRAPHIC INFORMATION SYSTEM) – A program which facilitates the efficient management of spatial information; offering enhanced analytical, cartographic, and reporting capabilities for internal and external customers. GRANT – A contribution by one governmental unit to another. The contribution may be made to aid in the support of a specified purpose or function. INFRASTRUCTURE – Public domain fixed assets such as roads, bridges, streets, sidewalks, and similar assets that are immovable. INTERGOVERNMENTAL REVENUES – Revenues received from another governmental entity, such as county, state, or federal governments. INTERNAL SERVICES FUND – Funds used to account for the financing of goods or services provided by one department or agency to other departments or agencies of the government and to other government units, on a cost reimbursement basis. KEDC – (KEIZER ECONOMIC DEVELOPMENT COMMISSION) – The City Council established KEDC in 2014 to provide strategic planning recommendations regarding the economic development of the City. LINE OF CREDIT – Short term credit provided by a bank whereby the lender can draw upon funds at any time and interest begins to accrue once funds are drawn.
187

Glossary
LEVEL OF SERVICE – The amount and type of existing services, programs, and facilities provided. Level of service depends on the available resources. LOCAL BUDGET LAW – Oregon Revised Statute (ORS) 294.305 to 294.565 Local Budget Law has several purposes: 1) establish standard procedures for presenting a local government budget; 2) outline programs and services provided; 3) provide a standard method of estimating revenues, expenditures, and proposed tax levies; and 4) encourage citizen involvement in the preparation of the budget before formal adoption. LINE ITEM BUDGET – The traditional form of budgeting, where proposed expenditures are based on individual objects of expense within a department or division. MATERIALS AND SERVICES – An object classification which includes contractual and other services, materials and supplies, and other charges. MEASURE 5 – On November 6, 1990, Oregon citizens approved an amendment to the State Constitution (Measure 5) which limits the ability of state and local governments to levy property taxes, impose certain types of charges, and to issue certain types of debt. Measure 5 sets a maximum tax rate of $10 per $1,000 of true value for overlapping general-purpose governments. The amendment also subjects school districts to a property tax cap of $15 per $1,000 full market value in 1991-92, declining in $2.50 increments to $5 in 1995-96. MEASURE 50 – On May 29, 1997, Oregon citizens approved an amendment to the State Constitution (Measure 50) which limits the ability of state and local governments to levy property taxes, impose certain types of charges and issue certain types of debt. Measure 50 sets a statewide property tax reduction of 17% which was authorized for 1996-97 fiscal year. Certain types of property tax levies are exempt or may be added outside of the reduced amount. Limits assessed value to 3% growth and requires the certain fees receive voter approval if increased. MODIFIED ACCRUAL BASIS OF ACCOUNTING – The accrual basis of accounting adopted to governmental funds where revenues are recognized when they become both “measureable” and “available to finance expenditures of the current period.” NEIGHBORHOOD ASSOCIATIONS – A group of people organized and recognized by the Council within a geographical area for the purpose of acting on issues affecting neighborhood and community livability. OBJECTIVES – A specific measurable and observable result of an organization’s activity which advances the organization toward a goal. OPERATING BUDGET – The portion of the budget that pertains to daily operations providing basic governmental services. The operating budget contains appropriations for such expenditures as personnel services, supplies, utilities, materials, and debt service. ORDINANCE – Written directive or act of a governing body. Has the full force and effect of law within the local government’s boundaries, provided it does not conflict with a State Statute or Constitutional Provision. See “Resolution.” ORS (OREGON REVISED STATUTE) – Governing state law in Oregon
188

Glossary
PERMANENT RATE LIMIT – A tax rate calculated under the limitations of Measure 50 that would extend the full amount of “operating taxes” that could be imposed. PERS (PUBLIC EMPLOYEE RETIREMENT SYSTEM) – The State of Oregon retirement program for about 95 percent of state and local government employees in Oregon. PERSONNEL SERVICES – Costs associated with employees, including salaries, overtime, and fringe benefit costs. PROPERTY TAX – Amounts imposed on taxable property by a local government within its operating rate limit, levied under local option authority, or levied to repay bonded debt. PROJECTED ACTUAL – The amount of total estimated revenues collected and expenditures incurred during the fiscal year. PROPOSED BUDGET – The proposed budget is the one proposed by the City Manager and is reviewed by the Budget Committee. PERMANENT RATE – A district’s permanent ad valorem property tax rate for operating purposes. This rate levied against the assessed value of property raises taxes for general operations. Permanent tax rate limits were either computed by the Department of Revenue for districts existing prior to 1997-1998 or are voter-approved for districts formed in 1997-1998 and later. PROJECTED – The amount of projected revenues and expenditures to be collected during the fiscal year. REAL MARKET VALUE – Value set on real and personal property as a basis for imposing tax. RESERVE – An accumulation of funds for a specific future purpose. Reserves may only be spent during the fiscal year with City Council approval through a Transfer Resolution or a Supplemental Budget. RESOLUTION – An order of a governing body. Requires less legal formality and has lower legal status than an Ordinance. Statutes or Charter will specify which actions must be by ordinance and which may be by resolution. (For cities, revenue raising measures such as taxes, special assessments, and service charges always require ordinances.) See “Ordinance.” REVENUE BONDS – Long-term obligations that are payable solely from a designated source of revenue generated by the project which was financed. No taxing power of general fund pledge is provided as security. RESOURCES – Total funds available which include the estimated balances on hand at the beginning of the fiscal year plus all revenues anticipated being collected during the year. REVENUE – Moneys received during the year to finance City services. SPECIAL ASSESSMENTS – A way to finance a local improvement which allows benefited property owners to pay the City back over time. Special assessments may be bonded through a special bond or unbonded. SPECIAL REVENUE FUND – Accounts for the proceeds of specific revenue sources (other than expendable trusts or for major capital projects) that are legally restricted for specified purposes.
189

Glossary
STATE SHARED REVENUE – Revenues received from the State of Oregon from cigarette, liquor, and highway taxes under ORS 221. These funds are available to cities located in counties with at least 100,000 in habitants that provide at least four types of municipal services. STATE REVENUE SHARING – A share of certain revenues from the State of Oregon that are apportioned among and distributed to cities for general purposes. These funds require a public hearing before the budget committee to discuss possible uses. SUPPLEMENTAL BUDGET – An amendment to the adopted budget that is prepared to meet unexpected needs or to appropriate revenues not anticipated at the time the budget was adopted. The supplemental budget cannot increase the tax levy. TAX INCREMENT FINANCING – A financial mechanism for urban renewal plans which captures the tax from the growth in property value within a designated geographical area. The City’s urban renewal plans, as carried out by the Keizer Urban Renewal Agency, cover approximately 7 acres of the city. TAX LEVY – The total amount of property taxes required by the City to meet requirements. TAX RATE – The amount of tax stated in terms of a unit of the district’s assessed value. For example, the City of Keizer’s tax rate is $2.0838 per $1,000 of assessed value of taxable property. Transient Occupancy Tax (TOT) – The City imposes a tax, which is 6% of gross revenues on establishments that meet the criteria. TRANSFER – An amount distributed from one fund to finance activities in another fund. It is shown as a requirement in the originating fund and a resource in the receiving fund. UNAPPROPRIATED ENDING FUND BALANCE – An amount set aside to be used as cash carry-over for the next fiscal year’s budget. WORKING CAPITAL CARRYFORWARD – Funds which allow the City to meet current cash flow requirements, shortfalls in revenues, or unexpected demands until tax revenues or other major revenues are available.
190