Mario LACKNER Hendrik SONNABEND Working Paper No. … · 1. Introduction The way people deal with...
23
Coping with advantageous inequity Field evidence from professional penalty kicking by Mario LACKNER Hendrik SONNABEND Working Paper No. 1721 December 2017 DEPARTMENT OF ECONOMICS JOHANNES KEPLER UNIVERSITY OF LINZ Johannes Kepler University of Linz Department of Economics Altenberger Strasse 69 A-4040 Linz - Auhof, Austria www.econ.jku.at [email protected]
Transcript of Mario LACKNER Hendrik SONNABEND Working Paper No. … · 1. Introduction The way people deal with...
Coping with advantageous inequity Field evidence from professional penalty kicking
by
Mario LACKNER Hendrik SONNABEND
Working Paper No. 1721
December 2017
DDEEPPAARRTTMMEENNTT OOFF EECCOONNOOMMIICCSS JJOOHHAANNNNEESS KKEEPPLLEERR UUNNIIVVEERRSSIITTYY OOFF
LLIINNZZ
Johannes Kepler University of Linz Department of Economics
Altenberger Strasse 69 A-4040 Linz - Auhof, Austria
www.econ.jku.at

Coping with advantageous inequity –Field evidence from professional penalty
kicking∗
Mario Lackner† Hendrik Sonnabend‡
December 4, 2017
This contribution examines the effect of advantageous inequity on perfor-mance using data from top-level penalty kicking in soccer. Results indicatethat, on average, professionals do not perform worse when they experience un-fair advantages. However, we find a negative effect of advantageous inequityin situations where success is less important.
JEL-Code: C93, D91, Z29
Keywords: advantageous inequity; guilt; self-serving bias; fairness; perfor-mance
∗We would like to thank Thomas Dohmen and Sascha Serwe for helpful comments.†[email protected], Johannes Kepler University Linz (JKU), Department of Economics‡[email protected], University of Hagen, Department of Economics
1

1. Introduction
The way people deal with unfair arrangements affects decision making in many economic
areas, such as principal-agent problems, public choice, cooperation, or (multinational)
bargaining. It is hence of great importance to understand how people react in situations
where they receive more than they earn, meaning that their outcome/input ratio exceeds
the one of the reference group. Adams (1965) labels these kind of arrangements as ”ad-
vantageous inequity”. Based on insights from cognitive dissonance theory and previous
findings from the lab she concludes that inequity creates unpleasant tension within an
individual, which increases in the level of unfairness. If inequity favors the individual, a
feeling of guilt arises.1
Insights from social psychology and behavioral economics show that there are different
ways to cope with advantageous inequity. For example, subjects might try to change the
outcome/input ratio to restore fairness, or try to justify their advantage. However, almost
all of the empirical results have been gained from laboratory experiments. This study uses
field data from top-level penalty kicking in soccer to examine how professionals react to
an unfair advantage in a high-stake environment where hesitation or ’pondering’ typically
weakens performance. We find that, on average, players’ performance is not affected
by the quality of the referee’s decision on a penalty (henceforce labelled as call). This
result is robust to different econometric strategies and a variety of controls. We therefore
conclude that possibly existing fairness concerns are in the aggregate offset by self-serving
mechanism. However, in situations where success is less important, kickers perform worse
(by 14 percentage points) if the penalty call was either questionable or wrong. We interpret
this result as a negative impact of advantageous inequity on performance.
The paper is divided into five parts. Section 2 briefly reviews previous literature.
Section 3 presents the data set. In Section 4 we perform the empirical analysis. Finally,
Section 5 concludes.
1See Baumeister et al. (1994) or Lewis et al. (2010) for an examination of guilt from a psychologicalperspective.
2
2. Literature review
A large body of research in social psychology and behavioral economics aims at under-
standing fairness concerns and their implications for the decision making process, in-
cluding the seminal papers of Fehr and Schmidt (1999), Bolton and Ockenfels (2000), or
Konow (2000). Generally, when being exposed to advantageous inequity, an individual
must cope with two contradictory forces. These are self-interest (”what s/he wants”) and
fairness concerns (”what s/he believes to be right”). For instance, Peters et al. (2008)
provide evidence for this inner conflict by showing that overpaid subjects need more time
to report their satisfaction compared to a neutral setting. Or, as e.g. Sweeney (1990)
demonstrates, we can observe that a higher wage does not increase pay satisfaction in
case subjects perceive that they already earn more than they deserve.
Now, given that advantageous inequity brings subjects in an uncomfortable situation,
there are two basic ways to attenuate the dissonance and/or to protect (or enhance) the
positivity of the self. First, one way to deal with situations of inequality is to reduce
it. For instance, in line with equity theory, the ”survivor guilt” felt by workers whose
colleagues are dismissed randomly leads to an increase in performance (see e.g. Brockner
et al. (1986)). On the contrary, subjects tend to decrease effort when they feel unfairly
treated, such as being poorly paid compared to a reference group (Lindquist, 2010; Abeler
et al., 2010; Gachter and Thoni, 2010). Second, another way to cope with an unfair
advantage is to justify it. The so-called self-serving bias (SSB) terms people’s tendency
”to take credit for successful outcomes in life, but to blame the situation or other people
for failing outcomes” (Campbell and Krusemark, 2007, p. 846). The phenomenon was
firstly described in a precise way by Heider (1958) who observed that cognition is affected
by a person’s needs, desires, and preferences (Mezulis et al., 2004). As an illustrative
example, Babcock and Loewenstein (1997) mention the well-known above-average effect
(or illusory superiority), by which subjects tend to overestimate their skills and abilities,
but underestimate undesired personality traits.2 In economics, the SSB is used to explain
2A related concept is strategic self-ignorance, see e.g. Thunstrom et al. (2016) or Onwezen and van derWeele (2016).
3
the outcome of negations (see e.g. Babcock and Loewenstein (1997) or Kriss et al. (2011)),
tax evasion (Blaufus et al., 2015) or fiscal policies (Deffains et al., 2016). In one of the
rare field studies, Babcock et al. (1996) examined teacher contract negotiations and found
a SSB on both sides regarding a list of communities which serve as references in terms of
wages.
However, most prior research on advantageous inequity has been limited to laboratory
setups. For instance, a common research design is to ask subjects how satisfied they
are with certain distributions, or about their perception of fairness in certain situations.
Thus, to our best knowledge, there is not a single previous study that has investigated
the impact of advantageous inequity on performance with field data. This paper seeks to
close the gap with data from professional penalty kicking. Our approach helps to meet
objections regarding the transferability of laboratory findings to real-life situations (Hart,
2005; Levitt and List, 2007, 2009). The skepticism arises from low monetary incentives,
a small number of participations and a pool of subjects that is generally regarded as not
being representative, and a potential bias coming from the influences of testers’ preferences
(e.g. Babcock et al. (1996)). Sports data, on the contrary, offer a wealth of information
(Kahn, 2000) and high incentives for individuals.3 Thus, we are confident that the high-
stake environment at hand enables us to gain deeper insights on how professionals cope
with unfair situations to their favor.
Data from penalty kicking have previously been used, notably to test game-theoretical
predictions (see, e.g., Chiappori et al. (2002), Palacios-Huerta (2003), Azar and Bar-
Eli (2011) or Dohmen and Sonnabend (2016)). Prior research has shown that there
are manifold factors affecting the outcome of a penalty kick, such as the presence of
spectators (e.g. Navarro et al. (2012)), playing at home or away (e.g. Dohmen (2008a)),
players characteristics (e.g. Palacios-Huerta (2003), Savage and Torgler (2012), Baumann
et al. (2011), Weigelt et al. (2012), or Dohmen and Sonnabend (2016)), the importance of
success and the minute of play (e.g. Savage and Torgler (2012)), ’hot hand’ or momentum
effects (e.g. Jordet et al. (2012)), and stadium characteristics (e.g. (Scoppa, 2008)). We
3Savage and Torgler (2012) claim that ”athletic fields supply real-world laboratories for testing economictheories” (p.2425).
4

acknowledge the importance of these variables and, consequently, use a large set of controls
in our econometric approach to isolate possible effects of fairness concerns.
3. Data and Empirical Approach
A penalty kick in soccer is a shot taken from the penalty mark located in a distance of
11 meters to the goal. It is awarded for certain offenses inside the penalty area. Since
players other than the kicker and goalkeeper must reside outside the penalty area, and
the goalkeeper is not allowed to move forward until the ball has been kicked, the situation
can be characterized as a duel between two players.4
The data we use are provided by IMPIRE AG – Innovative Medientechnik und Planung
AG and comprise information on all penalty kicks taken in the first German professional
soccer league (1.Bundesliga) since the start of the season 1993/1994 until the first half of
the season 2003/2004.5 In total, the data cover 857 penalty kicks attempted by 221 dif-
ferent players. All penalty calls are categorized into three distinctive categories according
to the quality of the ruling:
• ’correct’ if the call was indisputable and right,
• ’wrong’ if the call was clearly false, and
• ’questionable’ if the penalty call was neither clearly wrong nor without any doubt
the right call.
While Figure 1 plots the absolute number of penalty kicks in our data by quality of the
call and season, Figure 2 additionally includes the intermediate score.
Moreover, the data provide detailed information about the outcome of the kick, the
identity of the kicker, the fouled player, the fouling player, the defending goalkeeper, and
4Law 14 of the official Laws of the Game (Federation Internationale de Football Association (FIFA),2017) defines the procedural rules that apply to penalty kicks. A comprehensive summary and dis-cussion can be found e.g. in Palacios-Huerta (2003).
5IMPIRE AG, which was taken over by deltatre AG in 2014, is one of the largest independent media ser-vice providers in Germany (see http://www.bundesliga-datenbank.de/en/aboutus/). Their observersattend each league match of the German soccer league (Deutsche Fußball Liga GmbH ) and collect de-tailed information on match actions including penalty kicks. Their reports might include inaccuracies,which, however, should not occur systematically.
5

Figure 1: Number of penalty kicks by quality of call and season.
020
40
60
80
100
1993 1994 1995 1996 1997 1998 1999 2000 2001 2002 2003
correct calls wrong calls dubious calls
Notes: Sample of penalty kicks in German Bundesliga, seasons 1993/1994 through2003/2004. N = 857, 59 coded as wrong, 218 as questionable, and 580 as correct.
Figure 2: Number of penalty kicks by intermediate standing.
111
6
34
70
5
16
224
24
99
120
20
4555
4
24
050
100
150
200
250
in lead, 1 in lead, >1 tied trailing, −1 trailing, <−1
correct calls wrong calls dubious calls
Notes: Sample of penalty kicks in German Bundesliga, seasons 1993/1994 through2003/2004. N = 857.
the referee. Descriptive statistics for further variables used in our econometric analysis
can be found in Table 1. It shows that a goal is scored in 74.49% of all observed attempts,
and that a low number of 10.6% of kicks is taken by the fouled player himself.6 As a first
implication, we assert that the kicker is favored in the penalty-duel (which has often been
described as a ”war of nerves” (Palacios-Huerta, 2003)), and that the pressure therefore
is on his side. Hence, we expect the player taking the penalty to be more vulnerable to
distraction and uncertainty.7 In addition, Table 1 reveals that 66% of penalty kicks are
6See Kuss et al. (2007) for an analysis of self-taking predictors.7See Jordet et al. (2007) and Savage and Torgler (2012) for an extensive discussion on the
stress/performance relationship in the penalty kick situation.
6

Table 1: Descriptive statistics of the main variables.
Variable Mean Std.Dev. Min Max
successful attempt 0.744 0.437 0 1attempt by fouled player 0.106 0.308 0 1
minute 52.912 25.115 1 94score difference 0.001 1.334 -5 6
home game 0.664 0.473 0 1attendance (in % of capacity) 74.886 23.149 12.857 100
matchday 16.964 10.121 1 34rank 9.065 5.274 0 18
points 20.797 15.018 0 70goals 23.071 16.129 0 70
rivalry 0.018 0.131 0 1
Notes: Sample of penalty kicks in German Bundesliga, seasons 1993/1994through 2003/2004, N = 857.
awarded to home teams. Combined with the fact that penalty calls favoring the home
team exhibit a higher share of incorrect decisions (about 7%), this points to the known
referee bias towards the home team (Dohmen, 2008b; Dohmen and Sauermann, 2016).
Next, Figure 3 presents kickers’ rate of success by quality of the referee’s call. Appar-
ently, no visible correlation can be found, and, indeed, wrong calls have the highest rate
of success. We turn to the econometric analysis in the next section.
Figure 3: Success rate of penalty kicks by quality of call.
0%
20%
40%
60%
80%
100%
correct questionable wrong
Notes: Sample of penalty kicks in German Bundesliga, seasons 1993/1994 through2003/2004. N = 857.
7

3.1. Econometric strategy and first results
In a more elaborate empirical approach, we intend to estimate the relationship between the
quality of the penalty call and the kicker’s subsequent scoring probability. In essence, we
want to test whether advantageous inequity has an effect on performance or not. In case
fairness concerns affect a player’s performance, we should expect the scoring probability
to decline given the penalty was not correctly called by the referee. However, if self-
serving concerns and/or in-group-serving motives dominate, we should expect to observe
no significant relationship between the quality of the call and performance (or even a
positive one).8
Formally, we estimate the following linear probability model (LPM):
score i,k = β0 + β1incorrect calli,k + β2fouled player kicksi,k + γ′X + ξk + εi,k. (1)
The dependent variable, score, is a binary outcome measure that takes on the value one
if the penalty kick i of player k is scored and zero otherwise.9
Our main variable of interest is again a binary variable. In detail, incorrect call = 1
when the umpire’s call was not categorized as a correct call (i.e. categorized as ’question-
able’ or ’wrong’), and incorrect call = 0 when the call was classified as ’correct’.10
Next, fouled player kicks is another dummy variable which equals one if the fouled
player takes the penalty kick himself, and zero if otherwise. Naturally, it is only available
for penalty kicks awarded after an offense committed against an individual opponent
(about 89% of all observed penalty kicks), but not for infringements such as the illegal
use of hands. Note that very few cases of ”fouled player kicks” combined with ”wrong
call” exist.
8See e.g. Kandel and Lazear (1992), Gould and Kaplan (2011), or Georganas et al. (2015) for peerpressure effects on performance.
9The data do distinguish between penalties that were saved by the goalkeeper and kicks that missed thetarget without keeper interference. Unfortunately, we cannot use that additional information in ourframework, since only about 5 percent of all attempts are outright misses. Yet, as a failed penaltykick can certainly be the result of excellent goalkeeping, we incorporate goalkeeper fixed-effects incolumn (5) of Table 2 to control for keeper ability.
10We combine the two categories ’questionable’ and ’wrong’ because the data only identify 59 penaltycalls as ’wrong’ (218 as ’questionable’ and 580 as ’correct’). Consequently, we pool both categoriestogether in order to compare two categories of comparable size.
8

Furthermore, X is a vector of team- and game-specific control variables including score
difference dummies, 10-minute interval dummies for playing time, relative game atten-
dance in percent of stadium capacity, as well as a home game dummy to control for a
possible referee home-field bias. We also control for variables measuring success during
games before by including goals scored, points and team ranking before the game. In
addition, we include a dummy controlling for regional rivalry games (i.e. local derbies).
While the score difference and the time played at the time of the call allow us to control
for the relative importance of the penalty, we also include a seasonal trend to account for
the steady decline in penalty conversion rates over time (see Figure A.1 in the Appendix).
And, a match day linear trend is included to control for increasing importance to score
within-season. Finally, fixed-effects ξk control for unobserved time-invariant kicker charac-
teristics, and εi,k ∼ N(0, σ2) is a mean-zero error term which captures all other uobserved
factors influencing score. We refrain from using the number of attempted penalty kicks
by player because we cannot sufficiently proxy experience due to the fact that we lack of
information on players’ careers before the observation period.11
Table 2 then tabulates the estimation results from different specifications of model (1).
Our preferred specification (2) incorporates kicker fixed-effects, while controlling for a sea-
sonal linear time trend.12 It shows that the estimated β1 is not significantly different from
zero, meaning that a penalty call classified as being a correct call is not associated with
a change in the scoring probability. This result suggests that, on average, advantageous
inequity does not impact performance.
In addition, Table 2 reveals that it does not affect scoring rates when the fouled player
takes the penalty kick himself (i.e. β2 is not statistically greater than zero).13 And, we
estimate a robust decline in performance for penalty kicks attempted at intermediate
11The endogeneity problem given by players’ tendency to retire after failure has been discussed in Dohmen(2008a) and Dohmen and Sonnabend (2016).
12Note that Dohmen (2008a) identifies a structural change in scoring probabilities due to a rule change in1997 according to which the keeper was allowed to change his position laterally on the goal line beforethe shot has been taken. Figure A.1 in the Appendix plots the annual conversion rate by season.Overall, we face a slight decline over the observed seasons but no structural break.
13This finding validates Kuss et al. (2007), who also assess that self-taking does not predict scoringprobabilities. Moreover, we do not observe selection effects which might occur if a fouled player,being aware that the call was wrong, refuses to take the subsequent penalty kick: incorrect call andfouled player kicks are not correlated at any conventional statistical level.
9

scores of trailing by 3 through 5 goals. We interpret this as a give-up effect in the sense
that penalty kickers do not give full effort due to the fact that the game is already out of
hand.
Our main findings proof to be highly robust to different specifications. In detail, results
do not change in case the seasonal trend is replaced by season dummies (column (4) of
Table 2). The same applies for the inclusion of referee dummies (to control for poten-
tial unobserved referee characteristics) or goalkeeper dummies (to control for unobserved
goalkeeper heterogeneity) in column (5). Besides these different LPM specifications, we
also estimate a LOGIT model. The outcome is tabulated in column (3) of Table 2. Again,
results do not change qualitatively compared to our preferred model estimates.
3.2. Split sample estimations
In the next step, we accommodate the fact that our data covers penalty kicks in a very
heterogeneous set of situations by splitting the sample accordingly. Table 3 presents the
results.
First, as kickers could react sensitively to the audience’ composition and a familiar
environment, we subdivide the overall sample into home and away game penalty attempts
(columns (2) and (3)). Both samples do not differ qualitatively from the pooled-sample
estimates (column (1)), as neither penalties in home nor away games yield a significant
association between quality of the call and the outcome.
Second, choking under pressure is a well-documented phenomenon. For instance, re-
search shows that, in general, choking becomes more likely the more is at stake.14 We
address this issue in terms of time and score. More specifically, we expect penalty kicks
in the first half to be less relevant than kicks in the second half, simply because of the
time left to alter the score and the overall outcome of the game. However, after splitting
the sample into two halftimes (columns (4) and (5)), no significant difference for the asso-
ciation between the quality of the penalty call for the home and away game samples can
14For instance, Ariely et al. (2009) analyze experiments showing that individuals perform worse whenstakes are higher.
10

be found.
Yet, things change when we take a look at intermediate scores (columns (6) to (8)).
Here, the overall sample is grouped into three sub-sample: the kicker’s team is trailing,
the team is in the lead, or the game is tied.15 While there is, again, no significant effect
of the referee’s decision quality on scoring probabilities in case of a setback or a tie, the
quality of the kick is positively associated with the quality of the call if the benefiting
team is in the lead. That is, kickers of a leading team perform worse given the penalty
call was not correct. More precisely, in this case, the probability of a goal decreases by
14 percentage points (column (8)).
As an explanation, we point out that an additional goal’s benefit when the team is
already ahead is comparably low.16 Ceteris paribus, scoring when the match is tied yields
two additional points (for the match win), whereas an additional goal when trailing by
one results in one point (for the tie). On the contrary, scoring in case of a lead does
not change the points a team expects to be awarded at the end of the game. Following
this idea, we argue that these situations leave more scope for fairness concerns, making
kickers more vulnerable to advantageous inequity.17 Moreover, there is reason to expect
the effect to be nonlinear. Unfortunately, due to the relatively small number of observed
penalties by score difference, we are not able to test our hypothesis.
15Note that, due to obvious data constraints, we refrain from using interaction terms in our estimationmodels. In addition, we do not split the overall sample into smaller sub-samples than presented inTable 3 because, at the level of a particular score (e.g. trailing by one), the number of observationsis too small to fully trust the fixed-effects estimations.
16For instance, in a setting of penalty shootout kicks, Savage and Torgler (2012) juxtapose the ’pressureto win’ and the ’pressure to lose’. The idea is that the penalty kick situation affects the kickernegatively in case a failure ends the shootout with a defeat for his team, whereas the possibility towin the shootout with a final goal might even be perceived as a positive stress effect. They find thatwhile the ’pressure to win’ increases the scoring probability by around 17 percent, the ’pressure tolose’ decreases the scoring probability by around 45 percent.
17To rule out that the result is driven by score depending differences in the kicker selection, see thattwo-sided t-tests for differences in means reveal that neither self-taking nor the kicker’s experiencediffer significantly across scores.
11

Table 2: Association between quality of penalty call and outcome
(1) (2) (3) (4) (5)
No FEs Preferred Logit FEs I FEs II
Incorrect call -0.028 -0.033 -0.145 -0.028 -0.041(0.030) (0.031) (0.157) (0.031) (0.037)
Fouled player -0.024 -0.027 -0.124 -0.029 -0.051kicks (0.051) (0.060) (0.258) (0.062) (0.061)
Team ranking -0.005 -0.001 -0.032 -0.001 0.002before game (0.004) (0.005) (0.022) (0.005) (0.005)
Points -0.004 0.001 -0.023 0.005 0.008*before game (0.003) (0.004) (0.017) (0.004) (0.005)
Goals scored 0.003 -0.000 0.019 -0.003 -0.006before game (0.003) (0.004) (0.015) (0.004) (0.004)
Rivalry game -0.039 -0.082 -0.219 -0.055 -0.205(0.119) (0.139) (0.618) (0.133) (0.152)
Rel. attendance 0.000 0.001 0.000 0.001 0.002**(in %) (0.001) (0.001) (0.004) (0.001) (0.001)
Home game -0.034 -0.048 -0.189 -0.049 -0.015(0.033) (0.036) (0.182) (0.035) (0.044)
Matchday trend -0.002 -0.003 -0.009 -0.004 -0.004(0.002) (0.002) (0.012) (0.003) (0.003)
Seasonal trend -0.007 -0.031*** -0.038(0.006) (0.011) (0.029)
S[-5,-3] -0.189* -0.209* -0.902** -0.202* -0.210*(0.101) (0.113) (0.442) (0.111) (0.107)
S[-2] 0.015 0.022 0.087 0.015 -0.023(0.062) (0.060) (0.364) (0.061) (0.073)
S[-1] -0.013 -0.032 -0.067 -0.030 -0.057(0.037) (0.040) (0.199) (0.040) (0.050)
S[1] -0.083 -0.131 -0.439 -0.142 -0.231**(0.078) (0.098) (0.396) (0.098) (0.096)
S[2] -0.040 -0.036 -0.224 -0.040 -0.104(0.068) (0.083) (0.357) (0.083) (0.091)
S[3,6] -0.002 -0.020 -0.008 -0.025 -0.014(0.045) (0.054) (0.247) (0.054) (0.061)
Kicker FEs - Yes Yes Yes YesSeason FEs - - - Yes YesOpponent FEs - - - - YesKeeper FEs - - - - YesReferee FEs - - - - Yes
N 857 857 857 857 857R2 0.033 0.367 - 0.381 0.551
Standard errors in parentheses (cluster for kicker-id), * p < 0.10, ** p < 0.05, *** p < 0.01. Dependentvariable is equal to 1 if observed penalty resulted in a score, 0 else. The data include 221 penalty kickers,54 referees and 95 goalkeepers.
12
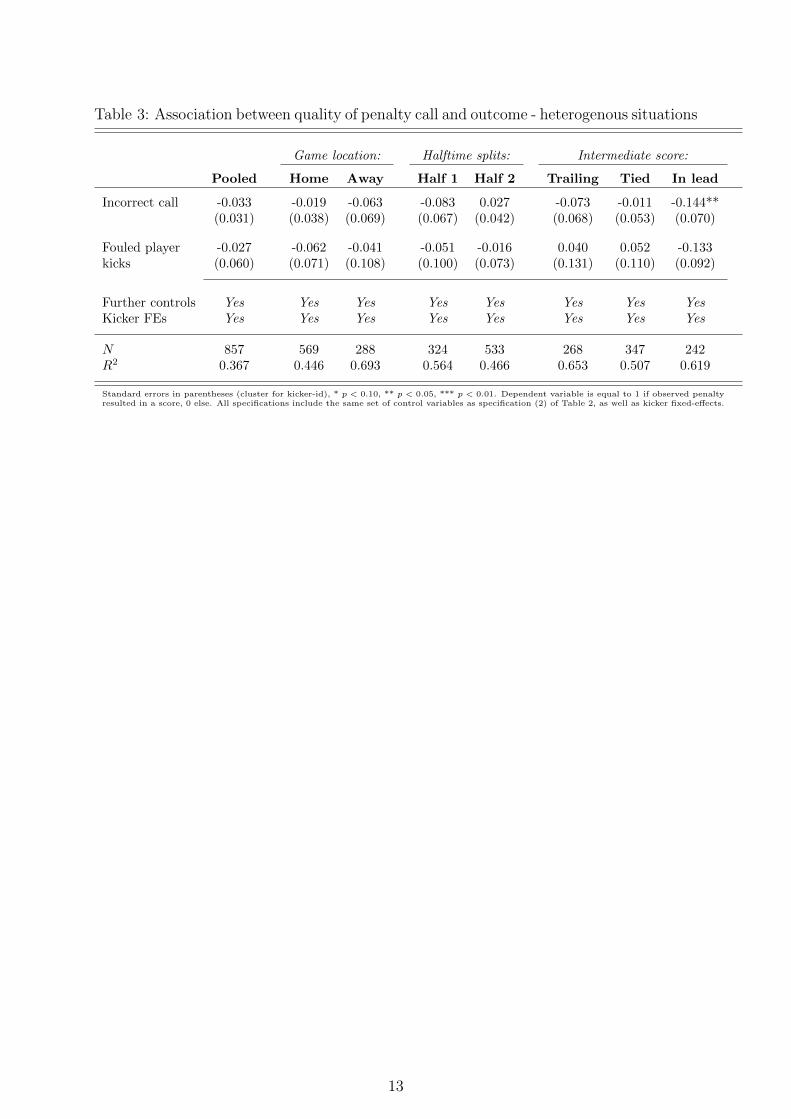
Table 3: Association between quality of penalty call and outcome - heterogenous situations
Game location: Halftime splits: Intermediate score:
Pooled Home Away Half 1 Half 2 Trailing Tied In lead
Incorrect call -0.033 -0.019 -0.063 -0.083 0.027 -0.073 -0.011 -0.144**(0.031) (0.038) (0.069) (0.067) (0.042) (0.068) (0.053) (0.070)
Fouled player -0.027 -0.062 -0.041 -0.051 -0.016 0.040 0.052 -0.133kicks (0.060) (0.071) (0.108) (0.100) (0.073) (0.131) (0.110) (0.092)
Further controls Yes Yes Yes Yes Yes Yes Yes YesKicker FEs Yes Yes Yes Yes Yes Yes Yes Yes
N 857 569 288 324 533 268 347 242R2 0.367 0.446 0.693 0.564 0.466 0.653 0.507 0.619
Standard errors in parentheses (cluster for kicker-id), * p < 0.10, ** p < 0.05, *** p < 0.01. Dependent variable is equal to 1 if observed penaltyresulted in a score, 0 else. All specifications include the same set of control variables as specification (2) of Table 2, as well as kicker fixed-effects.
13

4. Conclusion
Findings from social psychology and behavioral economics suggest that advantageous
inequity can impact the performance of individuals. However, the direction and magnitude
of the effect is not entirely clear. This article expands the empirical literature, which is
dominated by evidence from laboratory experiments, to data from the field.
That is, we use data from a high-stakes environment where highly trained athletes have
to complete a standardized task. More specifically, we examine whether the quality of
a referee’s penalty kick decision (categorized as ’correct’, ’dubious’, or ’wrong’) impacts
performance of the attempting kicker. In other words, when attempting an incorrectly
called penalty, the observed player encounters advantageous inequity.
Our findings indicate that, on average, no significant effect of an incorrect call on
performance can be detected. Consequently, if adverse effects of advantageous inequity
such as fairness concerns (guilt) exist, they are dominated by self-serving mechanism like
(pure) egoism, in-group-serving motives, or, as a rather unconsciously working mechanism,
the self-serving bias. This result is robust to alternative specifications used to control for
unobserved factors which might influence penalty kick outcomes.
In a more detailed analysis, we look at performance in situations which differ with regard
to the relative importance of success. While splitting the sample by first/second half or
home/away turf does not yield different results, stratifying the data for the intermediate
score reveals a significant negative effect of an incorrect call on the scoring rate. We explain
this finding with a shift in the weights of the two opposing effects: Low-stake situations
leave more scope for fairness concerns and/or ’pondering’, which otherwise are suppressed
or, whether consciously or not, ignored. In addition, as the dissatisfaction with rewards
has been established as another consequence of unfairness (see e.g. Sweeney (1990)), the
fear of spoiling the upcoming win provides a further explanation of the result. Overall,
the finding can be seen as support for the insights gained from (low-stake) laboratory
studies.
On the evidence presented, one might argue that we have no direct information on how
the fouled player or the kicker, respectively, perceived the situation according to which the
14

penalty kick was awarded. To meet this objection, we state that professional soccer does
not take place in a vacuum, and includes not only the athletes, managers and staff, but
also spectators and media attention. Thus, we would expect that the way the opponent,
(perhaps) the own team, and the audience react to wrongly awarded penalty kicks will
ultimately mirror the quality of the referee’s decision to the players involved. That is,
beyond common partiality and all other things equal, reactions vary with the quality of
the referee’s decision.
15

References
Abeler, J., Altmann, S., Kube, S., and Wibral, M. (2010). Gift exchange and workers’ fair-
ness concerns: When equality is unfair. Journal of the European Economic Association,
8(6):1299–1324.
Adams, J. S. (1965). Inequity in social exchange. Advances in Experimental Social Psy-
chology, 2:267–299.
Ariely, D., Gneezy, U., Loewenstein, G., and Mazar, N. (2009). Large stakes and big
mistakes. The Review of Economic Studies, 76(2):451–469.
Azar, O. H. and Bar-Eli, M. (2011). Do soccer players play the mixed-strategy nash
equilibrium? Applied Economics, 43(25):3591–3601.
Babcock, L. and Loewenstein, G. (1997). Explaining bargaining impasse: The role of
self-serving biases. The Journal of Economic Perspectives, 11(1):109–126.
Babcock, L., Wang, X., and Loewenstein, G. (1996). Choosing the wrong pond: Social
comparisons in negotiations that reflect a self-serving bias. The Quarterly Journal of
Economics, 111(1):1–19.
Baumann, F., Friehe, T., and Wedow, M. (2011). General ability and specialization:
evidence from penalty kicks in soccer. Journal of Sports Economics, 12(1):81–105.
Baumeister, R. F., Stillwell, A. M., and Heatherton, T. F. (1994). Guilt: an interpersonal
approach. Psychological Bulletin, 115(2):243–267.
Blaufus, K., Braune, M., Hundsdoerfer, J., and Jacob, M. (2015). Self-serving bias and
tax morale. Economics Letters, 131:91–93.
Bolton, G. E. and Ockenfels, A. (2000). Erc: A theory of equity, reciprocity, and compe-
tition. American Economic Review, 90(1):166–193.
16

Brockner, J., Greenberg, J., Brockner, A., Bortz, J., Davy, J., and Carter, C. (1986). Lay-
offs, equity theory, and work performance: Further evidence of the impact of survivor
guilt. Academy of Management Journal, 29(2):373–384.
Campbell, W. K. and Krusemark, E. A. (2007). Self-serving bias. In Baumeister, R. F.
and Vohs, K. D., editors, Encyclopedia of Social Psychology, pages 846–847. SAGE
Publications Ltd.
Chiappori, P., Levitt, S., and Groseclose, T. (2002). Testing mixed-strategy equilibria
when players are heterogeneous: The case of penalty kicks in soccer. American Eco-
nomic Review, 92(4):1138–1151.
Deffains, B., Espinosa, R., and Thoni, C. (2016). Political self-serving bias and redistri-
bution. Journal of Public Economics, 134:67–74.
Dohmen, T. (2008a). Do professionals choke under pressure? Journal of Economic
Behavior & Organization, 65(3-4):636–653.
Dohmen, T. and Sauermann, J. (2016). Referee bias. Journal of Economic Surveys,
30(4):679–695.
Dohmen, T. and Sonnabend, H. (2016). Further field evidence for minimax play. Journal
of Sports Economics (-online first-).
Dohmen, T. J. (2008b). The influence of social forces: Evidence from the behavior of
football referees. Economic inquiry, 46(3):411–424.
Federation Internationale de Football Association (FIFA) (2017). Laws of the Game
2017/18. Zurich, Switzerland: Federation Internationale de Football Association,
Zurich, Switzerland.
Fehr, E. and Schmidt, K. M. (1999). A theory of fairness, competition, and cooperation.
The Quarterly Journal of Economics, 114(3):817–868.
17

Gachter, S. and Thoni, C. (2010). Social comparison and performance: Experimental
evidence on the fair wage–effort hypothesis. Journal of Economic Behavior & Organi-
zation, 76(3):531–543.
Georganas, S., Tonin, M., and Vlassopoulos, M. (2015). Peer pressure and productivity:
The role of observing and being observed. Journal of Economic Behavior & Organiza-
tion, 117:223–232.
Gould, E. D. and Kaplan, T. R. (2011). Learning unethical practices from a co-worker:
the peer effect of jose canseco. Labour Economics, 18(3):338–348.
Hart, S. (2005). An interview with robert aumann. Macroeconomic Dynamics, 9(5):683–
740.
Heider, F. (1958). The Psychology of Interpersonal Relations. Psychology Press.
Jordet, G., Hartman, E., and Jelle Vuijk, P. (2012). Team history and choking under
pressure in major soccer penalty shootouts. British Journal of Psychology, 103(2):268–
283.
Jordet, G., Hartman, E., Visscher, C., and Lemmink, K. A. (2007). Kicks from the penalty
mark in soccer: The roles of stress, skill, and fatigue for kick outcomes. Journal of Sports
Sciences, 25(2):121–129.
Kahn, L. M. (2000). The sports business as a labor market laboratory. The Journal of
Economic Perspectives, 14(3):75–94.
Kandel, E. and Lazear, E. P. (1992). Peer pressure and partnerships. Journal of Political
Economy, 100(4):801–817.
Konow, J. (2000). Fair shares: Accountability and cognitive dissonance in allocation
decisions. The American Economic Review, 90(4):1072–1091.
Kriss, P. H., Loewenstein, G., Wang, X., and Weber, R. A. (2011). Behind the veil of
ignorance: Self-serving bias in climate change negotiations. Judgment and Decision
Making, 6(7):602.
18

Kuss, O., Kluttig, A., and Stoll, O. (2007). The fouled player should not take the penalty
himself: An empirical investigation of an old german football myth. Journal of Sports
Sciences, 25(9):963–967.
Levitt, S. D. and List, J. A. (2007). What do laboratory experiments measuring so-
cial preferences reveal about the real world? The Journal of Economic Perspectives,
21(2):153–174.
Levitt, S. D. and List, J. A. (2009). Field experiments in economics: The past, the
present, and the future. European Economic Review, 53(1):1–18.
Lewis, M., Haviland-Jones, J. M., and Barrett, L. F. (2010). Handbook of Emotions.
Guilford Press.
Lindquist, G. S. (2010). Tournaments and unfair treatment. The Journal of Socio-
Economics, 39(6):670–682.
Mezulis, A. H., Abramson, L. Y., Hyde, J. S., and Hankin, B. L. (2004). Is there a universal
positivity bias in attributions? a meta-analytic review of individual, developmental,
and cultural differences in the self-serving attributional bias. Psychological Bulletin,
130(5):711.
Navarro, M., Miyamoto, N., van der Kamp, J., Morya, E., Ranvaud, R., and Savelsbergh,
G. J. (2012). The effects of high pressure on the point of no return in simulated penalty
kicks. Journal of Sport and Exercise Psychology, 34(1):83–101.
Onwezen, M. C. and van der Weele, C. N. (2016). When indifference is ambivalence:
Strategic ignorance about meat consumption. Food Quality and Preference, 52:96–105.
Palacios-Huerta, I. (2003). Professionals play minimax. Review of Economic Studies,
70(2):395–415.
Peters, S. L., van den Bos, K., and Karremans, J. C. (2008). On the psychology of the
advantaged: How people react to being overpaid. Social Justice Research, 21(2):179–
191.
19

Savage, D. A. and Torgler, B. (2012). Nerves of steel? stress, work performance and elite
athletes. Applied Economics, 44(19):2423–2435.
Scoppa, V. (2008). Are subjective evaluations biased by social factors or connections? an
econometric analysis of soccer referee decisions. Empirical Economics, 35(1):123–140.
Sweeney, P. D. (1990). Distributive justice and pay satisfaction: A field test of an equity
theory prediction. Journal of Business and Psychology, 4(3):329–341.
Thunstrom, L., Nordstrom, J., Shogren, J. F., Ehmke, M., and van’t Veld, K. (2016).
Strategic self-ignorance. Journal of Risk and Uncertainty, 52(2):117–136.
Weigelt, M., Memmert, D., and Schack, T. (2012). Kick it like ballack: The effects of
goalkeeping gestures on goal-side selection in experienced soccer players and soccer
novices. Journal of Cognitive Psychology, 24(8):942–956.
20

A. Appendix: Figures
Figure A.1: Percentage of successful penalty kicks by season.
0%
20%
40%
60%
80%
100%
% a
ttem
pts
successfu
l
19931994
19951996
19971998
19992000
20012002
2003
Notes: Sample of penalty kicks in German Bundesliga, seasons 1993/1994 through2003/2004. N = 857
21
Highlights
• We study the effect of advantageous inequity on performance.
• We therefore use field data from a high-stake environment, that is penalty kicking
in professional soccer.
• On average, we do not find a significant effect of advantageous inequity on perfor-
mance.
• However, if relative importance of performance is low, it shows that kickers perform
worse when being exposed to advantageous inequity.
22