Marine weather offshore
63
Marine Weather - Offshore Jack Dale ISPA Yachtmaster Offshore Instructor Evaluator Sail Canada Advanced Cruising Instructor ASA Advanced Coastal Cruising / Catamaran Instructor IYT Yachtmaster Coastal Instructor
Transcript of Marine weather offshore

Marine Weather - Offshore
Jack DaleISPA Yachtmaster Offshore Instructor Evaluator
Sail Canada Advanced Cruising InstructorASA Advanced Coastal Cruising / Catamaran
InstructorIYT Yachtmaster Coastal Instructor

Outline Station Plot NOAA Weather Fax Grib Files Grib Readers NAVTEX Internet Resources Smartphone Resources

Reading a Station Plot http://www.hpc.ncep.noaa.gov/
html/stationplot_buoy.shtml
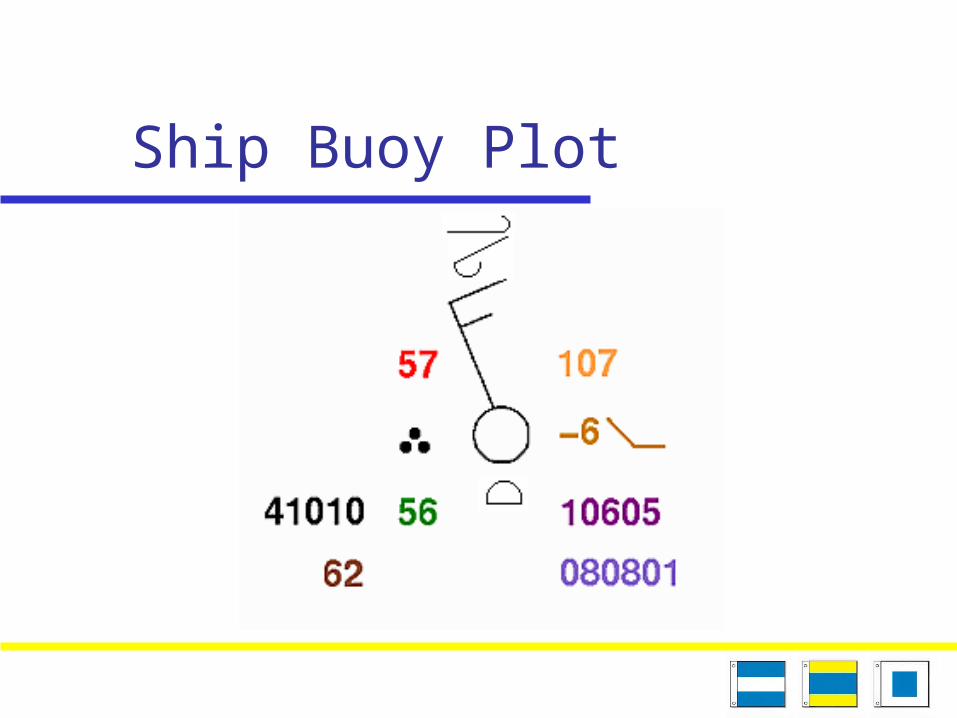
Ship Buoy Plot

Temperature
Temperature
The current air temperature measured to the nearest whole degree Fahrenheit.
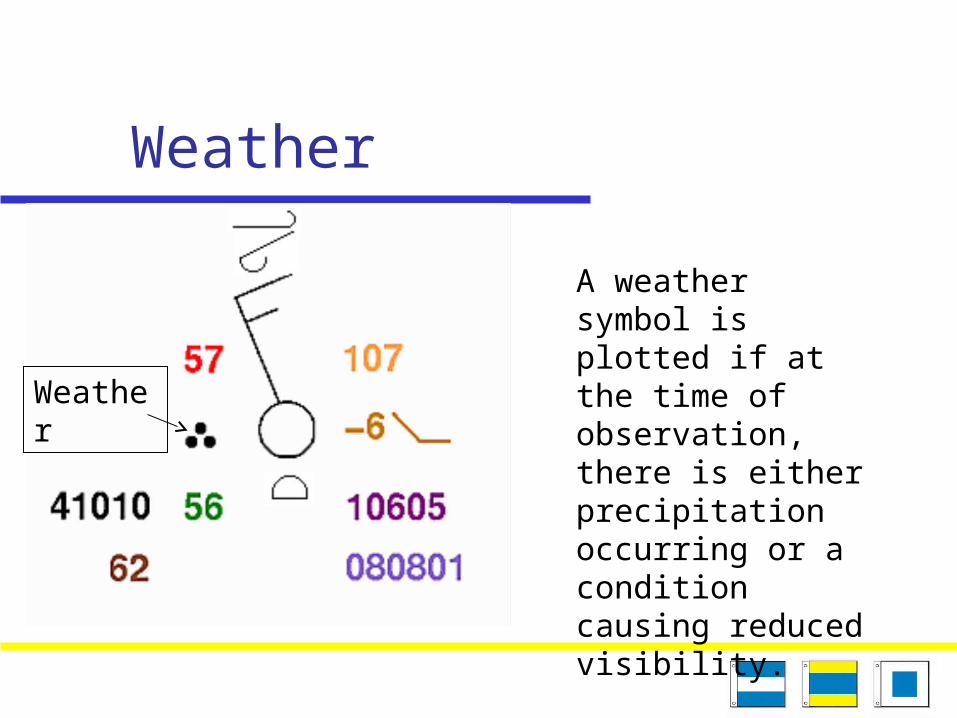
Weather
A weather symbol is plotted if at the time of observation, there is either precipitation occurring or a condition causing reduced visibility.
Weather

Weather Symbols

Dew Point
The current dew point temperature measured to the nearest whole degree Fahrenheit.
DewPoint

Wind
WindWind is plotted in increments of 5 knots (kts), with the outer end of the symbol pointing toward the direction from which the wind is blowing.

Wind Symbols
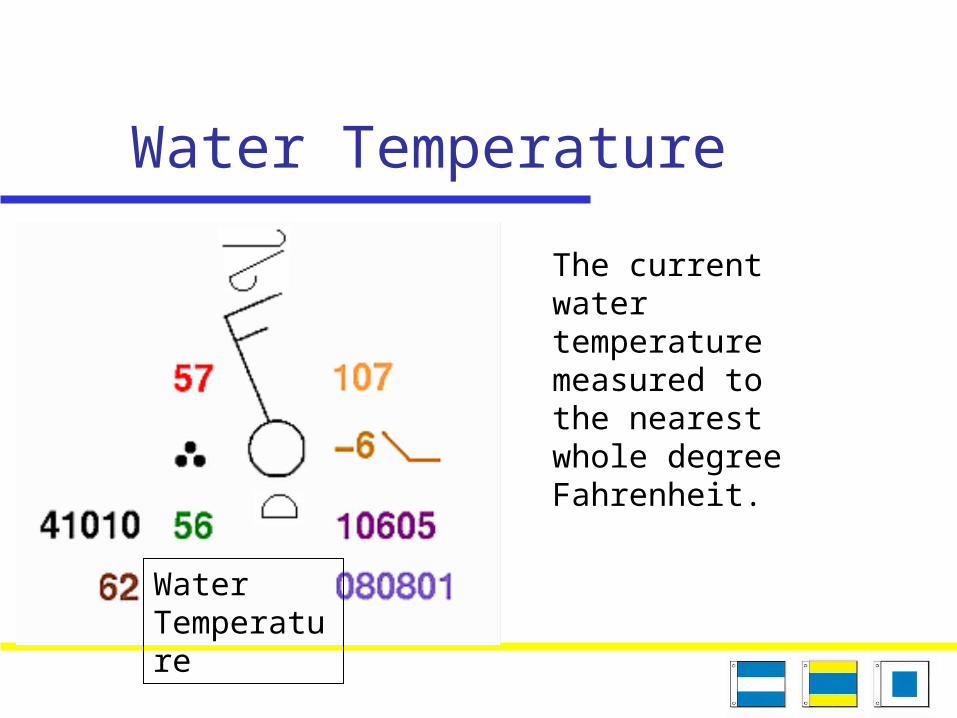
Water Temperature
The current water temperature measured to the nearest whole degree Fahrenheit.
WaterTemperature

Pressure
Sea-level pressure is plotted in tenths of millibars (mb), with the leading 10 or 9 omitted. For reference, 1013 mb is equivalent to 29.92 inches of mercury.

Pressure Tendency
Tendency
The pressure trend has two components, a number and symbol, to indicate how the sea-level pressure has changed during the past three hours.
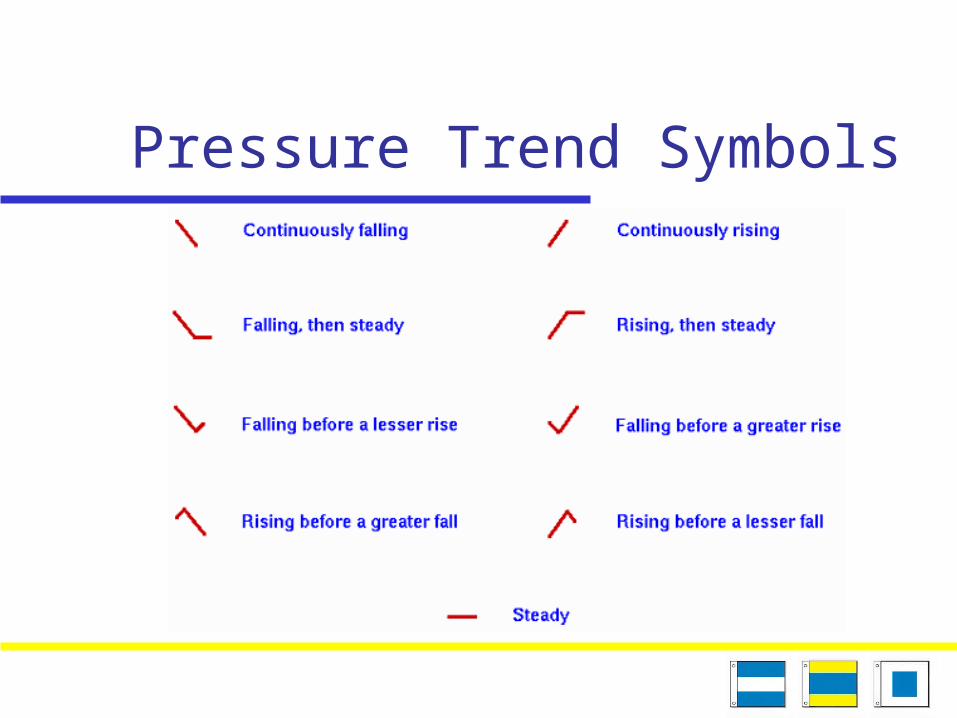
Pressure Trend Symbols
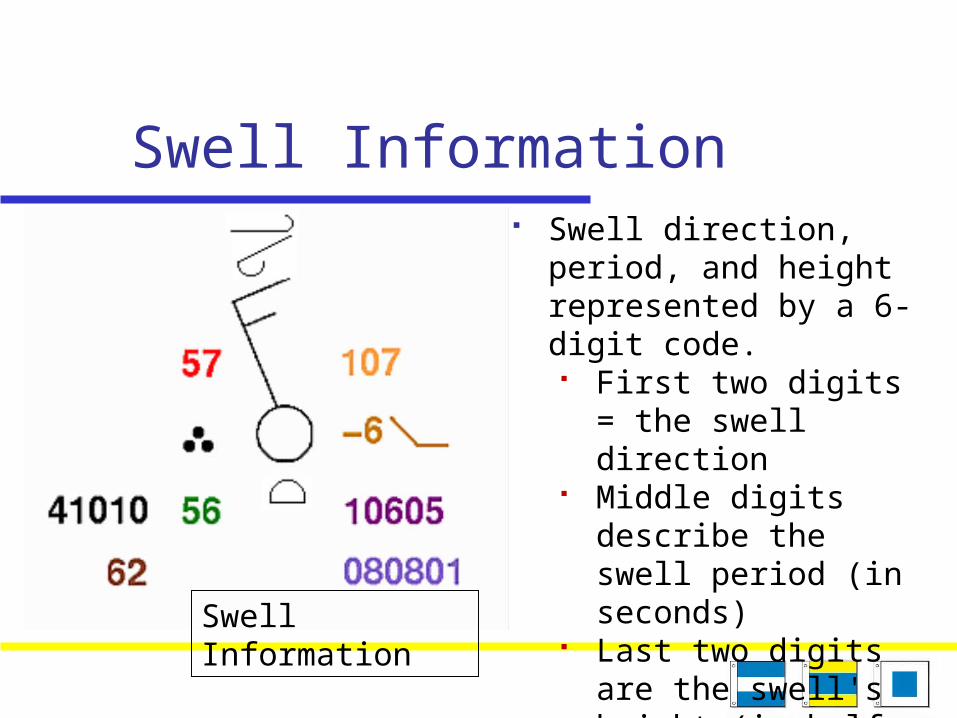
Swell Information Swell direction, period,
and height represented by a 6-digit code. First two digits = the
swell direction Middle digits
describe the swell period (in seconds)
Last two digits are the swell's height (in half meters).Swell
Information

Swell Information Example 090703
09 -- The swell direction is from 90 degrees (i.e. it is coming from due east).
07 -- The period of the swell is 7 seconds.
03 -- The height of the swell is 3 half meters.

Wave Information
Wave Information
Period and height represented by a 5-digit code. First digit
"1" for buoy "2" for ship
Second and third digits the wave period (in seconds)
Final two digits the wave height (in half meters).

Wave Information Example 10603
1 -- A group identifier for a buoy.06 -- The wave period is 6 seconds.03 -- The wave height is 3 half meters.
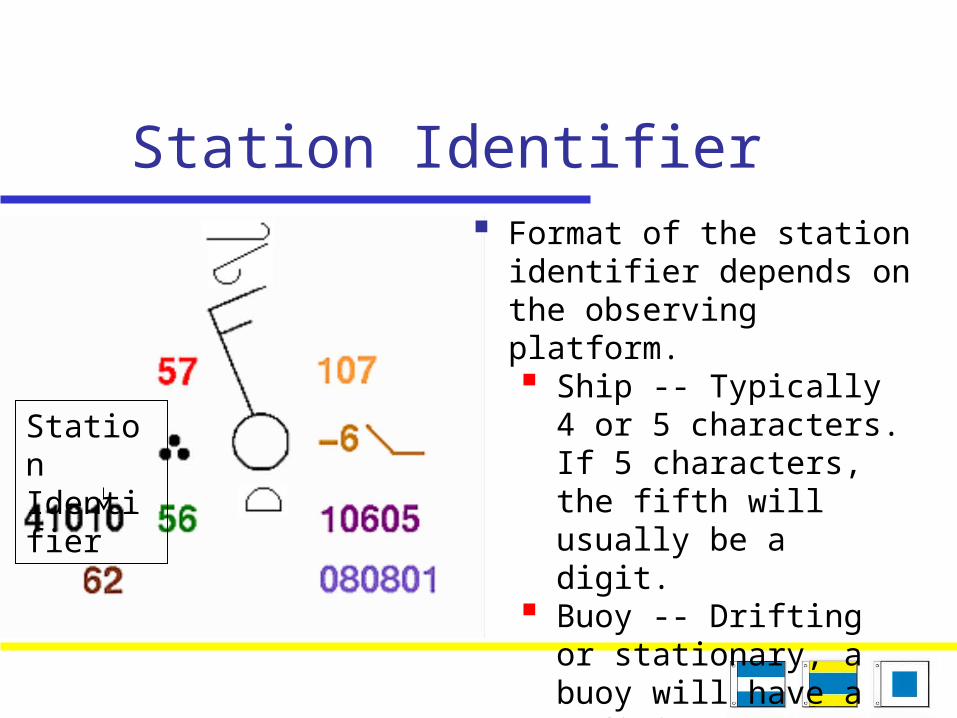
Station Identifier Format of the station
identifier depends on the observing platform. Ship -- Typically 4 or 5
characters. If 5 characters, the fifth will usually be a digit.
Buoy -- Drifting or stationary, a buoy will have a 5-digit identifier. First digit always a "4".
StationIdentifier

Cloud TypesHigh Cloud
Mid Level Cloud
LowCloud
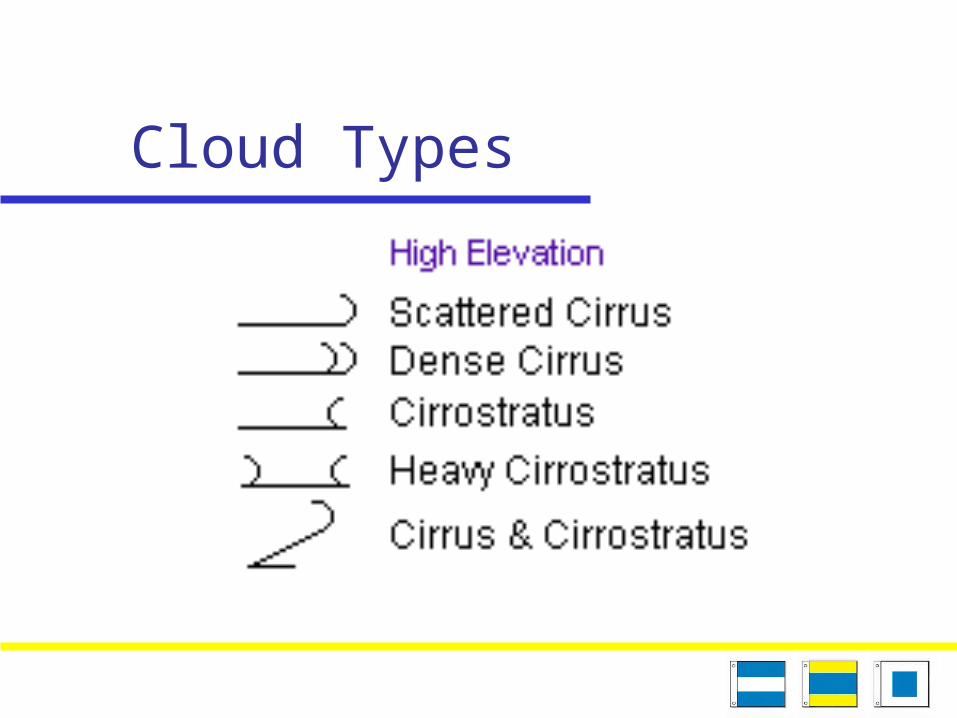
Cloud Types

Cloud Types

Cloud Types

Station Plot
Note that not all of the possible measurements are included.Wave height is shown as a total (wind wave + swell height)

Station Plot
Weather ParameterWeather Symbol Decoded
Station ID KPZH
Temperature (fahrenheit or celsius) 70 degree F
Present weather thunderstorm
Dew point temperature (fahrenheit or celsius) 68 degree F
Wind speed, direction, sky coverSSW 25 ktovercast
Station Pressure (mb) 048 = 1004.8 mb
3 hour pressure tendency -7 \ = -0.7 mb pressure decrease with steady pressure fall
optional wave height (feet or meter) 11 ft
Sea Surface Temperature (fahrenheit or celsius) 75 degrees F

Ship Observations http://coolwx.com/buoydata/
plotbuoy.php
Buoy Observations http://www.ndbc.noaa.gov/

Station Plots
Buoy Station Plot Ship Station Plot
Ocean Boston - Tanker
Drifting Buoy

Surface Analysis
Weather Fax From NOAA
500 Mb Analysis & Forecast Surface Analysis & Forecast Sea State Analysis & Wave Period
Forecast / Direction Wind / Wave Analysis & Forecast Satellite Photos Gales, Storms and Hurricanes

500 Mb Analysis Upper
air flow 5640-
meter height contour
Isoheights

Surface Analysis

Sea State Analysis Wave
height Average
of Highest 1/3
Meters Wave
direction Ice edge

Wind Wave Analysis Feet
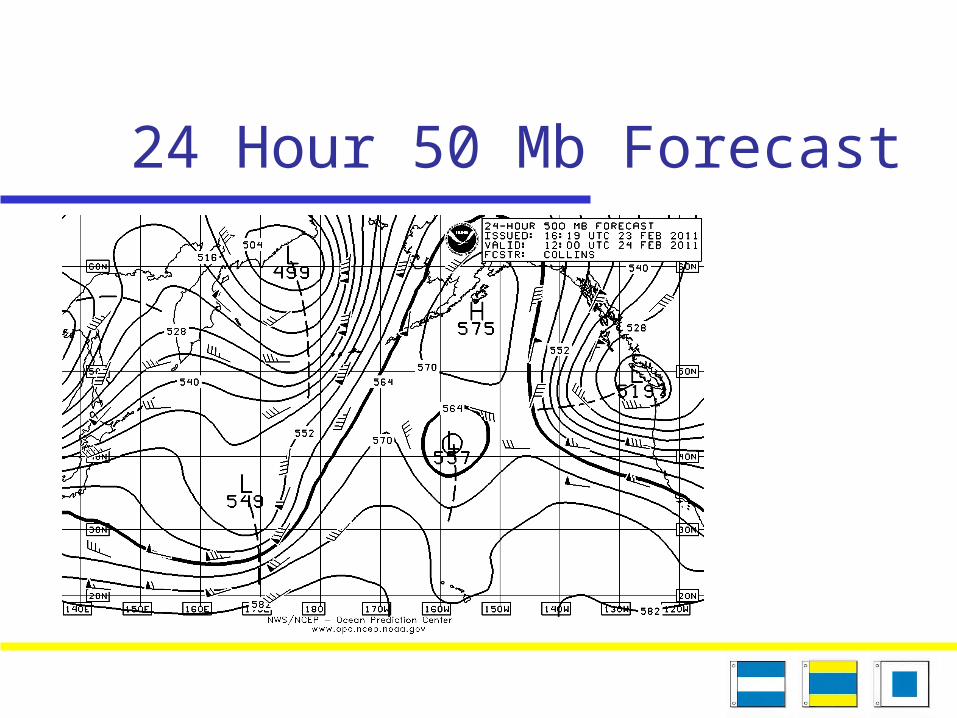
24 Hour 50 Mb Forecast

24 Hour Surface Forecast

24 Hour Wind and Wave Forecast
In Feet

48 Hour 500 Mb Forecast

48 Hour Surface Forecast

48 Hour Wind and Wave Forecast
Meters Ice
Edge

48 Hour Wave Period & Direction
Period in seconds
Arrows show dominant wave direction

96 Hour 500 Mb Forecast

96 Hour Surface Forecast

96 Hour Wind and Wave Forecast
Meters Ice edge

96 Hour Wave period & Direction

Satellite Photos (2)
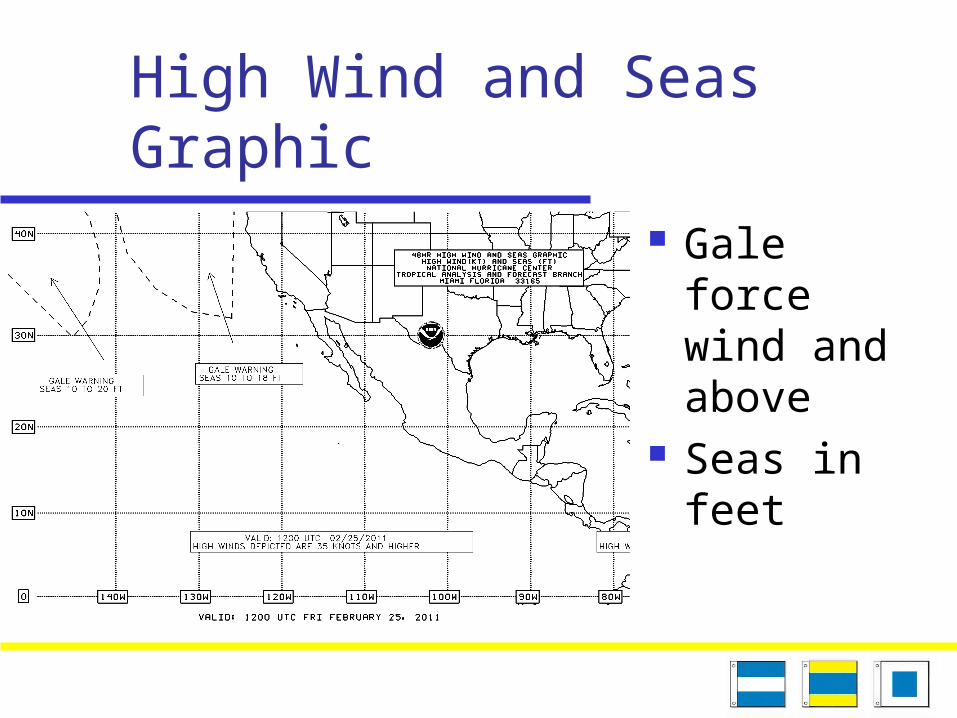
High Wind and Seas Graphic
Gale force wind and above
Seas in feet

Acquiring Weatherfax Internet SSB radio Weatherfax receiver Sat Phone (email)

Weatherfax Internet http://weather.noaa.gov/fax/
marine.shtml Email FTP Web

Weatherfax SSB
Pt.Reyes(NMC) 4346(except 19z,23Z), 8682, 12786, 17151.2, 22527(19z,23Z) kHz Radiofax Broadcast
Start Broadcast 0140Z 0655Z 1120Z 1400Z 1840Z 2320Z
Broadcast Schedule
1124Z 2324Z
SSB to Modem to PC to Printer
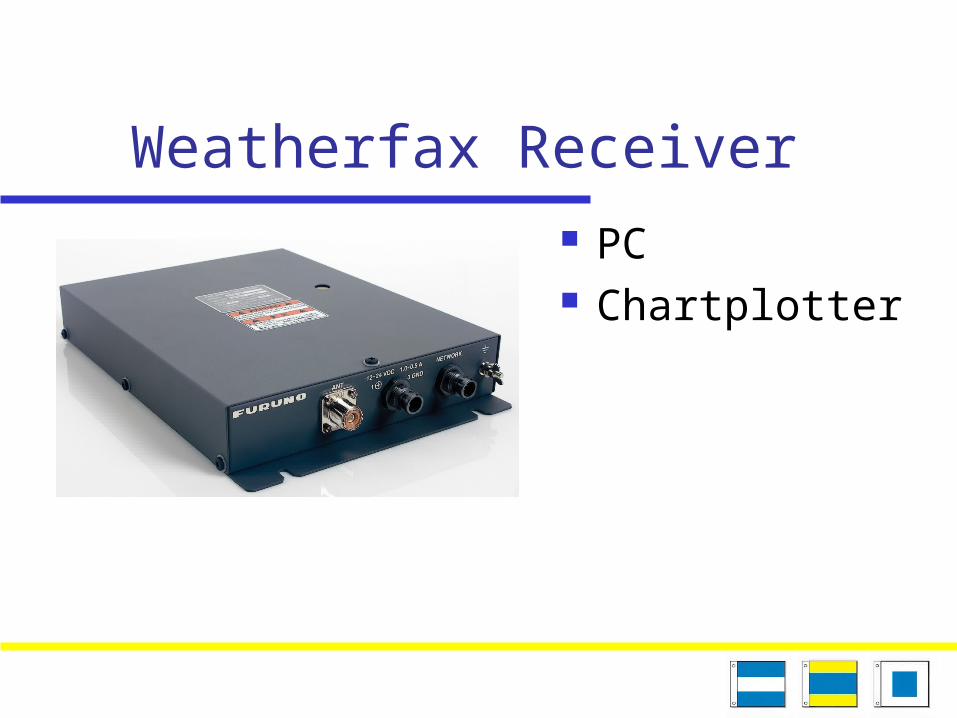
Weatherfax Receiver PC Chartplotter
GRIB Files A widely used bit-oriented data
exchange scheme is the WMO GRIddedBinary (GRIB) format. GRIB is an efficient vehicle for transmitting large volumes of gridded data to automated centers over high-speed telecommunication lines using modern protocols.

GRIB.US Viewer (Free)

Expedition ($US 1295) Uses
polars Coast
al Curre
nt Wind

Expedition Offshore Also
available in LT (free)
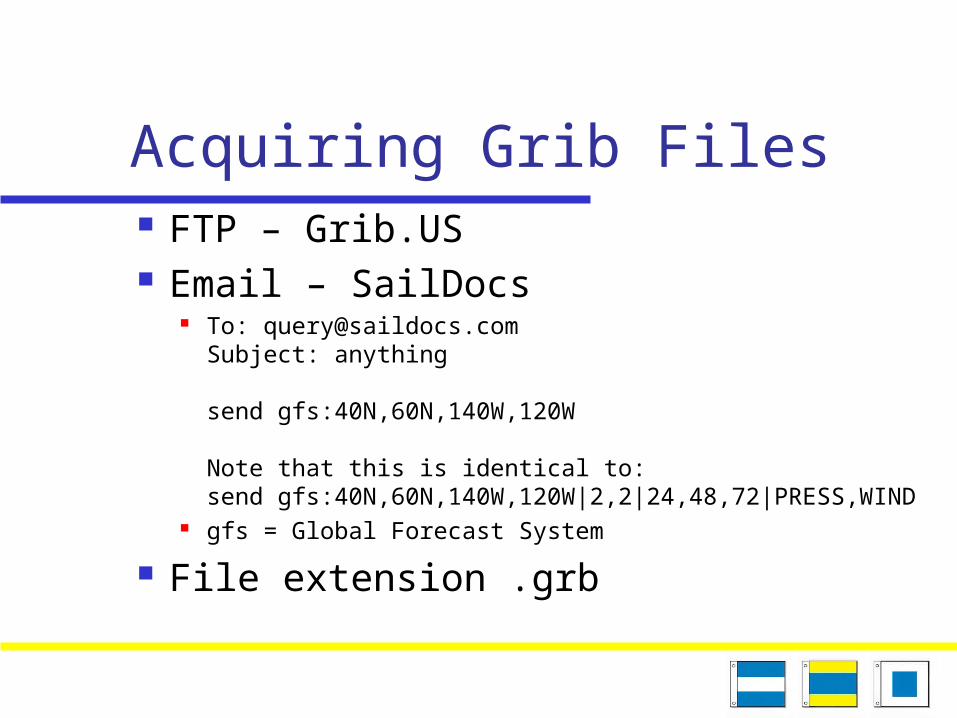
Acquiring Grib Files FTP – Grib.US Email – SailDocs
To: [email protected]: anything
send gfs:40N,60N,140W,120W
Note that this is identical to:send gfs:40N,60N,140W,120W|2,2|24,48,72|PRESS,WIND
gfs = Global Forecast System
File extension .grb

NAVTEX Used in Sea Area
A2 150 miles
offshore Synopsis Forecast Waves
NAVTEX ReceiverPrinterDisplayKeyboard
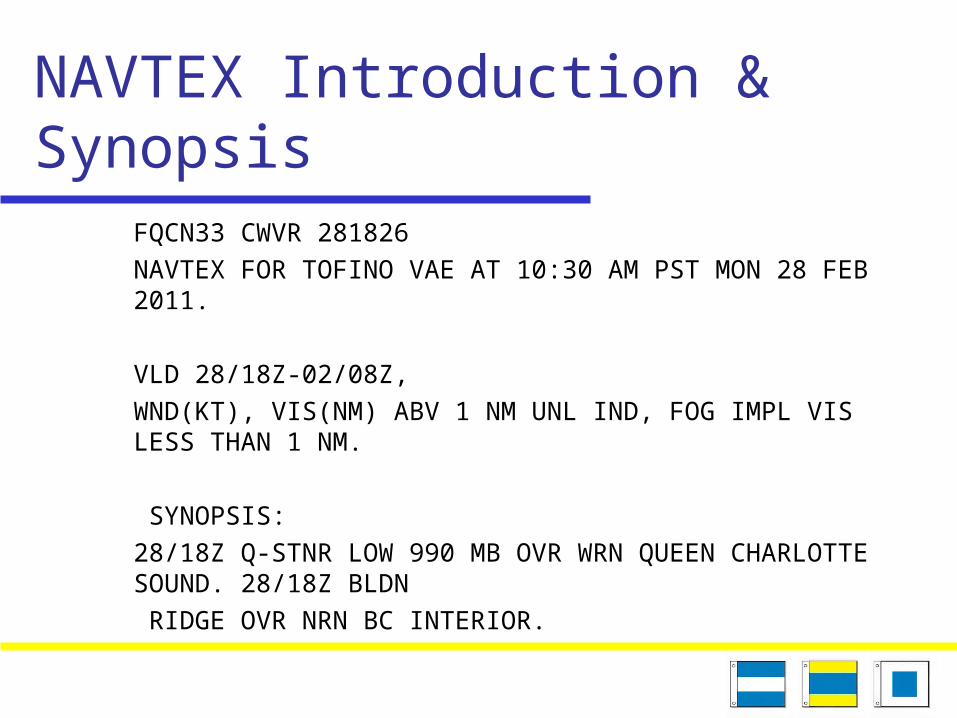
NAVTEX Introduction & Synopsis
FQCN33 CWVR 281826NAVTEX FOR TOFINO VAE AT 10:30 AM PST MON 28 FEB 2011. VLD 28/18Z-02/08Z,WND(KT), VIS(NM) ABV 1 NM UNL IND, FOG IMPL VIS LESS THAN 1 NM. SYNOPSIS:28/18Z Q-STNR LOW 990 MB OVR WRN QUEEN CHARLOTTE SOUND. 28/18Z BLDN RIDGE OVR NRN BC INTERIOR.
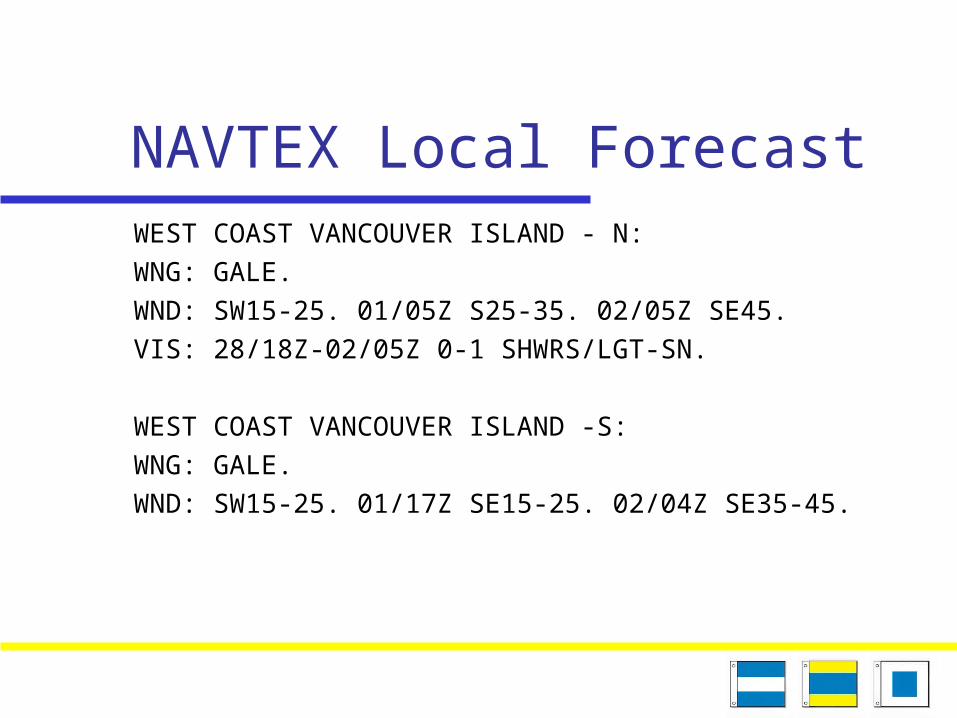
NAVTEX Local ForecastWEST COAST VANCOUVER ISLAND - N:WNG: GALE.WND: SW15-25. 01/05Z S25-35. 02/05Z SE45.VIS: 28/18Z-02/05Z 0-1 SHWRS/LGT-SN. WEST COAST VANCOUVER ISLAND -S:WNG: GALE.WND: SW15-25. 01/17Z SE15-25. 02/04Z SE35-45.

NAVTEX Local ForecastEXPLORER-NW:WNG: GALE.WND: W25-35. 01/16Z W15-25. 01/20Z V5-15. 02/04Z NE25. EXPLORER-SE:WNG: GALE.WND: SW25-30. 02/00Z SE30. 02/05Z SE45.
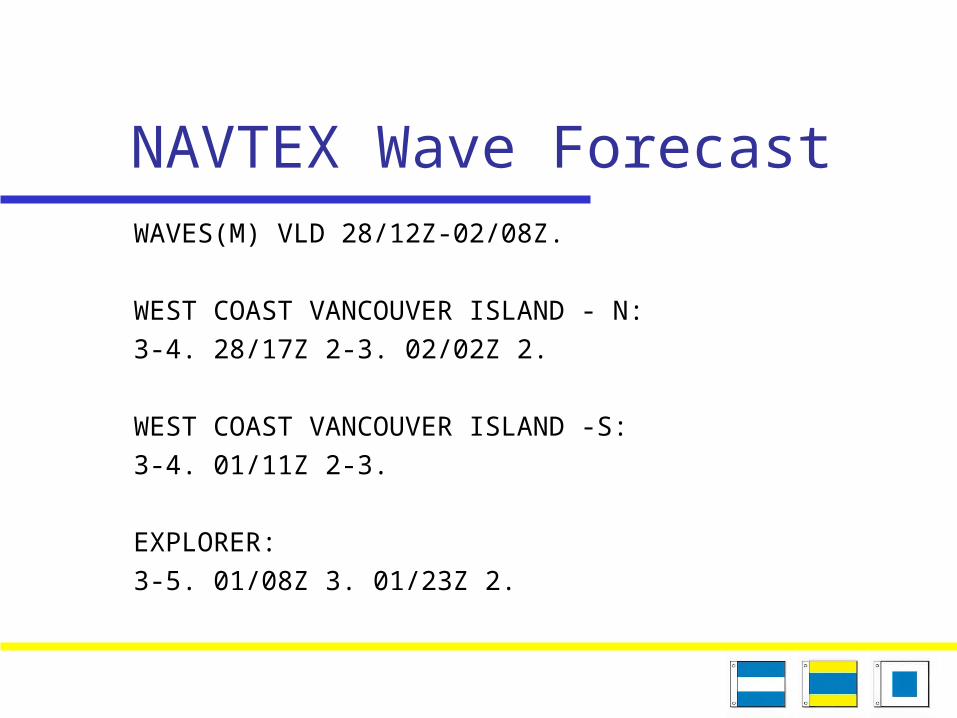
NAVTEX Wave ForecastWAVES(M) VLD 28/12Z-02/08Z. WEST COAST VANCOUVER ISLAND - N:3-4. 28/17Z 2-3. 02/02Z 2. WEST COAST VANCOUVER ISLAND -S:3-4. 01/11Z 2-3. EXPLORER:3-5. 01/08Z 3. 01/23Z 2.
Weather Routing Services Herb Hilgenberg
http://www3.sympatico.ca/hehilgen/vax498.htm Free
Commander’s Weather http://www.commandersweather.com/ Gulf Stream analysis as well Fee for service Sample forecast
http://www.commandersweather.com/index_files/Page346.htm

Web Sites NOAA WeatherFax Grib.us Predict Wind
http://forecast.predictwind.com/ Passage Weather
http://www.passageweather.com/ Buoy Weather
http://www.buoyweather.com/
Smartphone Apps Navionics Mobile versions
Passage Weather Buoy Weather