Marine Resources of Redwood National and State Parks
162
1 Pollicipes polymerus Phaeostrophion irregulare Dermasterias imbrica Oligocottus snyderi Photo by Yoav Bar-Ness Wendell Wood Katherine Hedges Wendell Wood Report Authored by: Karah Cox Cara McGary Tim Mulligan Sean Craig Departments of Fisheries Biology and Biological Sciences, Humboldt State University Marine Resources of Redwood National and State Parks Comprehensive Report (2004-2005) for Humboldt and Del Norte County, California
Transcript of Marine Resources of Redwood National and State Parks

1
Pollicipes polymerus Phaeostrophion irregulare Dermasterias imbrica Oligocottus snyderi Photo by Yoav Bar-Ness Wendell Wood Katherine Hedges Wendell Wood
Report Authored by: Karah Cox Cara McGary Tim Mulligan Sean Craig Departments of Fisheries Biology and Biological Sciences, Humboldt State University
Marine Resources of Redwood National and State Parks
Comprehensive Report (2004-2005) for Humboldt and Del Norte County, California

2
Marine Resources of Redwood
National and State Parks Comprehensive Report (2004-2005) for
Humboldt and Del Norte County, California
Principle Investigators: Dr. Tim Mulligan, Department of Fisheries Biology, Humboldt State University Dr. Sean Craig, Department of Biological Sciences, Humboldt State University Graduate Students: Karah Cox, Department of Fisheries Biology, Humboldt State University Cara McGary, Department of Biological Sciences, Humboldt State University Contributions by: Rebecca Studebaker, Department of Fisheries Biology, Humboldt State University Mark Lomeli, Department of Fisheries Biology, Humboldt State University In Cooperation with: Humboldt State University Redwood National and State Parks Telonicher Marine Lab US Department of the Interior Trinidad, CA 95570 Minerals Management Service Partnership for the Interdisciplinary Studies US Department of Interior of Coastal Oceans (PISCO) Long Marine Lab University of California Santa Cruz, CA 95060 Study #: REDW-00008 Permit #:REDW-2004-SCI-0005

3
TABLE OF CONTENTS TABLE OF CONTENTS.................................................................................................... 3
ACKNOWLEDGEMENTS................................................................................................ 4
LIST OF FIGURES ............................................................................................................ 6
LIST OF TABLES.............................................................................................................. 9
INTRODUCTION ............................................................................................................ 10
OBJECTIVES................................................................................................................... 10
STUDY REGION ............................................................................................................. 11
STUDY LOCATIONS...................................................................................................... 13
ROCKY INTERTIDAL INVENTORIES ........................................................................ 20
Inventories of Enderts Beach and False Klamath Cove................................................ 20 Coastal Biodiversity Survey at Damnation Creek ........................................................ 28
ROCKY INTERTIDAL MONITORING PROGRAM .................................................... 32
Rocky Intertidal Monitoring ......................................................................................... 32 Sea Star Monitoring ...................................................................................................... 53 Monitoring Discussion.................................................................................................. 57
SAND BEACH INVENTORY......................................................................................... 58
SAND BEACH MONITORING ...................................................................................... 59
INTERTIDAL FISHES .................................................................................................... 64
Rocky Intertidal Fish Inventory .................................................................................... 64 Rocky Intertidal Fish Monitoring ................................................................................. 72 Intertidal Juvenile Rockfish (Sebastes) Surveys........................................................... 89
MANAGEMENT IMPLICATIONS AND RECOMMENDATIONS ............................. 93
APPENDIX A: TIMELINE SUMMARY ...................................................................... 103
APPENDIX B: NATURAL HISTORY OF TARGET SPECIES .................................. 104
APPENDIX C: ROCKY INTERTIDAL INVENTORY LISTS: ................................... 107
APPENDIX D: SITE INFORMATION ......................................................................... 116
APPENDIX E: RAW INTERTIDAL MONITORING DATA ...................................... 133
APPENDIX F: SAND BEACH INVENTORY LIST .................................................... 140
APPENDIX G: RAW SAND BEACH MONITORING DATA .................................... 141
APPENDIX H: RAW FISH DATA TABLES................................................................ 143
APPENDIX I: TEMPERATURE DATA ....................................................................... 151

4
ACKNOWLEDGEMENTS Funding for this project was provided by Redwood National and State Parks. Many thanks to staff and volunteers from Redwood National and State Parks for their help with field work and logistics, including; Howard Sakai, Jeannie Mayer, Kyle Max, Terry Hines, Keith Benson, Greg Holm, Kristen Schmidt, Baker Holden, Dave Anderson, Beverly Shaw, Heather Ambrose, Heather Brown, Carol Wilson, Kim McFarland, Grant Alban, Matt Smith, Paul Paradine, Dan Thomas, Alfonso Campa, Ben Littlefield, Tim Shepherd, Elizabeth Perry, Laura Bridy, Kelley Breen, Bow O’Barr, and Lynn Mager. The field work required the help of many student researchers and volunteers including; Jody Gough, Becca Langhans, Rachael Wadsworth, Mark Lomeli, Kirsten Lomeli, Rebecca Studebaker, Summer Edwards, Carl Meredith, Emily Morris, Melissa Dean, Kristin Lane, Ryan Borque, Cate Roscoe, Amy Reiser, Steve McDonald, Justin Garwood, Katie McGourty, Adam Frimodig, Sharah Truett, Brooke Peterson, Drew Barrett, Kelly Weigle, Corrina Gillette, Melissa Bandy, Kenin Greer, Ricky Morales, Wendell Wood, Lorien Reynolds, Sean Kawamata, Katherine Hedges, Heidi Plowe, Lief Schall, Jamie Bettaso, and Whelen Gilkerson.
We would also like to thank the MMS and PISCO teams for aid in all aspects of this study including establishing protocols, field assistance, and technical support. They include Pete Raimondi, Jack Engle, Mary Elaine Dunaway, Melissa Miner, Kirsten Kusic, Christy Roe, Maya George, Haven Livingston, Hilary Hayford, Caroline Engle, Erin Maloney, and David Lohse. Scientific and field research assistance was given by Dr. Andrew Kinziger, Dan Richards, Dr. Bill Bigg, Dr. Frank Shaughnessy, and Ginger Tennent. We would also like to thank Dave Hoskins and Grant Eberle from the Telonicher Marine Lab for their help in building equipment and identifying inventory specimens; Anthony Baker in the biology stockroom for making supplies and equipment available; and Marty Reed and Lewis McCrigler in the biology workshop for their help building various pieces of sampling equipment.

5
Disclaimer The opinions, findings, conclusions, or recommendations expressed in this report are those of the authors, and do not necessarily reflect the views of the Redwood National and State Parks. Mention of trade names or commercial products does not constitute endorsement or recommendations for use.
6
LIST OF FIGURES Figure Number ...............................................................................................................Page Figure 1. Mean daily temperatures (oC) for three rocky intertidal study sites within the RNSP for July 2004 to November 2005. .......................................................................... 12 Figure 2. Map of northern Redwood National and State Parks showing locations of study sites.. ................................................................................................................................. 14 Figure 3. Enderts Beach, site for rocky intertidal monitoring. Aerial photograph ........... 15 Figure 4. Enderts Beach, RNSP rocky intertidal site used for tidepool fish studies......... 15 Figure 5. Damnation Creek, RNSP site for rocky intertidal monitoring, inventory and tidepool fish studies. Aerial photograph. .......................................................................... 16 Figure 6. False Klamath Cove, RNSP site for rocky intertidal monitoring and tidepool fish studies. ....................................................................................................................... 17 Figure 7. The south end of Crescent Beach, just inside the boundary of Redwood National and State Parks. .................................................................................................. 17 Figure 8. Gold Bluffs Beach near Espa Lagoon, RNSP central sandy beach site. Aerial photograph ........................................................................................................................ 18 Figure 9. Redwood Creek Beach, RNSP is the southern most sandy beach site sampled. Aerial photograph ............................................................................................................. 19 Figure 10. Transect lines used for Damnation Creek inventory, RNSP, June 2004......... 28 Figure 11. Schematic of the grid setup used in the biodiversity site survey showing the transect lines running from the baseline to the ocean, parallel to the 0m and 30m lines, every three meters along the upper baseline resulting in 11 transect lines. ...................... 30 Figure 12. Topographic map of Damnation Creek created by UCSC coastal biodiversity survey team. ...................................................................................................................... 30 Figure 13. Example of photoplots from sites within the RNSP taken in the 2004 monitoring surveys. The top two pairs of photos are of plots from different sampling periods showing change in species cover, over time. Bottom plot shows photo over laid with 100 point grid............................................................................................................ 34 Figure 14. PVC photo framer for photographing permanent 50 x 75 cm plots. A camera (not shown here) was mounted to the top brackets to ensure accurate replicate size. ...... 35 Figure 15. Percent coverage in five permanent barnacle (Chthamalus dalli/Balanus glandula) plots monitored from June 2004 to November 2005 at (A) Damnation Creek, (B) Enderts Beach, and (C) False Klamath Cove, RNSP. ................................................ 37 Figure 16. Percent coverage in five permanent Endocladia muricata plots monitored from June 2004 to November 2005 at (A) Damnation Creek, (B) Enderts Beach, and (C) False Klamath Cove, RNSP. ...................................................................................................... 38 Figure 17. Percent coverage in five permanent Fucus gardneri plots monitored from June 2004 to November 2005 at (A) Damnation Creek and (B) False Klamath Cove, RNSP. 39 Figure 18. Percent coverage in five permanent mussel (Mytilus californianus) plots monitored from June 2004 to November 2005 at (A) Damnation Creek, (B) Enderts Beach, and (C) False Klamath Cove, RNSP..................................................................... 40 Figure 19. Percent coverage in five permanent Pelvetiopsis limitata plots monitored from June 2004 to November 2005 at (A) Enderts Beach, and (B) False Klamath Cove, RNSP............................................................................................................................................ 41 Figure 20. Abundance of mobile invertebrates in five permanent barnacle (Chthamalus dalli/Balanus glandula) plots monitored from June 2004 to June 2005 at (A and B) Damnation Creek, (C and D) Enderts Beach, and (E and F) False Klamath Cove, RNSP............................................................................................................................................ 44

7
Figure Number ...............................................................................................................Page Figure 21. Abundance of mobile invertebrates in five permanent Endocladia muricata plots monitored from June 2004 to June 2005 at (A and B) Damnation Creek, (C and D) Enderts Beach, and (E and F) False Klamath Cove, RNSP.............................................. 45 Figure 22. Abundance of mobile invertebrates in five permanent Fucus gardneri plots monitored from June 2004 to June 2005 at (A and B) Damnation Creek and (C and D) False Klamath Cove, RNSP.............................................................................................. 46 Figure 23. Abundance of mobile invertebrates in five permanent mussel (Mytilus californianus) plots monitored from June 2004 to June 2005 at (A and B) Damnation Creek, (C and D) Enderts Beach, and (E and F) False Klamath Cove, RNSP. ................ 47 Figure 24. Abundance of mobile invertebrates in five permanent Pelvetiopsis limitata plots monitored from June 2004 to June 2005 at (A and B) Enderts Beach and (C and D) False Klamath Cove, RNSP.............................................................................................. 48 Figure 25. Size distribution of Tegula funebralis in Fucus plots, RNSP. ........................ 50 Figure 26. Size distribution of Nucella ostrina in mussel plots, RNSP............................ 51 Figure 27. Size distribution of Nucella ostrina in low salinity mussel plots located near the mouth of Damnation Creek, RNSP............................................................................. 52 Figure 28. Pisaster ochraceus abundances and colors. Note differences in scale. SP=spring samples, FA=fall samples, SU=summer samples. .......................................... 54 Figure 29. Pisaster ochraceus radius (mm) length frequency and abundances for orange (orange bars) and purple/other (purple bars) sea stars. Note different scale on y-axis for Enderts Beach. Data from four sampling events in 2004 and 2005 at three sites within RNSP................................................................................................................................. 55 Figure 30. Mean sizes of P. ochraceus at Enderts Beach, False Klamath Cove, and Damnation Creek, RNSP in 2004 and 2005 sampling events. ......................................... 56 Figure 31. Relative steepness of beach slopes at three study sites in RNSP, June 2004.. 59 Figure 32. Layout for sand crab (left) and beach hopper (right) population assessments at Crescent Beach, RNSP...................................................................................................... 60 Figure 33. HSU students using poke-polling as a method for intertidal fish inventory at Damnation Creek, RNSP on 5 February 2005.................................................................. 65 Figure 34. False Klamath Cove, RNSP intertidal area showing high and low zones....... 66 Figure 35. Damnation Creek, RNSP intertidal area showing high, mid and low zones... 67 Figure 36. Number of total fish collected at False Klamath Cove on 5 February 2005 and Damnation Creek on 6 February 2005, during an intertidal fish inventory of RNSP. ..... 69 Figure 37. Number of total fish collected in high, mid, and low tidal zones during intertidal inventory. Numbers were for combined sampling events on 5-6 February 2005 at False Klamath Cove and Damnation Creek, RNSP...................................................... 70 Figure 38. Total abundances of two sculpin species, Oligocottus snyderi and Oligocottus maculosus, during an intertidal fish inventory. Numbers are from sampling events on 5 February 2005 at Damnation Creek and 6 February 2005 at False Klamath Cove, RNSP............................................................................................................................................ 71 Figure 39. Monkeyface prickleback, Cebidichthys violaceus, being measured with calipers by researcher at RNSP (left). Researchers bailing tidepools at Enderts Beach for intertidal fish surveys (right)............................................................................................. 74 Figure 40. Size frequency distribution for (A.) Oligocottus maculosus, Tidepool Sculpin and (B.) Oligocottus snyderi, Fluffy Sculpin in combined sampling events from Damnation Creek, Enderts Beach, and False Klamath Cove, 2004-2005. ....................... 78

8
Figure Number ...............................................................................................................Page Figure 41. False Klamath Cove, RNSP intertidal fish site showing monitored tidepools (1-8) with the average number of fish caught per sampling event, 2004-2005. ............... 79 Figure 42. Damnation Creek, RNSP intertidal fish site showing monitored tidepools (1-8) with the average number of fish caught per sampling event, 2004-2005 . ....................... 80 Figure 43. Enderts Beach, RNSP intertidal fish site showing monitored tidepools (1-8) with the average number of fish caught per sampling event, 2004-2005 ......................... 81 Figure 44. Researchers deploying a beach seine at Gold Bluffs Beach, RNSP 2004....... 83 Figure 45. Fish abundances for 2004 beach seining efforts at Gold Bluffs Beach and Crescent Beach, RNSP. Numbers are totaled for all dates and all tows........................... 85 Figure 46. Fish abundances for 2005 beach seining efforts at Gold Bluffs Beach and Crescent Beach, RNSP. Numbers are totaled for all dates and all tows........................... 85 Figure 47. Size frequency distribution for Walleye surfperch, Hyperprosopon argenteum,........................................................................................................................................... 87 Figure 48. Size frequency distribution for Redtail surfperch, Amphistichus rhodoterus . 87 Figure 49. Scientists preparing to deploy a beach seine in RNSP (left). Juvenile redtail surfperch, Amphistichus rhodoterus. ................................................................................ 88 Figure 50. YOY black rockfish, Sebastes melanops, displaying elastomer tag used to mark fish in study (Lomeli et al. 2004)............................................................................. 90 Figure 51. Total number of black rockfish, Sebastes melanops, marked and recaptured per pool at False Klamath Cove, Redwood National and State Park, CA, 06 June to 28 August 2004. ..................................................................................................................... 91 Figure 52. Total number of tagged Sebastes melanops recaptured over time (from 1 to 74 days) at False Klamath Cove, Redwood National and State Park, CA............................. 91

9
LIST OF TABLES Table Number ................................................................................................................Page Table 1. Algal taxa inventoried at False Klamath Cove and Enderts Beach July, 2005. . 21 Table 2. Invertebrate taxa inventoried at False Klamath Cove and Enderts Beach in July, 2005................................................................................................................................... 24 Table 3. List of invertebrate and algal taxa from inventory conducted in June 2004 at Damnation Creek, RNSP by UCSC coastal biodiversity survey team. ............................ 31 Table 4. Photo-plot type and number of replicates at each site, RNSP. ........................... 33 Table 5. Correlation matrix shows associations between mobile invertebrates and sessile taxa. Spearman correlation values >0.3 indicate an association. These associations are generally consistent between the matrices for (A) June 2004 and (B) June 2005. ........... 49 Table 6. Sand beach invertebrate taxa inventoried at Crescent Beach, Gold Bluffs Beach, and Redwood Creek Beach in August, 2005.. .................................................................. 58 Table 7. Washzone transect species abundance summary. Mean number of sand crabs (Emerita analoga) per meter of beach sampled on (A) May 2004, (B) July 2004, and (C) August 2005. ..................................................................................................................... 61 Table 8. Emerita analoga reproductive population percentage. Totals and mean/m from five transects per beach sampled on (A) May 2004, (B) July 2004, and (C) August 2005, RNSP................................................................................................................................. 61 Table 9. Emerita analoga numbers by gender and egg developmental stage sampled August 2005, RNSP. ......................................................................................................... 62 Table 10. Summarized abundance of amphipods in upper–beach transects..................... 62 Table 11. Intertidal and nearshore fish sampling for Enderts Beach, Damnation Creek, and False Klamath Cove in 2004 and 2005 RNSP surveys. ............................................. 64 Table 12. Count of fish species sampled at Damnation Creek and False Klamath Cove, RNSP during an inventory conducted 5-6 February 2005................................................ 68 Table 13. Monitoring list of rocky intertidal fishes found in RNSP 2004........................ 72 Table 14. Sampling schedule for Enderts Beach, Damnation Creek, and False Klamath Cove, RNSP rocky intertidal fish monitoring 2004-2005. ............................................... 73 Table 15. Abundance, average total length (mm) and size range (mm) for intertidal fish groups................................................................................................................................ 75 Table 16. Abundances of intertidal fish sampled at Damnation Creek, Enderts Beach and False Klamath Cove, RNSP during sampling periods, 2004-2005................................... 76 Table 17. Total number of fish sampled during each sampling period in 2004-2005 at False Klamath Cove, Damnation Creek and Enderts Beach, RNSP................................. 77 Table 18. Inventory of sandy nearshore fishes from beach seining efforts at Gold Bluffs Beach and Crescent Beach, RNSP in 2004 - 2005. .......................................................... 84 Table 19. Total number of fish collected for combined beach seines during spring (20-21 May 2004) and summer (15-18 July 2004 and 18-19 August 2005) at Gold Bluffs Beach and Crescent Beach, RNSP. Numbers in parenthesis show average number per tow...... 86 Table 20. Average size (TL,mm) of fish species collected for combined beach seines during spring (20-21 May 2004) and summer (15-18 July 2004 and 18-19 August 2005) at Gold Bluffs Beach and Crescent Beach, RNSP............................................................ 86
10
Marine Resources of Redwood National and State Parks
INTRODUCTION The coastline of northern California is home to a diverse array of nearshore habitats from bays and estuaries to wind-swept sandy shores and surf sculpted rocky intertidal areas. These habitats contain a stunning variety of species. Geographic location, habitat diversity, and complex oceanographic patterns are all thought to contribute to the rich diversity of marine life in this area. This region forms the boundary of two major biogeographic provinces; the cold, temperate Oregonian, and the warm, temperate Californian provinces (Miner et al. in prep). The coastline of Redwood National and State Parks (RNSP) is primarily composed of sand beaches (of varying grain size) and rocky intertidal areas dominated by boulders and small bench areas. The major focus of this report is to provide an account of the algal, invertebrate, and fish diversity found in the nearshore habitats of RNSP, and to describe the patterns of variability of the abundant and ecologically important species. Biodiversity surveys and population monitoring provide baseline information essential for detection, assessment, and study of the short- and long-term effects of natural as well as anthropogenic disturbances such as severe storms, flood events, tsunamis, and oil spills. Monitoring also provides fundamental ecological knowledge of system dynamics. When incorporated on a regional scale, monitoring studies can also be utilized to plan more effective management strategies (Miner et al. in prep).
OBJECTIVES This project was initiated in order to provide a report on the marine resources of the Redwood National and State Parks. The intent of this report is to effectively characterize the 35-mile coastline with regards to the physical habitat and the invertebrate, algal, and fish intertidal communities. The species distribution in the intertidal was examined on a broad species presence/absence scale and then at a finer scale focusing on discrete plots or pools. This entailed both an inventory of the algal, invertebrate, and fish species present at selected sites, as well as seasonal monitoring of abundant and/or ecologically important organisms. Goals of the inventory program include:
1. Creating an exhaustive species list of the intertidal marine algae, invertebrates, and fish.
2. Comparing this list with previous studies conducted in RNSP (Boyd and DeMartin 1977 and 1981)
3. Establishing a voucher collection of identified specimens for use at RNSP.

11
Goals of the monitoring program include: 1. Establishing baseline data on the intertidal communities of the RNSP. 2. Collecting data on the spatial and temporal distribution of target species
throughout the intertidal area. 3. Presenting information that could be used to help assess damage caused by oil
spills or other disturbances. 4. Setting up a long-term program in order to monitor natural changes over time.
STUDY REGION Much of Redwood National and State Parks is underlain by rocks of the Franciscan
assemblage. The Franciscan assemblage consists of rock that has been sheared and lifted from the ocean floor as a result of plate action along the Cascadia subduction zone (Bailey 1966). The rock along the coast from Enderts Beach to the mouth of Redwood Creek is primarily composed of sandstone and mudstone. Beaches in the southern half of RNSP were created by wave induced erosion of the coastal cliffs (Boyd and DeMartini 1977). This coast is exposed to the open ocean with regular waves predominately striking the shore from the northwest. Wave height typically ranges from 1-2 meters, but occasional storm events produce waves of greater than 7 meters. The average significant wave height registered at the National Oceanic Atmospheric Assosiation’s Point St. George marine bouy, 8 nautical miles west- northwest of Crescent City, CA, registered an average significant wave height of 2.24 meters for 2004. The max wave height measured for 2004 was 7.55 meters (data from NOAA marine buoy #46027). The organisms inhabiting this wave exposed intertidal region have evolved many specialized life history and physiological adabtations to withstand the strong forces resulting from wave action. They must be able to hang on, by means of strong attachment, or hide, by finding shelter beneath rocks or other organisms.
The consistenly cold water temperatures of this coastline are regulated by the north to south flowing California current. The west coast of North America experiences seasonal upwhelling of cold, nutrient rich subsurface waters. This is a result of wind patterns that cause surface waters to be pushed offshore and subsurface water to rise and replace it. Seasonal upwhelling produces increased primary productivity, which is thought to contribute to some of the variability in annual recruitment of many species. Upwhelling is generally greatest in spring and summer and decreases in early fall. In 2005 upwhelling occurred later in the year (PFEL annual upwhelling anomaly). We monitored water temperatures at three sites using ONSET tidbit© temperature loggers set at 15 minute time intervals. Surface water temperatures recorded at the study sites fluctuated between 9 and 15 oC (Figure 1). Salinity at the sites remained at around 33-34 PPT with the exception of a few instances after heavy rains which decreased salinity, especially near river mouths.

12
False K lam ath C ove
Jan M ay Sep Jan M ay Sep Jan 8
10
12
14
16
18
Enderts B each
Mea
n O
cean
Tem
pera
ture
( C
o ) 8
10
12
14
16
18
2004 2005
D am nation C reek
8
10
12
14
16
18
Figure 1. Mean daily temperatures (oC) for three rocky intertidal study sites within the RNSP for July 2004 to November 2005.

13
STUDY LOCATIONS All study sites are located within the Redwood National and State Parks on the
northern California coast, USA (Figure 2) Rocky intertidal sites included: False Klamath Cove, Enderts Beach, and Damnation Creek. Inventories, monitoring, and tidepool fish surveys were conducted at each of these beaches.
Enderts Beach (N 41.69592, W 124.14245) is the northern-most site, located just south of the rocks jutting out of the point at the south end of Crescent Beach (Figure 3). The site is comprised of a large, gently sloping bench (approx. 100 m wide) and a series of three smaller benches separated by rocky trenches and cobble beds. Rocky intertidal inventory and monitoring took place on the three small rocky benches. Tidepool fish monitoring occurred 0.5 k upcoast from these benches (Figure 4).
Damnation Creek (N 41.65249, W 124.12784) is 6.5 kilometers north of False Klamath Cove and 5 kilometers south of Enderts Beach. It is an extensive rocky bench cut by channels, with a few large sedentary boulders at its seaward edge (Figure 5). The landward edge of the bench has an accumulation of smooth cobble. The site is near the mouth of Damnation Creek, but monitoring plots were established on either side of the creek’s outflow, far enough away to avoid freshwater input.
False Klamath Cove (N 41.59377, W 124. 10773) is located just south of Wilson Creek, about 5 miles north of the Klamath River mouth. It is the southern-most rocky intertidal site surveyed (Figure 6). This site has variable substrate that ranges from coarse sand to large boulders. There is potential for temporal variation in sand scour and boulder movement. The intertidal study site is peninsula-like with ocean to the north and south, and a sea stack (approx. 75 m tall and 100 m wide) at the west end. The peninsula stretches approximately 250 meters long with a width of approximately 100 meters. It is a gently sloping field of boulders and small rock benches. Sampling was restricted to large sedentary boulders and small rocky benches.
Sandy intertidal sites, from north to south, include: Crescent Beach (N 41.72508, W 124.15252), Gold Bluffs Beach (N 41.35922, W 124.07476), and Redwood Creek Beach (N 41.28788, W 124.09130). These three beaches are representative of the range of beach types found within RNSP.
Crescent Beach is located on the northern border of the park, 38 kilometers north of Gold Bluffs Beach (Figure 7). It has the shallowest slope of the three sand beach study sites and fine grain sand. Because it is so flat, waves linger over the sand longer than they would on a steep or reflective beach such as Redwood Creek Beach. As the wave swash lingers, detritus settles out into the sand providing the nutrients that contribute to the high productivity and diversity of Crescent Beach (Boyd and DeMartini 1977).
Gold Bluffs Beach is located approximately 14.4 kilometers north of Redwood Creek Beach, in the center of the park near Fern Canyon. It has intermediate sediment size, slope and productivity (Figure 8).
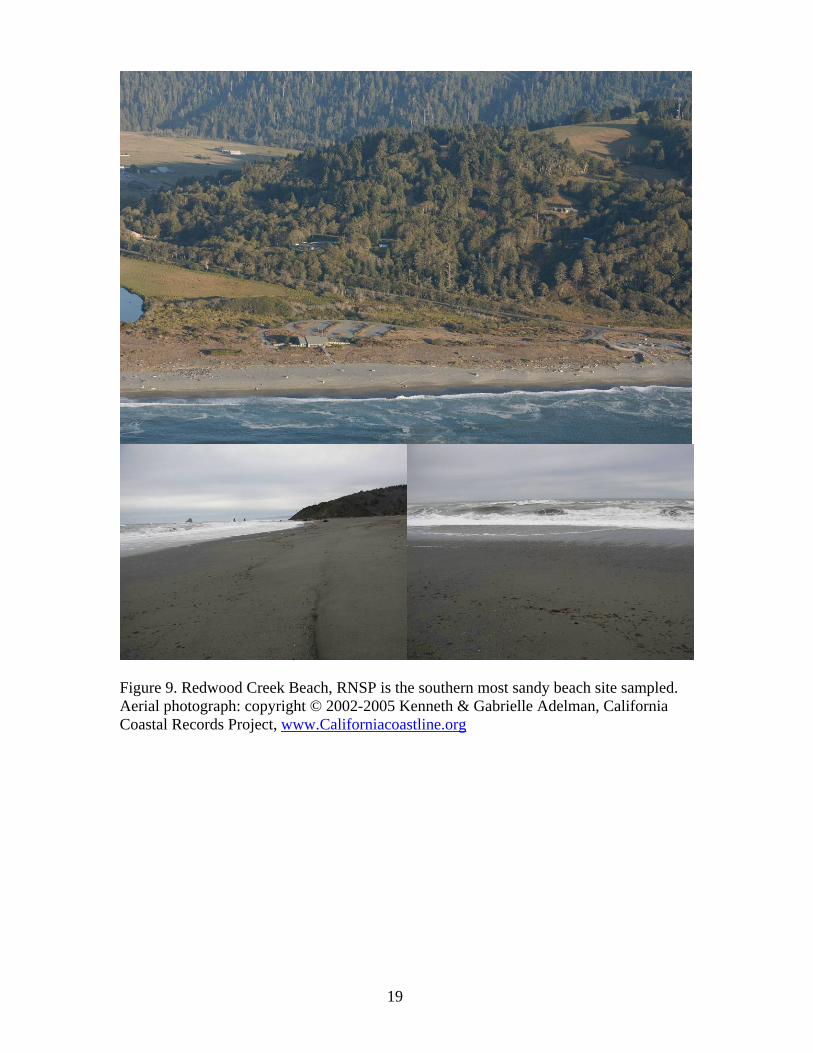
Redwood Creek Beach is located near the southern end of RNSP (Figure 9). It is characterized by coarse sand, a steep beach slope, and low biological productivity. Sand beach inventories and monitoring for amphipod and sand crab populations were conducted at all three sites. Beach seines were used to inventory nearshore fish at Gold Bluffs Beach and Crescent Beach. Strong surf at Redwood Creek Beach was prohibitive to beach seining.

14
Figure 2. Map of northern Redwood National and State Parks showing locations of study sites. Modified from RNSP website: www.nps.gov/redw/pphtml/maps.html.

15
Figure 3. Enderts Beach, site for rocky intertidal monitoring. Aerial photograph: copyright © 2002-2005 Kenneth & Gabrielle Adelman, California Coastal Records Project, www.Californiacoastline.org
Figure 4. Enderts Beach, RNSP rocky intertidal site used for tidepool fish studies.

16
Figure 5. Damnation Creek, RNSP site for rocky intertidal monitoring, inventory and tidepool fish studies. Aerial photograph: copyright © 2002-2005 Kenneth & Gabrielle Adelman, California Coastal Records Project, www.Californiacoastline.org.

17
Figure 6. False Klamath Cove, RNSP site for rocky intertidal monitoring and tidepool fish studies.
Figure 7. The south end of Crescent Beach, just inside the boundary of Redwood National and State Parks. Northern-most site for sand beach sampling and fish seining. Aerial photograph: copyright © 2002-2005 Kenneth & Gabrielle Adelman, California Coastal Records Project, www.Californiacoastline.org

18
Figure 8. Gold Bluffs Beach near Espa Lagoon, RNSP central sandy beach site. Aerial photograph: copyright © 2002-2005 Kenneth & Gabrielle Adelman, California Coastal Records Project, www.Californiacoastline.org
19
Figure 9. Redwood Creek Beach, RNSP is the southern most sandy beach site sampled. Aerial photograph: copyright © 2002-2005 Kenneth & Gabrielle Adelman, California Coastal Records Project, www.Californiacoastline.org

20
ROCKY INTERTIDAL INVENTORIES
Inventories of Enderts Beach and False Klamath Cove Biological inventories are important indicators of biodiversity within specific sites
or habitats. We have conducted biological inventories at three rocky intertidal sites to determine the diversity of invertebrate and algal species present. Biological inventories had not been conducted in Redwood National and State Park’s rocky intertidal since the late 1970’s (Boyd and DeMartini 1977 and 1981). Boyd and DeMartini’s inventories were conducted at Enderts Beach, False Klamath Cove, and Point Saint George (North of Crescent City and outside of RNSP boundaries). We have re-inventoried Enderts Beach and False Klamath Cove using the same techniques as Boyd and DeMartini (1977 and 1981). The biological inventory at Damnation Creek was conducted using a slightly different protocol, discussed below.
Multiple teams of two to three people spread out over the study site with a check-list of species. Teams targeted a zone or taxonomic group based on their expertise. All student researchers were required to have taken invertebrate zoology and/or phycology courses in order to assist with the inventory. Phycology experts, Dr. Frank Shaughnessy and Ginger Tennent, assisted with collection and identification of algae. Voucher specimens were collected for all possible invertebrate and algal species. Some species were photographed in leu of collection due to preservation difficulties. Algae were identified using Abbott and Hollenberg (1976) and Gabrielson et al. (2004). Invertebrates were identified using Morris et al. (1980) Kozloff (1993), and Kozloff (1996).
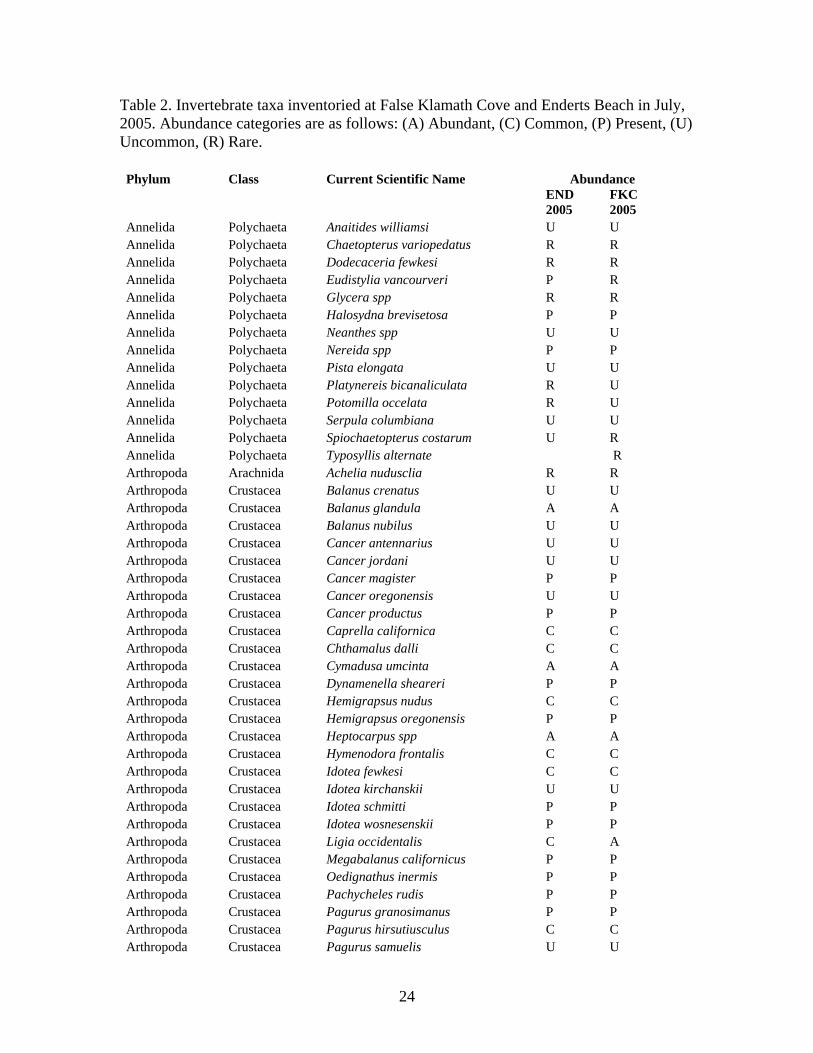
A total of 114 algal taxa were recored in inventories of False Klamath Cove and Enderts Beach (Table 1). Thirty eight agal species were found at these sites in 2005 that were not listed by Boyd and DeMartini (1977 and 1981; Appendix C). Invertebrate inventories at False Klamath Cove and Enderts Beach recorded a total of 176 invertebrates (Table 2). Of these, 77 were not previously recorded within RNSP (Boyd and DeMartini 1977 and 1981, Appendix C). A number of nomenclature updates have also been noted in Appendix C.

21
Table 1. Algal taxa inventoried at False Klamath Cove and Enderts Beach in July, 2005. Abundance categories are as follows: (A) Abundant, (C) Common, (P) Present, (U) Uncommon, (R) Rare. Zone categories indicate that a taxa is generally found in the (H) High, (M) Mid, or (L) Low intertidal zone. Phylum Current Scientific Name Zone Abundance
END 2005
FKC 2005
Anthophyta Phyllospadix scouleri M/L C A Anthophyta Phyllospadix torreyi M/L U R Chlorophyta Acrosiphonia arcta M P U Chlorophyta Acrosiphonia coalita M P P Chlorophyta Acrosiphonia mertensii M R P Chlorophyta Blindingia minima var. minima H U U Chlorophyta Cladophora columbiana H/M U P Chlorophyta Cladophora hutchinsiae H/M R U Chlorophyta Codium setchellii M R Chlorophyta Ulva californica H/M U C Chlorophyta Ulva intestinalis H/M R P Chlorophyta Ulva lactuca M U Chlorophyta Ulva linza M U C Chlorophyta Ulva lobata M U P Chlorophyta Ulva spp M U P Chlorophyta Ulva taeniata M/L P Phaeophyta Alaria marginata L P P Phaeophyta Analipus japonicus M U U Phaeophyta Analipus spp M U U Phaeophyta Berkeleya spp H/M C C Phaeophyta Colpomenia spp M/L U C Phaeophyta Cystoseira osmundacea L DRIFT DRIFT Phaeophyta Desmarestia ligulata L/M R Phaeophyta Egregia menziesii M C C Phaeophyta Fucus gardneri H/M P A Phaeophyta Haplogloia andersonii L U Phaeophyta Hedophyllum sessile M/L C C Phaeophyta Laminaria setchellii L C P Phaeophyta Laminaria sinclairii L P P Phaeophyta Leathesia difformis H/M U C Phaeophyta Lessoniopsis littoralis L U R Phaeophyta Nereocystis luetkeana L U U Phaeophyta Pelvetiopsis limitata H/M A A Phaeophyta Phaeostrophion irregulare M/L U Phaeophyta Postelsia palmaeformis L U Phaeophyta Pterygophora californica L P Phaeophyta Ralfsia spp L U U Phaeophyta Ralfsiaceae H/M P P Phaeophyta Scytosiphon lomentaria M/L R Phaeophyta Soranthera ulvoidea H/M P C Rhodophyta Ahnfeltia fastigiata H U U

22
Phylum Current Scientific Name Zone Abundance
END 2005
FKC 2005
Rhodophyta Ahnfeltiopsis gigartinoides M U U Rhodophyta Ahnfeltiopsis leptophyllus H/M U Rhodophyta Ahnfeltiopsis linearis H/M P U Rhodophyta Bossiella chiloensis L U C Rhodophyta Bossiella orbigniana dichotoma L P C Rhodophyta Bossiella plumose L P U Rhodophyta Calliarthron tuberculosum L U Rhodophyta Callithamnion pikeanum H P P Rhodophyta Callithamnion spp H P P Rhodophyta Callophyllis pinnata L U U Rhodophyta Ceramium pacificum M/L P C Rhodophyta Chondracanthus canaliculatus M/L U U Rhodophyta Chondracanthus spinosus L U R Rhodophyta Clathromorphum reclinatum L R R Rhodophyta Constantinea simplex L P P Rhodophyta Corallina officinalis chilensis L P P Rhodophyta Corrallina vancouveriensis L C P Rhodophyta Cryptopleura lobulifera L U P Rhodophyta Cryptopleura ruprechtiana L U U Rhodophyta Cryptopleura violacea L U U Rhodophyta Cryptosiphonia spp M P U Rhodophyta Cryptosiphonia woodii M P U Rhodophyta Dilsea californica L P P Rhodophyta Endocladia muricata H/M A C Rhodophyta Erythrophyllum delesserioides L U Rhodophyta Farlowia mollis M P P Rhodophyta Gelidium coulteri H/M U U Rhodophyta Gloiopeltis furcata M U U Rhodophyta Grateloupia lanceolata L U P Rhodophyta Grateloupia setchellii L R Rhodophyta Halosaccion glandiforme H/M R U Rhodophyta Halymenia californica L U Rhodophyta Halymenia schizymenoides H/M U U Rhodophyta Hildebrandia/Peyssonnelia spp M/L P P Rhodophyta Hymenena cuneifolia L R U Rhodophyta Hymenena flabelligera L U U Rhodophyta Hymenena multiloba M/L U U Rhodophyta Lithophyllum dispar L U R Rhodophyta Mastocarpus jardinii H/M C C Rhodophyta Mastocarpus papillatus H/M C C Rhodophyta Mastocarpus spp (sporophyte stage) H/M C A Rhodophyta Mazzaella flaccida M U P Rhodophyta Mazzaella oregona M P P Rhodophyta Mazzaella splendens L P A Rhodophyta Melobesia mediocris L P P Rhodophyta Microcladia borealis L C C Rhodophyta Microcladia coulteri M/L P P
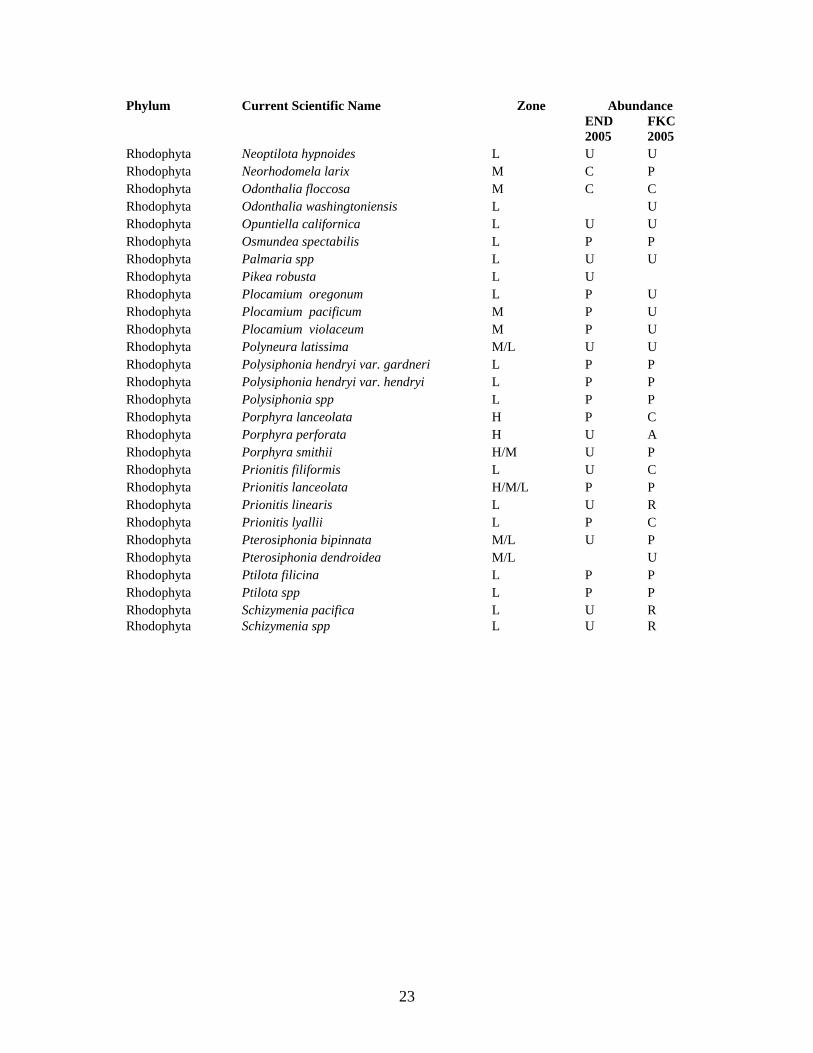
23
Phylum Current Scientific Name Zone Abundance
END 2005
FKC 2005
Rhodophyta Neoptilota hypnoides L U U Rhodophyta Neorhodomela larix M C P Rhodophyta Odonthalia floccosa M C C Rhodophyta Odonthalia washingtoniensis L U Rhodophyta Opuntiella californica L U U Rhodophyta Osmundea spectabilis L P P Rhodophyta Palmaria spp L U U Rhodophyta Pikea robusta L U Rhodophyta Plocamium oregonum L P U Rhodophyta Plocamium pacificum M P U Rhodophyta Plocamium violaceum M P U Rhodophyta Polyneura latissima M/L U U Rhodophyta Polysiphonia hendryi var. gardneri L P P Rhodophyta Polysiphonia hendryi var. hendryi L P P Rhodophyta Polysiphonia spp L P P Rhodophyta Porphyra lanceolata H P C Rhodophyta Porphyra perforata H U A Rhodophyta Porphyra smithii H/M U P Rhodophyta Prionitis filiformis L U C Rhodophyta Prionitis lanceolata H/M/L P P Rhodophyta Prionitis linearis L U R Rhodophyta Prionitis lyallii L P C Rhodophyta Pterosiphonia bipinnata M/L U P Rhodophyta Pterosiphonia dendroidea M/L U Rhodophyta Ptilota filicina L P P Rhodophyta Ptilota spp L P P Rhodophyta Schizymenia pacifica L U R Rhodophyta Schizymenia spp L U R
24
Table 2. Invertebrate taxa inventoried at False Klamath Cove and Enderts Beach in July, 2005. Abundance categories are as follows: (A) Abundant, (C) Common, (P) Present, (U) Uncommon, (R) Rare. Phylum Class Current Scientific Name Abundance
END 2005
FKC 2005
Annelida Polychaeta Anaitides williamsi U U Annelida Polychaeta Chaetopterus variopedatus R R Annelida Polychaeta Dodecaceria fewkesi R R Annelida Polychaeta Eudistylia vancourveri P R Annelida Polychaeta Glycera spp R R Annelida Polychaeta Halosydna brevisetosa P P Annelida Polychaeta Neanthes spp U U Annelida Polychaeta Nereida spp P P Annelida Polychaeta Pista elongata U U Annelida Polychaeta Platynereis bicanaliculata R U Annelida Polychaeta Potomilla occelata R U Annelida Polychaeta Serpula columbiana U U Annelida Polychaeta Spiochaetopterus costarum U R Annelida Polychaeta Typosyllis alternate R Arthropoda Arachnida Achelia nudusclia R R Arthropoda Crustacea Balanus crenatus U U Arthropoda Crustacea Balanus glandula A A Arthropoda Crustacea Balanus nubilus U U Arthropoda Crustacea Cancer antennarius U U Arthropoda Crustacea Cancer jordani U U Arthropoda Crustacea Cancer magister P P Arthropoda Crustacea Cancer oregonensis U U Arthropoda Crustacea Cancer productus P P Arthropoda Crustacea Caprella californica C C Arthropoda Crustacea Chthamalus dalli C C Arthropoda Crustacea Cymadusa umcinta A A Arthropoda Crustacea Dynamenella sheareri P P Arthropoda Crustacea Hemigrapsus nudus C C Arthropoda Crustacea Hemigrapsus oregonensis P P Arthropoda Crustacea Heptocarpus spp A A Arthropoda Crustacea Hymenodora frontalis C C Arthropoda Crustacea Idotea fewkesi C C Arthropoda Crustacea Idotea kirchanskii U U Arthropoda Crustacea Idotea schmitti P P Arthropoda Crustacea Idotea wosnesenskii P P Arthropoda Crustacea Ligia occidentalis C A Arthropoda Crustacea Megabalanus californicus P P Arthropoda Crustacea Oedignathus inermis P P Arthropoda Crustacea Pachycheles rudis P P Arthropoda Crustacea Pagurus granosimanus P P Arthropoda Crustacea Pagurus hirsutiusculus C C Arthropoda Crustacea Pagurus samuelis U U

25
Phylum Class Current Scientific Name Abundance
END 2005
FKC 2005
Arthropoda Crustacea Parallorchestes ochotensis C A Arthropoda Crustacea Petrolisthes cinctipes P C Arthropoda Crustacea Petrolisthes manimculis P P Arthropoda Crustacea Pollicipes polymerus C C Arthropoda Crustacea Pugettia producta P C Arthropoda Crustacea Semibalanus cariosus P C Arthropoda Crustacea Synidotea laticauda C C Brachipoda Inarticulata Terebratalia transversa R Bryozoa Gymnolaemata Bugula californica C C Bryozoa Gymnolaemata Eurystomella bilabiata P P Bryozoa Gymnolaemata Flustrellidra corniculata C C Chordata Tunicata Aplidium californicum C A Chordata Tunicata Aplidium solidum C P Chordata Tunicata Aplidium spp. C P Chordata Tunicata Archidistoma ritteri P C Chordata Tunicata Chelysoma columbium C P Chordata Tunicata Clavelina huntsmani C C Chordata Tunicata Ritterella spp C A Chordata Tunicata Ritterella spp P A Chordata Tunicata Styela montereyensis P C Cnidaria Anthozoa Anthopleura Artemisia P P Cnidaria Anthozoa Anthopleura elegantissima A A Cnidaria Anthozoa Anthopleura xanthogrammica A A Cnidaria Anthozoa Balanophyllia elegans R R Cnidaria Anthozoa Epiactis prolifera U U Cnidaria Anthozoa Gersemia rudiformis R Cnidaria Anthozoa Uritcina coriacea U U Cnidaria Anthozoa Urticina crassicornis U U Cnidaria Hydrozoa Abietinaria spp P P Cnidaria Hydrozoa Aglaophenia latirostris P P Cnidaria Hydrozoa Dynanmena operculata C C Cnidaria Hydrozoa Ectopleura marina P P Cnidaria Hydrozoa Garveia annulata P P Cnidaria Hydrozoa Obelia dichotoma C C Cnidaria Hydrozoa Plumularia spp P P Cnidaria Hydrozoa Sertularia furcata C C Cnidaria Hydrozoa Symplectoscyphus turgidus C P Cnidaria Hydrozoa Thuiaria spp U U Echinodermata Asteroidea Patiria miniata U U Echinodermata Asteroidea Dermasterias imbricate P C Echinodermata Asteroidea Evasterias troschelii P P Echinodermata Asteroidea Henricia leviuscula P P Echinodermata Asteroidea Henricia sanguinolenta P P Echinodermata Asteroidea Leptasterias hexactis C C Echinodermata Asteroidea Pisaster ochraceus A A Echinodermata Asteroidea Pycnopodia helianthoides C C

26
Phylum Class Current Scientific Name Abundance
END 2005
FKC 2005
Echinodermata Asteroidea Solaster stimpsoni P U Echinodermata Echinoidea Strongylocentrotus purpuratus P C Echinodermata Holothuroidea Cucumaria miniata P P Echinodermata Holothuroidea Eupentacta quinquesemita U C Mollusca Bivalvia Crassadoma spp P P Mollusca Bivalvia Mya arenaria P U Mollusca Bivalvia Mytilus californianus A A Mollusca Bivalvia Pododesmus cepio P U Mollusca Bivalvia Protothaca staminea U P Mollusca Cephalopoda Enteroctopus dofleini R U Mollusca Gastropoda Acmaea mitra P P Mollusca Gastropoda Alia carinata P P Mollusca Gastropoda Amphissa columbiana C C Mollusca Gastropoda Amphissa versicolor C C Mollusca Gastropoda Anisodoris nobilis U U Mollusca Gastropoda Archidoris montereyensis P U Mollusca Gastropoda Bittium eschrichtii U R Mollusca Gastropoda Cadlina inteomarginata U U Mollusca Gastropoda Calliostoma canaliculatum P U Mollusca Gastropoda Calliostoma ligatum U P Mollusca Gastropoda Ceratostoma foliatum U U Mollusca Gastropoda Cutiona spp R Mollusca Gastropoda Dendronotus albopunctuatus U U Mollusca Gastropoda Diaulula sandiegensis U U Mollusca Gastropoda Diodora aspera U R Mollusca Gastropoda Dirona picta U P Mollusca Gastropoda Homolapoma subobsoletum P P Mollusca Gastropoda Janolus barbarensis U U Mollusca Gastropoda Janolus fuscus U P Mollusca Gastropoda Lacuna marmorata P P Mollusca Gastropoda Lacuna porrecta C C Mollusca Gastropoda Lirabuccinum dirum U U Mollusca Gastropoda Littorina keenae C C Mollusca Gastropoda Littorina scutulata A A Mollusca Gastropoda Lottia digitalis A A Mollusca Gastropoda Lottia paradigitalis C C Mollusca Gastropoda Lottia pelta A A Mollusca Gastropoda Lottia scutum C Mollusca Gastropoda Lottia strigatella C Mollusca Gastropoda Margarites pupillus C Mollusca Gastropoda Nitidiscala tincta C U Mollusca Gastropoda Nucella canaliculata P R Mollusca Gastropoda Nucella lamellosa U R Mollusca Gastropoda Nucella ostrina A A Mollusca Gastropoda Ocinebrina lurida U U Mollusca Gastropoda Onchidella borealis P C

27
Phylum Class Current Scientific Name Abundance
END 2005
FKC 2005
Mollusca Gastropoda Opalia chacei U U Mollusca Gastropoda Phidiana crassicornis P P Mollusca Gastropoda Rostanga pulchra U P Mollusca Gastropoda Tectura paleacea C C Mollusca Gastropoda Tectura persona U Mollusca Gastropoda Tectura scutum U U Mollusca Gastropoda Tegula funebralis A A Mollusca Gastropoda Triopha catilinae U U Mollusca Gastropoda Triopha maculata U U Mollusca Polyplacophora Cryptochiton stelleri U R Mollusca Polyplacophora Lepidochitona (Cyanoplax) dentiens P P Mollusca Polyplacophora Katharina tunicata C C Mollusca Polyplacophora Lepidozona mertensii P P Mollusca Polyplacophora Mopalia ciliata C C Mollusca Polyplacophora Mopalia hindsii P P Mollusca Polyplacophora Mopalia lignosa P P Mollusca Polyplacophora Mopalia muscosa P P Mollusca Polyplacophora Tonicella lineata C C Nemertea Anopla Emplectonema gracile P P Nemertea Anopla Paranemertes peregrina C C Nemertea Anopla Tubulanus polymorphus U P Nemertea Anopla Tubulanus sexlinatus P P Porifera Demospongia Cliona celata U P Porifera Demospongia Dysidea fragilis P P Porifera Demospongia Halichondria panicea P P Porifera Demospongia Halichondria spp P C Porifera Demospongia Haliclona ecbasis P P Porifera Demospongia Haliclona permollis P P Porifera Demospongia Haliclona spp U C Porifera Demospongia Mycale macginitiei P C Porifera Demospongia Neoesperiopsis digitata C C Porifera Demospongia Ophlitaspongia pennata U P Porifera Demospongia Suberites spp C C Sipuncula Phascolosoma agassizii U U Sipuncula Themiste pyroides P C

28
Coastal Biodiversity Survey at Damnation Creek
At Damnation Creek, we have conducted an inventory of rocky intertidal algae and invertebrates in collaboration with a team of taxonomic experts from University of California at Santa Cruz (Figure 10). This group has been conducting Coastal Biodiversity Surveys (CBS) since 2001 at over 90 sites along the Pacific west coast. The CBS were developed to compliment the ongoing large scale monitoring program called the Community Dynamics Surveys (see section on monitoring program for more details). By using the CBS protocols at Damnation Creek, we can make biodiversity comparisons with the data collected from Baja, Mexico to Alaska.
Figure 10. Transect lines used for Damnation Creek inventory, RNSP, June 2004. _______________________________________________________________________
A basic overview of the protocols used for these surveys has been outlined here with permission from the UCSC CBS group. For more information about the CBS and more detailed protocols visit the website at: http://cbsurveys.ucsc.edu
The coastal biodiversity survey of Damnation Creek began by choosing a 30 meter wide section of rocky bench that is representative of the intertidal community of the entire site. The site was set up by laying out two permanent 30 meter baseline meter tapes that run parallel to the ocean (Figure 11). Next, parallel lines were laid out perpendicular to the baselines every 3 meters from the high zone to the low zone. Permanent bolts were placed to mark the line intersections and detailed maps were drawn with compass bearings and measurements to facilitate re-sampling efforts.
Point-contact surveys were conducted along each vertical transect line by identifying and recording each organism that is directly under 100 evenly spaced points on the line. These data were used to determine relative abundance (% cover). If there were multiple layers of organisms under a point, the taxa occupying the different layers were identified and assigned a letter; A for the top layer, B for the second layer, and C for the third. If fewer than three taxa were recorded under a point, then data were collected on the identity of the next one or two species closest to that point. These data were used to describe the spatial distribution of species, and were not used when calculating relative abundances.
Mobile invertebrate surveys were conducted using a different protocol because most mobile species are not spatially common. Mobile invertebrate abundances were determined using 50 x 50 cm quadrats placed at three locations along each transect within each zone.

29
Each transect was first divided into three zones; the low zone is the area below the lower extent of mussel growth, the mid-zone includes the mussels and the rock weeds (e.g. Fucus and Pelvetiopsis), and the high zone is the area dominated by barnacles and littorines. Within each zone a quadrat was randomly placed on the transect, and all mobile species found within the quadrat were identified and counted. The only mobile species not counted were worms and amphipods. Sea stars were also not spatially common. Their abundances were measured along a two-meter swath centered over each vertical transect. Within this swath, the following sea star species were recorded: Patiria miniata, Dermasterius imbricata, Pisaster ochraceus, Pisaster giganteus, and Pycnopodia helianthoides.
A three-dimensional map of the study area was created using a rotating laser leveler and a stadia rod to measure the topography of each vertical transect line (Figure 12). The laser leveler was positioned so that the topography of all eleven transects could be measured. Measurements were taken along each transect wherever there was a change in height. Thus, measurements were taken infrequently (every few meters) for gradual slopes, but more frequently (tens of centimeters) when necessary to capture the presence of smaller ridges and pools. These measurements were converted to tidal heights (meters above mean low-low water) by measuring sea level at low tide. This was done by finding at least three locations that were covered and uncovered by waves for equal amounts of time. The height of these locations, and the time they were measured, were recorded and subsequently converted to tidal height using a tidal table.

30
Figure 11. Schematic of the grid setup used in the biodiversity site survey showing the transect lines running from the baseline to the ocean, parallel to the 0m and 30m lines, every three meters along the upper baseline resulting in 11 transect lines. _______________________________________________________________________
Figure 12. Topographic map of Damnation Creek created by UCSC coastal biodiversity survey team.

31
Table 3. List of invertebrate and algal taxa from inventory conducted in June 2004 at Damnation Creek, RNSP by UCSC coastal biodiversity survey team. Acanthinucella spp Acmaea mitra Acrosiphonia spp Ahnfeltia spp Alaria marginata Alia spp Amphissa versicolor Anthopleura elegantissima Anthopleura sola Anthopleura xanthogrammica Patiria miniata Balanus glandula Bossiella spp Bugula spp Calliarthron spp Callithamnion pikeanum Cancer oregonensis Centroceras/Ceramium/Polysiphonia spp Chondracanthus canaliculatus Chondracanthus spinosus Chthamalus spp Cirolana spp Cladophora columbiana Colpomenia/Leathesia spp Constantinea simplex Corallina spp Cryptochiton stelleri Cryptopleura/Hymenena spp Cryptosiphonia woodii Dermasterias imbricata Desmarestia ligulata Diatoms Diaulula sandigensis Dilsea californica Dirona picta Ectocarpales Egregia menziesii
Encrusting coralline Endocladia muricata Farlowia/Pikea spp Fucus spp Gelidium coulteri Gelidium coulteri/pusillum Grateloupia doryphora Halichondria spp Halosaccion glandiforme Halymenia/Schizymenia spp Hedophyllum sessile Henricia spp Hermissenda crassicornis Hildenbrandia/Peyssonnelia spp Homalopoma luridum Idotea spp Katharina tunicata Lacuna spp Laminaria setchellii Laminaria sinclairii Laurencia pacifica/masonii Lepidochitona dentiens Lepidozona spp Leptasterias spp Littorina plena/scutulata Lottia austrodigitalis/digitalis Lottia limatula Lottia paradigitalis/strigatella Lottia pelta Lottia scutum Mastocarpus jardinii Mastocarpus papillatus Mazzaella spp Membranipora spp Microcladia borealis Microcladia coulteri Mytilus californianus
Neoptilota/Ptilota spp Neorhodomela larix Neorhodomela oregona Nucella ostrina Nuttallina spp Odonthalia floccosa Osmundea spectabilis Pachygrapsus crassipes Pagurus hirsutiusculus Pagurus samuelis Pelvetiopsis spp Petrocelis spp Petrospongium rugosum Phyllospadix scouleri Pisaster ochraceus Pista spp Plocamium cartilagineum Plocamium violaceum Pollicipes polymerus Porphyra spp Prionitis lanceolata Prionitis lyallii Prionitis spp Pterosiphonia bipinnata Pterosiphonia dendroidea Pugettia producta Pycnopodia helianthoides Ralfsiaceae Sculpin Searlesia dira Semibalanus cariosus Styela montereyensis Tegula funebralis Tiffaniella snyderiae Tonicella lineata Ulva spp Ulva taeniata

32
ROCKY INTERTIDAL MONITORING PROGRAM
Rocky Intertidal Monitoring Introduction Several coastal parks, including Cabrillo National Monument and Channel Islands National Park, have become involved in intertidal monitoring to establish baseline datasets of their marine resources (Davis 1996, 2005). Monitoring intertidal assemblages allows changes to be tracked within and between communities over seasonal and yearly time scales. Monitoring intertidal communities is critical for making informed management decisions. Tracking changes in these communities allows determination of “normal” limits of variation as well as seasonal and long-term patterns. Understanding these patterns is necessary for detecting anthropogenic changes resulting from disturbances such as oil spills or global warming. Minerals Management Service and PISCO (Partnership for the Interdisciplinary Studies of Coastal Oceans) have been working in concert with a number of academic and government organizations to conduct intertidal monitoring in the form of Community Dynamics Surveys along the coast of California. These surveys have been conducted by members of MARINe (Multi-Agency Rocky Intertidal Network) and PISCO and include over twenty coastwide agencies. The Community Dynamics Surveys have been used to determine abundance and distribution patterns of intertidal species along the southern California coast since the early 1990s. The focus of these surveys is to examine temporal changes within permanent study plots. We have adapted the protocols used in these surveys for monitoring intertidal organisms within Redwood National and State Parks (Engle 2005). This will allow comparisons of population dynamics to be made with sites throughout the state. The addition of sites within the Redwood National and State Parks fills a noticeable gap in the geographic coverage of existing community surveys. Prior to this addition, no intertidal survey sites existed between southern Humboldt County and southern Oregon. Methods
Using the MARINe protocols, permanent photo-plots and sea star plots were set up at False Klamath Cove, Damnation Creek, and Enderts Beach. The photo plots were established to record changes in the cover of certain populations including: mussels (Mytilus californianus), barnacles (Chthamalus dalli/Balanus glandula), and three species of algae (Endocladia muricata, Pelvetiopsus limitata, and Fucus gardneri). These five species were chosen for monitoring because they are conspicuous, bed-forming, abundant, and ecologically important. Fucus gardneri was not dense and continuous enough at Enderts Beach, nor was there dense enough P. limitata at Damnation Creek when the study was initiated, to merit plot establishment for those species at those sites. At Damnation Creek, five additional mussel plots were sampled. These plots were located in the outflow of Damnation Creek where salinity is often much lower than in the other mussel plots. Otherwise, each species type was monitored in five replicate plots at each site (Table 4).

33
Table 4. Photo-plot type and number of replicates at each site, RNSP. Site Mussels Barnacles Pelvetiopsis
limitata Endocladia muricata
Fucus gardneri
Damnation Creek 10 plots* 5 plots NP 5 plots 5 plots False Klamath Cove 5 plots 5 plots 5 plots 5 plots 5 plots Enderts Beach 5 plots 5 plots 5 plots 5 plots NP * Five mussel plots located in full salinity, and 5 plots located near the outflow of Damnation Creek
Photo plots (of 75 x 50 cm) were marked by three permanent bolts which were digitally photographed every other month (Figure 13). Plots were photographed with an Olympus 560 digital camera mounted on a 50 x 75 cm PVC photo framer (Figure 14), to ensure equal scale among plots. Photo plots were scored for percent cover of sessile species using a rectangular grid (10 x 10 units) of one-hundred evenly-spaced points created on an LCD computer monitor using Adobe Photoshop. This grid was overlaid on the digital photos, and was switched on and off to determine what taxon was below each point. Different layers of algae were not scored separately, so the total percent cover was constrained to 100%. The top-most layer that was attached to the substrate (not an obvious epibiont) was always scored. Limpets, chitons, and sea stars were scored as such. For other mobile invertebrates, whatever was beneath the organism, was scored if possible. Otherwise, the point was scored as “unidentified”. This photo plot scoring technique was adopted from the MARINe monitoring group (Engle 2005). Data were entered into Microsoft Excel for organization and descriptive statistics. NCSS was used for statistical analyses.
In addition to percent cover measurements; mobile invertebrates were counted within each photo plot area. With the exception of burrowing organisms and amphipods, all mobile invertebrates were counted in the field within a 50 x 75 cm PVC quadrat. The quadrat was aligned with three plot marker bolts to ensure accurate replication. Algal over-story was gently moved so that hidden invertebrates could be located. For select species, such as Tegula funebralis and Nucella ostrina, the length of the shell (measured at its longest axis) was recorded to determine the size distribution of individuals present. This was done for the first 10 individuals recovered from each plot, unless fewer were present. In mussel beds, forceps were used to remove N. ostrina, T. funebralis, and other species that were partially hidden in between mussels. Extremely abundant mobile invertebrates, such as limpets (smaller than 15 mm) and littorines (Littorina spp.), were sub-sampled using a smaller quadrat. Limpets larger than 15 mm were counted in the entire 50 x 75 cm plot. Small (0-15 cm) limpets were counted in two size categories (< 5 mm and 5-15 cm) within three 20 x 20 cm quadrats laid diagonally through the larger quadrat. Limpets occurring on rocky or other substrata (including barnacle tests) were recorded separately from those occurring on mussel valves. Littorines were counted in three 10 x 10 cm quadrats placed diagonally through the larger quadrat. Data were entered into a Microsoft Excel spreadsheet for analysis.
All plots were sampled and photographed every two to three months from June 2004 though November 2005 (Appendix A). Sampling was done for all three sites within six days during lowest tides. Each site required a full day of sampling employing a team of six scientists. The monitoring that has occurred constitutes a thorough representation of seasonal data for the year.

34
Damnation Creek Plot with 100 point grid overlaid on photo.
Figure 13. Example of photoplots from sites within the RNSP taken in the 2004 monitoring surveys. The top two pairs of photos are of plots from different sampling periods showing change in species cover, over time. Bottom plot shows photo over laid with 100 point grid.
False Klamath Cove, October 2004 False Klamath Cove, June 2004
Enderts- Summer 2004
Barnacle Plot #2
Enderts- Spring 2004
Barnacle Plot #2
Pelvetiopsis Plot #2Pelvetiopsis Plot #2
Mussel Plot #4

35
Figure 14. PVC photo framer for photographing permanent 50 x 75 cm plots. A camera (not shown here) was mounted to the top brackets to ensure accurate replicate size. _______________________________________________________________________ Results
The following results are for each plot type monitored. In the original plot designation, the target species percent cover was greater than 75%. To date, monitoring data has indicated disturbance and recovery in some plots, for organisms such as barnacles and Endocladia. Other plots, such as mussels have been highly stable over the course of this study. Chthamalus dalli and Balanus glandula (Barnacles) Barnacle cover varied substantially over time and among sites, which may be due to their relatively short lifespan (Figure 15). At Damnation Creek, barnacle cover decreased steadily in summer and fall of 2004, but remained relatively stable throughout the rest of the study (Figure 15A) Percent cover of Endocladia and non-coralline crusts increased in 2005. These species may continue to increase in percent cover due to the high amount of free space (rock cover). At Enderts Beach, barnacle percent cover reached a maximum in October of 2004, and declined slightly after that (Figure 15B). Similar to trends at Damnation Creek, cover of Endocladia and non-coralline crusts has increased slightly in barnacle plots throughout 2005. There was also a spring-time pulse of Porphyra cover in barnacle plots. At False Klamath Cove, barnacle cover underwent periodic spring-time declines followed by recovery (Figure 15C). Endocladia muricata (Turfweed) The percent cover of Endocladia muricata varied seasonally at all three sites (Figure 16), with cover generally reaching maximum in spring and summer, and minimum in winter. When percent cover of Endocladia was low, cover of non-coralline crust and Fucus tended to be higher. Non-coralline crust (usually the sporophyte stage of Mastocarpus spp) is a common understory cover, so it was difficult to tell if crust percent cover is actually

36
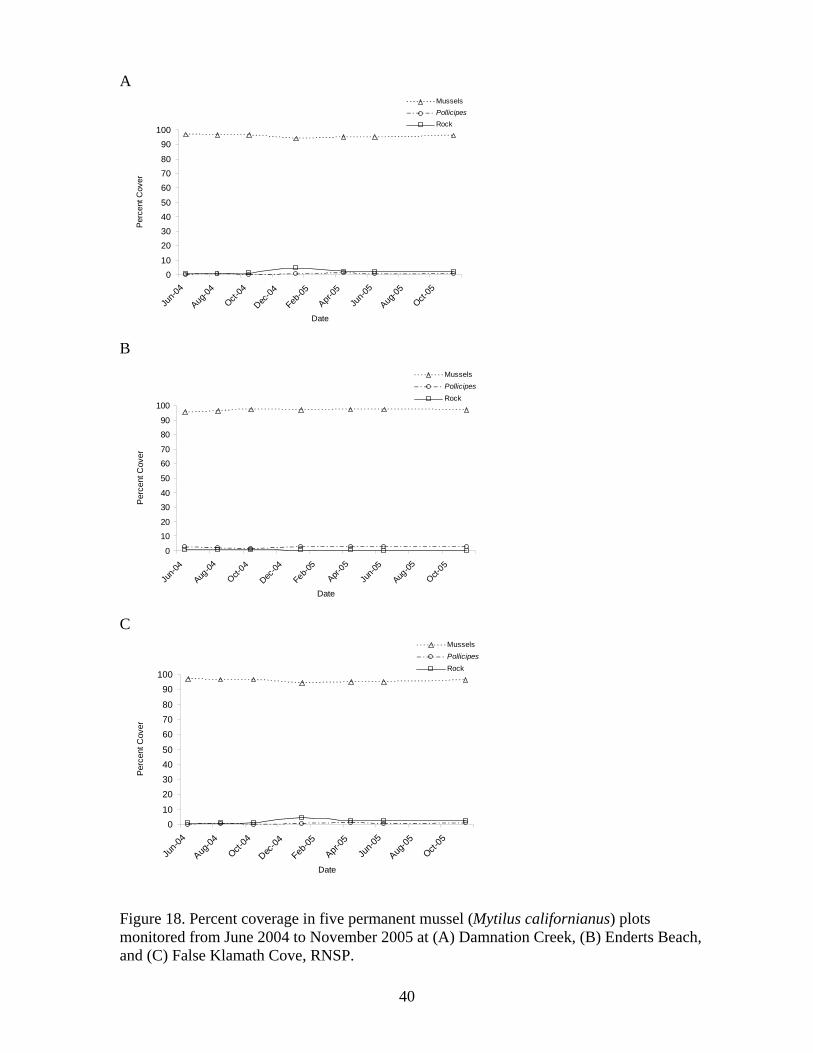
increasing or only being exposed in the absence of Endocladia overstorey. Increased Fucus cover may be a result of recruitment facilitation by Endocladia. Endocladia is known to facilitate the recruitment of Silvetia, a southern California rockweed, similar to Fucus (Miner et al. in prep). Fucus gardneri (Rockweed) Percent cover of Fucus did not vary seasonally (Figure 17). At Damnation Creek, percent cover declined to 70 percent in winter of 2004/2005, but recovered to above 80 percent the following fall (Figure 17A). Percent cover of rock indicated an opposite trend indicating this change in percent cover of Fucus was not due to a species replacement, although percent cover of Endocladia did increase slightly throughout the study. At False Klamath Cove, percent cover of Fucus declined steadily throughout the study, while percent cover of non-coralline crust, an understorey species, increased proportionately (Figure 17B). Mytilus californianus (Mussel) Mussel cover remained high and stable throughout the course of this study (Figure 18). At Damnation Creek and Enderts Beach, decreases in mussel cover corresponded to increases in the percent cover of the barnacle Polycipes polymerus (A and B). At False Klamath Cove, percent cover of mussels was slightly more variable and generally corresponded to changes in percent cover of rock (Figure 18). Pelvetiopsis limitata (Rockweed) At Enderts Beach, Pelvetiopsis cover was lowest in October 2004, but remained relatively stable throughout the remainder of the monitoring period. Decreases in Pelvetiopsis cover corresponded to increases in the percent cover of rock and barnacles (Figure 19A). At False Klamath Cove, Pelvetiopsis cover remained between 70 and 80 percent throughout the study period. Rock and barnacles accounted for most of the remaining 20-30 percent cover (Figure 19B).

37
A
0102030405060708090
100
Jun-0
4
Aug-04
Oct-04
Dec-04
Feb-05
Apr-05
Jun-0
5
Aug-05
Oct-05
Date
Perc
ent C
over
Non-Coraline CrustEndocladiaPorphyraBarnaclesRock
B
0102030405060708090
100
Jun-0
4
Aug-04
Oct-04
Dec-04
Feb-05
Apr-05
Jun-0
5
Aug-05
Oct-05
Date
Perc
ent C
over
Non-Coralline CrustEndocladiaPorphyraBarnaclesRock
C
0102030405060708090
100
Jun-0
4
Aug-04
Oct-04
Dec-04
Feb-05
Apr-05
Jun-0
5
Aug-05
Oct-05
Date
Perc
ent C
over
barnaclesrock
Figure 15. Percent coverage in five permanent barnacle (Chthamalus dalli/Balanus glandula) plots monitored from June 2004 to November 2005 at (A) Damnation Creek, (B) Enderts Beach, and (C) False Klamath Cove, RNSP.

38
A
0102030405060708090
100
Jun-0
4
Aug-04
Oct-04
Dec-04
Feb-05
Apr-05
Jun-0
5
Aug-05
Oct-05
Date
Perc
ent C
over
FucusNon-Coralline CrustEndocladiaRock
B
0
10
20
30
40
50
60
70
80
90
100
Jun-0
4
Aug-04
Oct-04
Dec-04
Feb-0
5
Apr-05
Jun-0
5
Aug-05
Oct-05
Date
Perc
ent C
over
Non-Coralline CrustEndocladiaRock
C
0
10
20
30
40
50
60
70
80
90
100
Jun-0
4
Aug-04
Oct-04
Dec-04
Feb-05
Apr-05
Jun-0
5
Aug-05
Oct-05
Date
Perc
ent C
over
FucusEndocladiaRock
Figure 16. Percent coverage in five permanent Endocladia muricata plots monitored from June 2004 to November 2005 at (A) Damnation Creek, (B) Enderts Beach, and (C) False Klamath Cove, RNSP.

39
A
0
10
20
30
40
50
60
70
80
90
100
Jun-0
4
Aug-04
Oct-04
Dec-04
Feb-0
5
Apr-05
Jun-0
5
Aug-05
Oct-05
Date
Perc
ent C
over
FucusEndocladiaRock
B
0102030405060708090
100
Jun-0
4
Aug-04
Oct-04
Dec-04
Feb-05
Apr-05
Jun-0
5
Aug-05
Oct-05
Date
Perc
ent C
over
FucusRockNon-Coralline Crust
Figure 17. Percent coverage in five permanent Fucus gardneri plots monitored from June 2004 to November 2005 at (A) Damnation Creek and (B) False Klamath Cove, RNSP.
40
A
010
20304050
607080
90100
Jun-0
4
Aug-04
Oct-04
Dec-04
Feb-05
Apr-05
Jun-0
5
Aug-05
Oct-05
Date
Perc
ent C
over
MusselsPollicipesRock
B
0
10
20
30
40
50
60
70
80
90
100
Jun-0
4
Aug-04
Oct-04
Dec-04
Feb-05
Apr-05
Jun-0
5
Aug-05
Oct-05
Date
Per
cent
Cov
er
MusselsPollicipesRock
C
010
20304050
607080
90100
Jun-0
4
Aug-04
Oct-04
Dec-04
Feb-05
Apr-05
Jun-0
5
Aug-05
Oct-05
Date
Perc
ent C
over
MusselsPollicipesRock
Figure 18. Percent coverage in five permanent mussel (Mytilus californianus) plots monitored from June 2004 to November 2005 at (A) Damnation Creek, (B) Enderts Beach, and (C) False Klamath Cove, RNSP.

41
A
0
10
20
30
40
50
60
70
80
90
100
Jun-0
4
Aug-04
Oct-04
Dec-04
Feb-0
5
Apr-05
Jun-0
5
Aug-05
Oct-05
Date
Perc
ent C
over
PelvetiopsisMazzaellaBarnaclesRock
B
0
10
20
30
40
50
60
70
80
90
100
Jun-0
4
Aug-04
Oct-04
Dec-04
Feb-0
5
Apr-05
Jun-0
5
Aug-05
Oct-05
Date
Perc
ent C
over
PelvetiopsisBarnaclesRock
Figure 19. Percent coverage in five permanent Pelvetiopsis limitata plots monitored from June 2004 to November 2005 at (A) Enderts Beach, and (B) False Klamath Cove, RNSP. ._______________________________________________________________________

42
Mobile Invertebrates
Trends in the abundance of mobile invertebrates associated with barnacle plots were similar at Damnation Creek and Enderts Beach (Figure 20A - D). Nucella ostrina, a predatory gastropod that feeds on mussels and barnacles, occurred at highest densities (15-25 per plot on average) in barnacle plots in summer and fall of both sampling years (Figure 20A and C). Tegula funebralis, a herbivorous snail, reached a mean abundance of 5 per plot in winter of 2004/2005 at Damnation Creek (Figure 20A). However, this snail was generally absent in warmer months and did not reach a mean density higher than 2 per plot in any month at Enderts Beach (Figure 20C). Littorine abundance increased in spring then peaked in June sampling events of both years at Damnation Creek and Enderts Beach. Limpets were most abundant in fall and winter for both of these sites (Figure 20B and D). At False Klamath Cove, Nucella abundance remained at a mean of 3 snails per plot or less with a maximum in April of 2005 (Figure 20E). Low Nucella populations may be due to strong fluctuations in the percent cover of these barnacle plots. The decrease in mean abundance of Nucella in April 2005 corresponds to a drastic decrease in the percent cover of barnacles occurring in the same month (Figure 15C). Littorine abundance generally increased through April 2005 as well, but decreased thereafter. Limpet abundance remained low throughout the study period (Figure 20F).
Mobile invertebrate abundance in Endocladia plots was highly variable among sites. Nucella abundance peaked in winter of 2004/2005 at all three sites but actual mean abundance was less than 12 snails per plot (Figure 21A, C, and F). At Damnation Creek, where Nucella abundance in Endocladia plots was generally highest, an additional peak in abundance occurred in August, 2004 (Figure 21A). Tegula occurred at up to an average of 25 individuals per plot in the autumn of 2004 (Figure 21A), but this snail occurred at very low density in Endocladia plots at the other two sites. Littorine abundance remained low in Endocladia plots at Damnation Creek until April, 2005. In June of 2005 mean littorine density increased drastically to approximately 800 per plot (Figure 21B). This increase does not appear to correspond to any change in algal cover, however (Figure 16A). At Enderts Beach, littorines density reached an average of over 2000 individuals per plot in October, 2004, but littorines populations remained low in Endocladia plots for all other sampling events (Figure 21D). This peak corresponds to a peak in Endocladia cover in the same month (Figure 16B). Littorine abundance remained between 200 and 1200 snails per plot throughout the study period, with peaks in August, 2004 (800 littorines per plot) and January, 2005 (1200 littorines per plot; Figure 21F). Limpet populations undulated between 200 and 500 individuals per plot at both Damnation Creek and Enderts Beach (Figure 21B and D). Whereas mean limpet populations were between 50 and 200 individuals per plot at False Klamath Cove (Figure 21F)
In Fucus plots at Damnation Creek, Nucella reached a mean abundance of 9 individuals per plot in October, 2004. Mean abundance remained between 1 and 4 individuals per plot in all other sampling periods (Figure 22A). Tegula counts were 0-2 individuals per plot in Fucus plots at Damnation Creek until June 2005, when mean abundance reached 6 snails per plot (Figure 22B). Nucella abundance was generally higher at False Klamath Cove, remaining between 10 and 15 individuals per plot for all months except August, 2004, when mean abundance dropped to 4 individuals per plot (Figure 22C). At False Klamath Cove, abundance of Tegula funebralis remained between 13 and 22 individuals per plot throughout the study, with the maximum density occurring in January 2005 (Figure 22C). Limpet counts undulated between 30 and 115 in Fucus plots at both Damnation Creek and False Klamath Cove, reaching maximum abundance in August 2004 at

43
both sites (Figure 22B and D). Littorines density generally increased over the study period in Fucus plots at Damnation Creek, reaching a maximum of 2060 individuals per plot in June 2005 (Figure 22B). At False Klamath Cove, littorines were more variable. Abundance was highest in August 2004 at 480 individuals per plot, and lowest in January 2005 at 41 individuals per plot. These trends do not seem to correspond to changes in percent cover, however (Figure 17A and B).
Variation in mobile invertebrate abundance in mussel plots was seasonally similar among sites, but the magnitude of these fluctuations varied by site. Nucella were generally more abundant at Enderts Beach and False Klamath Cove. Abundance peaked in October at Damnation Creek (5 snails per plot) and False Klamath Cove (43 snails per plot), and in August at Enderts Beach (75 snails per plot). Nucella abundance peaked again in June 2005 at Damnation Creek (15 snails per plot) and Enderts Beach (62 snails per plot) (Figure 23A, C, and E). Mean Tegula abundance remained low in mussel plots at all sites (Figure 23A, C, and E). Limpet counts were highest in August 2004 at Damnation Creek (270 per plot) and Enderts Beach (510 per plot), and in October 2004 at False Klamath Cove (520 per plot). Limpet abundance was lowest in April 2005 at all three sites (Figure 23 B, D, F). Littorines reached a mean density of 750 snails per plot in October 2004 at Enderts Beach, but littorine abundance remained low through spring 2005 at the other two sites. Littorines reached a mean density of 110 snails per plot in April 2005 at Damnation Creek, and 820 snails per plot at False Klamath Cove in June 2005 (Figure 23 B, D, F).
Abundance of Nucella and Tegula remained low in Pelvetiopsis limitata plots at Enderts Beach. Tegula reached a maximum mean density of 2.5 snails per plot in winter 2004/2005 (Figure 24A). Nucella counts were highly variable at False Klamath Cove, with peaks occurring in October 2004 (12 snails per plot) and April 2005 (19 snails per plot) (Figure 24C). Limpet counts remained fairly stable, between 135 and 240, at Enderts Beach (Figure 24B). Limpet abundance was also stable but slightly lower (60-210) at False Klamath Cove (Figure 24D)

44
A B
0
5
10
15
20
25
Jun-0
4Ju
l-04
Aug-04
Sep-04
Oct-04
Nov-04
Dec-04
Jan-0
5
Feb-05
Mar-05
Apr-05
May-05
Jun-0
5
Date
Mea
n N
umbe
r Per
Plo
t
Nucella ostrinaTegula funebralis
0
500
1000
1500
2000
2500
3000
3500
4000
Jun-0
4Ju
l-04
Aug-04
Sep-04
Oct-04
Nov-04
Dec-04
Jan-0
5
Feb-05
Mar-05
Apr-05
May-05
Jun-0
5
Date
Mea
n N
umbe
r Per
Plo
t
LimpetsLittorines
C D
0
5
10
15
20
25
30
Jun-0
4Ju
l-04
Aug-04
Sep-04
Oct-04
Nov-04
Dec-04
Jan-0
5
Feb-05
Mar-05
Apr-05
May-05
Jun-0
5
Date
Mea
n N
umbe
r Per
Plo
t
0
500
1000
1500
2000
2500
3000
Jun-0
4Ju
l-04
Aug-04
Sep-04
Oct-04
Nov-04
Dec-04
Jan-0
5
Feb-05
Mar-05
Apr-05
May-05
Jun-0
5
Date
Mea
n N
umbe
r Per
Plo
t
E F
0
0.5
1
1.5
2
2.5
3
Jun-0
4Ju
l-04
Aug-04
Sep-04
Oct-04
Nov-04
Dec-04
Jan-0
5
Feb-05
Mar-05
Apr-05
May-05
Jun-0
5
Date
Mea
n N
umbe
r Per
Plo
t
0
500
1000
1500
2000
2500
3000
3500
4000
4500
Jun-0
4Ju
l-04
Aug-04
Sep-04
Oct-04
Nov-04
Dec-04
Jan-0
5
Feb-05
Mar-05
Apr-05
May-05
Jun-0
5
Date
Mea
n N
umbe
r Per
Plo
t
Figure 20. Abundance of mobile invertebrates in five permanent barnacle (Chthamalus dalli/Balanus glandula) plots monitored from June 2004 to June 2005 at (A and B) Damnation Creek, (C and D) Enderts Beach, and (E and F) False Klamath Cove, RNSP.

45
A B
0
5
10
15
20
25
30
Jun-0
4Ju
l-04
Aug-04
Sep-04
Oct-04
Nov-04
Dec-04
Jan-0
5
Feb-05
Mar-05
Apr-05
May-05
Jun-0
5
Date
Mea
n N
umbe
r Per
Plo
tNucella ostrinaTegula funebralis
0100200300400500600700800900
Jun-0
4Ju
l-04
Aug-04
Sep-04
Oct-04
Nov-04
Dec-04
Jan-0
5
Feb-05
Mar-05
Apr-05
May-05
Jun-0
5
Date
Mea
n N
umbe
r Per
Plo
t
LimpetsLittorines
C D
01
23
45
67
8
Jun-0
4Ju
l-04
Aug-04
Sep-04
Oct-04
Nov-04
Dec-04
Jan-0
5
Feb-05
Mar-05
Apr-05
May-05
Jun-0
5
Date
Mea
n N
umbe
r Per
Plo
t
0
500
1000
1500
2000
2500
Jun-0
4Ju
l-04
Aug-04
Sep-04
Oct-04
Nov-04
Dec-04
Jan-0
5
Feb-05
Mar-05
Apr-05
May-05
Jun-0
5
Date
Mea
n N
umbe
r Per
Plo
t
E F
00.5
11.5
22.5
33.5
44.5
5
Jun-0
4Ju
l-04
Aug-04
Sep-04
Oct-04
Nov-04
Dec-04
Jan-0
5
Feb-05
Mar-05
Apr-05
May-05
Jun-0
5
Date
Mea
n N
umbe
r Per
Plo
t
0
200
400
600
800
1000
1200
1400
Jun-0
4Ju
l-04
Aug-04
Sep-04
Oct-04
Nov-04
Dec-04
Jan-0
5
Feb-05
Mar-05
Apr-05
May-05
Jun-0
5
Date
Mea
n N
umbe
r Per
Plo
t
Figure 21. Abundance of mobile invertebrates in five permanent Endocladia muricata plots monitored from June 2004 to June 2005 at (A and B) Damnation Creek, (C and D) Enderts Beach, and (E and F) False Klamath Cove, RNSP.

46
A B
0
1
2
3
4
5
6
7
8
9
10
Jun-0
4Ju
l-04
Aug-04
Sep-04
Oct-04
Nov-04
Dec-04
Jan-0
5
Feb-05
Mar-05
Apr-05
May-05
Jun-0
5
Date
Mea
n N
umbe
r Per
Plo
t
Nucella ostrinaTegula funebralis
0
500
1000
1500
2000
2500
Jun-0
4Ju
l-04
Aug-04
Sep-04
Oct-04
Nov-04
Dec-04
Jan-0
5
Feb-05
Mar-05
Apr-05
May-05
Jun-0
5
Date
Mea
n N
umbe
r Per
Plo
t
LimpetsLittorines
C D
0
5
10
15
20
25
Jun-0
4Ju
l-04
Aug-04
Sep-04
Oct-04
Nov-04
Dec-04
Jan-0
5
Feb-05
Mar-05
Apr-05
May-05
Jun-0
5
Date
Mea
n N
umbe
r Per
Plo
t
0
100
200
300
400
500
600
Jun-0
4Ju
l-04
Aug-04
Sep-04
Oct-04
Nov-04
Dec-04
Jan-0
5
Feb-05
Mar-05
Apr-05
May-05
Jun-0
5
Date
Mea
n N
umbe
r Per
Plo
t
Figure 22. Abundance of mobile invertebrates in five permanent Fucus gardneri plots monitored from June 2004 to June 2005 at (A and B) Damnation Creek and (C and D) False Klamath Cove, RNSP.

47
A B
0
2
4
6
8
10
12
14
16
Jun-0
4Ju
l-04
Aug-04
Sep-04
Oct-04
Nov-04
Dec-04
Jan-0
5
Feb-05
Mar-05
Apr-05
May-05
Jun-0
5
Date
Mea
n N
umbe
r Per
Plo
tNucella ostrinaTegula funebralis
0
50
100
150
200
250
300
Jun-0
4Ju
l-04
Aug-04
Sep-04
Oct-04
Nov-04
Dec-04
Jan-0
5
Feb-05
Mar-05
Apr-05
May-05
Jun-0
5
Date
Mea
n N
umbe
r Per
Plo
t
LimpetsLittorines
C D
0
1020
3040
50
6070
80
Jun-0
4Ju
l-04
Aug-04
Sep-04
Oct-04
Nov-04
Dec-04
Jan-0
5
Feb-05
Mar-05
Apr-05
May-05
Jun-0
5
Date
Mea
n N
umbe
r Per
Plo
t
0
100
200
300
400
500
600
700
800
Jun-0
4Ju
l-04
Aug-04
Sep-04
Oct-04
Nov-04
Dec-04
Jan-0
5
Feb-05
Mar-05
Apr-05
May-05
Jun-0
5
Date
Mea
n N
umbe
r Per
Plo
t
E F
05
1015202530354045
Jun-0
4Ju
l-04
Aug-04
Sep-04
Oct-04
Nov-04
Dec-04
Jan-0
5
Feb-05
Mar-05
Apr-05
May-05
Jun-0
5
Date
Mea
n N
umbe
r Per
Plo
t
0
100
200
300
400
500
600
700
800
900
Jun-0
4Ju
l-04
Aug-04
Sep-04
Oct-04
Nov-04
Dec-04
Jan-0
5
Feb-05
Mar-05
Apr-05
May-05
Jun-0
5
Date
Mea
n N
umbe
r Per
Plo
t
Figure 23. Abundance of mobile invertebrates in five permanent mussel (Mytilus californianus) plots monitored from June 2004 to June 2005 at (A and B) Damnation Creek, (C and D) Enderts Beach, and (E and F) False Klamath Cove, RNSP.

48
A B
0
0.5
1
1.5
2
2.5
3
Jun-0
4Ju
l-04
Aug-04
Sep-04
Oct-04
Nov-04
Dec-04
Jan-0
5
Feb-05
Mar-05
Apr-05
May-05
Jun-0
5
Date
Mea
n N
umbe
r Per
Plo
t
Nucella emarginataTegula funebralis
0
100
200
300
400
500
600
700
800
900
Jun-0
4Ju
l-04
Aug-04
Sep-04
Oct-04
Nov-04
Dec-04
Jan-0
5
Feb-05
Mar-05
Apr-05
May-05
Jun-0
5
Date
Mea
n N
umbe
r Per
Plo
t
LimpetsLittorines
C D
02468
101214161820
Jun-0
4Ju
l-04
Aug-04
Sep-04
Oct-04
Nov-04
Dec-04
Jan-0
5
Feb-05
Mar-05
Apr-05
May-05
Jun-0
5
Date
Mea
n N
umbe
r Per
Plo
t
0
200
400
600
800
1000
1200
1400
1600
1800
2000
Jun-0
4Ju
l-04
Aug-04
Sep-04
Oct-04
Nov-04
Dec-04
Jan-0
5
Feb-05
Mar-05
Apr-05
May-05
Jun-0
5
Date
Mea
n N
umbe
r Per
Plo
t
Figure 24. Abundance of mobile invertebrates in five permanent Pelvetiopsis limitata plots monitored from June 2004 to June 2005 at (A and B) Enderts Beach and (C and D) False Klamath Cove, RNSP. _______________________________________________________________________ Species Interactions
To determine if the abundance of mobile species was correlated with changes in the percent cover of algae and sessile invertebrates, two correlation analyses were performed, on the three sites combined. Data from June of 2004 and June 2005 were run separately to ensure that associations are consistent between years. The correlation tables (Table 5) show Spearman rank values, because data were non-normal for most taxa. However, equal variance assumptions were met. Results in the correlation table for June 2004 are generally consistent with results from 2005, indicating that associations continued from one year to the next. Spearman correlation values of 0.3 and greater were considered to be indicative of an association. In both years, T. funebralis was associated with F. gardneri, small limpets (less than 5 mm) with E. muricata, limpets (5-15 mm) with P. limitata, N. ostrina with mussels and Pollicipes polymerus, and littorines with barnacles and rock. Limpets (<5mm and 5-15mm size classes) were counted on mussels and rock separately, so their association is a given. Nucella ostrina and both limpet size classes on mussel classes are positively associated with P. polymerus, but these barnacles are only found in mussel plots, so it is difficult to determine if this was a direct or indirect association. The percent cover of P. polymerus is low in all plots, so further correlative analysis was not calculated. Littorines were positively correlated with P. limitata in 2004, but not the following year. The association between N. ostrina and P. polymerus was still present in 2005, but it was weaker than in the previous year. The association between small limpets (< 5 mm) and the rock class

49
was weaker in 2004 than in 2005. A linear regression was run on each correlated pair to test for positive relationships. In each case the slope of the linear relationship was positive and significantly greater than zero. _______________________________________________________________________ Table 5. Correlation matrix shows associations between mobile invertebrates and sessile taxa. Spearman correlation values >0.3 indicate an association. These associations are generally consistent between the matrices for (A) June 2004 and (B) June 2005. A
Mobile Invertebrate Fucus gardneri
Endocladia muricata
Pelvetiopsis limitata Mussel Barnacles
Pollicipes polymerus Rock
Nucella ostrina 0.073 -0.268 0.057 0.454* -0.276 0.398* -0.528
Tegula funebralis 0.387* -0.018 -0.013 0.113 -0.387 -0.001 -0.438
Limpets < 5 mm 0.031 0.517* 0.123 -0.475 0.046 -0.143 0.266
Limpets < 5 mm on mussel -0.327 -0.458 -0.060 0.667* -0.137 0.520* -0.332
Limpets 5-15 mm 0.156 0.030 0.308* -0.397 0.252 -0.225 0.377*
Limpets 5-15 mm on mussel -0.317 -0.461 -0.198 0.731* -0.142 0.409* -0.365
Littorina spp. 0.106 -0.104 0.338* -0.431 0.571* -0.342 0.502* B
Mobile Invertebrate Fucus gardneri
Endocladia muricata
Pelvetiopsis limitata Mussel Barnacles
Pollicipes polymerus Rock
Nucella ostrina -0.012 -0.151 -0.275 0.513* -0.162 0.268 -0.377
Tegula funebralis 0.428* -0.170 -0.304 0.088 -0.343 -0.133 -0.106
Limpets < 5 mm 0.132 0.644* 0.135 -0.633 0.269 -0.345 0.450*
Limpets < 5 mm on mussel -0.311 -0.396 -0.210 0.888* -0.348 0.593* -0.648
Limpets 5-15 mm 0.150 0.027 0.521* -0.528 0.701* -0.330 0.429*
Limpets 5-15 mm on mussel -0.310 -0.402 -0.208 0.888* -0.354 0.469* -0.593
Littorina spp. 0.133 -0.015 -0.026 -0.302 0.519* -0.207 0.516* *Strong positive correlations _______________________________________________________________________ Size Distribution of Mobile Invertebrates
Tegula were generally smaller and more abundant in Fucus plots at False Klamath Cove than at Damnation Creek (Figure 25). At Damnation Creek, Fucus plots contained fewer individuals, but many of these were of larger size (Figure 22 and Figure 25). A pulse of small individuals occurred in January, 2005 at both sites, followed by a spike in the abundance of Tegula over 10 mm in summer and fall (Figure 25).
Mussel plots at Enderts Beach contained a high proportion of large Nucella ostrina especially in summer and fall months (Figure 26B). While individuals at the other two sites were more evenly distributed among size classes, there is a prevalence of larger individuals in summer and fall as well (Figure 26A and C). Small individuals (<15mm) were present throughout the year at all sites, but are most common in August and October, 2004 (Figure 26). Nucella in mussel plots at the mouth of Damnation Creek show a more distinct seasonal shift in size distribution than the population living in the mussel plots with more stable salinity. Small (<10mm) Nucella were present in January of 2005, but decreased in abundance in April, 2005 and in both June surveys. Larger individuals (15-20mm) are present in nearly every survey, but reach maximum abundance in August and October, 2004 (Figure 27).
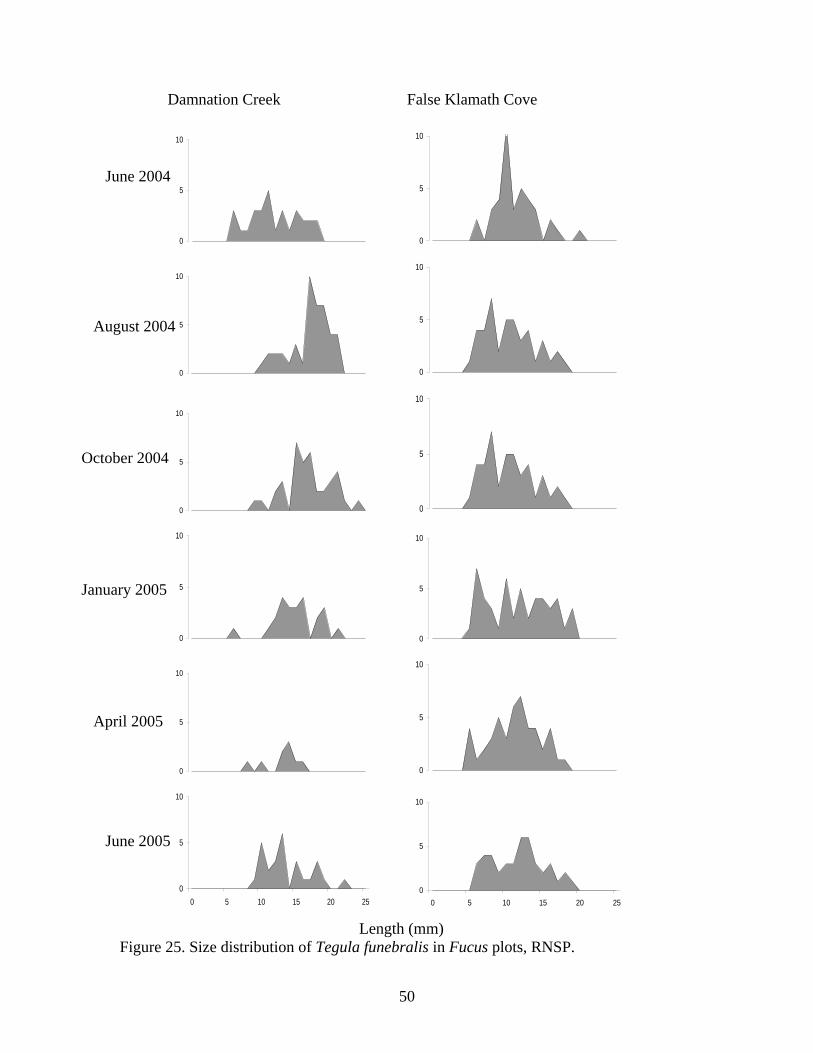
50
Damnation Creek False Klamath Cove
0
5
10
0
5
10
0
5
10
0
5
10
0
5
10
0
5
10
0
5
10
0
5
10
0
5
10
0
5
10
0
5
10
0 5 10 15 20 25
0
5
10
0 5 10 15 20 25
Length (mm) Figure 25. Size distribution of Tegula funebralis in Fucus plots, RNSP.
June 2004
August 2004
October 2004
January 2005
April 2005
June 2005

51
Damnation Creek Enderts Beach False Klamath Cove
0
5
10
15
0
5
10
15
0
5
10
15
0
5
10
15
0
5
10
15
0
5
10
15
0 5 10 15 20 25 30
0
5
10
15
0
5
10
15
0
5
10
15
0
5
10
15
0
5
10
15
0
5
10
15
0 5 10 15 20 25 30 Length (mm)
0
5
10
15
0
5
10
15
0
5
10
15
0
5
10
15
0
5
10
15
0
5
10
15
0 5 10 15 20 25 30
Figure 26. Size distribution of Nucella ostrina in mussel plots, RNSP.
June 2004
August 2004
October 2004
January 2005
April 2004
June 2005
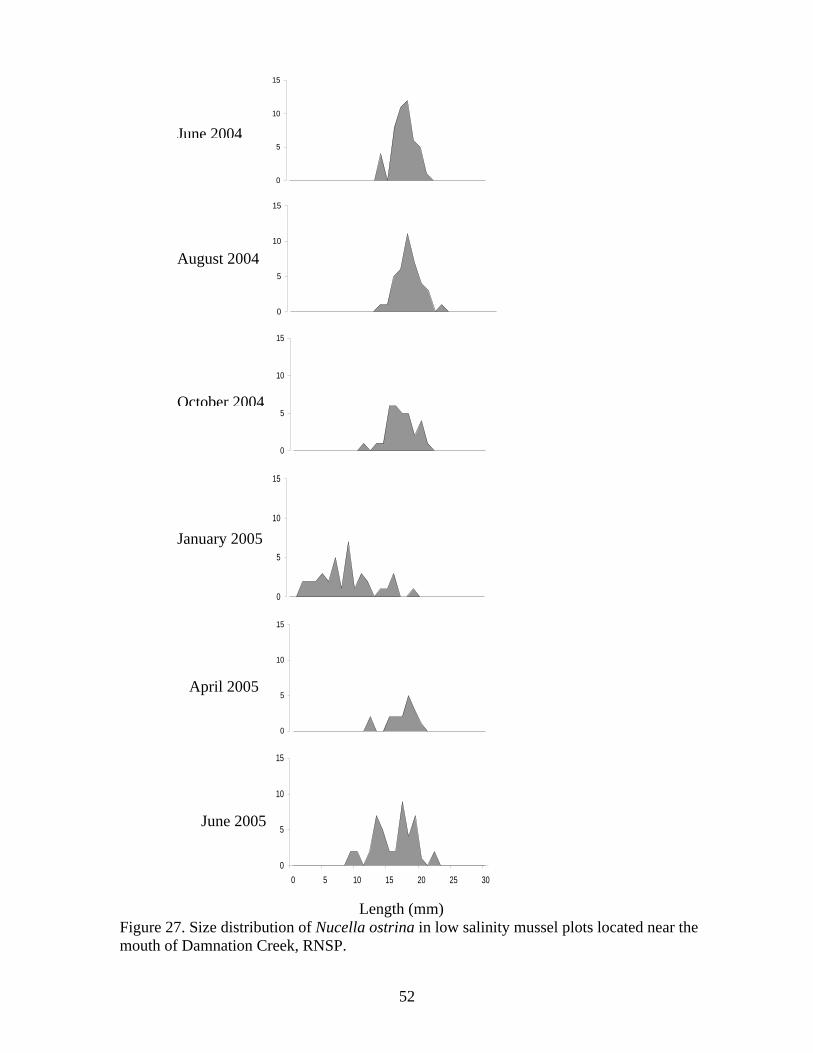
52
0
5
10
15
0
5
10
15
0
5
10
15
0
5
10
15
0
5
10
15
0
5
10
15
0 5 10 15 20 25 30
Length (mm)
Figure 27. Size distribution of Nucella ostrina in low salinity mussel plots located near the mouth of Damnation Creek, RNSP.
June 2004
August 2004
October 2004
January 2005
April 2005
June 2005

53
Sea Star Monitoring Methods
Permanent plots were established at each of our rocky intertidal sites to monitor the size and abundance of sea stars. Protocols were adapted from the MARINe Handbook in order to create plots comparable over a large geographic range (Engle 2005). The plots were irregular in shape encompassing an area with high densities of sea stars. These plots were not intended to quantify densities at an overall site, but were meant to provide discrete plots where abundance and size distribution of sea stars could be monitored over time. Irregular plots were marked by four or more "corner" bolts, one of which was notched with the plot number. The plots were placed in areas of high sea star density to obtain as many counts and measurements for size-frequency as possible. At Damnation Creek and False Klamath Cove three plots were established, while at Enderts Beach, two plots were monitored.
To survey a plot, at sufficiently low tide, a meter tape was laid out around the irregular plot perimeter and the entire area encompassed by the boundary tape was searched carefully. All sea stars within the plot were recorded while only ochre sea stars (Pisaster ochraceus) were measured. Pisaster ochraceus were recorded if any part of the animal was inside the plot. Each sea star was temporarily marked with a yellow forestry crayon to avoid duplicate counts. Ochre sea stars were measured with a ruler from the center of the disc to the tip of the longest ray to the nearest 5 mm for animals <10mm and the nearest 10 mm for larger sea stars. Often sizes had to be estimated because sea stars were wedged in tight spots with rays curved. A flashlight was used to see in cracks and overhangs. Sea stars were never “straightened” or removed from the rock. Other species of sea stars counted in plots included Patiria miniata, Pisaster giganteus, and Pycnopodia helianthoides. Rarer species of sea stars such as Leptastarias hexactis and Dermasterias imbricata were also noted when seen. Results and Discussion
Pisaster ochraceus was the most abundant species found at every site where sea stars were sampled. In the spring 2005 sampling event, ochre star populations within most of the plots, at all three sites, showed a decline from previous numbers (Figure 28). The following sampling event, in fall 2005, resulted in a higher proportion of smaller individuals (Figure 29). The fluctuations in sea star numbers over time are thought to reflect movement into and out of our permanent plots in response to factors such as tidal height and food availability, and should not be interpreted as true increases and decreases in the population at the site overall (Miner et al. in prep).
Changes in abundance and size frequency occur over time and across sites for Pisaster ochraceus, however; the color ratio of “other” (everything other than orange) to orange remains an approximate 3:1 ratio at most sites (Figure 28). This ratio is also consistent with data from sites throughout the California coast (Miner et al. in prep). Figure 29 displays size structure for the two color groups. Sizes ranged from 5 to 160 mm and these data showed an overall bell shaped distribution of size frequencies. The mean size of ochre stars decreased in 2005 across all sites with a larger proportion of smaller size classes. This pattern may be related to the decrease in abundances within the plots. Purple ochre stars show a slightly greater mean size than orange stars, however these values were not statistically different and may have been driven by the greater abundances of purple stars (Figure 30).

54
Damnation Creek
No.
Of P
. Och
race
us
SP04 SU04 SP05 FA0550
100
150
200
250
300
350
False Klamath Cove
SP04 SU04 SP05 FA05
0
100
200
300
400
500
Enderts Beach
SP04 SU04 SP05 FA050
100
200
300
400
500
600
700
800
Orange P.ochraceus Purple/Other P.ochraceus
Total P.ochraceus
Figure 28. Pisaster ochraceus abundances and colors. Note differences in scale. SP=spring samples, FA=fall samples, SU=summer samples.

55
Damnation False Klamath Cove Enderts Beach
0
102030405060708090
100
5 20 40 60 80 100
120
140
No.
of S
tars
0102030405060708090
100
5 20 40 60 80 100
120
140
020406080
100120140160180200
5 20 40 60 80 100
120
140
160
0
102030405060708090
100
5 20 40 60 80 100
120
140
No.
of S
tars
0102030405060708090
100
5 20 40 60 80100
12014
0
020406080
100120140160180200
5 20 40 60 80100
120140
0
102030405060708090
100
5 20 40 60 80100
120140
No.
of S
tars
0102030405060708090
100
5 20 40 60 80 100
120
140
020406080
100120140160180200
5 20 40 60 80 100120
140160
0
102030405060708090
100
5 20 40 60 80100
120140
No.
of S
tars
0102030405060708090
100
5 20 40 60 80 100
120
140
020406080
100120140160180200
5 20 40 60 80 100120
140 Figure 29. Pisaster ochraceus radius (mm) length frequency and abundances for orange (orange bars) and purple/other (purple bars) sea stars. Note different scale on y-axis for Enderts Beach. Data from four sampling events in 2004 and 2005 at three sites within RNSP.
Summer 2004
Spring 2004
Fall 2005
Spring 2005
Pisaster Radius (mm)
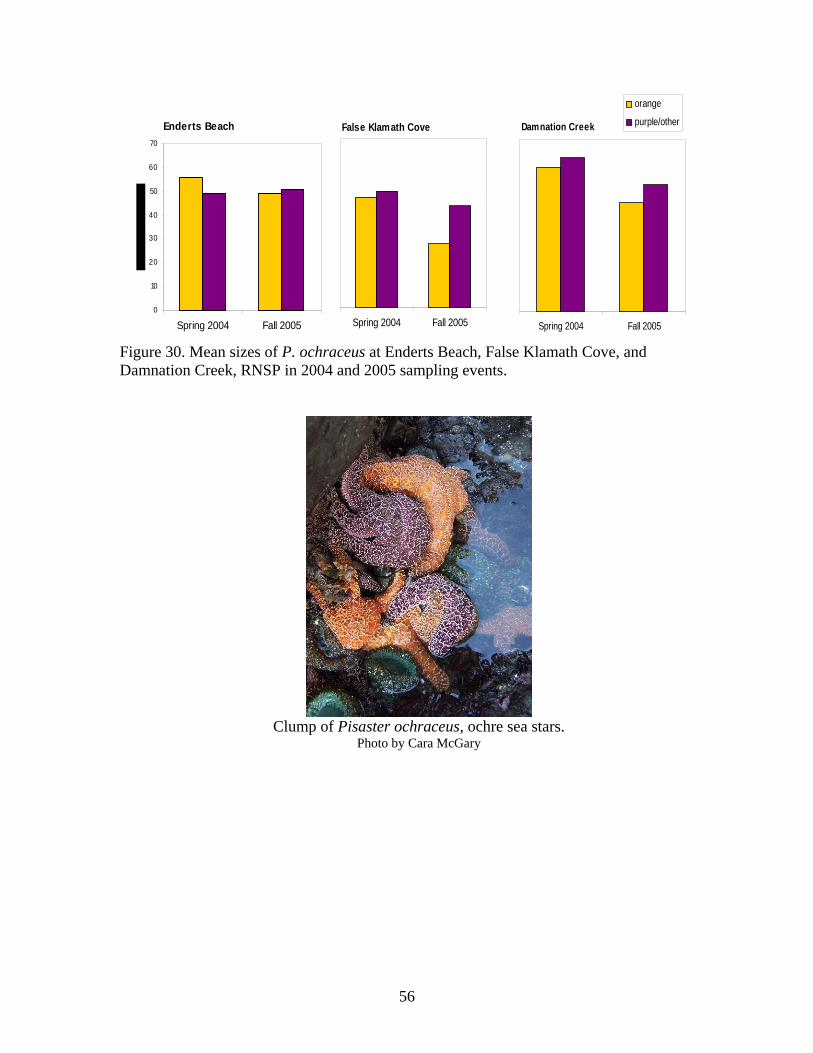
56
Enderts Beach
0
10
20
30
40
50
60
70
Spring 2004 Fall 2005
False Klamath Cove
Spring 2004 Fall 2005
Damnation Creek
Spring 2004 Fall 2005
orange
purple/other
Figure 30. Mean sizes of P. ochraceus at Enderts Beach, False Klamath Cove, and Damnation Creek, RNSP in 2004 and 2005 sampling events.
Clump of Pisaster ochraceus, ochre sea stars.
Photo by Cara McGary
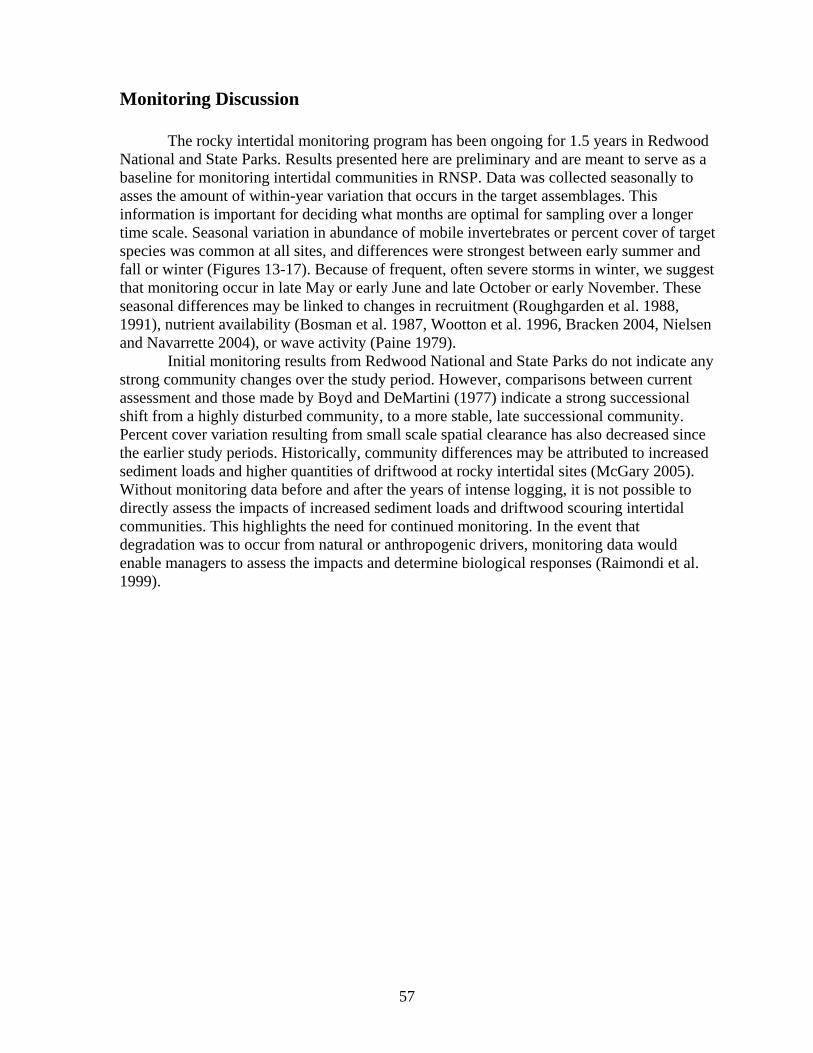
57
Monitoring Discussion
The rocky intertidal monitoring program has been ongoing for 1.5 years in Redwood National and State Parks. Results presented here are preliminary and are meant to serve as a baseline for monitoring intertidal communities in RNSP. Data was collected seasonally to asses the amount of within-year variation that occurs in the target assemblages. This information is important for deciding what months are optimal for sampling over a longer time scale. Seasonal variation in abundance of mobile invertebrates or percent cover of target species was common at all sites, and differences were strongest between early summer and fall or winter (Figures 13-17). Because of frequent, often severe storms in winter, we suggest that monitoring occur in late May or early June and late October or early November. These seasonal differences may be linked to changes in recruitment (Roughgarden et al. 1988, 1991), nutrient availability (Bosman et al. 1987, Wootton et al. 1996, Bracken 2004, Nielsen and Navarrette 2004), or wave activity (Paine 1979).
Initial monitoring results from Redwood National and State Parks do not indicate any strong community changes over the study period. However, comparisons between current assessment and those made by Boyd and DeMartini (1977) indicate a strong successional shift from a highly disturbed community, to a more stable, late successional community. Percent cover variation resulting from small scale spatial clearance has also decreased since the earlier study periods. Historically, community differences may be attributed to increased sediment loads and higher quantities of driftwood at rocky intertidal sites (McGary 2005). Without monitoring data before and after the years of intense logging, it is not possible to directly assess the impacts of increased sediment loads and driftwood scouring intertidal communities. This highlights the need for continued monitoring. In the event that degradation was to occur from natural or anthropogenic drivers, monitoring data would enable managers to assess the impacts and determine biological responses (Raimondi et al. 1999).
58
SAND BEACH INVENTORY In late August of 2005 we conducted an exhaustive inventory of sand beach invertebrates at Crescent Beach, Gold Bluffs Beach, and Redwood Creek Beach. Late summer was chosen for this survey, because it is typically a time of peak productivity and invertebrate abundance. Invertebrates were collected during sampling for sand crabs and beach hoppers (see below), and by opportunistic digging at various shore levels.
A total of 19 invertebrate species were inventoried (Table 6). Seven of these species were not previously recorded in Redwood National and State Parks (Boyd and DeMartini 1977 and 1981, Appendix C). Crescent Beach was home to the highest number of species, while Redwood Creek Beach was least diverse. This trend was expected given the differences in beach slope among these three sites (Figure 31). ___________________________________________________________________________ Table 6. Sand beach invertebrate taxa inventoried at Crescent Beach, Gold Bluffs Beach, and Redwood Creek Beach in August, 2005. Abundance categories are as follows: (A) Abundant, (C) Common, (P) Present, (U) Uncommon, (R) Rare. Phylum Class Current Scientific Name Abundance
Crescent Beach
Gold Bluffs Beach
Redwood Creek Beach
Annelida Polychaeta Euzonus mucronatus A P Annelida Polychaeta Lumbrineris zonata U Annelida Polychaeta Nephtys californiensis A A C Arthropoda Crustacea Alloniscus perconvexus P P R Arthropoda Crustacea Archaeomysis grebnitzkii A A R Arthropoda Crustacea Crangon nigricauda A A R Arthropoda Crustacea Emerita analoga A A A Arthropoda Crustacea Eohaustorius washingtonianus C C U Arthropoda Crustacea Excirolana linguifrons C C C Arthropoda Crustacea Excirolana spp P P U Arthropoda Crustacea Megalorcestia californiana A C U Arthropoda Crustacea Megalorcestia columbiana C C P Arthropoda Insecta Thinopinus pictus U Cnidaria Scyphozoa Aurelia aurita R Echinodermata Echinoidea Dendraster excentricus P U R Mollusca Gastropoda Nassarius fossatus A C U Mollusca Gastropoda Nassarius obsoletus P U R Mollusca Gastropoda Olivella baetica P U Mollusca Gastropoda Olivella biplicata C C R

59
0
1
2
3
4
5
6
0 10 20 30 40 50 60 70 80 90 100
110
120
130
140
150
160
Beach Length (m)
Bea
ch H
eigh
t (m
)
Redwood Creek BeachGold Bluffs BeachCrescent Beach
Figure 31. Relative steepness of beach slopes at three study sites in RNSP, June 2004. ___________________________________________________________________________
SAND BEACH MONITORING Introduction
Sandy beaches comprise approximately 70% (estimated from aerial photographs) of
the coastline within Redwood National and State Parks. Sandy beaches are important components of the land-sea interface, although understudied and often overlooked (Richards 2005). Sand beaches accumulate high densities of detritus, an important food source for sand beach macroinvertebrates and infauna. These sand beach organisms are the primary food source for a number of birds and mammals (Dugan et al. 2000). Sand beaches are also important as nesting grounds for shorebirds.
A protocol for monitoring sand beaches in Channel Islands National Park was developed by Dugan, et al. (1990). We have utilized this study design to monitor three sandy shore sites in RNSP: Crescent Beach, Gold Bluffs Beach at Espau Lagoon, and Redwood Creek Beach (Figure 7Figure 8Figure 9). All three sites were sampled during early morning low tides in May and July 2004 and in August 2005. This report summarizes the abundance and distribution patterns of sand crab (Emerita analoga) and beach hopper (Megalorchestia spp) populations.
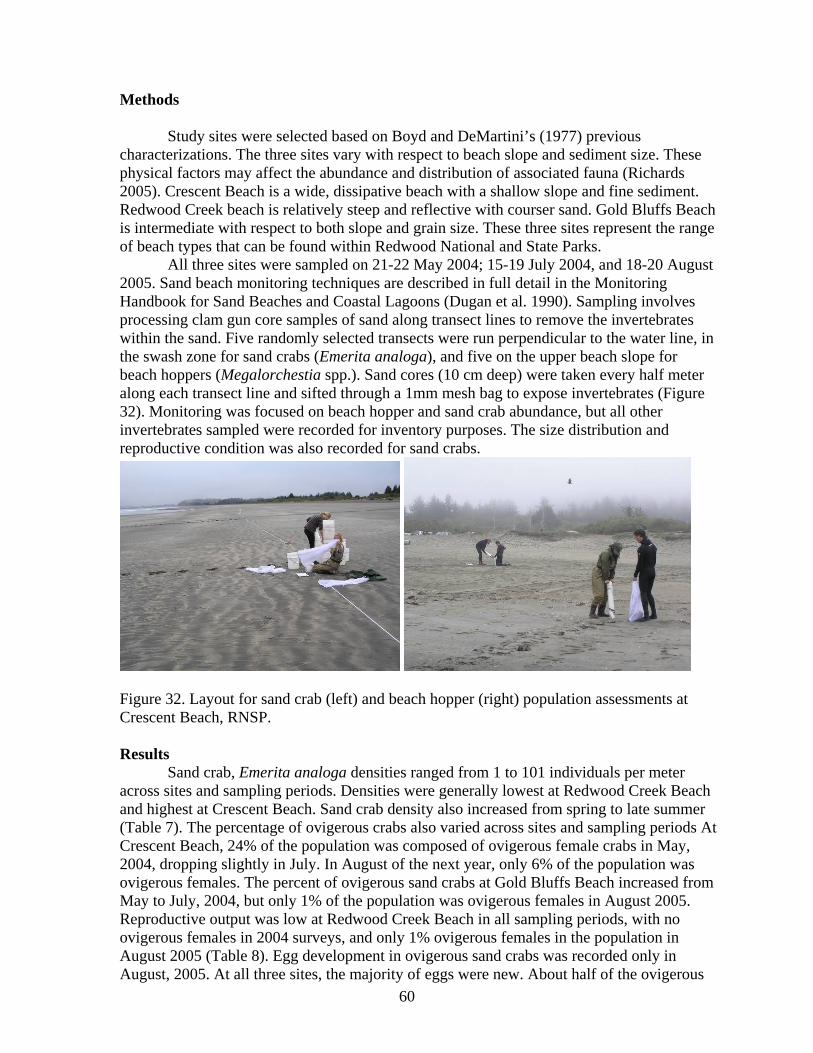
60
Methods
Study sites were selected based on Boyd and DeMartini’s (1977) previous characterizations. The three sites vary with respect to beach slope and sediment size. These physical factors may affect the abundance and distribution of associated fauna (Richards 2005). Crescent Beach is a wide, dissipative beach with a shallow slope and fine sediment. Redwood Creek beach is relatively steep and reflective with courser sand. Gold Bluffs Beach is intermediate with respect to both slope and grain size. These three sites represent the range of beach types that can be found within Redwood National and State Parks. All three sites were sampled on 21-22 May 2004; 15-19 July 2004, and 18-20 August 2005. Sand beach monitoring techniques are described in full detail in the Monitoring Handbook for Sand Beaches and Coastal Lagoons (Dugan et al. 1990). Sampling involves processing clam gun core samples of sand along transect lines to remove the invertebrates within the sand. Five randomly selected transects were run perpendicular to the water line, in the swash zone for sand crabs (Emerita analoga), and five on the upper beach slope for beach hoppers (Megalorchestia spp.). Sand cores (10 cm deep) were taken every half meter along each transect line and sifted through a 1mm mesh bag to expose invertebrates (Figure 32). Monitoring was focused on beach hopper and sand crab abundance, but all other invertebrates sampled were recorded for inventory purposes. The size distribution and reproductive condition was also recorded for sand crabs.
Figure 32. Layout for sand crab (left) and beach hopper (right) population assessments at Crescent Beach, RNSP. Results
Sand crab, Emerita analoga densities ranged from 1 to 101 individuals per meter across sites and sampling periods. Densities were generally lowest at Redwood Creek Beach and highest at Crescent Beach. Sand crab density also increased from spring to late summer (Table 7). The percentage of ovigerous crabs also varied across sites and sampling periods At Crescent Beach, 24% of the population was composed of ovigerous female crabs in May, 2004, dropping slightly in July. In August of the next year, only 6% of the population was ovigerous females. The percent of ovigerous sand crabs at Gold Bluffs Beach increased from May to July, 2004, but only 1% of the population was ovigerous females in August 2005. Reproductive output was low at Redwood Creek Beach in all sampling periods, with no ovigerous females in 2004 surveys, and only 1% ovigerous females in the population in August 2005 (Table 8). Egg development in ovigerous sand crabs was recorded only in August, 2005. At all three sites, the majority of eggs were new. About half of the ovigerous

61
females at Crescent Beach had eggs that were developed enough to have eyespots, while only one third of the ovigerous females held eggs with eyespots at Redwood Creek Beach. This could be an indication of later development at Redwood Creek Beach. Unfortunately there were very few ovigerous females sampled at Gold Bluffs Beach at this sampling period, so it is not possible to comment on egg development there (Table 9).
Amphipod abundance was highest in spring at Redwood Creek Beach, and remained close to 200 individuals per meter in July 2004 and August 2005 (Table 10) At Gold Bluffs Beach and Crescent Beach South, amphipod density was highest in August 2005 (Table 10).
_______________________________________________________________________ Table 7. Washzone transect species abundance summary. Mean number of sand crabs (Emerita analoga) per meter of beach sampled on (A) May 2004, (B) July 2004, and (C) August 2005. A
Site Emerita/m Redwood Creek Beach 1 Gold Bluffs Beach 33 Crescent Beach 15
B Site Emerita/m Redwood Creek Beach 1 Gold Bluffs Beach 81 Crescent Beach 17
C Site Emerita/m Redwood Creek Beach 16 Gold Bluffs Beach 26 Crescent Beach 101
Sandy beach collection of invertebrates, RNSP.
Table 8. Emerita analoga reproductive population percentage. Totals and mean/m from five transects per beach sampled on (A) May 2004, (B) July 2004, and (C) August 2005, RNSP.

62
A Site Ovigerous Non-Ovigerous Total crabs %Ovigerous in population Redwood Creek Beach 0 7 7 0% Gold Bluffs Beach 31 934 965 3% Crescent Beach 26 81 107 24% B Site Ovigerous Non-Ovigerous Total crabs %Ovigerous in population Redwood Creek Beach 0 1 1 0% Gold Bluffs Beach 102 501 603 17% Crescent Beach 43 193 236 18% C Site Ovigerous Non-Ovigerous Total crabs %Ovigerous in population Redwood Creek Beach 2 175 177 1% Gold Bluffs Beach 6 536 542 1% Crescent Beach 9 1944 1975 0% Table 9. Emerita analoga numbers by gender and egg developmental stage sampled August 2005, RNSP.
Site New Eggs
Eyespot Eggs
Grey Eggs
Just Dropped
Non- Ovigerous Male Unsexed
Total crabs Megalopa
Redwood Creek Beach 4 2 0 0 202 368 61 637 0 Gold Bluffs Beach 0 1 0 0 41 31 105 178 0 Crescent Beach 23 25 1 0 523 525 762 1859 0
Table 10. Summarized abundance of amphipods in upper–beach transects. Numbers represent the mean abundances from five transects at three sandy beach sites in RNSP. Site
Amphipods/m May 2004
Amphipods/m July 2004
Amphipods/m August 2005
Redwood Creek Beach 434 242 183 Gold Bluffs Beach 105 166 272 Crescent Beach 245 63 644
63
Discussion Our data indicate a general increase in the abundance of beach hoppers and sand crabs from spring to fall. This is the same result that Boyd and DeMartini (1977) noted in their surveys of sand beach invertebrates at the same sites in the mid 1970’s. Fluctuations in abundance are likely due to short-term life cycle variation and nutrient availability within a site (Boyd and DeMartini 1977, Dugan et al. 2000). Trends in the amphipod abundance at Redwood Creek were contrary to the other sites. Population estimates were higher in May, compared to the other two summer surveys. It is possible that the amphipod population temporarily increased at this site in response to elevated nutrient levels. The creek may have provided additional nutrients during heightened spring flow. Sand crab and amphipod abundances varied among sites as well. This is probably due to differences in beach morphology and nutrient availability. Beaches that have a steeper slope generally have lower nutrient content than beaches with a shallower slope. Beaches with steep slopes are more reflective, thus detritus (invertebrate food) has a shorter amount of time to settle. Flat beaches have high nutrient availability, thus a higher abundance of invertebrates and these tend to be larger than con-specifics at other sites (Dugan et al. 2000, Lerma and Richards 2000). Redwood Creek has the steepest beach slope, Gold Bluffs Beach is intermediate, and Crescent Beach is the most dissipative (Figure 31). Respective population abundances follow the same trends (Table 7 and Table 10). Both of these results are likely due to nutrient availability and water temperature. While short term fluctuations are valuable for understanding beach dynamics and invertebrate population variation, much would be gained from long term monitoring of this system. Sand beach monitoring has been implemented at Channel Islands in an effort to study the system’s natural variation such that anthropogenic perturbations could be detected, distinguished, and assessed. These surveys are also valuable for indicating the productivity of a sand beach at multiple trophic levels. Surveys can be used as an indication of food availability and can be linked to avian surveys to determine habitat use by shorebirds (Dugan et al. 2000, Richards 2005). Sand beach monitoring should continue, especially at Crescent Beach and Gold Bluffs Beach, and shorebird surveys should be integrated with the protocol. Ideally, sand beach sampling should occur in late July/early August when populations reach maximum abundance and reproductive output. It is not advised to conduct surveys in September as tides shift and become too early for practical surveys.

64
INTERTIDAL FISHES The tidepool fishes of Redwood National and State Parks were inventoried and
monitored during 2004 and 2005 (Table 11). The goal of the inventory was to create a species list for Enderts Beach, Damnation Creek, and False Klamath Cove and to compare species richness with regards to varying habitats. This was a qualitative approach using multiple methods of collection. In addition, beach seines were used to access nearshore fish species over sand beach areas. The monitoring involved repeated sampling of the same rocky tidepools in a consistent manner. This approach provided a more quantitative assessment of specific resident species of tidepool fishes. Research was also conducted on juvenile black rockfish, Sebastes melanops, which utilize tidepools as nursery areas for short periods of time. _______________________________________________________________________ Table 11. Intertidal and nearshore fish sampling for Enderts Beach, Damnation Creek, and False Klamath Cove in 2004 and 2005 RNSP surveys.
Method Sites Sampling Frequency Replicates per Site Tidepool Collections 3 Bi-monthly 7-9 Beach Seines 2 Annually 5-10 Inventory 2 Annually 3 Juvenile Rockfish surveys 3 Seasonally 5
_________________________________________________________________________
Rocky Intertidal Fish Inventory Rocky intertidal fish inventories were conducted on 5 February 2005 at Damnation Creek and 6 February 2005 at False Klamath Cove, RNSP. The inventory was supervised by fisheries graduate student Karah Cox, Humboldt State University’s Icthyology professor Dr. Andrew Kinziger, and Marine Fish Ecology professor Dr. Timothy Mulligan. The coordinated efforts of approximately twenty students for each sampling event provided an extensive range of effort for this survey. Multiple methods of collection were utilized to sample a wide range of species that inhabit various niches within the intertidal habitat.
Bothragonus swanii, rockhead poacher

65
Census procedure
This sampling occurred during low tidal events when the mean low low water level was between -1.2 and +1.0 feet. The census for each site was conducted by dividing the site, using meter tapes, into zones relative to the mean tidal height. Teams of five to eight samplers and at least one taxonomic expert sampled each zone for 30 minute increments. At the end of each time increment the collected fish were enumerated, identified and measured. Teams were rotated so that all teams sampled each zone. This was done to ensure that sampling effort for each zone was the same and so that each zone was thoroughly sampled. A small subset of fish was kept for species verification while the remaining fish were returned to the area sampled. Capture Methods
Methods used for fish collection included bailing pools of various sizes with buckets and bilge pumps, poke polling, hook and line fishing, and rolling boulders. Bailing tidepools required the cooperation of several people using buckets and manual bilge pumps to remove the water. This allowed for the easy and complete retrieval of all fish from emptied pools. Sampling included searching beneath large boulders and in crevices. Poke polling is a modified hook and line method where a simple line with a wire hook is attached to a bamboo pole (Figure 33). The pole can then be stuck into rock crevices in the intertidal to catch the more cryptic fish species. Hook and line methods were carried out by experienced fishers just off the rocky shores and focused on nearshore species. Several species of intertidal fish burrow under boulders and can remain out of water for some time (Horn et. al. 1999). Pricklebacks and gunnels are not commonly seen unless boulders are moved. Moving boulders was accomplished by hand and with the aid of a crow bar for larger boulders.
Figure 33. HSU students using poke-polling as a method for intertidal fish inventory at Damnation Creek, RNSP on 5 February 2005. _______________________________________________________________________

66
Habitat
The rocky intertidal may be divided into habitat zones that can be distinguished by temperature differences and varying species composition (Menge 2000). During periods of low tides, temperature, salinity, oxygen, and pH levels change with varying exposure levels along a vertical gradient. Dividing this habitat into tidal height zones is readily accomplished with regards to exposed algae and invertebrates, however, these distinctions are more complicated with regards to submerged pools. Determining clear borders for these zones is difficult because the depth of the pools adds another dimension. For example, a large deep pool in the high intertidal zone may have similar physical characteristics and species composition to a shallower pool in the low zone.
For the purpose of this inventory the areas were divided into low, middle, and high zones for the Damnation Creek site and into high and low zones for False Klamath Cove. False Klamath Cove was divided into two zones due to the shape of this site. At low tide this site is surrounded on both sides by water with a central margin of exposed intertidal area. The peninsula stretches 175 meters in length and is between 60 and 100 meters wide (Figure 34). The areas near the ocean were deemed low zone and the band between the two low zones was characterized as a high zone. Further delineation of this narrow site was not deemed appropriate. False Klamath Cove and Damnation Creek also differ greatly in substrate composition. False Klamath Cove is a boulder field with potential for temporal variation in sand scour and boulder movement. Damnation Creek is 6.5 kilometers north of False Klamath Cove and has rocky intertidal benches with relatively stable substrate. The intertidal bench at Damnation Creek is 175 meters in length by 65 meters in width (Figure 35). ________________________________________________________________________
Figure 34. False Klamath Cove, RNSP intertidal area showing high and low zones (shaded). ______________________________________________________________________
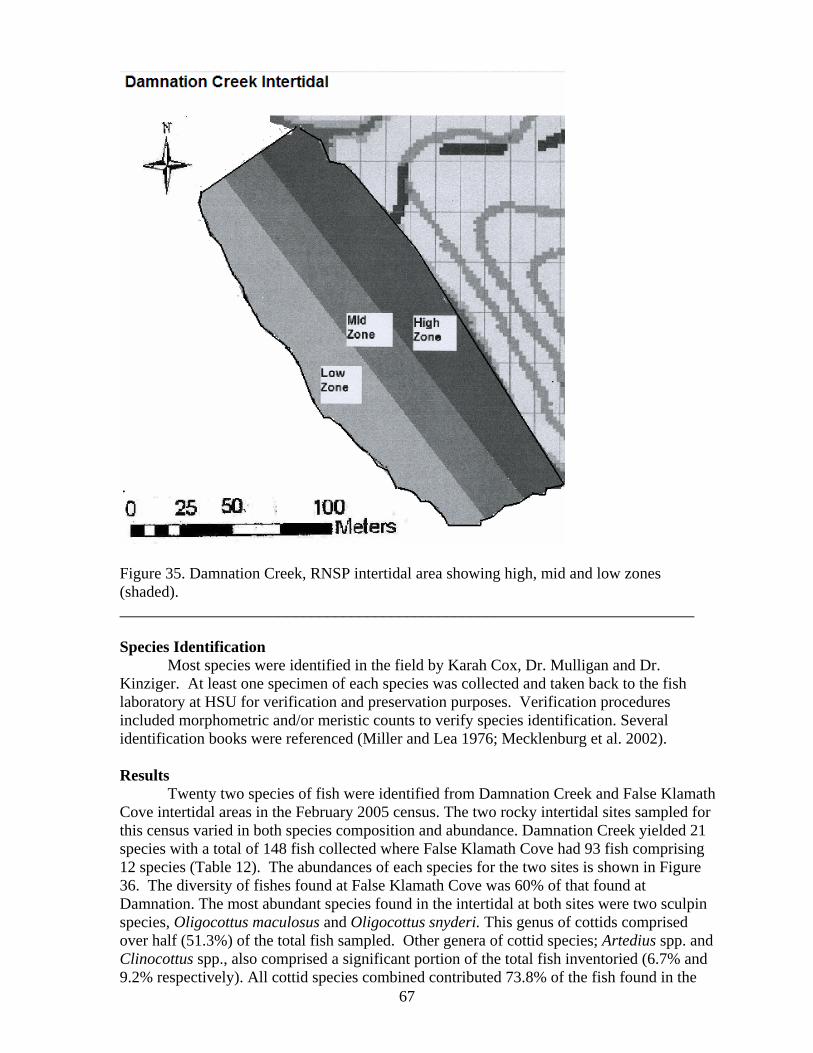
67
Figure 35. Damnation Creek, RNSP intertidal area showing high, mid and low zones (shaded). ________________________________________________________________________ Species Identification
Most species were identified in the field by Karah Cox, Dr. Mulligan and Dr. Kinziger. At least one specimen of each species was collected and taken back to the fish laboratory at HSU for verification and preservation purposes. Verification procedures included morphometric and/or meristic counts to verify species identification. Several identification books were referenced (Miller and Lea 1976; Mecklenburg et al. 2002). Results Twenty two species of fish were identified from Damnation Creek and False Klamath Cove intertidal areas in the February 2005 census. The two rocky intertidal sites sampled for this census varied in both species composition and abundance. Damnation Creek yielded 21 species with a total of 148 fish collected where False Klamath Cove had 93 fish comprising 12 species (Table 12). The abundances of each species for the two sites is shown in Figure 36. The diversity of fishes found at False Klamath Cove was 60% of that found at Damnation. The most abundant species found in the intertidal at both sites were two sculpin species, Oligocottus maculosus and Oligocottus snyderi. This genus of cottids comprised over half (51.3%) of the total fish sampled. Other genera of cottid species; Artedius spp. and Clinocottus spp., also comprised a significant portion of the total fish inventoried (6.7% and 9.2% respectively). All cottid species combined contributed 73.8% of the fish found in the
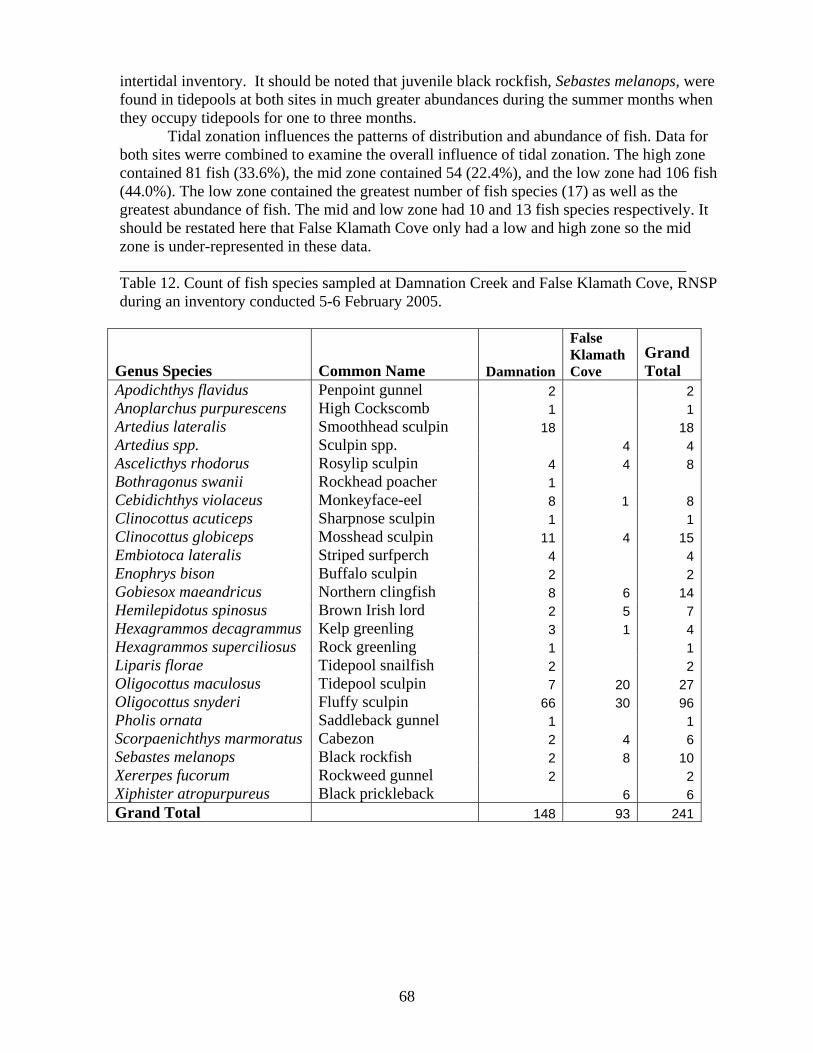
68
intertidal inventory. It should be noted that juvenile black rockfish, Sebastes melanops, were found in tidepools at both sites in much greater abundances during the summer months when they occupy tidepools for one to three months. Tidal zonation influences the patterns of distribution and abundance of fish. Data for both sites werre combined to examine the overall influence of tidal zonation. The high zone contained 81 fish (33.6%), the mid zone contained 54 (22.4%), and the low zone had 106 fish (44.0%). The low zone contained the greatest number of fish species (17) as well as the greatest abundance of fish. The mid and low zone had 10 and 13 fish species respectively. It should be restated here that False Klamath Cove only had a low and high zone so the mid zone is under-represented in these data. _______________________________________________________________________ Table 12. Count of fish species sampled at Damnation Creek and False Klamath Cove, RNSP during an inventory conducted 5-6 February 2005.
Genus Species Common Name Damnation
False Klamath Cove
Grand Total
Apodichthys flavidus Penpoint gunnel 2 2Anoplarchus purpurescens High Cockscomb 1 1Artedius lateralis Smoothhead sculpin 18 18Artedius spp. Sculpin spp. 4 4Ascelicthys rhodorus Rosylip sculpin 4 4 8Bothragonus swanii Rockhead poacher 1 Cebidichthys violaceus Monkeyface-eel 8 1 8Clinocottus acuticeps Sharpnose sculpin 1 1Clinocottus globiceps Mosshead sculpin 11 4 15Embiotoca lateralis Striped surfperch 4 4Enophrys bison Buffalo sculpin 2 2Gobiesox maeandricus Northern clingfish 8 6 14Hemilepidotus spinosus Brown Irish lord 2 5 7Hexagrammos decagrammus Kelp greenling 3 1 4Hexagrammos superciliosus Rock greenling 1 1Liparis florae Tidepool snailfish 2 2Oligocottus maculosus Tidepool sculpin 7 20 27Oligocottus snyderi Fluffy sculpin 66 30 96Pholis ornata Saddleback gunnel 1 1Scorpaenichthys marmoratus Cabezon 2 4 6Sebastes melanops Black rockfish 2 8 10Xererpes fucorum Rockweed gunnel 2 2Xiphister atropurpureus Black prickleback 6 6Grand Total 148 93 241

69
Bailing of tidepools was by far the most successful method of catching fish, with 97% of the total fish collected using this method. The hook and line method, using shrimp as bait, collected two Embiotica lateralis, striped surfperch, one Scorpaenicthys marmoratus, cabezon, and one Hexagrammos decagrammus, kelp greenling. Poke polling was used to catch one Artedius lateralis, smoothhead sculpin, one Embiotica lateralis, striped surfperch and two Enophrys bisons, buffalo sculpin. This was the only method that captured Enophrys bison, demonstrating the importance of utilizing various collection methods in order to capture the greatest diversity of fish species.
________________________________________________________________________
Fish Abundances at Two Intertidal Locations
0 20 40 60 80 100
Anoplarchus purpurescensApodichthys flavidus
Artedius lateralisArtedius spp.
Ascelicthys rhodorusBothragonus swanii
Cebidichthys violaceusClinocottus acuticepsClinocottus globiceps
Embiotoca lateralisEnophrys bison
Gobiesox maeandricusHemilepidotus spinosus
Hexagrammos decagrammusHexagrammos superciliosus
Liparis floraeOligocottus maculosus
Oligocottus snyderiPholis ornata
Scorpaenichthys marmoratusSebastes melanopsXererpes fucorum
Xiphister atropurpureus
Fish
Spe
cies
Fish Abundances
Damnation Creek
False Klamath
Figure 36. Number of total fish collected at False Klamath Cove on 5 February 2005 and Damnation Creek on 6 February 2005, during an intertidal fish inventory of RNSP. _______________________________________________________________________

70
Variation in Fish Abundances in Tidal Zones
0 10 20 30 40 50 60 70 80 90 100
Anoplarchus purpurescensApodichthys flavidus
Artedius lateralisArtedius spp.
Ascelicthys rhodorusBothragonus swanii
Cebidichthys violaceusClinocottus acuticepsClinocottus globiceps
Embiotoca lateralisEnophrys bison
Gobiesox maeandricusHemilepidotus spinosus
Hexagrammos decagrammusHexagrammos superciliosus
Liparis floraeOligocottus maculosus
Oligocottus snyderiPholis ornata
Scorpaenichthys marmoratusSebastes melanopsXererpes fucorum
Xiphister atropurpureusFi
sh S
peci
es
Fish Abundances
HighMidLow
Figure 37. Number of total fish collected in high, mid, and low tidal zones during intertidal inventory. Numbers were for combined sampling events on 5-6 February 2005 at False Klamath Cove and Damnation Creek, RNSP. ________________________________________________________________________
Enophrys bison, buffalo sculpin Photo by Rebecca Studebaker
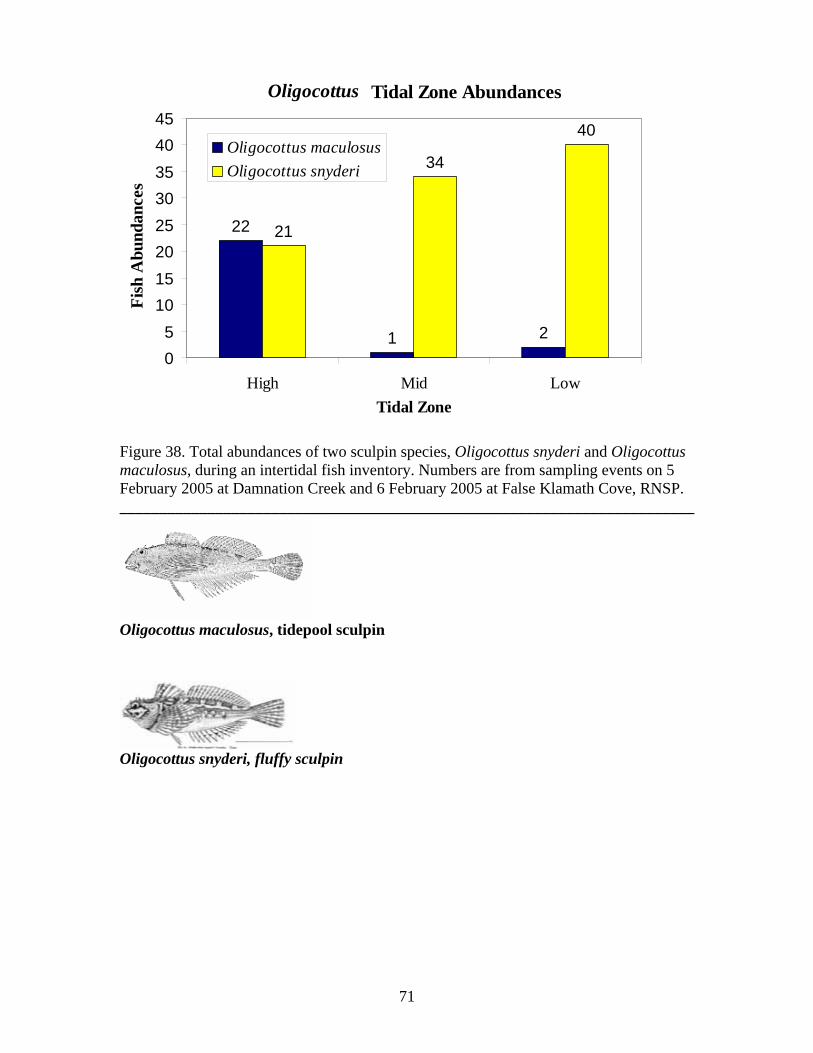
71
Oligocottus Tidal Zone Abundances
22
1 2
21
34
40
05
1015202530354045
High Mid LowTidal Zone
Fish
Abu
ndan
ces
Oligocottus maculosusOligocottus snyderi
Figure 38. Total abundances of two sculpin species, Oligocottus snyderi and Oligocottus maculosus, during an intertidal fish inventory. Numbers are from sampling events on 5 February 2005 at Damnation Creek and 6 February 2005 at False Klamath Cove, RNSP. ________________________________________________________________________
Oligocottus maculosus, tidepool sculpin
Oligocottus snyderi, fluffy sculpin
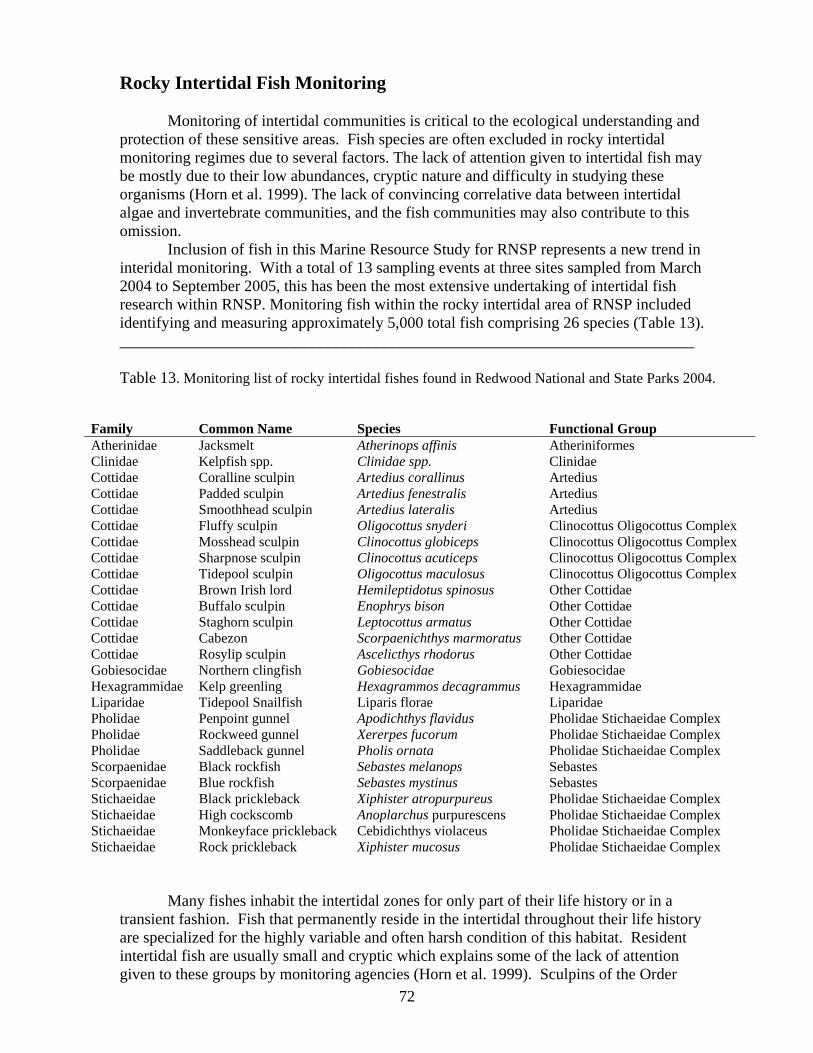
72
Rocky Intertidal Fish Monitoring
Monitoring of intertidal communities is critical to the ecological understanding and protection of these sensitive areas. Fish species are often excluded in rocky intertidal monitoring regimes due to several factors. The lack of attention given to intertidal fish may be mostly due to their low abundances, cryptic nature and difficulty in studying these organisms (Horn et al. 1999). The lack of convincing correlative data between intertidal algae and invertebrate communities, and the fish communities may also contribute to this omission.
Inclusion of fish in this Marine Resource Study for RNSP represents a new trend in interidal monitoring. With a total of 13 sampling events at three sites sampled from March 2004 to September 2005, this has been the most extensive undertaking of intertidal fish research within RNSP. Monitoring fish within the rocky intertidal area of RNSP included identifying and measuring approximately 5,000 total fish comprising 26 species (Table 13). ________________________________________________________________________ Table 13. Monitoring list of rocky intertidal fishes found in Redwood National and State Parks 2004.
Family Common Name Species Functional Group Atherinidae Jacksmelt Atherinops affinis Atheriniformes Clinidae Kelpfish spp. Clinidae spp. Clinidae Cottidae Coralline sculpin Artedius corallinus Artedius Cottidae Padded sculpin Artedius fenestralis Artedius Cottidae Smoothhead sculpin Artedius lateralis Artedius Cottidae Fluffy sculpin Oligocottus snyderi Clinocottus Oligocottus Complex Cottidae Mosshead sculpin Clinocottus globiceps Clinocottus Oligocottus Complex Cottidae Sharpnose sculpin Clinocottus acuticeps Clinocottus Oligocottus Complex Cottidae Tidepool sculpin Oligocottus maculosus Clinocottus Oligocottus Complex Cottidae Brown Irish lord Hemileptidotus spinosus Other Cottidae Cottidae Buffalo sculpin Enophrys bison Other Cottidae Cottidae Staghorn sculpin Leptocottus armatus Other Cottidae Cottidae Cabezon Scorpaenichthys marmoratus Other Cottidae Cottidae Rosylip sculpin Ascelicthys rhodorus Other Cottidae Gobiesocidae Northern clingfish Gobiesocidae Gobiesocidae Hexagrammidae Kelp greenling Hexagrammos decagrammus Hexagrammidae Liparidae Tidepool Snailfish Liparis florae Liparidae Pholidae Penpoint gunnel Apodichthys flavidus Pholidae Stichaeidae Complex Pholidae Rockweed gunnel Xererpes fucorum Pholidae Stichaeidae Complex Pholidae Saddleback gunnel Pholis ornata Pholidae Stichaeidae Complex Scorpaenidae Black rockfish Sebastes melanops Sebastes Scorpaenidae Blue rockfish Sebastes mystinus Sebastes Stichaeidae Black prickleback Xiphister atropurpureus Pholidae Stichaeidae Complex Stichaeidae High cockscomb Anoplarchus purpurescens Pholidae Stichaeidae Complex Stichaeidae Monkeyface prickleback Cebidichthys violaceus Pholidae Stichaeidae Complex Stichaeidae Rock prickleback Xiphister mucosus Pholidae Stichaeidae Complex
Many fishes inhabit the intertidal zones for only part of their life history or in a
transient fashion. Fish that permanently reside in the intertidal throughout their life history are specialized for the highly variable and often harsh condition of this habitat. Resident intertidal fish are usually small and cryptic which explains some of the lack of attention given to these groups by monitoring agencies (Horn et al. 1999). Sculpins of the Order

73
Scorpaeniformes, family Cottidae, comprise the most abundant group of intertidal fishes in the Pacific Northwest. Sculpins have been shown to comprise 98% of the fish species in the intertidal zone (Webster in press). Methods
For a more quantitative comparison of three rocky intertidal sites, specific pools were monitored on a regular schedule to ascertain the population structure of resident sculpin species between and within sites and over seasons. The monitoring sites included False Klamath Cove, Damnation Creek (described in previous section) and Enderts Beach. Enderts Beach was the northern most site monitored, comprised of a narrow bench 30 meters wide by 100 meters long. The sampling schedule depended on the periodicity of low tidal events causing study intervals to vary slightly (Table 14). Sampling occurred monthly from March to August of 2004 and every other month from September 2004 to September 2005. Sampling was conducted at the lowest tidal events of each month and required five to eight researchers working four to six hours per site. ________________________________________________________________________ Table 14. Sampling schedule for Enderts Beach, Damnation Creek, and False Klamath Cove, RNSP rocky intertidal fish monitoring 2004-2005.
________________________________________________________________________
A series of discrete tidepools were established at each site throughout the intertidal zones in which fish species were monitored. Eight pools were established and monitored at Damnation Creek and False Klamath Cove, and nine pools were monitored at Enderts Beach. The tidepools were selected based on their representation at the site and within the tidal zones. Selection was also based on a set of criteria that included manageable volume (100-800 liters), access, as well as suitable potential fish habitat. The edges of the selected pools were marked with a marine epoxy and mapped to ensure that the same pools were sampled on each subsequent visit.
Monitoring involved entirely draining the tidepools with buckets and bilge pumps to ensure that all fish were collected. The fish from each pool were identified, measured (total length to nearest mm), and recorded before being returned to the same pool (Figure 39).
Year Sampling
Period
Month/Day 2004 1 13-16 March
2 10-24 March 3 9-11 May 4 1-6 June 5 2-4 July 6 1-3 August 7 28-30 August 8 1-15 September 9 10-12 December
2005 10 5-7 February 11 24 April, 1May 12 5-9 June 13 16-18 September

74
Figure 39. Monkeyface prickleback, Cebidichthys violaceus, being measured with calipers by researcher at RNSP (left). Researchers bailing tidepools at Enderts Beach for intertidal fish surveys (right). ________________________________________________________________________
Tagging of the resident intertidal fish, from the Cottidae family, was done in 2004 to
determine patterns of site fidelity and movement. Injection of various colored elastomer tags were administered to the cottids. Fish from each tidepool were given a unique tag. The location on the fish and color of tag corresponded with a specific pool. Recapture of previously tagged fish allowed the movement patterns of cottids in the rocky intertidal to be described. Results
The 24 species of fish noted during the tidepool monitoring of RNSP were grouped into 10 functional groups to simplify the summary of distribution patterns (Table 13). The groups were determined as a combination of taxonomic grouping and ecological niche utilization. For example, the seven species from the Stichaeidae and Pholidae families (pricklebacks and gunnels) were grouped together due to their similar habitat utilization. These elongate, eel-like fish reside beneath boulders and can breathe air if out of water. The young of this group are difficult to distinquish and were often identified only to group level. Larval fish of the genera Clinocottus and Oligocottus were also difficult to distinguish and were often found in the same habitat. This group was comprised of four common intertidal species within the familiy Cottidae. Other species from this family were combined into the ‘Other Cottidae’ group. The Artedius, Atherinidae, Liparidae, Gobisocidae, Clinidae, Hexagrammidae, and Sebastes groups were all comprised of one or more species of the same family.
A total of 4,868 fish were recorded during this study. Many of these fish may have been recaptured on one or more sampling occasions, therefore the total counts should not be considered a population estimate. The total number of fish and their corresponding total length ranges and averages show that most of the fish collected were small in size (Table 15). Many of the tidepool groups were represented only by the juvenile stage (i.e. Sebastes, Atherinifomes and Hexagrammids.) The adults of these species are found in deeper off shore water. Summary statistics for the fish groups sampled are displayed in Table 16, Table 17 and Table 18.

75
Enderts Beach, the northern most site, had the greatest number of fish, yielding nearly twice the total number of fish sampled at the other two sites. Damnation Creek and False Klamath Cove had similar total fish counts over the sampling periods (Table 16). Because Clinocottus and Oligocottus sculpins comprised, by far, the greatest number of fish sampled (88.5% of total), their numbers drive the patterns of total abundance and distribution. The majority of juvenile Sebastes recorded in this study were inhabiting tidepools at False Klamath Cove. This site is comprised of many large boulders that create a three dimensional, complex habitat that juvenile rockfish may prefer when recruiting into nearshore habitats (Love et al., 1991). Pholidae and Stichaeidae were rarely seen at Enderts Beach. Scarcity of boulders, the preferred habitat cover for these species, at this site may explain this pattern. ________________________________________________________________________ Table 15. Abundance, average total length (mm) and size range (mm) for intertidal fish groups sampled at Damnation Creek, False Klamath Cove, and Enderts Beach, RNSP during 13 sampling periods in 2004-2005.
Fish Group
No. of Species in
Group
Total No. of Fish
Total Length
Range (mm)
Average Total Length
(mm) Artedius 3 76 17 - 134 66Atheriniformes 1 1 84 --Clinidae 1 1 68 --Clinocottus Oligocottus Complex 4 4308 10 - 186 38Other Cottidae 5 80 23 - 180 70Gobiesocidae 1 156 12 - 80 43Hexagrammidae 1 11 63 - 97 69Liparidae 1 8 20 - 100 47Pholidae Stichaeidae Complex 8 105 24 - 210 69Sebastes 2 122 35 - 77 57

76
Table 16. Abundances of intertidal fish sampled at Damnation Creek, Enderts Beach and False Klamath Cove, RNSP during sampling periods, 2004-2005.
Fish Group Damnation
Creek Enderts Beach
False Klamath
Cove Grand Total
Artedius 41 17 18 76 Atheriniformes 1 1 Clinidae 1 1 Clinocottus Oligocottus Complex 921 2361 1026 4308 Other Cottidae 14 37 29 80 Gobiesocidae 17 78 61 156 Hexagrammidae 2 6 3 11 Liparidae 1 2 5 8 Pholidae Stichaeidae Complex 40 6 59 105 Sebastes 6 2 114 122 Grand Total 1042 2510 1316 4868
________________________________________________________________________ Fish were monitored at Enderts Beach and False Klamath Cove 13 times from 2004
and 2005. Due to weather constraints, Damnation Creek was sampled 12 times. The highest abundance of total fish occurred during the summer and early fall sampling periods (Table 17). These patterns varied between sites and were again driven by high abundances of Clinocottus and Oligocottus sculpins. Larval recruitment of these species occurs in the summer months (Moring, 1981) and contributed to increased numbers during this time.
Size distribution for the two most abundant fish species, Oligocottus maculosus and O.snyderi were similar (Figure 40). Both species had the greatest number of individuals in the 30-35 mm size range. Many more O. snyderi were collected in this study (note scale differences); however the size frequency curves remained similar. These species are closely related and have similar characteristics. They do differ slightly in habitat utilization as O. maculosus are more commonly found in higher zones and O. snyderi are more common in low and mid intertidal pools (Yoshiyama 1981). This is possibly a result of greater adabtation by Oligocottus maculosus to the harsher conditions in the higher zones (Nakamura, 1976).

77
Table 17. Total number of fish sampled during each sampling period in 2004-2005 at False Klamath Cove, Damnation Creek and Enderts Beach, RNSP. Refer to Table 14 for corresponding sampling schedule.
Sampling Periods
Month 2004 2005 Fish Group 1 2 3 4 5 6 7 8 9 10 11 12 13 M M M J J A A S D F A J S False Klamath Cove Artedius 3 1 5 1 1 5 1 1 Clinidae 1 Clinocottus/Oligocottus 79 64 58 136 42 110 145 107 69 60 27 36 93 Gobiesocidae 1 2 1 6 1 6 17 4 3 9 3 1 7 Hexagrammidae 2 1 . Liparidae 2 1 1 1 Other Cottidae 2 2 5 6 1 2 1 1 3 1 4 1 Pholida/Stichaeidae 1 5 3 13 3 4 3 7 3 1 3 4 9 Sebastes 1 54 22 15 22 Damnation Creek Artedius 10 n/a 4 4 9 2 2 2 2 1 5 Clinocottus/Oligocottus 46 64 n/a 50 123 105 78 117 100 52 43 40 103 Gobiesocidae 1 2 n/a 1 2 2 1 4 2 1 1 Hexagrammidae n/a 1 1 Liparidae n/a 1 Other Cottidae 2 n/a 3 2 3 3 1 Pholidae/Stichaeidae 3 3 n/a 4 2 7 2 4 1 1 2 4 7 Sebastes 3 3 Enderts Beach Artedius 2 3 1 4 4 1 2 Atheriniformes 1 Clinocottus/Oligocottus 61 93 176 346 545 308 252 49 42 44 75 178 192 Gobiesocidae 5 12 17 12 6 10 7 3 2 3 1 Hexagrammidae 3 2 1 Liparidae 2 Other Cottidae 1 12 9 8 5 1 1 Pholidae/Stichaeidae 1 1 1 3 Sebastes 1 1
_______________________________________________________________________
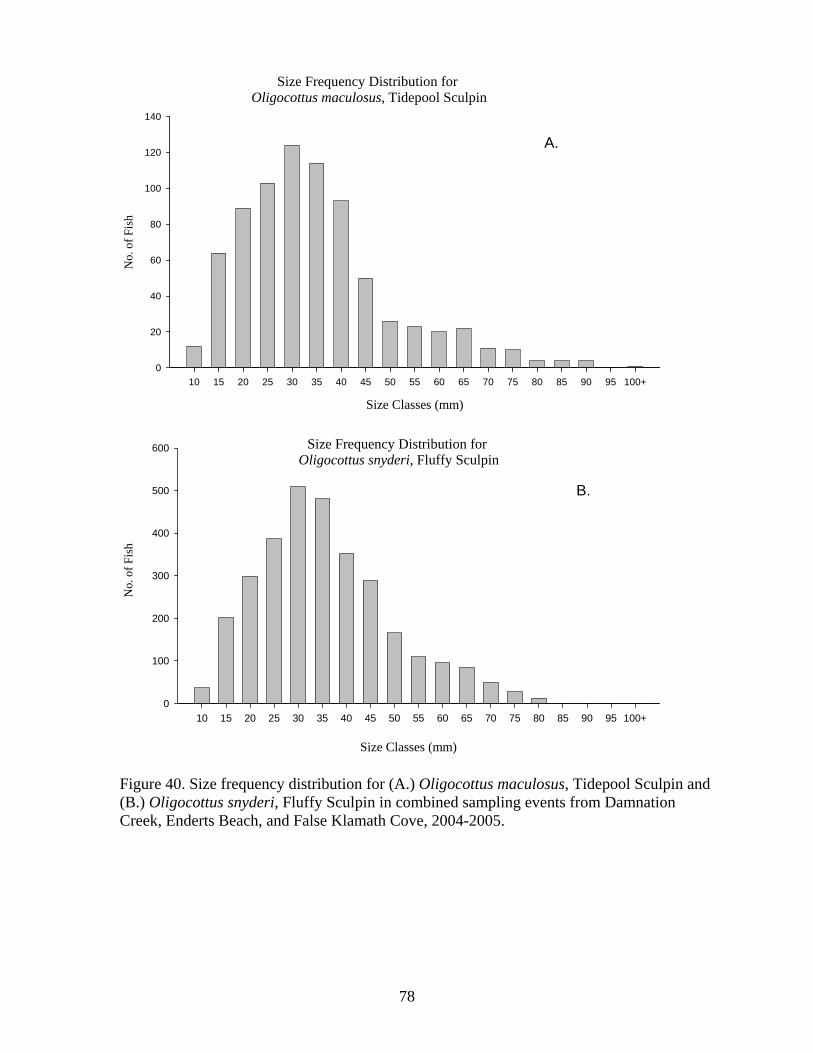
78
Size Frequency Distribution for Oligocottus maculosus, Tidepool Sculpin
Size Classes (mm)
10 15 20 25 30 35 40 45 50 55 60 65 70 75 80 85 90 95 100+
No.
of F
ish
0
20
40
60
80
100
120
140
A.
omaC
10 15 20 25 30 35 40 45 50 55 60 65 70 75 80 85 90 95 100+0
100
200
300
400
500
600
No.
of F
ish
Size Classes (mm)
Size Frequency Distribution for Oligocottus snyderi, Fluffy Sculpin
B.
Figure 40. Size frequency distribution for (A.) Oligocottus maculosus, Tidepool Sculpin and (B.) Oligocottus snyderi, Fluffy Sculpin in combined sampling events from Damnation Creek, Enderts Beach, and False Klamath Cove, 2004-2005.

79
Zonation patterns in the intertidal sites of RNSP had a high degree of variability. The species present, their abundances, and size structure all varied among zones. There was a trend toward greater fish abundance in lower pools. Fish abundances in tidal zones were calculated per volume of water to account for the increased number of fish in larger pools. This was done by dividing the average number of fish collected in each pool per sampling event by the volume of water in each pool. This is displayed as the average number of fish for each pool per cubic centimeter (Figure 41, Figure 42, and Figure 43). The seasonal influx of juvenile cottids during the summer months into higher pools tended to lessen the degree of variation among zones. _______________________________________________________________________
Figure 41. False Klamath Cove, RNSP intertidal fish site showing monitored tidepools (1-8) with the average number of fish caught per sampling event, 2004-2005 per volume (cm3) of water.

80
Figure 42. Damnation Creek, RNSP intertidal fish site showing monitored tidepools (1-8) with the average number of fish caught per sampling event, 2004-2005 per volume (cm3) of water.

81
Figure 43. Enderts Beach, RNSP intertidal fish site showing monitored tidepools (1-8) with the average number of fish caught per sampling event, 2004-2005 per volume (cm3) of water. ________________________________________________________________________
Fish from the family Cottidae were injected with elastomer tags over five sampling
periods between April and September 2004. Tagging data from this study showed high pool fidelity with very little evidence of movement between pools. A total of 797 fish were tagged over the course of this study. Of these, a total of 326 recaptures were recorded with only six individuals recaptured outside of their original tagging tidepool. Less than 2% of fish were recaptured in a different pool from their original capture location, suggesting high pool fidelity for the Cottid fish. Site fidelity for this group has been well documented in previous studies (Green 1971,Yoshiyama et al. 1992). Discussion This study was designed to describe the biodiversity of intertidal and nearshore fishes within Redwood National and State Parks and to track intertidal fish populations at selected tidepools. The temporal and spatial variation of intertidal fish distribution and abundance includes several components. Collectively, these factors determine the habitat utilization of these species. Temporal variation includes time of day, tidal fluctuations, and seasonality. These components determine the amount and level of exposure that organisms must withstand. Spatial variability exists within sites (zonation) and among sites along the coast (latitude). For example, a section of rocky shore may be affected by low salinity due to adjacent river runoff. Describing the fish assemblages in the rocky intertidal region requires observations of the specific zonation patterns of a site and assessment of the linkages of the habitat factors in determining the community ecology (Yoshiyama 1986).
Many studies along the Pacific Northwest coast have investigated rocky intertidal fish communities (Moring 1979, Davis 2000, Webster et al. in prep.). However, fish studies

82
usually remain separate from the other rocky intertidal community studies and are commonly overlooked in intertidal monitoring programs. A new trend in intertidal monitoring may come with the regular integration of fish into monitoring programs, as is now being done at Cabrillo Monument National Park. The difficulties in correlating fish data with other intertidal community data was noted in this study. The tidepools in which fish are sampled in the intertidal differ from the areas monitored for intertidal algae and invertebrates. The water depth of the pools creates a different degree of exposure from those regions that are completely uncovered for some period. This fundamental difference in habitat makes correlating intertidal fish data with those data regularly collected on intertidal algae and invertebrates difficult. The questions that may be addressed with regards to fish in intertidal communities are more likely to be those pertaining to the influence of other intertidal organisms on fish, such as algae cover in tidepools and food source availablities (ie. macro-invertebrates). Monitoring fish in the intertidal may seem disjunct from the typical monitoring schemes, but it may be possible to approach the regular assessment of tidepool fishes in a similar manner to the irregular sea star or abalone plots that are used to track population changes over time (see sea star monitoring section of this report). With global climate change and increased pollution as potential threats to the marine communities, monitoring programs are essential tools to track changes and provide insight to managers. The greater the range of organisms monitored the better the understanding researchers and managers will have of this complex ecosystem.

83
Sandy Nearshore Fishes
Methods Beach seining within RNSP provided a species list of nearshore fishes as well as relative abundances and length data for these species. Sites included Gold Bluffs Beach, near Espau lagoon in the southern part of RNSP and Crescent Beach in the far northern end of RNSP. Sampling occurred in spring and summer of 2004 and during the summer in 2005. At sandy beach sites a six foot deep by 100 foot long beach seine was used to collect fish in the nearshore habitat (Figure 44). Mesh size of the seine was 8mm. Seining occurred after a low tide event when tidal height was ca. 0 feet. The seine was pulled in a half circle from shore by eight to ten people spaced out along the net to insure that the lead line was kept on the sea floor. The net surrounded the fish and was hauled to shore. All fish collected in the net were identified, enumerated, measured and released (Table 18). Minimal specimen collection occurred, and was for identification purposes only. Seining has occurred successfully two times each at Gold Bluffs Beach and Crescent Beach (Table 18). The number of tows for each site and sampling date varied due to weather conditions.
Figure 44. Researchers deploying a beach seine at Gold Bluffs Beach, RNSP 2004.
Jacksmelt (Atherinopsis califoniensis) A common fish found when beach seining within
the Redwood National and State Parks.

84
Table 18. Inventory of sandy nearshore fishes from beach seining efforts at Gold Bluffs Beach and Crescent Beach, RNSP in 2004 - 2005.
Species Common Name
Total # of Fish
Collected Leptocottus armatus Staghorn sculpin 1 Amphistichus rhodoterus Redtail surfperch 539 Psettichthys melanostictus Sand sole 3 Atherinopsis califoniensis Jack smelt 67 Hyperprosopon argenteum Walleye surfperch 283 Oncorhynchus tshawytscha Chinook salmon 2 Citharichthys stigmaeus Speckled sanddab 2
________________________________________________________________________ Results
Fish seining in RNSP yielded a relatively low diversity of fish, as only seven species were sampled. Nearshore, ocean seining does not sample all present species due to the nature of the collection method and the variability associated with the technique and ocean conditions. The most abundant fish caught were Amphistichus rhodoterus, the redtail surfperch with a total of 539 individuals and Hyperprosopon argenteum, the walleye surfperch with a total of 283 fish (Table 18). Atherinopsis califoniensis, jacksmelt made up a significant proportion of the fish sampled in 2004 with 67 total fish sampled (Figure 45).
Annual and site variation was considerable, but due to the low sample size this should not be over emphasized. In 2004 redtail surfperch were much more abundant than walleye surfperch, but in 2005 this trend was reversed. Only three species were collected in 2005 compared to seven in 2004. In 2004 both sites were sampled in the spring and summer while sampling occurred only in the summer of 2005 (Figure 45 and Figure 46). There was some seasonal variation between the summer and spring sampling events in both abundance and size of individuals (Table 19 and Table 20). Biodiversity was lower for the spring 2004 sampling events as only two species were collected compared to six species collected in summer 2004.
Redtail surfperch is an important recreational and commercial fishery along the California coast; according to the California Department of Fish and Game (DFG) it ranks first in the total California perch catch (CalCOFI 2004). Seining operations collected a range of size classes of redtail surfperch, suggesting it is an adequate method for sampling various life stages of this species. Total length of redtail surfperch individuals was greater in spring 2004 than both the summer sampling events of 2004 and 2005 (Table 20). Smaller individuals were only collected in the summer sampling events suggesting that juveniles are born in summer months where they are found associated with adult conspecifics. Jacksmelt is a popular recreational species along the California coast, although it does not contribute to the northern California commercial catch (CalCOFI DFG statistics 2004).

85
Fish Abundances for 2004 Beach Seining
0
331
2 0 1 1 2
67
031
0 0 1
146
0
100
200
300
400
Atherinopsiscalifoniensis
Amphistichusrhodoterus
Citharichthysstigmaeus
Hyperprosoponargenteum
Leptocottusarmatus
Oncorhynchustshawytscha
Psettichthysmelanostictus
Fish Species
No.
of F
ish
Crescent BeachGold Bluffs Beach
Figure 45. Fish abundances for 2004 beach seining efforts at Gold Bluffs Beach and Crescent Beach, RNSP. Numbers are totaled for all dates and all tows. _______________________________________________________________________
Fish Abundances for 2005 Beach Seining
0
45
0 0 0 0017
0
143
0 1 0
109
0
50
100
150
200
Atherinopsiscalifoniensis
Amphistichusrhodoterus
Citharichthysstigmaeus
Hyperprosoponargenteum
Leptocottusarmatus
Oncorhynchustshawytscha
Psettichthysmelanostictus
Fish Species
No.
of F
ish
Crescent BeachGold Bluffs Beach
Figure 46. Fish abundances for 2005 beach seining efforts at Gold Bluffs Beach and Crescent Beach, RNSP. Numbers are totaled for all dates and all tows.

86
Table 19. Total number of fish collected for combined beach seines during spring (20-21 May 2004) and summer (15-18 July 2004 and 18-19 August 2005) at Gold Bluffs Beach and Crescent Beach, RNSP. Numbers in parenthesis show average number per tow.
________________________________________________________________________ Table 20. Average size (TL,mm) of fish species collected for combined beach seines during spring (20-21 May 2004) and summer (15-18 July 2004 and 18-19 August 2005) at Gold Bluffs Beach and Crescent Beach, RNSP. Numbers in parenthesis show minimum and maximum sizes (TL, mm).
2004 Spring Summer
2005 Summer
Species
Gold Bluffs Beach
(2 tows)
Crescent Beach
(6 tows)
Gold Bluffs Beach
(8 tows)
Crescent Beach
(5 tows)
Crescent Beach
(7 tows)
Gold Bluffs Beach
(5 tows) Atherinopsis califoniensis
67 (9.6)
Amphistichus rhodoterus
143 (71.5)
23 (3.8)
3 (0.4)
308 (61.6)
45 (9)
16 (3.4)
Citharichthys stigmaeus
2 (0.3)
Hyperprosopon argenteum
31 (4.4)
109 (21.8)
143 (28.6)
Leptocottus armatus
1 (0.2)
Oncorhynchus tshawytscha
1 (0.2)
1 (0.2)
Psettichthys melanostictus
1 (0.1)
2 (0.4)
2004 Spring Summer
2005 Summer
Species Gold Bluffs Beach
Crescent Beach
Gold Bluffs Beach
Crescent Beach
Crescent Beach
Gold Bluffs Beach
Atherinopsis califoniensis
138 (71-193)
Amphistichus rhodoterus
131 (109-183)
142 (126-232)
72 (71-74)
97 (55-151)
215 (75-306)
148 (71-173)
Citharichthys stigmaeus
40
Hyperprosopon argenteum
58 (55-65)
115 (67-192)
81 (58-174)
Leptocottus armatus
136
Oncorhynchus tshawytscha
104
93
Psettichthys melanostictus 132 109

87
Size Frequency Distribution for Hyperprosopon argenteum
Size Classes (mm)
60 80 100 120 140 160 180 200
No.
of F
ish
0
10
20
30
40
50
Figure 47. Size frequency distribution for Walleye surfperch, Hyperprosopon argenteum, for combined beach seining events, 2004 and 2005 at Gold Bluffs Beach and Crescent Beach, RNSP. __________________________________________________________________________
Size Frequency Distribution for Amphistichus rhodoterus
Size Class (mm)50 100 150 200 250 300
No.
of F
ish
0
10
20
30
40
50
60
Figure 48. Size frequency distribution for Redtail surfperch, Amphistichus rhodoterus, for combined beach seining events, 2004 and 2005 at Gold Bluffs Beach and Crescent Beach, RNSP.

88
Figure 49. Scientists preparing to deploy a beach seine in RNSP (left). Juvenile redtail surfperch, Amphistichus rhodoterus, being measured during nearshore fish inventory (right). Discussion
Seining efficiency is highly variable depending on ocean and site conditions, tow success and fish behavior. The purpose of these seines was to expand the nearshore fish species inventory. Seining was used to gather qualitative data on the fish species present and their abundance and size. Many species are not likely to be captured by seining. For example, due to wave swells most flatfish elude capture.
Each tow was highly variable in both species composition and fish abundance (Table 19). Some of the variability was due to the efficiency of each individual tow. Wave action made some tows less successful than others. The success of each tow was assessed and recorded. These data show a slight correlation between level of tow success and number of fish caught. A larger source of variation between the tows may have been due to fish behavior. Several of the fish species that we collected exhibit schooling behavior (i.e. smelt and surfperch). Surfperch and jacksmelt are schooling fish that often occur in dense schools. This behavior is probably responsible for the large amount of variation in numbers caught in individual tows. When a tow happens to run through a school of fish, large numbers are collected, and when a tow happens to miss a school, it may come up empty. The limitations of the height of the net also prevented tows from occurring far offshore and consequently captured only those species that occur very close to shore. Few bottom dwelling fish were collected in the seines. This may have been due to the lack of these species in the very nearshore waters; however, the difficulty in keeping the net completely on the bottom to prevent these fishes from escaping may have contributed to the low numbers.

89
Intertidal Juvenile Rockfish (Sebastes) Surveys The Northern California coast supports more than 40 species of rockfish, Sebastes spp., several of which have high commercial and recreational value. In California, black rockfish, Sebastes melanops, account for 27% of coastwide total rockfish landings and for 70% of Northern California’s total rockfish landings (Thompson 1999). In Oregon, black rockfish make up more than 50% (weight and number) of the total recreational groundfish catch (Love et al. 2002).
Juvenile rockfish in a tidepool at False Klamath Cove, Redwood National and State Parks,
California. Photo by Mark Lomeli 2004. The juvenile life history stage of rockfishes is critical to local recruitment and
continues to be understudied (Love et al. 2002). Young-of-the-year (YOY) rockfish studies are sparse in our area due to the difficulty of sampling subtidal habitats which are often inaccessible, rough and turbid. Previous studies have noted small, disjunct scatterings of juvenile Sebastes in rocky intertidal areas along the Pacific coast. Species include blue rockfish, Sebastes mystinus, black rockfish, S. melanops, boccacio, S. paucispinis (Moring 1972, 1976), canary rockfish, S. pinniger (Chadwick 1976), and grass rockfish, S. rastrelliger (Davis 2000). In Northern California, black rockfish comprise 99% of the rockfish species present in the intertidal. Little is known about how or why juvenile rockfish utilize rocky intertidal areas, and to date only studies by Studebaker and Mulligan (in prep) and Lomeli et. al. (in prep) have focused solely on juvenile Sebastes spp. in the rocky intertidal area of northern California.
Several sites within the Redwood National and State Parks provide the unique opportunity to study the early life history of a commercially important nearshore species of rockfish. Young-of-the-year black rockfish generally recruit to nearshore environments between May and June at an age of four to six months. After utilizing nearshore habitats they migrate to deeper adult habitats. The use of nearshore, subtidal environments as nursery areas has been well documented for many species of rockfish. However, our research is the first to address use of the intertidal as a potential nursery area for rockfish. To date, studies initiated in our laboratory have examined habitat utilization by juvenile rockfishes at rocky intertidal sites in Northern California (Studebaker and Mulligan in prep. 2006).

90
Abundances of black rockfish were determined at False Klamath Cove and Damnation Creek, RNSP during Summer 2005. Timed searches done at these two sites will be compared to additional sites ranging from central California to the Oregon/Washington border.
A second study conducted in our laboratory examined site fidelity of juvenile black rockfish in intertidal areas. Previous studies suggest that many rockfish species show site fidelity and develop some type of a home range where they may reside for several months, years, or perhaps life. Site fidelity has been observed in some sub-adult and adult rockfish species, but has not been observed for most YOY rockfish species. The newly settled juvenile stage of rockfish is perhaps the least studied aspect of their life history. The focus of this pilot study was to determine if black rockfish show site fidelity while inhabiting the intertidal during the YOY life history stage.
Intertidal sites for this study included tidepools at False Klamath Cove and Endert’s
Beach within RNSP. Specimens were batch tagged with pool and date specific marks using subcutaneous injections of visible implant fluorescent elastomer (Figure 50).
This mark recapture study showed that black rockfish utilize rocky intertidal areas for
up to 74 days. In addition YOY black rockfish showed strong site fidelity not only to an intertidal site, but to particular tidepools within the rocky intertidal. Overall recapture rates were nearly 30%.
Figure 50. YOY black rockfish, Sebastes melanops, displaying elastomer tag used to mark fish in study (Lomeli et al. 2004).
At False Klamath Cove, five tidepools were sampled 14 times over 83 days. A total of 1,109 YOY black rockfish were marked (Figure 51). Of tagged fish, 328 were recaptured and 89% of recaptured specimens were collected from their source pool. One fish, receiving a unique mark, was recaptured four times over 37 days moving only a distance of 18.5 m. Recaptures were noted at up to 74 days (Figure 52). Similar results were noted at the Enderts Beach site.

91
Figure 51. Total number of black rockfish, Sebastes melanops, marked and recaptured per pool at False Klamath Cove, Redwood National and State Park, CA, 06 June to 28 August 2004. Values in red above bars show the percent of total tagged fish that were recaptured per pool. ___________________________________________________________________________
These results strongly suggest that YOY black rockfish exhibit site fidelity and are
utilizing the rocky intertidal areas of False Klamath Cove and Endert’s Beach as nursery areas. In most instances YOY black rockfish showed site fidelity to particular tidepools in the intertidal.
Figure 52. Total number of tagged Sebastes melanops recaptured over time (from 1 to 74 days) at False Klamath Cove, Redwood National and State Park, CA. ___________________________________________________________________________
68 63
3219
2 4 6 3 1
129
0
20
40
60
80
100
120
140
1 to 3 4 to 11 12 to 20 21 to 28 29 to 37 38 to 45 46 to 52 53 to 62 63 to 66 74
# of Days
# Recaptured
# of
Rec
aptu
red
Fish
77
383
537
274
124
158
6
85
36
0
50
100
150
200
250
300
350
400
450
500
550
Pool 1 Pool 2 Pool 3 Pool 4 Pool 5
Tidepool Sampled
# Ta
gged
and
Rec
aptu
red
Number Tagged
Number Recaptured
% Recaptured
42.4% 5.2%
32.4%
29.4%
22.2%

92
The presence of juvenile rockfish in the rocky intertidal has been briefly noted in several fish inventory studies (Moring, 1972, 1976; Chadwick 1976; Davis 2000). However, the abundance of juvenile black rockfish observed at our Northern Californian intertidal sites is much greater than previously noted. Intertidal areas of Humboldt and Del Norte counties may be unique in that they serve as nursery grounds, for at least juvenile black rockfish. The unique opportunity to continue studying a valuable local resource may aid in the management of the fishery. Furthermore, this information may be an important component in the delineation of marine protected areas as it links a subtidal species to intertidal habitats. Future Studies to be Conducted:
During 2005-2006 we will continue juvenile black rockfish studies at the False Klamath Cove and Enderts Beach site. If numbers prove sufficient we will also initiate studies at the Damnataion Creek site. These data will be used to correlate juvenile black rockfish abundance and distribution to critical rocky intertidal habitats within RNSP and adjacent coastal areas.

93
MANAGEMENT IMPLICATIONS AND RECOMMENDATIONS The ultimate goals of the Redwood National and State Parks marine resource study were two-fold: (1) to compile an exhaustive inventory of algal, invertebrate, and fish species living in rocky intertidal and sand beach habitats, and (2) to monitor the spatial and temporal variation inherent in intertidal communities. Inventories provide documentation of biodiversity (Table 1, Table 2, and Appendix C) and allow for tracking changes in the species composition in a given area over time.
The monitoring data collected in this study will serve as baseline information for the various intertidal and nearshore communities within RNSP. This baseline data is the first stage necessary for documentation of natural dynamics. Continuation of this monitoring program is vital for detecting community response to natural and anthropogenic disturbances. For example, if an oil spill were to occur off the Northern California coast, our baseline data could be used to assess the impacts on the intertidal community. Determining the effects of any anthropogenic disturbance on the intertidal community requires monitoring to be of sufficient temporal and spatial scales to differentiate between natural variation and anthropogenic disturbances. Results from both intertidal invertebrete and algal studies have demonstrated the importance of long-term monitoring for accurate assessment of pre- and post-impact population dynamics (Driskell et al. 2001, Forde 2002). In addition, having pre-spill data greatly enhanced the analysis of intertidal impacts of an oil spill in the Galapagos Archipelago (Edgar et al. 2003). The ultimate purpose of long term monitoring is to understand and predict how environmental change, including human impacts, influence physical and ecological processes and how communities respond to such changes. Regular monitoring familiarizes researchers with the localized ecology and community composition of an area. Routine contact increases the likelihood of detecting fluctuations due to disturbance, species invasions and species distribution shifts. For example, an increase in the abundance of the potentially invasive alga, Caulacanthus ustulatus, was recognized by a monitoring group in southern California (Miner et al. in prep). Without routine monitoring of these southern California sites, this invasion would likely have been overlooked. Recording shifts in species abundances and distribution may also be relevant for providing evidence for the effects of global warming. It has been suggested that species range shifts are occurring in response to elevated ocean temperatures (Barry et al. 2001, Sagarin et al. 1999). Establishing a monitoring project and collecting baseline data is only the first stage of a monitoring program. The next stage requires a long-term, spatially extensive and integratable program. For maintenance of the established community structure assessments we propose a twice annual sampling scheme of the three rocky intertidal sites and annual sampling of the three sand beach sites. The sampling regime should include continued use of the adapted MARINe protocols (Engle 2005). We also recommend continually updating the species inventory. Sand beach sampling should be enhanced with the inclusion of shore bird data. Coupling of these data would indicate the productivity of the sandy beaches at multiple trophic levels. Sand beach invertebrates are important forage for shorebirds including the western snowy plover (Dugan 1990, Richards 2005). The monitoring protocols we have established are appropriate for assessing intertidal communities at a given site, but scaling up to encompass the many miles of coastline in Redwood National and State Parks requires further efforts. As was learned from the Exxon Valdez oil spill in 1989, accurate baseline information about intertidal communities is paramount for determining appropriate cleanup and restoration procedures (Sharman et al.
94
2004). It is also necessary for the baseline data to be appropriate to the scale of the anthropogenic disturbance event. Having site specific monitoring data is important, however; managers must also know what resources exist throughout the park and the natural spatial and temporal variation thereof (Schoch 1994, Schoch and Dethier 1996). The site specific monitoring data needs to be put into context of a larger spatial scale and related to other similar locations. This requires both habitat assessments and mapping of the entire coastal area, as well as comparisons among sites on a larger geographic scale.
The Glacier Bay Coastal Resources Mapping Program is designed to assess coastlines on a larger scale. These protocols couple biological and physical shoreline data with GIS (Geographic Information System) layers (Sharman et al. 2004). Field work requires two-person teams to walk the shoreline during low tide and map polygons of similar substrate and composition on enlargements of 1:24,000 scale color infra-red photographs (Sharman et al. 2005). The field data includes substrate characterization, four-minute biological inventories of certain intertidal organisms, zonation transects from the water’s edge to woody vegetation, site photographs, and presence/absence documentation of a variety of resource attributes. GPS points are collected in the field to denote the location of these attributes and for geo-reference on aerial photographs (see www.nps.gov/glba/InDepth). Clearly this would be an appropriate method for characterizing the coastline of Redwood National and State parks. Collaborations should be pursued with the protocol developers in Glacier Bay, as well as those utilizing the protocols in California. The Glacier Bay protocol is currently being used to assess the coastline of Point Reyes National Seashore. Collaborations and communication among investigators is crucial for ensuring accurate data collection and for making comparisons among geographic locations. Studying the marine resources of RNSP on larger geographic scale requires a collaborative effort. In order to put the monitoring data from the RNSP in a much broader geographical context, this study was conducted with the cooperation of two intertidal monitoring agencies, MARINe (Multi-Agency Rocky Intertidal Network) and PISCO (Partenership for the Interdisciplinary Study of Coastal Oceans). The primary function of MARINe is to monitor rocky intertidal ecosystems on the coast of California. They have provided protocols, training, field assistance, data entry assistance, and advice on many aspects of this monitoring project. In turn, RNSP sites contribute data to the MARINe consortium for a more complete comparison of California intertidal ecosystems.
The MARINe protocol has been used in other parts of California to document disturbance events associated with El Nino Southern Oscillation (Miner et al. in prep), population declines resulting from disease and over-harvesting (Raimondi et al. 2002, Miner et al. in prep) , and invasions by non-native species (Miner et al. in prep). Clearly, this is an effective manner of monitoring intertidal communities. Using the MARINe protocols also allows us to make large scale geographic comparisons, because data from sites within Redwood National and State Parks are directly comparable with data collected from over 85 sites from southern California to southern Oregon.
Past efforts directed at monitoring intertidal patterns have been compromised because of variation in sampling design, sampling effort and sampler expertise. The protocols for the MARINe Community Dynamics Surveys use identical sampling in terms of design, effort and expertise at all sites. This consistency provides the ability to track changes at an ecosystem level. The monitoring effort of these groups addresses questions related to biogeography, effects of human use, management of coastal resources and conservation along the temperate West Coast of North America. We have been granted access to a database that was established last year and includes monitoring data from 23 groups along the California coast. The Channel Islands National

95
Park, Cabrillo National Monument, and National Park Service are also entering their data into this data base. This will allow our data to be compared with sites along the coast and provide for data organization and handling.
UCSC conducts coastal biodiversity surveys (CBS) at 96 rocky intertidal sites along the eastern Pacific Coast. In June, a group of their highly trained taxonomic experts helped us conduct a rocky intertidal inventory at Damnation Creek using highly specialized protocols that are in place at numerous sites from Alaska to Baja California, MX. This collaboration will provide a source for coast-wide comparison of the marine intertidal data from Redwood National and State Park.
Future monitoring of the marine resources within RNSP using the established program is essential to track declines or introductions of specific species as well as shifts in species distribution or abundances. Additionally, we recommend monitoring of the sea palm, Postelsia palmaeformis. This alga occurs on mid-intertidal rocks exposed to heavy surf. The sea palm is protected by regulations of the Fish and Game Commission, which allows only commercial harvest with an annual permit. The harvest of this desirable kelp has been increasing and populations cannot withstand heavy harvesting (Miller 2002). This alga occurs at False Klamath Cove and on rocks near Hidden Beach. We suggest monitoring these populations and any others located within park boundaries that can be accessed safely.
Managing areas of special interest such as the coastal habitats within the National Parks requires establishing and maintaining a balance between conservation of the resources and providing public use and enjoyment of these spaces. Decisions regarding managing these resources require scientific based knowledge of the coastal marine ecology.
Long-term monitoring as a method of understanding the intertidal marine environment is more superior to having disparate snapshot studies. Long-term monitoring of shoreline resources provides the data needed for knowledge-based decision making and strong resource management programs. By combining resources with the network of monitoring groups noted above, RNSP can contribute to a better understanding of the dynamics of rocky intertidal communities.
Since the establishment of the Marine Life Management Act (MLMA) and Marine Life Protection Act (MLPA) in 1999 identifying sensitive marine habitats and providing protective status for these regions is spreading along the coast of California. The MLMA encompasses many aspects of conservation of California’s marine resources and takes a preventative approach to management. The Act shifts the importance of management from short-term gains to long-term sustainability by requiring regulatory action to be taken before marine habitat is destroyed and depletion of marine species occurs. The MLPA acknowledges the importance of the entire marine ecosystem and has established guidelines for Marine Protected Areas (MPA) and reserves.
While many MPAs allow a variety of potentially harmful activities, the central scientific and policy issue in the national MPA debate continues to be the degree to which an existing or proposed MPA restricts the extraction of living marine resources. Extraction is defined as all forms of capture, hunting, harvest or collection (including catch-and-release fishing) of fish, invertebrates, plants, birds or mammals living in or transiting through the MPA’s boundaries (Weber 2003). Using this approach, most MPAs in the U.S. can be classified into one of seven degrees of restriction on extraction. Most National Parks fall into the category of Managed Extraction. This type of MPA allows multiple types of extraction but has site-specific regulatory restrictions imposed by the MPA, or by another management authority, that govern when and where fishing and other extractive activities may occur within the site's boundaries. Increasing the protective status of a MPA to reserve status requires sound scientific knowledge and much consideration in the design (Airme et al. 2003)
96
Currently, southern and central California are leading the discussion of marine reserves but as we gain insight into the future of our marine resources, establishing reserves will soon become a reality in the more remote stretches of northern California coasts. The issue of MPA and reserve establishment is often shrouded in mistrust and misunderstanding by local interest groups, such as both commercial and recreational fishermen. This is often fueled by lack of scientific based knowledge to back the claims of the importance and benefits of these proposals. Creating and maintaining a sound monitoring program now will provide evidence to help managers and scientists determine the future need for enhanced protective status for these parks. The parks are promoting the importance of marine resources by establishing long term monitoring programs supported by the public and scientific community. This will translate into a better appreciation for these resources and an awareness of the importance of maintaining them for future generations.
This study has enhanced the information available on marine resources within Redwood National and State Parks, and we hope that continuation of the established program will broaden the understanding of these communities in a larger temporal and geographic context.

97
LITERATURE CITED Abbott, I.A. and G.J. Hollenberg. 1976. Marine algae of California. Stanford University Press
Stanford, California. 827 pp. Airme, S., J.E. Dugan, K.D. Lafferty, H. Leslie, D.A. McArdle, and R.R. Warner. 2003. Applying
ecological criteria to marine reserve design: A case study from the California Channel Islands. Ecological Applications 13(1) Suppplement S170-S184.
Bailey, E.H. 1966. Geology of Northern California. Bulletin 190. California Division of Mines and
Geology. San Francisco, California. 508 pages. Barry J.P., C.H. Baxter, R.D. Sagarin, S.E. Gilman. 1995. Climate-related, long term faunal changes
in a California rocky intertidal community. Science 267: 672-675. Bertness, MD, S.D. Gaines, and SM Yeh. 1998. Making mountains out of barnacles: the
dynamics of hummock formation. Ecology 79: 1382-1394. Bosman A.L., P.R. Hockey, W.R. Siegfried. 1987. The influence of coastal upwelling on the
functional structure of rocky intertidal communities. Oecologia 72: 226-232. Boyd, M. J. and J. D. DeMartini, 1977. The intertidal and subtidal biota of Redwood National Park.
U.S. Department of the Interior, National Park Service Contract No. CX8480-4-0665. 162 pgs.
Boyd, J. B. and J. D. DeMartini. 1981. Reconnaissance Survey of Redwood National Park Area of Special Biological Signficance. Report to California Department of Fish and Game and California State Water Resources Control Board, pp 127. Bracken, M.E.S. 2004. Invertebrate-mediated nutrient loading increases growth of an intertidal
macroalga. Journal of Phycology 40: 1032-1041. CalCOFI 2004. California Department of Fish and Game. Final California Commercial Landings for 2004. California Department of Fish and Game. Marine Life Management Act.
http://www.dfg.ca.gov/mrd/mlma/index.html California Department of Fish and Game. Marine Life Protection Act.
http://www.dfg.ca.gov/mrd/mlpa/index.html. Chadwick, E. M. 1976. A comparison of growth and abundance for tidal pool fishes in California and
British Columbia. Journal Fisheries Biology. 8:27-34. Chan, G.L. 1973. A study of the effects of the San Francisco oil spill on marine organisms
Pp. 741-782 in Proceedings of joint conference on prevention and control of oils spills. American Petroleum Institute, Washington, D.C.
Davis, G. E. 2005. National Park stewardship and vital signs monitoring: a case study from Channel
Islands National Park, California. Aquatic Conserv: Mar. Freshw. Ecosyst. 15: 71-89. Davis, G.E. and W.L. Halvorson. 1996. Long-term research in national parks: from beliefs to
knowledge. Science and Ecosystem Management in the National Parks (W.L. Halvorson and G.E. Davis, eds.). Univ. Arizona Press. Pg.3-10.

98
Davis, Jana. 2000. Changes in a tidepool fish assemblage on two scales of environmental variation:
seasonal and El Nino Southern Oscillation. Limnology and Oceanography. 45(6):1368-1379. Dawson, E.Y. and M.S. Foster. 1982. Seashore plants of California. University of California Press,
Los Angeles, California. 226 pp. Dayton, P.K. 1971. Competition, disturbance and community organization: the provision and
subsequent utilization of space in a rocky intertidal community. Ecol. Monogr. 41:351-389.
Driskell, W.B., J.L. Rusink, D.C. Lees, J.P. Houghton, and S.C. Lindstrom. 2001. Long-term signal of disturbance: Fucus gardneri after the Exxon Valdez oil spill. Ecol. Appl. 11(3):815-827.
Dugan JD, M. Hubbard, G. Davis. 1990. Sand Beach and Coastal Lagoon Monitoring Handbook. Channel Islands National Park, California. National Park Service, Channel Islands National Park, Ventura, California. December, 1999
Dugan J, D.M. Hubbard, D.L. Martin, J.M. Engle, D.V. Richards, G.E. Davis, K.E. Lafferty, R.F.
Ambrose. 2000. Macrofauna communities of Exposed Sandy Beaches on the Southern California mainland and Channel Islands. In Proceedings of the Fifth Channel Islands Symposium. (D.R. Browne, K.L. Mitchell, and H.W. Chaney, eds.)U.S. Minerals Management Service. (CD-ROM MMS Feb. 2000, OCS Study MMS 99-0038.).
Edgar, G. J., L. Kerrison, S. A. Shepard, M. V. Toral-Grands. 2003. Impacts of the Jessica oil spill on
intertidal and shallow subtidal plants and animals. Martine Pollution Bulletin. 47: 276-283. Engle, J. M. 2005. Update.Unified Monitoring Protocols for the Multi-Agency Rocky Intertidal
Network. Minerals Management Services. Forde, S. E. 2002. Modelling the effects of an oil spill on open populations of intertidal invertebrates.
Journal of Applied Ecology. 39:595-604. Foster, M.S., A.P. DeVogelaere, C. Harrold. J.S. Pearse, and A.B. Thum. 1988. Causes of
spatial and temporal patterns in rocky intertidal communities of Central and Northern California. Memoirs of the California Academy of Sciences Number 9, San Francisco, California. 45 pp.
Gabrielson, P.W., T.B. Widdowson, S.C. Lindstorm. 2004. Keys to the seaweeds and seagrasses of
Oregon and California, north of Point Conception. PhycoID, Hillsborough, NC. 181 pages. Green, J.M. 1971. High tide movements and homing behavior of the tidepool sculpin Oligocottus
maculosus. J. Fish Res. Bd. Canada 28:383-389. Glynn, P.W. 1965. Community composition, structure, and interrelationships in the marine intertidal
Endocladia muricata - Balanus glandula association in Monterey Bay, California. Beaufortia 12:1-198.
Hines, A.H. 1978. Reproduction in three species of intertidal barnacles from central
California. Biol. Bull. 154:262-281.
Horn, M., K. Martin, M.Chotkowski. 1999. Intertidal Fishes: Life in Two Worlds. 390pgs.

99
Houghton, J. P., D. C. Lees, W. B. Driskell, and S. C. Lindstrom. 1998. Long-term recovery (1989–1996) of Prince William Sound littoral biota following the Exxon Valdez oil spill and subsequent shoreline treatment. NOAAWASC Contract No. 52ABNC-2-00050.
Kinnetics Laboratories, Inc. 1992. Study of the rocky intertidal communities of Central and Northern
California. Report to the Minerals Management Service. OCS Study MMS 91-0089. Kozloff, E.N. 1993. Seashore Life of the Northern Pacific Coast. University of Washington Press, Seattle WA. 373 pages. Kozloff, E.N. 1996. Marine Invertebrate of the Pacific Northwest. University of Washington Press,
Seattle, WA. 539 pages. Lerma, D., D.V. Richards. 2000 Sand Beach and Coastal Lagoon monitoring, Santa Rosa Island,
1997 Annual Report. Technical Report CHIS-2000-01. Channel Islands National Park, Ventura, CA.
Littler, M.M. and S.N. Murray. 1975. Impact of sewage on the distribution, abundance, and
community structure of rocky intertidal macro-organisms. Mar Biol 30: 277-91. Lomeli, M.J.M. 2004. Site fidelity of young-of-year black rockfish, Sebastes melanops, in rocky
intertidal areas of Northern California. Published abstract at Western Society of Naturalists annual conference.
Lomeli, M.J.M., S.F. Craig, T.J. Mulligan (in prep) Site fidelity of young-of-year black rockfish,
Sebastes melanops, in rocky intertidal areas of Northern California Love, M., M. Carr and L. Haldorson. 1991. The ecology of substrate-associated juveniles of the genus
Sebastes. Env. Biol. of Fishes. 30:225-243. Love, M. S., M. Yoklavich, and L.Thorsteinson. 2002. The Rockfishes of the Northeast Pacific.
404pgs. MacGinitie, G.E. and N. MacGinitie. 1968. Natural history of marine animals. 2nd ed. McGraw Hill, New York. 523 pp. McGary, C.M.. 2005. A long term comparison of rocky intertidal communites in Redwood National
and State Parks. M. S. Thesis, Humboldt State University, Arcata, CA. Mecklenburg, C.W., T. A. Mecklenburg, and L. K. Thorsteinson. 2002. Fishes of Alaska. American
Fisheries Society. 1037pgs. Menge, B. A. 2000. Top-down and bottom-up community regulation in marine rocky intertidal
habitats. Journal of Experimental Marine Biology and Ecology 250:257-289. Miller, D.J. and R. N. Lea. 1976 Guide toe the Coastal Marine Fishes of California. Fish Bulletin No.
157, California Department of Fish and Game. 237 p. Miller, K. A., revised by John O’Brien. 2002. Annual Status of the Fisheries Report Through 2003.
California Fish and Game Report. Miner, M., P.T. Raimondi, R.F. Ambrose, J.M. Engle, S.N. Murray. In prep. Monitoring of rocky
intertidal resources along the central and southern California Mainland: Comprehensive

100
Report (1992-2003) for San Luis Obispo, Santa Barbara, and Orange Countries. OCS Study, U.S. Minerals Management Service MMS 05-xxx.
Moring, J. M. 1972. Check list of intertidal fishes of Trinidad Bay, California, and adjacent areas.
California Fish and Game. 58(4): 315-320. Moring, J. M. 1976. Estimates of population size for tidepool sculpins, Oligocottus maculosus and
other intertidal ishes, Trinidad Bay, Humboldt County, California. California Fish and Game. 62(1): 65-72.
Moring, J.R. 1979 Age structure of a tidepool sculpin, Oligocottus maculosus, population in northern
California. Calif. Fish and Game 65:11-113. Moring, J.R. Moring. 1981. Seasonal changes in a population of the fluffy sculpin, Oligocottus
snyderi, from Trinidad bay, California. Calif. Fish and Game 67:250-253. Morris, R.H., D.P. Abbott, E.C. Haderlie. 1980. Intertidal Invertebrates of California. Stanford University Press, Stanford CA. 690 pages. Nakamura, R. 1976. Temperature and the vertical distribution of two tidepool fishes (Oligocottus
maculosus, O. snyderi). Copeia 1976:143-152. National Oceanic and Atmospheric Administration (NOAA). 1999. Introduction to the ESI Project.
Office of Response and Restoration, National Ocean Service, National Oceanic and Atmospheric Administration. At: http://www.nwn.noaa.gov/sites/hazmat/esi/esiintro.html
National Park Service (NPS). 2003. Inventory and Monitoring Home Page. National Park Service,
U.S. Department of the Interior. At: http://science.nature.nps.gov/im/ Nielsen, K.J., S.A. Navarrete. 2004. Mesoscale regulation comes from the bottom-up: intertidal
interactions between consumers and upwelling. Ecology Letters 7: 31-41. Paine, R.T. 1966. Food web complexity and species diversity. Am. Nat. 100:65-75. Paine, R.T. 1974. Intertidal community structure: experimental studies on the relationship between a
dominant competitor and its principal predator. Oecologia 15:93-120. Paine RT. 1979. Disaster, catastrophe, and local persistence of the sea palm Postelsia palmaeformis.
Science 205: 685-687. Raimondi P.T., R.F.Ambrose, J.M. Engle, S.N. Murray, M. Wilson. 1999. Monitoring of rocky
intertidal resources along the central and southern California mainland. 3-Year Report for San Luis Obispo, Santa Barbara, and Orange Counties (Fall1995-Spring 1998). OCS Study, U.S. Minerals Management Service, Pacific OCS Region MMS 99-0032.
Richards, D.V. 2005. Sand beach and coastal lagoon monitoring, Santa Rosa Island, 2004 Annual
Report. Ricketts, E.G., J. Calvin, J. Hedgepeth, and D.W. Phillips. 1985. Between Pacific tides,
5th ed., revised by J. Hedgepeth. Stanford University Press, Palo Alto, California. 652 pp.

101
Roughgarden, J., S.Gaines, and H. Possingham. 1988. Recruitment dynamics in complex life cycles. Science 241: 1397-1560.
Roughgarden, J., J.T. Pennington, D. Stoner, S. Alexander, K. Miller. 1991. Collisions of upwelling
fronts with the intertidal zone: the cause of recruitment pulses in barnacle populations of central California. Acta Oecologia 12: 35-51.
Sagarin, R.D., J.P. Barry, S.E. Gillman, C.H. Baxter. 1999. Climate-related change in an intertidal
community over short and long time scales. Ecological monographs 69: 465-490. Schoch, G.C. 1994. Geomorphological shoreline classification and habitat sensitivity analysis for
Katmai National Park and Preserve, Alaska. Proceedings: The Coastal Society, Charleston, SC, 4 pp.
Schoch, G.C., M.N. Dethier. 1996. Scaling up: the statistical linkage between organismal abundance
and geomorphology on rocky intertidal shorelines. Journal of Experimental Marine Biology and Ecology, 201:37-72.
Sharman, L., P.Vanselow, W. Eichenlaub. 2004. Mapping coastal resouces in Alaska’s National
Parks. National Parks Service, U.S. Department of the Interior at http://www.nps.gov/glba/InDepth/learn/preserve/projects/coastal/
Sharman, L.C., B. Eichenlaub, D. Van Leeuwen, S. Croll, J.S. Grover. G. Lenhart, A Reischauer, G.
Neufeld, S. Bohac, P. Hillman, L. Graham, M. Anderson, P. Vanselow, J. Burr, T. Troccoli, C. Malleck, and W. Rapp. 2005. Alaska Coastal Resources Inventory and Mapping Program: the Field Protocol, developed at Glacier Bay National Park and Preserve 1997-1998, revised 2004-2005. National Park Service. Gustavus, Alaska. USA.
Stewart, J.G. and B. Myers. 1980. Assemblages of algae and invertebrates in Southern
California Phyllospadix-dominated intertidal habitats. Aquatic Botany 9:73-94. Studebaker, R. S. and T.J. Mulligan. 2004. The use of the rocky intertidal as a nursery area for
juvenile rockfishes (Sebastes spp.) Published abstract at Western Society of Naturalists annual conference.
Thompson, C.J. 1999. Economic and managemnent implications of no-take reserves: an application to Sebastes rockfish in California. California Cooperative of Oceanographic Fisheries Investigations Report. Vol. 40. pp. 107-117 Turner, T. 1983. Complexity of early and middle successional stages in a rocky intertidal
surfgrass community. Oecologia 60:56-65. Turner, T. 1985. Stability of rocky intertidal surfgrass beds: persistence, preemption, and
recovery. Ecology 66:83-92. Vanselow, P. 2003. Inventory and mapping of coastal resources in Glacier Bay National Park.
Natural Resource Year in Review-2002. National Park Service, U.S. Department of the Interior (publication D-2283) and at: http://www2.nature.nps.gov/YearInReview/yir2002/05_J.html
Vesco, L.L. and R. Gillard. 1980. Recovery of benthic marine populations along the
Pacific Coast of the United States following man-made and natural disturbances including pertinent life history information. U.S. Department of the Interior, Bureau of Land Management Service, POCS Reference Paper No. 53-4. 48 pp.

102
Weber and Heneman (2003). Guide to California's Marine Life Management Act. Common
Knowledge Press: Bolinas, CA. 133 p. Wootton, J.T., M.E. Power, R..T. Paine, C.A. Pfister. 1996. Effects of productivity, consumers,
competitors, and El Niño events of food chains in a rocky intertidal community. Proclamations of the National Academy of Sciences 93: 13855
Webster, M.S., J. Osborne-Gowey, T. H. Young, T. L. Freidenburg, B.A. Menge. 2003. in prep.
Persistent regional variation in populations of a tidepool fish. Yoshiyama, R.M. 1980.Food habits of three species of rocky intertidal sculpins (Cottidae) in central
California. Copeia 1980:515-525. Yoshiyama, R. M. 1981. Distribution and abundance patterns of rocky intertidal fishes in central
California. Environmental Biology of Fishes 6:315-332. Yoshiyama, R. M., C. Sassaman, and R. N. Lea. 1986. Rocky intertidal fish communities of
California: [USA]: Temporal and spatial variation. Environmental Biology of Fishes 17:23-40.
Yoshiyama, R.M, K.B. Gaylord, M.T. Philippart, T.R. Moore, J.R. Jordan, C.C. Coon, L.L. Schalk,
C.J. Valpey, I. Tosques. 1992. Homing behavior and site fidelity in intertidal sculpins. J. Exp. Mar. Biol. Ecol. 160:115-130.

103
APPENDIX A: TIMELINE SUMMARY 2004/2005 Field Time and Personnel: 55 Days of Field Work
• Grad Students: 2 students x 3 sites x 6 hrs x 20 sampling periods = 720 hours • Paid Undergraduate Help: 3 students x 3 sites x 6 hrs x 10 sampling periods = 500+
hours • Park Assistance: 2-6 employees x 6 hrs x 10 sampling periods = 200+ hours • PISCO/MARINE workers: 8 days x 4 people x 8 hrs = 256 hrs (free expert
assistance). • Volunteers: 4-6 helpers x 6hrs x 3 sites x 20 sampling periods = 1800+ hours ( free
help). Total Field Time Requirements for 2004/2005 Rocky and Sandy Sampling to occur = 3,000+ hours yearly 2004/2005 Sampling Events
Rocky Intertidal Monitoring May, January, April, June, November Rocky Intertidal Inventories
Damnation May 2004, False Klamath Cove & Enderts May & July 2005 Sand crab/beach hopper census
August 2004, 2005 Sand Beach Fish and In-fauna Inventory
August 2005 Rocky Intertidal Fish Monitoring/Inventory
February, March, April, July, and October Data Entry Requirements: 400+ annual hours
• Photo Plot Analysis = 2 people x 5 hrs per site/per sampling period x 3 sites x 6 sampling = 180 hours annually (+ 3 days of intensive training)
• Seagrass, sea stars, mobile inverts = 2 people x 2-4 hrs per site/per sampling period = 80-140 hours annually
• Fish data entry = 1person x 5hrs x 3 sites x 10 sampling periods = 150 hours annually
Data Analysis required a significant amount of time working with Humboldt State University Biometricians and PISCO/MARINe analysts.

104
APPENDIX B: NATURAL HISTORY OF TARGET SPECIES These brief descriptions provide context for the selection of these target species by including information on life history, ecological importance, and sensitivity to anthropogenic activities. Descriptions of the natural history of the target species monitored in this study have been adapted from the annual MMS report (Miner et. al. in prep). Endocladia muricata Distinctive dark bands of the low-growing red turfweed, Endocladia muricata, are characteristic of nearly all high rocky intertidal shores of the northern Pacific Coast. Endocladia forms dense 4-8 cm tall, perennial tufts made up of tiny spine-covered branchlets (Abbott & Hollenberg 1976). Together with spiny-bladed Mastocarpus papillatus, the Endocladia/Mastocarpus carpet traps sediment and seawater, thus providing a sheltered microhabitat for a host of small organisms, including other algae, worms, crustaceans, and mollusks. Glynn (1965) found over 90 species associated with Endocladia clumps in Monterey. Turfweed can also provide habitat for attachment of young mussels. Expanding mussel patches may displace Endocladia, but it can then grow on the mussel shells, creating a layered assemblage. Some Endocladia clumps appear donut- orcrescent-shaped; this condition may be caused by storms tearing out center areas possibly weakened by accumulated anoxic sediment. Endocladia is hardy and quite resistant to desiccation, yet vulnerable to oiling from spills. Recovery from natural or human disturbances may vary from on to more than six years (Kinnetics 1992). Phyllospadix spp. Surfgrass (Phyllospadix spp.) is one of only two types of marine flowering plants on the West Coast. Unlike the eelgrass Zostera (often confused with surfgrass) that grows in quiet-water mud or sand habitats, surfgrass attaches by short roots to rock on surf-swept shores from the low intertidal down to 10-15 m depths. The 0.5-2 m tall, bright green grass commonly occurs in dense perennial beds formed primarily by vegetative growth from spreading rhizomes. Two species (P. torreyi & P. scouleri) overlap in geographical distribution and morphological characteristics (see Dawson and Foster 1982). P. torreyi generally has longer (1-2 m), narrower (1-2 mm) leaves, longer flower stems with several spadices, and occurs more in semi-protected habitats as well as at deeper depths. P. scouleri tends to have shorter (<50 cm), broader (2-4 mm) leaves, shorter flower stems with 1-2 spadices, and is found more often in wave-swept intertidal areas.Surfgrass meadows are highly productive ecosystems, providing structurally complex microhabitats for a rich variety of epiphytes, epibenthos, and infauna. Some organisms, such as the red algae Smithora naiadum and Melobesia mediocris, are exclusive epiphytes on surfgrass (or eelgrass) (Abbott &Hollenberg 1976). Phyllospadix beds provide nursery habitat for various fishes and invertebrates. Surfgrass cannot tolerate much heat or drying; the leaves will bleach quickly when midday low tides occur during hot, calm-water periods. Surfgrass can be particularly sensitive to sewage discharge (Littler and Murray 1975) and oil pollution (see Foster et al.1988). Recovery can be relatively rapid if the rhizome systems remain functional, but might take many years if entire beds are lost, because recruitment is irregular and must be facilitated by the presence of perennial turf algae to which surfgrass seeds attach (Turner 1983, 1985).

105
Chthamalus dalli and Balanus glandula White acorn barnacles, Chthamalus dalli and Balanus glandula, typically dominate high intertidal zones along the Pacific North Coast. Acorn barnacle species can be difficult to distinguish, especially in photographic monitoring. C. dalli are smaller (to 8mm) than Balanus glandula (to 22 mm) which are whiter in color and have differing shell plate arrangements. Acorn barnacles spawn often, at variable times throughout the year (Hines 1978), and settle in extremely high densities (to 70,000/m²), forming distinct white bands along the upper intertidal that contain few other invertebrates except littorines and the hardiest limpets. Balanus can out compete Chthamalus by crowding or smothering, but Chthamalus can occupy higher tide levels than Balanus, because it is more resistant to desiccation. Slightly lower down, acorn barnacles mix in with the Endocladia assemblage, and are common on mussel shells. Chthamalus species grow rapidly, but only survive a few months to a few years. Balanus can live longer (to 10 years), but its larger size and lower tidal position subject it to higher levels of mortality from predatory gastropods and ochre sea stars. White acorn barnacles are highly vulnerable to smothering from oil spills because floating oil often sticks along the uppermost tidal levels. Significant, widespread barnacle impacts were reported after the 1969 Santa Barbara oil platform blow-out (Foster et al. 1971) and the 1971 collision of two tankers off San Francisco (Chan 1973). However, high recruitment rates may promote relatively rapid recovery of acorn barnacles; disturbance recovery times ranging from several months to several years have been reported (seeVesco & Gillard 1980). A condition referred to as “hummocking” was observed in acorn barnacles at several sites. Hummocking occurs in response to high recruitment densities and growth rates, which intensify competition for primary substrate space (Bertness et. al. 1997). This condition causes crowded barnecles to grow up instead of out until they eventually grow so high that they are susceptible to removal by wave action. Evidence of hummocking was observed at all three monitored sites within RNSP. Frequently, large patches of barnacles would be entirely removed from one sampling period to the next. Mytilus californianus The California mussel, Mytilus californianus, is abundant at middle to low levels of exposed rocky shores along the entire Pacific Coast. These 10-20 cm black/blue/gray mussels firmly attach to rocks or other mussels by tough byssal threads, forming dense patches or beds. The literature on Mytilus californianus is extensive, including key ecological studies on the effects of predation, grazing, and disturbance on succession and community structure (Morris et al. 1980, Ricketts et al. 1985, Kinnetics 1992). Thick (>20 cm) beds of California mussels trap water, sediment, and detritus that provide food and shelter for an incredible diversity of plants and animals, including cryptic forms inhabiting spaces between mussels as well as biota attached to mussel shells (Paine 1966, MacGinitie & MacGinitie 1968, Suchanek 1979; Kanter 1980, Lohse 1993). For example, MacGinitie & MacGinitie (1968) counted 625 mussels and 4,096 other invertebrates in a single 25 cm² clump, and Kanter (1980) identified 610 species of animals and 141 species of algae from mussel beds at the Channel Islands. Mussels feed on suspended detritus and plankton. Young mussels settle preferentially into existing beds at irregular intervals, grow at variable rates depending on environmental conditions, and eventually reach ages of 8 years or more (see Morris et al. 1980, Ricketts et al. 1985). Mussels can tolerate typical rigors of intertidal life quite successfully. However, desiccation likely limits the upper extent of mussel beds, storms tear out various-sized mussel patches, and sea stars prey especially on lower zone mussels. Mytilus are adversely affected by oil spills (Chan 1973, Foster et al. 1971). Recovery from disturbance varies from fairly

106
rapid (if clearings are small and surrounded by mussels that can move in) to periods greater than 10 years (if clearings are large and recruitment is necessary for recolonization (Vesco & Gillard 1980; Kinnetics 1992). Pisaster ochraceus The ochre sea star, Pisaster ochraceus, is found on middle and low tide levels of waveswept, rocky coasts from Alaska to Baja California. Its relatively large size (to 45 cm diameter), variety of colors (yellow, orange, purple, brown), and ability to withstand air exposure (at least 8 hours) attract considerable attention from visitors exploring the shore at low tide. The ochre sea startypically is associated with mussels, which constitute its chief food, but barnacles, limpets, snails, and chitons also may be taken (Morris et al. 1980). Predator-prey interactions involving ochre sea stars have been intensely studied, especially the role of P.ochraceus in determining the lower limit of northern mussel beds (Paine 1966, 1974: Dayton 1971). Ochre sea stars are relatively slow-growing, long-lived, and apparently variable in recruitment success. They are tolerant of high surf, using their numerous tube feet to remain firmly in place, often in cracks and crevices. They have few predators, except for curious tidepool visitors. Sensitivity to oil spills is not well known; Chan (1973) saw no obvious effects from a San Francisco oil spill. Recovery time from any major population loss likely would be very long. Pelvetiopsis limitata The rockweed, Pelvetiopsis limitata is described as light tan to olive; densely branched, cylindrical at the base becoming flattened to cylindrical in the upper fronds; dichotomous; thalli 4-8 cm tall; (Abott and Hollenberg 1976).This algae is seen commonly in the upper intertidal of more wave-exposed sites in RNSP. Pelvitiopsis ranges on the Pacific coast from Vancouver Island, British Columbia, to Cambria (San Luis Obispo County), CA. Little scientific attention has been given to Pelvetiopsis so little is known about its reproductive periodicity, longevity, or ecology. Fucus gardneri Another common rockweed in RNSP, Fucus gardneri, has similar olive brown, branching, dichotomous thalli morphology to Pelvetiopsis. It is distinguished by having taller thalli, 10-25 cm, and prominent midribs in older portions (Abott and Hollenberg 1976). This conspicuous brown alga is commonly found in the mid to high intertidal on rocks. Many species of invertebrates find vital shelter from the harsh conditions characteristic of the intertidal, within the fronds of rockweeds such as Fucus and Pelvetiopsis. Fucus is also a food source for many gastropods (Houghton et al. 1998). Recovery time of Fucus gardneri after the Exxon Valdez oil spill of 1989 was studied. Results suggested that the population dynamics and structure did not fully recover seven years after the spill despite initial biomass recovery (Driskell et al. 2001).

107
APPENDIX C: ROCKY INTERTIDAL INVENTORY LISTS: Algae of the Rocky Intertidal
Phylum Current Scientific Name DMN/ SWAT
END 2005
FKC 2005
END 1977
FKC 1977 Name used by B & D 1977
Anthophyta Phyllospadix scouleri X C A
Anthophyta Phyllospadix torreyi U R
Chlorophyta Acrosiphonia arcta X P U
Chlorophyta Acrosiphonia coalita P P X X Spongomorpha coalita
Chlorophyta Acrosiphonia mertensii R P
Chlorophyta Blindingia minima var. minima U U
Chlorophyta Cladophora columbiana U P X Cladophora columbiana
Chlorophyta Cladophora hutchinsiae R U
Chlorophyta Codium setchellii R
Chlorophyta Ulva californica U C
Chlorophyta Ulva intestinalis R P
Chlorophyta Ulva lactuca U
Chlorophyta Ulva linza U C X Enteromorpha linza
Chlorophyta Ulva lobata U P
Chlorophyta Ulva spp X U P X X Ulva spp
Chlorophyta Ulva taeniata X P X Ulva taeniata
Phaeophyta Alaria marginata X P P X X Alaria marginata
Phaeophyta Alaria nana X Alaria nana
Phaeophyta Analipus japonicus U U X X Analipus japonicus
Phaeophyta Analipus spp U U
Phaeophyta Berkeleya spp C C
Phaeophyta Colpomenia spp U C
Phaeophyta Cystoseira osmundacea DRIFT DRIFT X X Cystoseira osmundacea
Phaeophyta Desmarestia ligulata X R X X Desmarestia ligulata
Phaeophyta Ectocarpus fasciculatus X Ectocarpus actus haplogloine
Phaeophyta Egregia menziesii X C C X X Egregia menziesii
Phaeophyta Fucus gardneri X P A X Fucus distichus
Phaeophyta Haplogloia andersonii U X X Haplogloia andersonii
Phaeophyta Hedophyllum sessile X C C X X Hedophyllum sessile
Phaeophyta Laminaria setchellii X C P X X Laminaria dentigera
Phaeophyta Laminaria sinclairii X P P X X Laminaria sinclairii
Phaeophyta Leathesia difformis X U C X Leathesia difformis/nana
Phaeophyta Lessoniopsis littoralis U R X X Lessoniopsis littoralis
Phaeophyta Nereocystis luetkeana U U X Nereocystis luetkeana
Phaeophyta Pelvetiopsis limitata X A A X X Pelvetiopsis limitata
Phaeophyta Petalonia fascia X Petalonia fascia
Phaeophyta Petrospongium rogusum X
Phaeophyta Phaeostrophion irregulare U
Phaeophyta Postelsia palmaeformis U X X Postelsia palmaeformis
Phaeophyta Pterygophora californica P X X Pterygophora californica
Phaeophyta Ralfsia spp U U X Ralfsia spp
Phaeophyta Ralfsiaceae X P P
Phaeophyta Scytosiphon lomentaria R X X Scytosiphon lomentaria

108
Phylum Current Scientific Name DMN/ SWAT
END 2005
FKC 2005
END 1977
FKC 1977 Name used by B & D 1977
Phaeophyta Soranthera ulvoidea P C X X Soranthera ulvoidea
Rhodophyta Ahnfeltia concinda X X Ahnfeltia concinda
Rhodophyta Ahnfeltia fastigiata U U X Ahnfeltia plicata
Rhodophyta Ahnfeltiopsis gigartinoides U U
Rhodophyta Ahnfeltiopsis leptophyllus U
Rhodophyta Ahnfeltiopsis linearis P U X X Gymnogongrus linearis
Rhodophyta Bossiella chiloensis X U C X Bossiella chiloensis
Rhodophyta Bossiella orbigniana dichotoma X P C X Bossiella orbigniana dichotoma
Rhodophyta Bossiella plumosa X P U X Bossiella plumose
Rhodophyta Calliarthron tuberculosum X U X Calliarthron tuberculosum
Rhodophyta Callithamnion pikeanum X P P X X Callithamnion pikeanum
Rhodophyta Callithamnion spp P P
Rhodophyta Callophyllis pinnata U U X Callophyllis peinnata
Rhodophyta Ceramium pacificum X P C
Rhodophyta Chondracanthus canaliculatus X U U
Rhodophyta Chondracanthus spinosus X U R
Rhodophyta Clathromorphum reclinatum R R X Neopolyporolithon reclinatum
Rhodophyta Constantinea simplex X P P X X Consiantinea simplex
Rhodophyta Corallina officinalis chilensis X P P X Corallina officinalis chilensis
Rhodophyta Corrallina vancouveriensis X C P X X Corrallina vancouveriensis
Rhodophyta Cryptopleura lobulifera X U P X X Cryptopleura lobelifera
Rhodophyta Cryptopleura ruprechtiana X U U X Botryoglossum farlowianum
Rhodophyta Cryptopleura violacea X U U X Cryptopleura violacea
Rhodophyta Cryptosiphonia spp P U
Rhodophyta Cryptosiphonia woodii X P U X X Cryptosiphonia woodii
Rhodophyta Dilsea californica X P P X X Dilsea californica
Rhodophyta Endocladia muricata X A C X X Endocladia muricata
Rhodophyta Erythrophyllum delesserioides U X Erythrophyllum delesserioides
Rhodophyta Farlowia mollis X P P X X Farlowia mollis
Rhodophyta Gelidium coulteri X U U
Rhodophyta Gloiopeltis furcata U U X X Gloiopeltis furcata
Rhodophyta Grateloupia doryphora X
Rhodophyta Grateloupia lanceolata U P X Prionitis lanceolata
Rhodophyta Grateloupia setchellii R X Grateloupia setchellii
Rhodophyta Halosaccion glandiforma X R U X Halosaccion glandiforme
Rhodophyta Halymenia californica X U
Rhodophyta Halymenia schizymenoides X U U
Rhodophyta Hildebrandia/Peyssonnelia spp X P P
Rhodophyta Hymenena cuneifolia X R U X Hymenena cuneifolia
Rhodophyta Hymenena flabelligera X U U X X Hymenena flabelligera
Rhodophyta Hymenena multiloba X U U X Hymenena multiloba
Rhodophyta Laurencia pacifica/masonii X
Rhodophyta Lithophyllum dispar U R X Tenarea dispar
Rhodophyta Mastocarpus jardinii X C C X X Gigartina agardhii
Rhodophyta Mastocarpus papillatus X C C X X Gigartina papillata
Rhodophyta Mastocarpus spp (sporophyte stage) X C A X Petrocelis franciscana
Rhodophyta Mazzaella flaccida X U P X X Iridaea flaccida
Rhodophyta Mazzaella oregona X P P X X Iridaea heterocarpa

109
Phylum Current Scientific Name DMN/ SWAT
END 2005
FKC 2005
END 1977
FKC 1977 Name used by B & D 1977
Rhodophyta Mazzaella splendens X P A X X Iridaea cordata
Rhodophyta Melobesia mediocris U P
Rhodophyta Membranoptera dimorpha X X Membranoptera dimorpha
Rhodophyta Microcladia borealis X C C X X Microcladia borealis
Rhodophyta Microcladia coulteri X P P
Rhodophyta Neoptilota hypnoides X U U X Neoptilota hypnoides
Rhodophyta Neorhodomela larix X C P X X Rhodomela larix
Rhodophyta Neorhodomela oregona X X X Odonthalia oregona
Rhodophyta Odonthalia floccosa X C C X X Odonthalia floccose
Rhodophyta Odonthalia lyallii X X Odonthalia lyallii
Rhodophyta Odonthalia washingtoniensis U X Odonthalia washingtoniensis
Rhodophyta Opuntiella californica U U X Opuntiella californica
Rhodophyta Osmundea spectabilis X P P X X Laurencia spectabilis
Rhodophyta Palmaria spp U U
Rhodophyta Pikea robusta X U X X Pikea robusta
Rhodophyta Plocamium oregonum P U X Plocamium oregonum
Rhodophyta Plocamium pacificum X P U X X Plocamium cartilagineum
Rhodophyta Plocamium violaceum X P U X X Plocamium violaceum
Rhodophyta Polyneura latissima U U X X Polyneura latissima
Rhodophyta Polysiphonia hendryi var. gardneri P P
Rhodophyta Polysiphonia hendryi var. hendryi P P
Rhodophyta Polysiphonia spp X P P X Polysiphonia spp
Rhodophyta Porphyra lanceolata X P C X Porphyra lanceolata
Rhodophyta Porphyra perforata X U A X X Porphyra perforate
Rhodophyta Porphyra smithii U P X Porphyra smithii
Rhodophyta Porphyropsis coccinea X Porphyropsis coccinea
Rhodophyta Prionitis filiformis U C X Prionitis filiformis
Rhodophyta Prionitis lanceolata X P P
Rhodophyta Prionitis linearis U R
Rhodophyta Prionitis lyallii X P C X X Prionitis lyallii
Rhodophyta Pterosiphonia bipinnata X U P
Rhodophyta Pterosiphonia dendroidea X U
Rhodophyta Ptilota filicina P P X X Ptilota filicina
Rhodophyta Ptilota spp X P P
Rhodophyta Schizymenia pacifica U R X X Schizymenia pacifica
Rhodophyta Schizymenia spp U R
Rhodophyta Tiffaniella snyderae X

110
Invertebrates of the Rocky Intertidal
Phylum Class Current Scientific Name DMN/ SWAT
END 2005
FKC 2005
B&D 1977 Name Used by B&D 1977
Annelida Polychaeta Ampharete spp X Ampharete spp
Annelida Polychaeta Anaitides williamsi U U X Anaitides williamsi
Annelida Polychaeta Arctonoe vittata X Arctonoe vittata
Annelida Polychaeta Armandia brevis X Armandia brevis
Annelida Polychaeta Autolytus spp X Autolytus spp
Annelida Polychaeta Boccardia proboscidea X Boccardia proboscidea
Annelida Polychaeta Branchiomaldane vincentii X Branchiomaldane vincentii
Annelida Polychaeta Chaetopterus variopedatus R R
Annelida Polychaeta Chone ecaudata X Chone ecaudata
Annelida Polychaeta Dodecaceria fewkesi R R
Annelida Polychaeta Eudistylia vancourveri P R
Annelida Polychaeta Eulalia aviculiseta X Eulalia aviculiseta
Annelida Polychaeta Eupolymnia crescentis X Eupolymnia crescentis
Annelida Polychaeta Exogone lourei X Exogone lourei
Annelida Polychaeta Fabricia spp X Fabricia spp
Annelida Polychaeta Glycera spp R R
Annelida Polychaeta Glycinde polygnatha X Glycinde polygnatha
Annelida Polychaeta Halosydna brevisetosa P P X Halosydna brevisetosa
Annelida Polychaeta Harmothoe imbricata X Harmothoe imbricate
Annelida Polychaeta Lumbrineris spp X Lumbrineris spp
Annelida Polychaeta Naineris dendritica X Naineris dendritica
Annelida Polychaeta Neanthes spp U U X Neanthes succinea
Annelida Polychaeta Neoamphitrite robusta X Neoamphitrite robusta
Annelida Polychaeta Nereida spp P P
Annelida Polychaeta Nereis spp X Nereis spp
Annelida Polychaeta Nereis vexillosa X Nereis vexillosa
Annelida Polychaeta Nothria elegans X Nothria elegans
Annelida Polychaeta Paleanotus bellis X Paleanotus bellis
Annelida Polychaeta Pista elongata X U U
Annelida Polychaeta Platynereis bicanaliculata R U X Platynereis bicanaliculata
Annelida Polychaeta Polydora giardi X Polydora giardi
Annelida Polychaeta Polydora socialis X Polydora socialis
Annelida Polychaeta Polydora spp X Polydora spp
Annelida Polychaeta Potomilla occelata R U
Annelida Polychaeta Pseudopotamilla spp X Pseudopotamilla spp
Annelida Polychaeta Rhyncospio arenicola X Rhyncospio arenicola
Annelida Polychaeta Schistocomus hiltoni X Schistocomus hiltoni
Annelida Polychaeta Schizobranchia insignis X Schizobranchia insignis
Annelida Polychaeta Serpula columbiana U U X Serpula vermicularis
Annelida Polychaeta Sphaerosyllis spp X Sphaerosyllis spp
Annelida Polychaeta Spiochaetopterus costarum U R
Annelida Polychaeta Spiophanes spp X Spiophanes spp
Annelida Polychaeta Sthenelais fusca X Sthenelais fusca
Annelida Polychaeta Syllis elongata X Syllis elongata
Annelida Polychaeta Typosyllis alternata R X Typosyllis alternate

111
Phylum Class Current Scientific Name DMN/ SWAT
END 2005
FKC 2005
B&D 1977 Name Used by B&D 1977
Arthropoda Arachnida Achelia nudusclia R R
Arthropoda Crustacea Balanus balanus pugetensis X Balanus balanus pugetensis
Arthropoda Crustacea Balanus crenatus U U X Balanus crenatus
Arthropoda Crustacea Balanus glandula X A A X Balanus glandula
Arthropoda Crustacea Balanus nubilus U U X Balanus nubilus
Arthropoda Crustacea Cancer antennarius U U X Cancer antennarius
Arthropoda Crustacea Cancer jordani U U X Cancer jordani
Arthropoda Crustacea Cancer magister P P X Cancer magister
Arthropoda Crustacea Cancer oregonensis X U U
Arthropoda Crustacea Cancer productus P P X Cancer productus
Arthropoda Crustacea Caprella californica C C
Arthropoda Crustacea Chthamalus dalli X C C X Chthamalus dalli
Arthropoda Crustacea Cirolana spp X P P
Arthropoda Crustacea Cryptolithodes sitchensis X Cryptolithodes sitchensis
Arthropoda Crustacea Cymadusa umcinta A A
Arthropoda Crustacea Dynamenella sheareri P P
Arthropoda Crustacea Gnorimosphaeroma oregonensis X Gnorimosphaeroma oregonensis
Arthropoda Crustacea Hapalogaster mertensii X Hapalogaster mertensii
Arthropoda Crustacea Hemigrapsus nudus C C X Hemigrapsus nudus
Arthropoda Crustacea Hemigrapsus oregonensis P P X Hemigrapsus oregonensis
Arthropoda Crustacea Heptocarpus spp A A
Arthropoda Crustacea Hymenodora frontalis C C
Arthropoda Crustacea Idotea fewkesi C C
Arthropoda Crustacea Idotea kirchanskii U U
Arthropoda Crustacea Idotea schmitti P P
Arthropoda Crustacea Idotea spp X
Arthropoda Crustacea Idotea wosnesenskii P P
Arthropoda Crustacea Ligia occidentalis C A
Arthropoda Crustacea Megabalanus californicus P P
Arthropoda Crustacea Oedignathus inermis P P
Arthropoda Crustacea Pachycheles rudis P P
Arthropoda Crustacea Pachygrapsus crassipes X P P
Arthropoda Crustacea Pagurus granosimanus P P X Pagurus granosimanus
Arthropoda Crustacea Pagurus hirsutiusculus X C C X Pagurus hirsutiusculus
Arthropoda Crustacea Pagurus samuelis X U U X Pagurus samuelis
Arthropoda Crustacea Parallorchestes ochotensis C A X Parallorchestes ochotensis
Arthropoda Crustacea Petrolisthes cinctipes P C X Petrolisthes cinctipes
Arthropoda Crustacea Petrolisthes manimculis P P
Arthropoda Crustacea Pollicipes polymerus X C C X Pollicipes polymerus
Arthropoda Crustacea Pugettia producta X P C X Pugettia producta
Arthropoda Crustacea Pugettia richii X Pugettia richii
Arthropoda Crustacea Scyra acutifrons X Scyra acutifrons
Arthropoda Crustacea Semibalanus cariosus X P C X Balanus cariosus
Arthropoda Crustacea Synidotea laticauda C C
Brachipoda Inarticulata Terebratalia transversa R X Terebratalia transversa
Bryozoa Gymnolaemata Bicrisia edwardsiana X Bicrisia edwardsiana

112
Phylum Class Current Scientific Name DMN/ SWAT
END 2005
FKC 2005
B&D 1977 Name Used by B&D 1977
Bryozoa Gymnolaemata Bugula californica X C C X Bugula californica
Bryozoa Gymnolaemata Crisia occidentalis X Crisia occidentalis
Bryozoa Gymnolaemata Eurystomella bilabiata P P
Bryozoa Gymnolaemata Filicrisia franciscana X Filicrisia franciscana
Bryozoa Gymnolaemata Flustrellidra corniculata C C X Flustrellidra corniculata
Bryozoa Gymnolaemata Membranipora spp X
Chordata Tunicata Aplidium californicum C A
Chordata Tunicata Aplidium solidum C P
Chordata Tunicata Aplidium spp. C P
Chordata Tunicata Archidistoma ritteri P C
Chordata Tunicata Chelysoma columbium C P
Chordata Tunicata Clavelina huntsmani C C
Chordata Tunicata Ritterella spp P A
Chordata Tunicata Ritterella spp C A
Chordata Tunicata Styela montereyensis X P C X Styela montereyensis
Cnidaria Anthozoa Anthopleura artemisia P P X Anthopleura Artemisia
Cnidaria Anthozoa Anthopleura elegantissima X A A X Anthopleura elegantissima
Cnidaria Anthozoa Anthopleura sola X
Cnidaria Anthozoa Anthopleura xanthogrammica X A A X Anthopleura xanthogrammica
Cnidaria Anthozoa Balanophyllia elegans R R X Balanophyllia elegans
Cnidaria Anthozoa Epiactis prolifera U U X Epiactis prolifera
Cnidaria Anthozoa Tealia coriacea U U X Tealia coriacea
Cnidaria Anthozoa Tealia crassicornis U U X Tealia crassicornis
Cnidaria Hydrozoa Abietinaria spp P P X Abietinaria spp
Cnidaria Hydrozoa Aglaophenia latirostris P P X Aglaophenia sp
Cnidaria Hydrozoa Dynanmena operculata C C
Cnidaria Hydrozoa Ectopleura marina P P X Tubularia marina
Cnidaria Hydrozoa Ectopleura spp X Tubularia spp
Cnidaria Hydrozoa Eudendrium californicum X Eudendrium californicum
Cnidaria Hydrozoa Garveia annulata P P X Garveia annulata
Cnidaria Hydrozoa Obelia dichotoma C C X Obelia geniculata
Cnidaria Hydrozoa Plumularia spp P P
Cnidaria Hydrozoa Sertularella turgidus C C
Cnidaria Hydrozoa Sertularia furcata C P
Cnidaria Hydrozoa Thuiaria spp U U
Echinodermata Asteroidea Patiria mminiata X U U
Echinodermata Asteroidea Dermasterias imbricata X P C X Dermasterias imbricate
Echinodermata Asteroidea Evasterias troschelii P P X Evasterias troschelii
Echinodermata Asteroidea Henricia leviuscula X P P X Henricia leviuscula
Echinodermata Asteroidea Henricia sanguinolenta P P
Echinodermata Asteroidea Leptasterias hexactis X C C X Leptasterias hexactis
Echinodermata Asteroidea Leptasterias pusilla X Leptasterias pusilla
Echinodermata Asteroidea Pisaster ochraceus A A X Pisaster ochraceus
Echinodermata Asteroidea Pycnopodia helianthoides X C C X Pycnopodia helianthoides
Echinodermata Asteroidea Solaster stimpsoni P U X Solaster stimpsoni
Echinodermata Echinoidea Strongylocentrotus purpuratus P C X Strongylocentrotus purpuratus
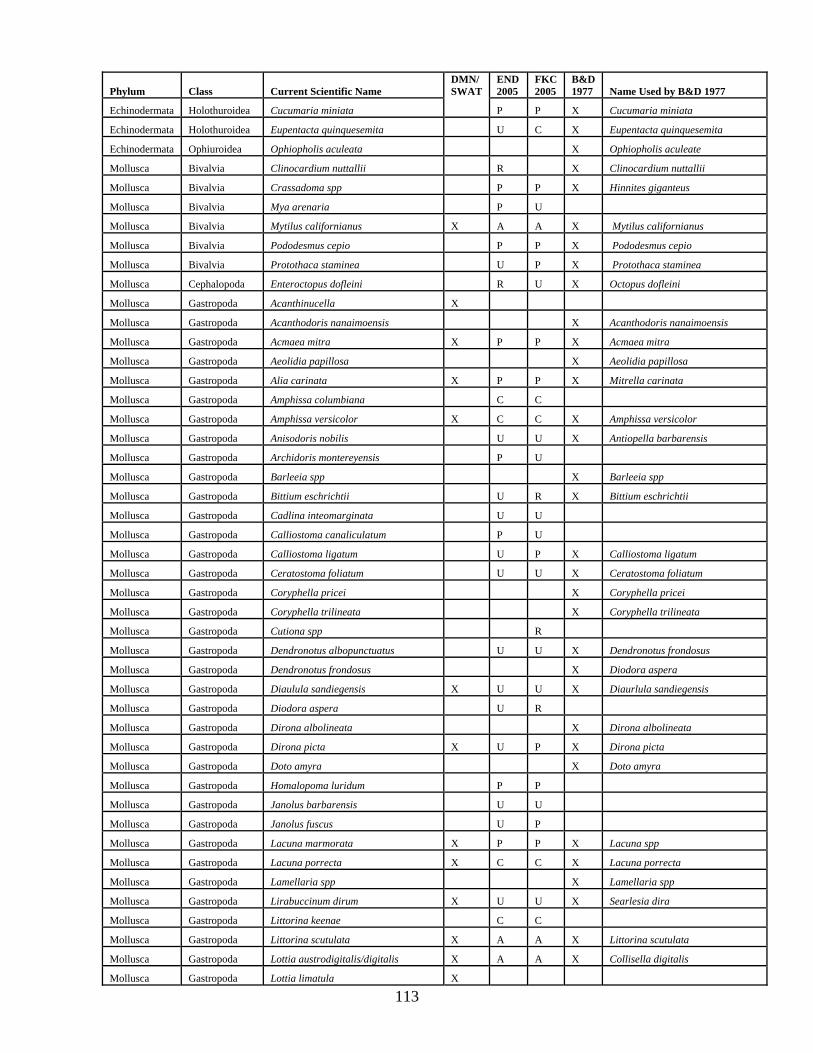
113
Phylum Class Current Scientific Name DMN/ SWAT
END 2005
FKC 2005
B&D 1977 Name Used by B&D 1977
Echinodermata Holothuroidea Cucumaria miniata P P X Cucumaria miniata
Echinodermata Holothuroidea Eupentacta quinquesemita U C X Eupentacta quinquesemita
Echinodermata Ophiuroidea Ophiopholis aculeata X Ophiopholis aculeate
Mollusca Bivalvia Clinocardium nuttallii R X Clinocardium nuttallii
Mollusca Bivalvia Crassadoma spp P P X Hinnites giganteus
Mollusca Bivalvia Mya arenaria P U
Mollusca Bivalvia Mytilus californianus X A A X Mytilus californianus
Mollusca Bivalvia Pododesmus cepio P P X Pododesmus cepio
Mollusca Bivalvia Protothaca staminea U P X Protothaca staminea
Mollusca Cephalopoda Enteroctopus dofleini R U X Octopus dofleini
Mollusca Gastropoda Acanthinucella X
Mollusca Gastropoda Acanthodoris nanaimoensis X Acanthodoris nanaimoensis
Mollusca Gastropoda Acmaea mitra X P P X Acmaea mitra
Mollusca Gastropoda Aeolidia papillosa X Aeolidia papillosa
Mollusca Gastropoda Alia carinata X P P X Mitrella carinata
Mollusca Gastropoda Amphissa columbiana C C
Mollusca Gastropoda Amphissa versicolor X C C X Amphissa versicolor
Mollusca Gastropoda Anisodoris nobilis U U X Antiopella barbarensis
Mollusca Gastropoda Archidoris montereyensis P U
Mollusca Gastropoda Barleeia spp X Barleeia spp
Mollusca Gastropoda Bittium eschrichtii U R X Bittium eschrichtii
Mollusca Gastropoda Cadlina inteomarginata U U
Mollusca Gastropoda Calliostoma canaliculatum P U
Mollusca Gastropoda Calliostoma ligatum U P X Calliostoma ligatum
Mollusca Gastropoda Ceratostoma foliatum U U X Ceratostoma foliatum
Mollusca Gastropoda Coryphella pricei X Coryphella pricei
Mollusca Gastropoda Coryphella trilineata X Coryphella trilineata
Mollusca Gastropoda Cutiona spp R
Mollusca Gastropoda Dendronotus albopunctuatus U U X Dendronotus frondosus
Mollusca Gastropoda Dendronotus frondosus X Diodora aspera
Mollusca Gastropoda Diaulula sandiegensis X U U X Diaurlula sandiegensis
Mollusca Gastropoda Diodora aspera U R
Mollusca Gastropoda Dirona albolineata X Dirona albolineata
Mollusca Gastropoda Dirona picta X U P X Dirona picta
Mollusca Gastropoda Doto amyra X Doto amyra
Mollusca Gastropoda Homalopoma luridum P P
Mollusca Gastropoda Janolus barbarensis U U
Mollusca Gastropoda Janolus fuscus U P
Mollusca Gastropoda Lacuna marmorata X P P X Lacuna spp
Mollusca Gastropoda Lacuna porrecta X C C X Lacuna porrecta
Mollusca Gastropoda Lamellaria spp X Lamellaria spp
Mollusca Gastropoda Lirabuccinum dirum X U U X Searlesia dira
Mollusca Gastropoda Littorina keenae C C
Mollusca Gastropoda Littorina scutulata X A A X Littorina scutulata
Mollusca Gastropoda Lottia austrodigitalis/digitalis X A A X Collisella digitalis
Mollusca Gastropoda Lottia limatula X
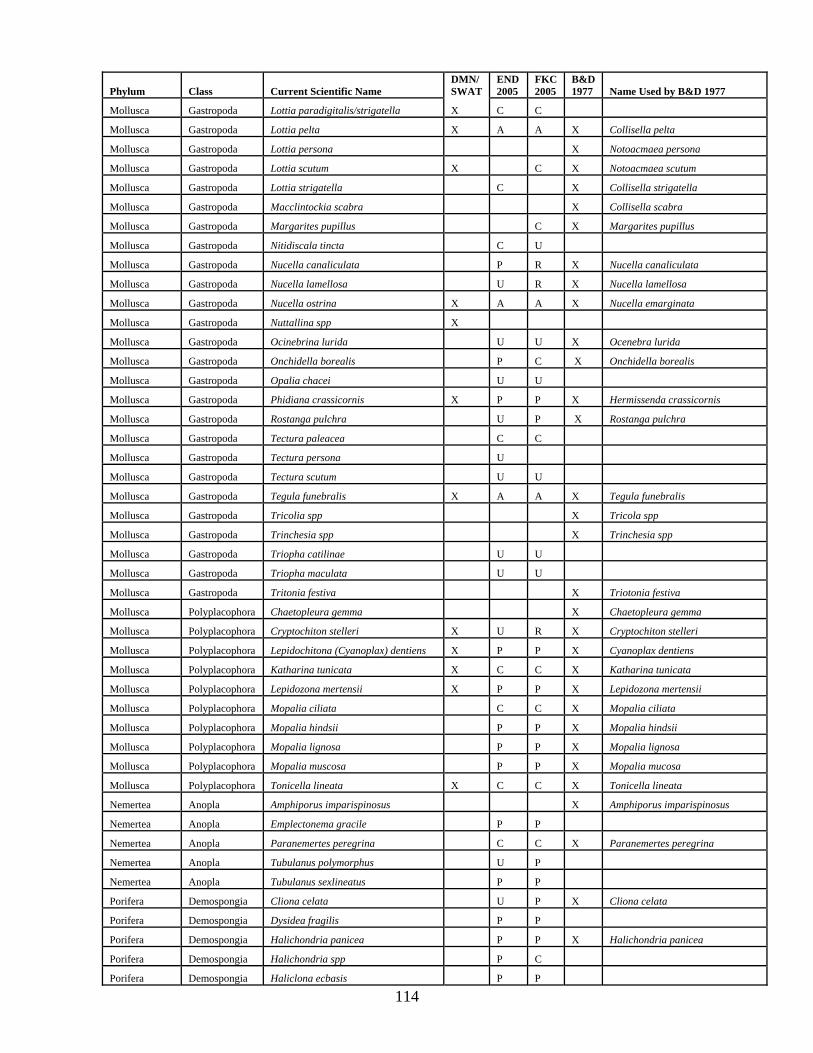
114
Phylum Class Current Scientific Name DMN/ SWAT
END 2005
FKC 2005
B&D 1977 Name Used by B&D 1977
Mollusca Gastropoda Lottia paradigitalis/strigatella X C C
Mollusca Gastropoda Lottia pelta X A A X Collisella pelta
Mollusca Gastropoda Lottia persona X Notoacmaea persona
Mollusca Gastropoda Lottia scutum X C X Notoacmaea scutum
Mollusca Gastropoda Lottia strigatella C X Collisella strigatella
Mollusca Gastropoda Macclintockia scabra X Collisella scabra
Mollusca Gastropoda Margarites pupillus C X Margarites pupillus
Mollusca Gastropoda Nitidiscala tincta C U
Mollusca Gastropoda Nucella canaliculata P R X Nucella canaliculata
Mollusca Gastropoda Nucella lamellosa U R X Nucella lamellosa
Mollusca Gastropoda Nucella ostrina X A A X Nucella emarginata
Mollusca Gastropoda Nuttallina spp X
Mollusca Gastropoda Ocinebrina lurida U U X Ocenebra lurida
Mollusca Gastropoda Onchidella borealis P C X Onchidella borealis
Mollusca Gastropoda Opalia chacei U U
Mollusca Gastropoda Phidiana crassicornis X P P X Hermissenda crassicornis
Mollusca Gastropoda Rostanga pulchra U P X Rostanga pulchra
Mollusca Gastropoda Tectura paleacea C C
Mollusca Gastropoda Tectura persona U
Mollusca Gastropoda Tectura scutum U U
Mollusca Gastropoda Tegula funebralis X A A X Tegula funebralis
Mollusca Gastropoda Tricolia spp X Tricola spp
Mollusca Gastropoda Trinchesia spp X Trinchesia spp
Mollusca Gastropoda Triopha catilinae U U
Mollusca Gastropoda Triopha maculata U U
Mollusca Gastropoda Tritonia festiva X Triotonia festiva
Mollusca Polyplacophora Chaetopleura gemma X Chaetopleura gemma
Mollusca Polyplacophora Cryptochiton stelleri X U R X Cryptochiton stelleri
Mollusca Polyplacophora Lepidochitona (Cyanoplax) dentiens X P P X Cyanoplax dentiens
Mollusca Polyplacophora Katharina tunicata X C C X Katharina tunicata
Mollusca Polyplacophora Lepidozona mertensii X P P X Lepidozona mertensii
Mollusca Polyplacophora Mopalia ciliata C C X Mopalia ciliata
Mollusca Polyplacophora Mopalia hindsii P P X Mopalia hindsii
Mollusca Polyplacophora Mopalia lignosa P P X Mopalia lignosa
Mollusca Polyplacophora Mopalia muscosa P P X Mopalia mucosa
Mollusca Polyplacophora Tonicella lineata X C C X Tonicella lineata
Nemertea Anopla Amphiporus imparispinosus X Amphiporus imparispinosus
Nemertea Anopla Emplectonema gracile P P
Nemertea Anopla Paranemertes peregrina C C X Paranemertes peregrina
Nemertea Anopla Tubulanus polymorphus U P
Nemertea Anopla Tubulanus sexlineatus P P
Porifera Demospongia Cliona celata U P X Cliona celata
Porifera Demospongia Dysidea fragilis P P
Porifera Demospongia Halichondria panicea P P X Halichondria panicea
Porifera Demospongia Halichondria spp P C
Porifera Demospongia Haliclona ecbasis P P

115
Phylum Class Current Scientific Name DMN/ SWAT
END 2005
FKC 2005
B&D 1977 Name Used by B&D 1977
Porifera Demospongia Haliclona permollis P P
Porifera Demospongia Haliclona spp U C X
Porifera Demospongia Hymendectyon lyoni X Hymendectyon lyoni
Porifera Demospongia Hymeniacidon ungodon X Hymeniacidon ungodon
Porifera Demospongia Mycale macginitiei P C X Mycale macginitiei
Porifera Demospongia Mycale richardsoni X Mycale richardsoni
Porifera Demospongia Neoesperiopsis digitata C C
Porifera Demospongia Ophlitaspongia pennata U P X Ophlitaspongia pennata
Porifera Demospongia Pachychalina lunisimilis X Pachychalina lunisimilis
Porifera Demospongia Reniera spp X Reniera spp
Porifera Demospongia Sigmadocia spp X Sigmadocia spp
Porifera Demospongia Suberites spp C C X Suberites spp
Sipuncula Phascolosoma agassizii U U
Sipuncula Themiste pyroides P C X Themiste pyroides
A = Abundant, C = Common, P = Present, U = Uncommon, R = Rare M. J. Boyd and J. D. DeMartini, 1977. The Intertidal and Subtidal Biota of Redwood National Park. Submitted in fulfillment of U. S. Department of the Interior, National Park Service Contract No. CX8480 - 4 -0665. 162 p. M. J. Boyd and J. D. DeMartini, 1981. Reconnaissane Survey of Redwood Natl. Park Area of Special Biological Significance. Calif. Fish Game Report. 121 p.

116
APPENDIX D: SITE INFORMATION False Klamath Cove
GPS Coordinates
Up-coast site boundary: N 41.59377, W 124.10773
Site center: N 41.59476, W 124.10643
Down-coast site boundary: N 41.59526, W 124.10513
Photo courtesy of Redwood National Park
Barnacle Plots 1-5
Mussel Plots 1-4
Mussel Plot 5
Fucus Plots 1-5 Endocladia Plots 1-3
Pelvetiopsis Plots 3-5
Pelvetiopsis Plots 1-2
Endocladia Plot 4-5
False Klamath Cove Site Overview
Pisaster Plots 1-3

117
False Klamath Cove Barnacles Plots
From To Distance (m) Bearing (degrees)B1 B2 12.1 21 NEB2 B3 4.8 272 NWB3 B4 9.3 314 NWB3 B5 9.8 306 NWB4 B5 1.1 330 NW
B1
B2 B3
B3
B4 & 5
B4 & 5

118
False Klamath Cove Endocladia Plots
From To Distance (m) Bearing (degrees)E1 E2 0.9 329 NWE2 E3 1.9 339 NWE3 E4 43.9 12 NNEE3 E5 49.6 4 NNEE4 E5 13.8 55 NEE1 M5 32.7 280 NW
E1 & 2
E2 & 3
E4
E5

119
False Klamath Cove Fucus Plots
From To Distance (m) Bearing (degrees)F1 F2 1.2 249 WSWF2 F3 1.5 350 NWF3 F4 1.0 260 WF4 F5 0.8 340 NWF1 M3 21.3 200 SWF1 P2 4.8 210 SW
False Klamath Cove Fucus Plots
F1
F2 F3
F4 F5

120
False Klamath Cove Mussel Plots
From To Distance (m) Bearing (degrees) M1 M2 2.9 300 NW M2 M3 17.6 305 NW M3 M4 1.1 315 NW M4 M5 42.7 305 NW
M2
M1
M3 M4
M5

121
False Klamath Cove Pelvetiopsis Plots
From To Distance (m) Bearing (degrees) P1 P2 4.7 304 NW P2 P3 47.5 310 NW P3 P4 9.3 330 NW P4 P5 1.1 15 NE
P1
P2 P3
P4 P5
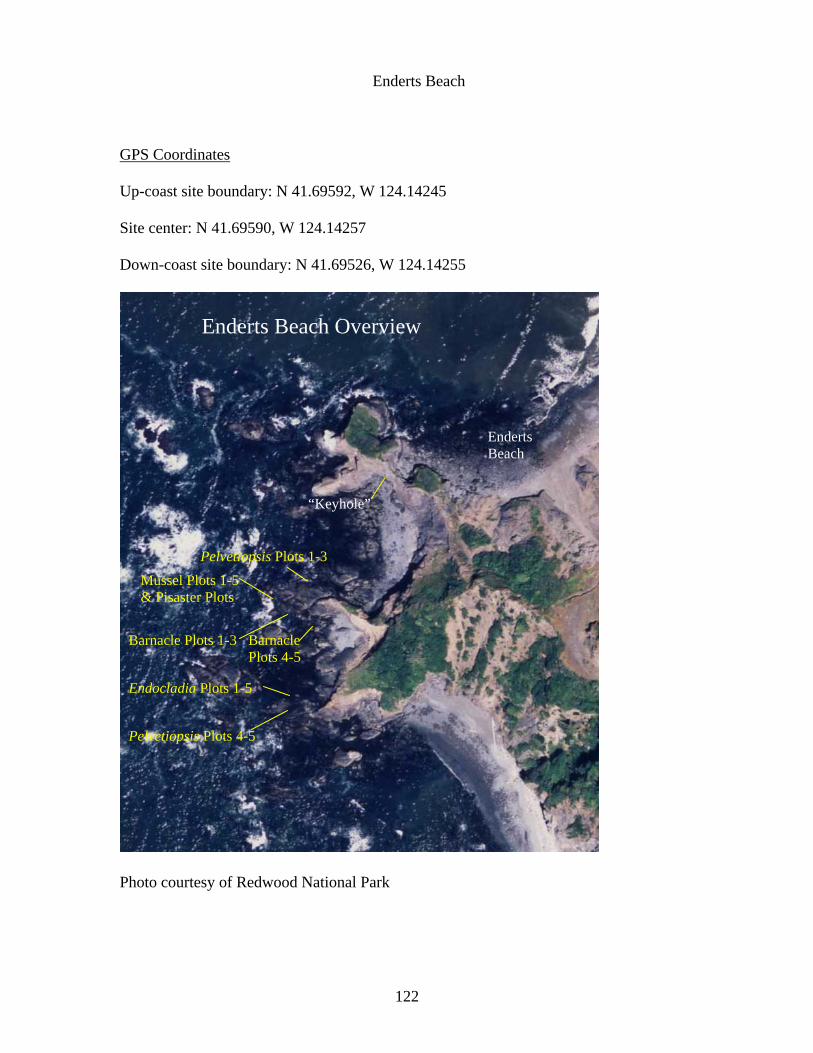
122
Enderts Beach
GPS Coordinates
Up-coast site boundary: N 41.69592, W 124.14245
Site center: N 41.69590, W 124.14257
Down-coast site boundary: N 41.69526, W 124.14255
Photo courtesy of Redwood National Park
“Keyhole”
Pelvetiopsis Plots 1-3 Mussel Plots 1-5 & Pisaster Plots
Barnacle Plots 1-3 Barnacle Plots 4-5
Enderts Beach
Endocladia Plots 1-5
Pelvetiopsis Plots 4-5
Enderts Beach Overview
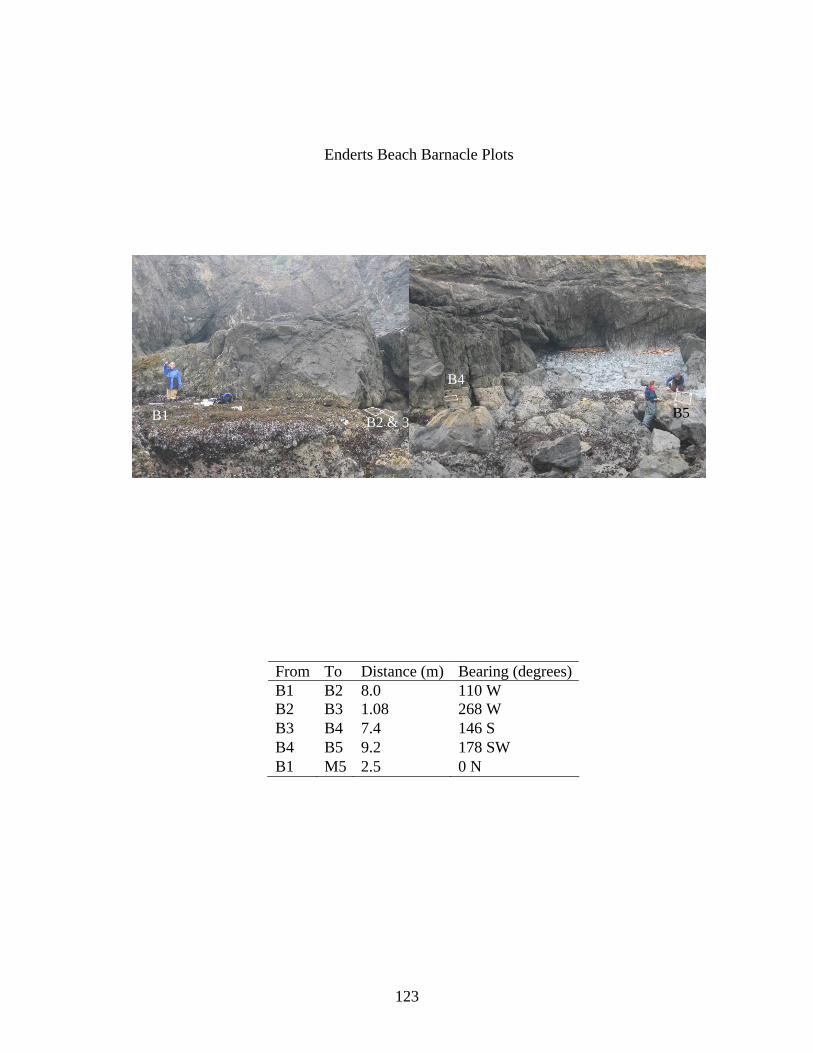
123
Enderts Beach Barnacle Plots
From To Distance (m) Bearing (degrees) B1 B2 8.0 110 W B2 B3 1.08 268 W B3 B4 7.4 146 S B4 B5 9.2 178 SW B1 M5 2.5 0 N
B1 B2 & 3
B4
B5

124
Enderts Beach Endocladia Plots
From To Distance (m) Bearing (degrees)E1 E2 2.8 144 SEE2 E3 6.6 138 SEE3 E4 7.4 327 NWE4 E5 5.9 154 SEE3 P4 18.6 164 SE
E1
E2 E3
E2 E3
E5 E4

125
Enderts Beach Mussel Plots
From To Distance (m) Bearing (degrees) M1 M2 2.9 50 NEM2 M3 1.5 30 NEM3 M4 1.4 60 NEM4 M5 2.8 100 SE
M5
M4
M3
M2
M1

126
Enderts Beach Pelvetiopsis Plots
From To Distance (m) Bearing (degrees)P1 P2 5.0 80 EP2 P3 2.2 92 EP4 P5 6.9 118 EP1 B1 8.6 224 SW
P1 P2 P3
P4
P5

127
Damnation Creek
GPS Coordinates
Up-coast site boundary: N 41.65301, W 124.12907
Site center: N 41.65249, W 124.12784
Down-coast site boundary: N 41.65168, W 124.12696
Photo courtesy of Redwood National Park
Damnation Creek Beach Overview
Mussel Plots 1-5 & Pisaster Plot 1
Freshwater Mussel Plots 1-5
Damnation Creek Trail Fucus Plots 1-2
Fucus Plots 3-5
Endocladia Plots 1-3
Barnacle Plots 1-3
Endocladia Plots 4-5
Barnacle Plots 4-5
Pisaster Plots 2-3
Surfgrass Transects

128
Damnation Creek Barnacle Plots
From To Distance (m) Bearing (degrees)B1 B2 1.2 98 SEB2 B3 1.3 32 NEB3 B4 17.4 108 SEB4 B5 7.3 200 SW
B1B2
B3
B5 B4

129
Damnation Creek Endocladia Plots
From To Distance (m) Bearing (degrees)E1 E2 5.5 140 SEE2 E3 3.8 215 SWE3 E4 42.6 118 SEE4 E5 6.4 42 NEE4 B5 17.5 120 SE
E1 E2 E3
E5
E4

130
Damnation Creek Fucus Plots
From To Distance (m) Bearing (degrees) F1 F2 1.7 91 NEF2 F3 27.5 125 SEF3 F4 2.8 30 NEF4 F5 1.9 180 SF1 M1 111.0 280 NW
F3
F4F5
F1 F2

131
Damnation Creek Mussel Plots
From To Distance (m) Bearing (degrees) M1 M2 1.3 232 SW M2 M3 1.2 233 SW M3 M4 2.1 245 W M4 M5 1.7 0 N
M4 M3
M2 M5
M1

132
Damnation Creek Mussel Plots (near creek outflow)
From To Distance (m) Bearing (degrees) MFW1 MFW2 6.2 30 NEMFW2 MFW3 7.9 180 SMFW3 MFW4 3.7 80 NEMFW4 MFW5 9.1 230 SWMFW1 F5 8.3 90 E
Mf5
Mf4 Mf3 Mf 1
Mf2

133
APPENDIX E: RAW INTERTIDAL MONITORING DATA Percent Cover Data:
Barnacles
Barnacles Rock Non-Coralline Crust Endocladia Porphyra
Date mean % std. dev. mean % std. dev. mean % std. dev. mean % std. dev. mean % std. dev.
DMN Jun-2004 63.2 18.39021 15.6 10.50238 0.8 1.303841 5 3.807887 9.8 15.00667
DMN Aug-2004 48.8 16.14621 24.6 14.01071 0.2 0.447214 6.2 4.494441 12 16.83746
DMN Oct-2004 39.2 17.36951 47 14.12445 2.6 3.781534 4 1 3.2 5.215362
DMN Jan-2005 30.4 21.73246 62.8 25.24282 1.4 2.19089 1.6 2.073644 0 0
DMN Apr-2005 35.6 15.46932 51.2 23.66854 2.2 1.923538 3.8 2.774887 0 0
DMN Jun-2005 30 14.71394 56 25.7779 1.6 1.516575 5 5.147815 1.6 2.50998
DMN Nov-2005 32.2 9.257429 44.8 15.25451 5.8 4.549725 8.8 9.884331 0.4 0.547723
END Jun-2004 41.4 18.67619 38.8 29.02068 4.2 6.26099 0.6 1.341641 2.2 4.91935
END Aug-2004 45.4 14.53616 37.2 16.05304 3.4 4.722288 1 1.732051 1 1.732051
END Oct-2004 63 11.59741 18 6.745369 2.8 4.086563 1.8 2.48998 0.4 0.894427
END Jan-2005 54.8 14.4118 27 6.928203 3.8 4.494441 4.6 5.727129 0.2 0.447214
END Apr-2005 53.4 22.78815 20.2 7.259477 2.2 1.923538 3.8 4.381781 1.8 2.683282
END Jun-2005 47.8 19.46022 14 5.91608 4.4 3.209361 4.4 4.97996 10.8 9.731393
END Nov-2005 32.6 21.6864 27.6 10.01499 7.8 9.95992 6.8 9.833616 2.6 3.781534
FKC Jun-2004 32.4 32.41605 64 30.35622
FKC Aug-2004 21.8 10.35374 73.4 9.633276
FKC Oct-2004 85.4 3.04959 10.2 5.403702
FKC Jan-2005 91.2 3.898718 5.6 3.577709
FKC Apr-2005 80.8 5.890671 15.6 6.14817
FKC Jun-2005 30.2 16.39207 64.8 17.51285
FKC Nov-2005 52 14.86607 36.2 22.28677

134
Endocladia
Fucus Non-Coralline Crust Endocladia Rock
Date mean % std. dev. mean % std. dev. mean % std. dev. mean % std. dev.
DMN Jun-2004 0 0 2.4 1.81659 84 4.582576 10 4.636809
DMN Aug-2004 0 0 2.2 2.949576 69 7.681146 24.6 9.838699
DMN Oct-2004 0.2 0.447214 4.6 3.781534 47 12.38951 39.8 12.41773
DMN Jan-2005 0.4 0.547723 9.6 14.01071 33 18.23458 54 19
DMN Apr-2005 0.6 0.894427 9.4 15.05988 39.2 26.53677 46.8 23.56268
DMN Jun-2005 1.4 2.19089 2 3.464102 52 27.70379 38.8 21.99318
DMN Nov-2005 10 11.46735 3 4 63.8 21.85635 17 6.041523
END Aug-2004 2.2 2.48998 86 9.77241 12.6 5.59464
END Oct-2004 12.4 7.893035 80.2 9.757049 15.4 2.607681
END Jan-2005 8.8 6.418723 51.8 11.41052 33.6 6.76757
END Apr-2005 3.2 3.114482 71.8 11.81948 18.2 10.18332
END Jun-2005 0.8 0.83666 64.8 13.60882 7 3.674235
END Nov-2005 11.6 8.961027 42.2 18.30847 11.4 4.774935
END Jun-2004 0.2 0.447214 58.4 10.71448 7.4 3.974921
FKC Jun-2004 8 7.483315 69.6 14.75805 16.8 13.98928
FKC Aug-2004 5.6 6.024948 62 5.385165 28.4 8.142481
FKC Oct-2004 3.8 3.114482 60 14.50862 24 8.3666
FKC Jan-2005 1.6 2.607681 64 18.98684 29.2 15.8019
FKC Apr-2005 2 2.54951 81.8 9.523655 10.8 3.563706
FKC Jun-2005 4.6 6.387488 71.8 13.27403 14.2 4.764452
FKC Nov-2005 12.4 15.66206 62.8 15.02332 15.8 7.661592
Fucus Fucus Endocladia Rock Non-Coralline Crust
Date mean % std. dev. mean % std. dev. mean % std. dev. mean % std. dev.
DMN Jun-2004 96.4 2.408319 0.4 0.894427 2.4 2.302173
DMN Aug-2004 85.6 6.580274 0.6 1.341641 12.2 5.357238
DMN Oct-2004 77 10.48809 3.6 8.049845 17.4 11.39298
DMN Jan-2005 66.4 19.34683 2.8 5.215362 28.4 19.03418
DMN Apr-2005 68 12.64911 4 8.396428 21.6 10.47855
DMN Jun-2005 71 19.18333 5.2 8.899438 14.2 10.70981
DMN Nov-2005 81.4 15.69395 5.6 12.52198 7.4 3.130495
FKC Jun-2004 89 6.324555 3 3.316625 3 3.535534
FKC Aug-2004 90.4 3.507136 2.8 1.923538 3.4 3.507136
FKC Oct-2004 88.4 5.85662 3.4 4.393177 4.6 3.911521
FKC Jan-2005 83.4 7.829432 4.8 5.44977 8.2 6.978539
FKC Apr-2005 80.4 8.264381 5 5.385165 9.6 7.829432
FKC Jun-2005 76.4 9.09945 8.8 7.52994 8.4 3.911521
FKC Nov-2005 48 6.123724 9.8 9.731393 28.8 13.93557
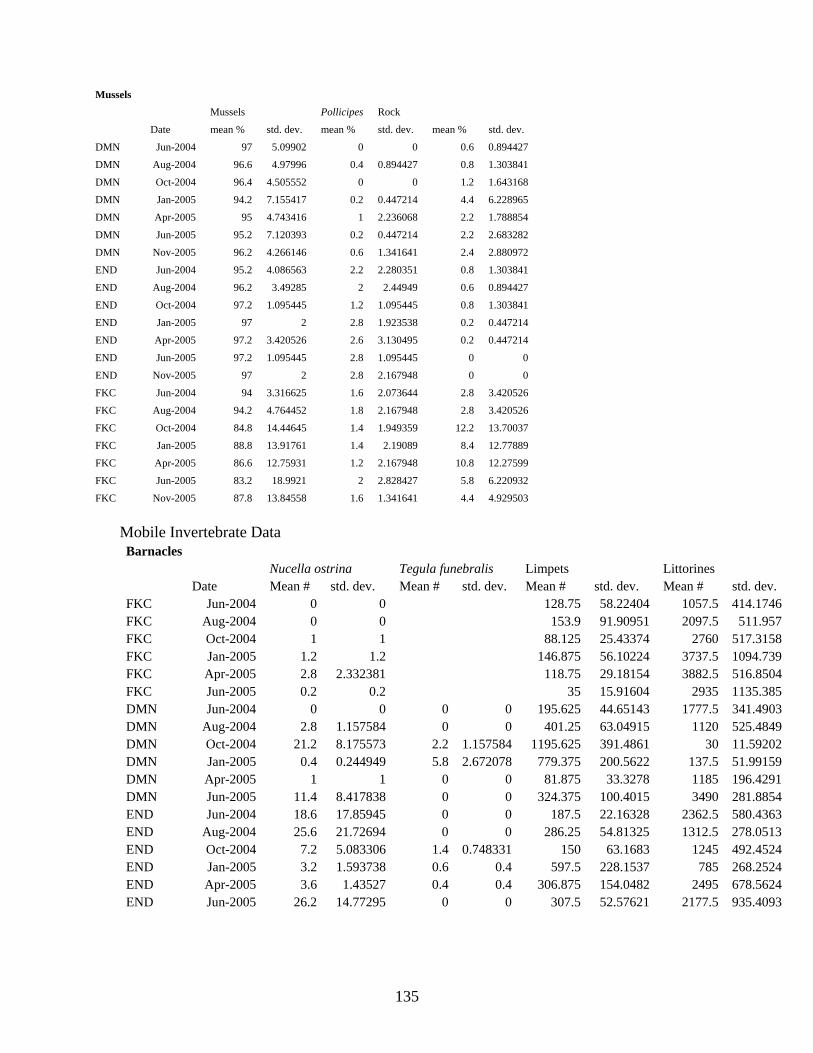
135
Mobile Invertebrate Data Barnacles Nucella ostrina Tegula funebralis Limpets Littorines Date Mean # std. dev. Mean # std. dev. Mean # std. dev. Mean # std. dev. FKC Jun-2004 0 0 128.75 58.22404 1057.5 414.1746FKC Aug-2004 0 0 153.9 91.90951 2097.5 511.957FKC Oct-2004 1 1 88.125 25.43374 2760 517.3158FKC Jan-2005 1.2 1.2 146.875 56.10224 3737.5 1094.739FKC Apr-2005 2.8 2.332381 118.75 29.18154 3882.5 516.8504FKC Jun-2005 0.2 0.2 35 15.91604 2935 1135.385DMN Jun-2004 0 0 0 0 195.625 44.65143 1777.5 341.4903DMN Aug-2004 2.8 1.157584 0 0 401.25 63.04915 1120 525.4849DMN Oct-2004 21.2 8.175573 2.2 1.157584 1195.625 391.4861 30 11.59202DMN Jan-2005 0.4 0.244949 5.8 2.672078 779.375 200.5622 137.5 51.99159DMN Apr-2005 1 1 0 0 81.875 33.3278 1185 196.4291DMN Jun-2005 11.4 8.417838 0 0 324.375 100.4015 3490 281.8854END Jun-2004 18.6 17.85945 0 0 187.5 22.16328 2362.5 580.4363END Aug-2004 25.6 21.72694 0 0 286.25 54.81325 1312.5 278.0513END Oct-2004 7.2 5.083306 1.4 0.748331 150 63.1683 1245 492.4524END Jan-2005 3.2 1.593738 0.6 0.4 597.5 228.1537 785 268.2524END Apr-2005 3.6 1.43527 0.4 0.4 306.875 154.0482 2495 678.5624END Jun-2005 26.2 14.77295 0 0 307.5 52.57621 2177.5 935.4093
Mussels
Mussels Pollicipes Rock
Date mean % std. dev. mean % std. dev. mean % std. dev.
DMN Jun-2004 97 5.09902 0 0 0.6 0.894427
DMN Aug-2004 96.6 4.97996 0.4 0.894427 0.8 1.303841
DMN Oct-2004 96.4 4.505552 0 0 1.2 1.643168
DMN Jan-2005 94.2 7.155417 0.2 0.447214 4.4 6.228965
DMN Apr-2005 95 4.743416 1 2.236068 2.2 1.788854
DMN Jun-2005 95.2 7.120393 0.2 0.447214 2.2 2.683282
DMN Nov-2005 96.2 4.266146 0.6 1.341641 2.4 2.880972
END Jun-2004 95.2 4.086563 2.2 2.280351 0.8 1.303841
END Aug-2004 96.2 3.49285 2 2.44949 0.6 0.894427
END Oct-2004 97.2 1.095445 1.2 1.095445 0.8 1.303841
END Jan-2005 97 2 2.8 1.923538 0.2 0.447214
END Apr-2005 97.2 3.420526 2.6 3.130495 0.2 0.447214
END Jun-2005 97.2 1.095445 2.8 1.095445 0 0
END Nov-2005 97 2 2.8 2.167948 0 0
FKC Jun-2004 94 3.316625 1.6 2.073644 2.8 3.420526
FKC Aug-2004 94.2 4.764452 1.8 2.167948 2.8 3.420526
FKC Oct-2004 84.8 14.44645 1.4 1.949359 12.2 13.70037
FKC Jan-2005 88.8 13.91761 1.4 2.19089 8.4 12.77889
FKC Apr-2005 86.6 12.75931 1.2 2.167948 10.8 12.27599
FKC Jun-2005 83.2 18.9921 2 2.828427 5.8 6.220932
FKC Nov-2005 87.8 13.84558 1.6 1.341641 4.4 4.929503

136
Endocladia Nucella ostrina Tegula funebralis Limpets Littorines Date Mean # std. dev. Mean # std. dev. Mean # std. dev. Mean # std. dev. FKC Jun-2004 0 0 103.75 8.580956 360 142.1597FKC Aug-2004 0.4 0.244949 221.875 34.24692 800 245.0765FKC Oct-2004 2.8 1.462874 111.875 50.60571 412.5 360.5335FKC Jan-2005 4.6 2.95973 122.5 14.02425 1187.5 112.5694FKC Apr-2005 1.2 0.969536 85.625 3.217384 765 235.8959FKC Jun-2005 0.2 0.2 78.125 20.08284 217.5 75.68438DMN Jun-2004 0 0 0 0 178.125 41.16231 25 14.25219DMN Aug-2004 14 2.04939 1.8 0.583095 432.5 74.87359 40 28.33946DMN Oct-2004 2.8 0.969536 24.8 6.359245 518.125 93.75208 5.4 4.915282DMN Jan-2005 12.2 6.272161 3.6 0.927362 243.75 59.76026 5 3.061862DMN Apr-2005 5.2 2.2 0.2 0.2 229.375 229.375 170 170DMN Jun-2005 3.8 1.984943 1.4 1.16619 181.25 31.21873 785 534.9562END END Jun-2004 0.2 0.2 346.25 69.67699 30 24.2384END Aug-2004 0 0 684.375 98.29106 10 10END Oct-2004 0 0 279.375 130.5248 2114.888 1702.122END Jan-2005 6.8 4.662617 550 66.69514 47.5 16.00781END Apr-2005 0.6 0.6 133.125 33.05121 170 56.81659END Jun-2005 0.8 0.374166 203.125 21.58287 10.2 6.044833 Fucus Nucella ostrina Tegula funebralis Limpets Littorines Date Mean # std. dev. Mean # std. dev. Mean # std. dev. Mean # std. dev. FKC Jun-2004 10.6 3.668787 14.2 5.860034 57.5 19.22828 168.125 86.15257FKC Aug-2004 4.2 1.624808 17.4 7.775603 115 11.99772 477.5 114.932FKC Oct-2004 16 6.363961 21.4 5.836095 63.75 25.93185 152.5 54.97158FKC Jan-2005 14.8 4.340507 22.4 2.638181 18.75 7.19429 57.5 13.46291FKC Apr-2005 14.8 3.023243 19.4 5.04579 41.875 7.167091 192.5 85.20197FKC Jun-2005 10.4 6.368673 15.2 4.409082 40.625 15.21333 80 44.12341DMN Jun-2004 3 2.280351 0.2 0.2 41.875 9.457966 245 41.57072DMN Aug-2004 1.6 0.4 0 0 108.125 17.74934 662.5 242.0937DMN Oct-2004 8.8 2.745906 1.6 0.509902 65 9.132274 520 113.0956DMN Jan-2005 3.6 1.6 0.8 0.374166 41.875 8.761154 662.5 77.76166DMN Apr-2005 3.8 1.428286 2 1.140175 33.75 7.680129 1282.5 527.0288DMN Jun-2005 3.8 1.496663 5.8 2.517936 44.375 6.658524 2057.5 128.2454

137
Mussels Nucella ostrina Tegula funebralis Limpets Littorines Date Mean # std. dev. Mean # std. dev. Mean # std. dev. Mean # std. dev. FKC Jun-2004 4.6 2.56125 0.2 0.2 436.875 113.3449 0 0FKC Aug-2004 17.4 4.43396 1 0.774597 446.25 80.53411 48.125 32.46994FKC Oct-2004 42.6 25.47077 0.4 0.244949 518.125 55.10466 2.5 2.5FKC Jan-2005 2.2 0.969536 0 0 290.625 26.38729 12.5 0FKC Apr-2005 3.8 2.2 0 0 244.375 29.91524 20 10.15505FKC Jun-2005 2.6 1.029563 0.8 0.583095 358.125 48.81006 820 499.8844DMN Jun-2004 2.6 2.111871 0.6 0.4 85.625 35.07247 5.6 2.869669DMN Aug-2004 1.2 1.2 0.6 0.4 271.875 80.81011 6.2 2.648585DMN Oct-2004 5.2 2.709243 0.2 0.2 132.5 32.81399 0 0DMN Jan-2005 0 0.4 0.6 1.16619 100.625 36.27424 2.5 2.5DMN Apr-2005 4 2.607681 3.8 3.8 64.375 16.19582 112.5 47.26918DMN Jun-2005 14.6 3.931921 2.2 1.959592 135.625 34.75079 47.5 23.84848END Jun-2004 51.4 18.72592 520 73.16505 63.75 43.53294END Aug-2004 73.4 19.4 518.75 35.78091 272.5 134.2456END Oct-2004 49.6 15.17432 345.625 85.27071 737.5 300.1774END Jan-2005 12 3.885872 438.75 25.148 92.5 39.2508END Apr-2005 33.6 12.74598 85 7.868549 252.5 70.42283END Jun-2005 60 23.47339 187.5 22.16328 165 68.8522 Pelvetiopsis Nucella ostrina Tegula funebralis Limpets Littorines Date Mean # std. dev. Mean # std. dev. Mean # std. dev. Mean # std. dev. FKC Jun-2004 6.2 5.003998 165.625 28.67517 1466.25 673.6317FKC Aug-2004 1 0.632456 207.5 52.76162 1390 469.0482FKC Oct-2004 11.8 9.845811 61.25 32.5 872.5 387.4879FKC Jan-2005 0.6 0.6 110 24.75268 800 256.6917FKC Apr-2005 18.8 14.83712 124.375 31.1467 1860 184.2383FKC Jun-2005 6.6 4.04475 140 37.69999 602.5 319.3842END Jun-2004 0 0 0 0 156.875 18.99321 365 129.1438END Aug-2004 0.2 0.2 1 0.632456 158.125 27.3433 622.5 139.7207END Oct-2004 0.6 0.4 2.2 2.2 157.5 20.45861 784.375 238.8735END Jan-2005 0 0 2.6 1.661325 144.375 40.01221 440 207.643END Apr-2005 0 0 1.6 1.363818 236.875 37.46613 502.5 135.4045END Jun-2005 0.8 0.8 0 0 135 26.05958 220 91.48087

138
Size Distribution Data Tegula
Site Plot Type Date mean sd
DMN Fucus Jun-04 11.9 3.62 DMN Fucus Aug-04 17.0 2.89 DMN Fucus Oct-04 16.7 3.35 DMN Fucus Jan-05 14.9 3.23 DMN Fucus Apr-05 13.1 2.38 DMN Fucus Jun-05 13.6 3.34 FKC Fucus Jun-04 11.2 2.89 FKC Fucus Aug-04 10.5 3.40 FKC Fucus Oct-04 11.8 3.79 FKC Fucus Jan-05 11.7 4.20 FKC Fucus Apr-05 11.2 3.38 FKC Fucus Jun-05 11.7 3.55 Nucella ostrina
Site Plot Type Date mean sd
DMN Barnacle Jun-04 14.2 2.27 DMN Barnacle Aug-04 15.9 1.46 DMN Barnacle Oct-04 15.4 2.30 DMN Barnacle Jan-05 12.0 4.36 DMN Barnacle Apr-05 14.2 2.77 DMN Barnacle Jun-05 13.3 1.78 DMN Fucus Jun-04 13.8 3.81 DMN Fucus Aug-04 15.3 3.19 DMN Fucus Oct-04 15.6 3.54 DMN Fucus Jan-05 13.5 7.78 DMN Fucus Apr-05 10.8 2.86 DMN Fucus Jun-05 11.8 4.06 DMN Mussel Jun-04 12.6 2.95 DMN Mussel Aug-04 15.8 2.84 DMN Mussel Oct-04 15.6 4.59 DMN Mussel Jan-05 11.5 3.54 DMN Mussel Apr-05 11.5 2.13 DMN Mussel Jun-05 14.2 2.32 END Barnacle Jun-04 16.5 1.71 END Barnacle Aug-04 15.7 3.13 END Barnacle Oct-04 11.8 3.37 END Barnacle Jan-05 13.8 4.49 END Barnacle Apr-05 13.2 4.83 END Barnacle Jun-05 13.7 3.39 END Mussel Jun-04 15.1 1.69 END Mussel Aug-04 15.6 2.30 END Mussel Oct-04 13.2 3.42 END Mussel Jan-05 13.7 3.14 END Mussel Apr-05 14.6 2.47 END Mussel Jun-05 11.8 1.96 FKC Barnacle Jun-04 0.0 FKC Barnacle Aug-04 0.0

139
FKC Barnacle Oct-04 10.4 2.41 FKC Barnacle Jan-05 8.5 1.38 FKC Barnacle Apr-05 11.8 2.86 FKC Barnacle Jun-05 11.0 0.00 FKC Fucus Jun-04 13.0 3.01 FKC Fucus Aug-04 11.3 2.17 FKC Fucus Oct-04 10.2 4.57 FKC Fucus Jan-05 10.7 4.37 FKC Fucus Apr-05 11.3 3.22 FKC Fucus Jun-05 11.3 3.50 FKC Mussel Jun-04 11.6 2.69 FKC Mussel Aug-04 13.9 3.14 FKC Mussel Oct-04 11.2 3.60 FKC Mussel Jan-05 12.9 2.88 FKC Mussel Apr-05 10.9 2.47 FKC Mussel Jun-05 10.5 3.02

140
APPENDIX F: SAND BEACH INVENTORY LIST Sand Beach Invertebrates
Phylum Class Current Scientific Name Old Scientific Name (Boyd) Category or common name
B&D 1977
Crescent Beach
Gold Bluffs Beach
Redwood Creek Beach
Annelida Polychaeta Eteone dilate Eteone dilate Polychaete X
Annelida Polychaeta Euzonus mucronatus Euzonus mucronata Blood Worm X A P
Annelida Polychaeta Lumbrineris zonata Lumbrineris zonata Polychaete X U
Annelida Polychaeta Nephtys californiensis Nephtys californiensis Blood Worm X A A C
Annelida Polychaeta Nothria conchylega Nothria iridescens Polychaete X
Annelida Polychaeta Orbinia johnsoni Orbinia johnsoni Polychaete X
Annelida Polychaeta Pygospio californica Pygospio californica Polychaete X
Annelida Polychaeta Scolelepis squamata Scolelepis squamatus Polychaete X
Arthropoda Crustacea Alloniscus perconvexus Isopod P P R
Arthropoda Crustacea Archaeomysis grebnitzkii Archaeomysis maculata Opossum Shrimp X A A R
Arthropoda Crustacea Atylus tridens Atylus tridens Amphipod X
Arthropoda Crustacea Bathycopea daltonae Bathycopea daltonae Isopod X
Arthropoda Crustacea Crangon nigricauda Crangon nigricauda Shrimp X A A R
Arthropoda Crustacea Emerita analoga Emerita analoga Pacific Sand Crab X A A A
Arthropoda Crustacea Eohaustorius brevicuspus Eohaustorius brevicuspus Amphipod X
Arthropoda Crustacea Eohaustorius sawyeri Eohaustorius sawyeri Amphipod X
Arthropoda Crustacea Eohaustorius washingtonianus Eohaustorius washingtonianus Amphipod X C C U
Arthropoda Crustacea Excirolana linguifrons Excirolana linguifrons Isopod X C C C
Arthropoda Crustacea Excirolana spp Isopod P P U
Arthropoda Crustacea Megalorcestia benedicti Orchestoidea benedicti Beach Hopper X
Arthropoda Crustacea Megalorcestia californiana Orchestoidea californiana California Beach Flea X A C U
Arthropoda Crustacea Megalorcestia columbiana Orchestoidea columbiana Beach Hopper X C C P
Arthropoda Crustacea Monoculoides sp. Monoculoides sp. Amphipod X
Arthropoda Crustacea Paraphoxus sp. Paraphoxus sp. Amphipod X
Arthropoda Crustacea Proboscinotus loquax Dogielinotus loquax X
Arthropoda Insecta Thinopinus pictus Rove beetle U
Cnidaria Scyphozoa Aurelia aurita Moon Jelly R
Echinodermata Echinoidea Dendraster excentricus Sand dollar P U R
Mollusca Bivalvia Siliqua patula Siliqua patula Pacific Razor Clam X
Mollusca Gastropoda Nassarius fossatus A C U
Mollusca Gastropoda Nassarius obsoletus P U R
Mollusca Gastropoda Olivella baetica Olivella pycna Small Olive X P U
Mollusca Gastropoda Olivella biplicata Olivella biplicata Dwarf Purple Olive X C C R
Nemertea Anopla Tubulanus pellucidus Tubulanus pellucidus Tube Nemertean X
A = Abundant, C = Common, P = Present, U = Uncommon, R = Rare M. J. Boyd and J. D. DeMartini, 1977. The Intertidal and Subtidal Biota of Redwood National Park. Submitted in fulfillment of U. S. Department of the Interior, National Park Service Contract No. CX8480 - 4 -0665. 162 p. M. J. Boyd and J. D. DeMartini, 1981. Reconnaissane Survey of Redwood Natl. Park Area of Special Biological Significance. Calif. Fish Game Report. 121 p.

141
APPENDIX G: RAW SAND BEACH MONITORING DATA Sand Crabs (Emerita Anologa)
Site Date core/m # cores 38+ total
38+ ovig.
28+ total
28+ ovig.
18+ total
18+ ovig.
8+ total
8+ ovig.
4+ total
Megalopa # ovig. # non. Ovig.
Total Crabs
Crabs + meg.
Crabs/core
Crabs/m
CB 21-May-04 1 35 0 0 1 0 6 0 0 0 0 0 0 7 7 7 0.20 5CB 21-May-04 1 34 10 8 3 2 10 1 0 0 0 0 11 23 34 34 1.00 27CB 21-May-04 1 40 6 5 4 2 20 1 0 0 0 0 8 30 38 38 0.95 26CB 21-May-04 1 43 2 2 5 2 5 0 0 0 0 0 4 12 16 16 0.37 10CB 21-May-04 1 50 1 1 2 2 6 0 0 0 0 0 3 9 12 12 0.24 7CB 17-Jul-04 2 62 3 3 1 0 28 0 4 0 0 0 3 36 39 39 0.63 17CB 17-Jul-04 2 76 7 7 1 1 28 0 1 0 0 0 8 37 45 45 0.59 16CB 17-Jul-04 2 81 7 6 18 0 1 0 0 0 0 0 6 26 32 32 0.40 11CB 17-Jul-04 2 79 8 7 5 4 17 0 0 0 0 0 11 30 41 41 0.52 14CB 17-Jul-04 2 80 12 11 8 4 44 0 0 0 0 0 15 64 79 79 0.99 27CB 18-Aug-05 0.5 114 4 3 1 1 108 0 153 0 0 0 4 266 270 270 2.37 65CB 18-Aug-05 0.5 130 6 6 9 8 150 0 216 0 0 0 14 381 395 395 3.04 83CB 18-Aug-05 0.5 79 7 7 4 0 54 0 144 0 0 0 7 209 216 216 2.73 75CB 18-Aug-05 0.5 104 3 3 1 1 155 0 357 0 2 0 4 518 522 522 5.02 138CB 18-Aug-05 0.5 108 2 2 1 0 145 0 421 0 1 0 2 570 572 572 5.30 146GBB 22-May-04 2 180 0 0 2 0 7 0 0 0 0 0 0 9 9 9 0.05 1GBB 22-May-04 2 180 6 4 3 1 48 0 360 0 0 0 5 417 422 422 2.34 64GBB 22-May-04 2 160 11 10 8 2 26 0 2 0 0 0 12 47 59 59 0.37 10GBB 22-May-04 2 180 5 4 5 1 26 0 5 0 6 0 5 47 52 52 0.29 8GBB 22-May-04 2 140 9 7 6 2 28 0 350 0 21 0 9 414 423 423 3.02 83GBB 15-Jul-04 2 80 14 12 8 8 13 0 1 0 0 0 20 36 56 56 0.70 19GBB 15-Jul-04 2 56 10 6 10 5 12 0 0 0 0 0 11 32 43 43 0.77 21GBB 15-Jul-04 2 45 16 13 11 7 30 1 3 0 0 0 21 60 81 81 1.80 49GBB 15-Jul-04 2 37 18 16 14 11 46 0 0 0 0 0 27 78 105 105 2.84 78GBB 15-Jul-04 2 37 12 15 16 8 88 0 48 0 131 0 23 295 318 318 8.59 236GBB 19-Aug-05 1 119 0 0 0 0 12 0 0 0 0 0 0 12 12 12 0.10 3GBB 19-Aug-05 1 135 0 0 1 0 33 0 7 0 0 0 0 41 41 41 0.30 8GBB 19-Aug-05 1 115 0 0 0 0 45 0 21 0 0 0 0 66 66 66 0.57 16GBB 19-Aug-05 1 113 0 0 0 0 73 0 29 0 0 0 0 102 102 102 0.90 25GBB 19-Aug-05 1 110 3 3 3 3 238 0 71 0 0 0 6 315 321 321 2.92 80RCB 22-May-04 2 11 0 0 0 0 0 0 0 0 0 0 0 0 0 0 0.00 0RCB 22-May-04 2 11 0 0 0 0 0 0 0 0 0 0 0 0 0 0 0.00 0RCB 22-May-04 2 30 0 0 1 0 0 0 0 0 0 0 0 1 1 1 0.03 1RCB 22-May-04 2 35 0 0 0 0 1 0 0 0 0 0 0 1 1 1 0.03 1RCB 22-May-04 2 25 0 0 3 0 2 0 0 0 0 0 0 5 5 5 0.20 5RCB 19-Jul-04 2 20 0 0 0 0 0 0 0 0 0 0 0 0 0 0 0.00 0RCB 19-Jul-04 2 20 0 0 1 0 0 0 0 0 0 0 0 1 1 1 0.05 1RCB 19-Jul-04 2 20 0 0 0 0 0 0 0 0 0 0 0 0 0 0 0.00 0RCB 19-Jul-04 2 33 0 0 0 0 0 0 0 0 0 0 0 0 0 0 0.00 0RCB 19-Jul-04 2 35 0 0 0 0 0 0 0 0 0 0 0 0 0 0 0.00 0RCB 20-Aug-05 4 56 0 0 0 0 3 0 14 0 0 0 0 17 17 17 0.30 8RCB 20-Aug-05 4 45 0 0 1 1 3 0 11 0 0 0 1 15 16 16 0.36 10RCB 20-Aug-05 4 61 0 0 0 0 13 0 114 0 0 0 0 127 127 127 2.08 57RCB 20-Aug-05 4 71 0 0 0 0 2 0 1 0 0 0 1 3 4 4 0.06 2RCB 20-Aug-05 4 73 0 0 0 0 13 0 0 0 0 0 0 13 13 13 0.18 5

142
Amphipods Site Date Length (m) # Cores/m Total # Cores Amphipods Amph/Core Amphipods/mCB 21-May-04 25 2 50 9 5.08 139.56CB 21-May-04 25 2 50 12 6.12 168.13CB 21-May-04 25 2 50 19 13.12 360.44CB 21-May-04 25 2 50 24 13.22 363.19CB 21-May-04 25 2 50 12 7.10 195.05CB 17-Jul-04 35 1 35 8 2.17 59.65CB 17-Jul-04 37 1 37 3 1.05 28.96CB 17-Jul-04 44 1 44 1 0.02 0.62CB 17-Jul-04 52 1 52 8 2.12 58.11CB 17-Jul-04 40 1 40 10 6.10 167.58CB 18-Aug-05 36 2 72 148 51.36 1411.02CB 18-Aug-05 46 2 92 35 9.28 255.02CB 18-Aug-05 39 2 78 60 22.49 617.78CB 18-Aug-05 43.5 2 87 44 15.33 421.25CB 18-Aug-05 24.5 2 49 54 18.73 514.69GBB 22-May-04 40 2 80 2 1.01 27.82GBB 22-May-04 40 2 80 9 7.03 192.99GBB 22-May-04 40 2 80 5 3.03 83.10GBB 22-May-04 40 2 80 6 3.04 83.45GBB 22-May-04 40 2 80 10 5.06 139.08GBB 15-Jul-04 72 2 144 20 1.13 31.10GBB 15-Jul-04 83 2 166 5 2.02 55.44GBB 15-Jul-04 89 2 178 12 5.04 138.44GBB 15-Jul-04 70 2 140 14 12.01 330.06GBB 15-Jul-04 73 2 146 17 10.05 276.04GBB 19-Aug-05 29.5 2 59 27 17.17 471.69GBB 19-Aug-05 37.5 2 75 16 12.05 331.14GBB 19-Aug-05 30 2 60 18 7.18 197.34GBB 19-Aug-05 32 2 64 6 3.05 83.71GBB 19-Aug-05 30 2 60 13 10.05 276.10RCB 22-May-04 12 2 24 24 23.04 633.01RCB 22-May-04 11 2 22 8 8.00 219.78RCB 22-May-04 11.5 2 23 8 8.00 219.78RCB 22-May-04 11 2 22 11 11.00 302.20RCB 22-May-04 11 2 22 29 29.00 796.70RCB 19-Jul-04 30 1 30 16 16.00 439.56RCB 19-Jul-04 34 1 34 6 6.00 164.84RCB 19-Jul-04 31 1 31 2 2.00 54.95RCB 19-Jul-04 34 1 34 12 10.06 276.34RCB 19-Jul-04 33 1 33 10 10.00 274.73RCB 20-Aug-05 34 1 34 10 6.12 168.07RCB 20-Aug-05 38 1 38 7 7.00 192.31RCB 20-Aug-05 37 1 37 7 6.03 165.58RCB 20-Aug-05 45 1 45 7 4.07 111.72RCB 20-Aug-05 34 1 34 10 10.00 274.73
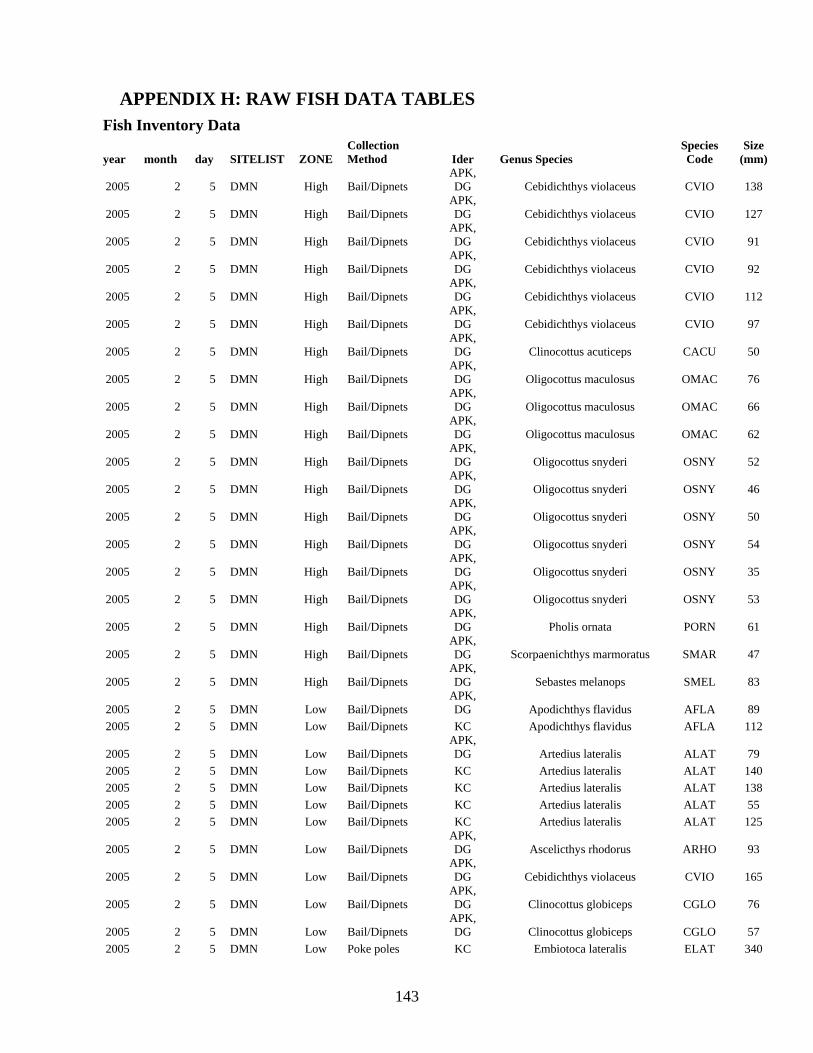
143
APPENDIX H: RAW FISH DATA TABLES Fish Inventory Data
year month day SITELIST ZONE Collection Method Ider Genus Species
Species Code
Size (mm)
2005 2 5 DMN High Bail/Dipnets APK, DG Cebidichthys violaceus CVIO 138
2005 2 5 DMN High Bail/Dipnets APK, DG Cebidichthys violaceus CVIO 127
2005 2 5 DMN High Bail/Dipnets APK, DG Cebidichthys violaceus CVIO 91
2005 2 5 DMN High Bail/Dipnets APK, DG Cebidichthys violaceus CVIO 92
2005 2 5 DMN High Bail/Dipnets APK, DG Cebidichthys violaceus CVIO 112
2005 2 5 DMN High Bail/Dipnets APK, DG Cebidichthys violaceus CVIO 97
2005 2 5 DMN High Bail/Dipnets APK, DG Clinocottus acuticeps CACU 50
2005 2 5 DMN High Bail/Dipnets APK, DG Oligocottus maculosus OMAC 76
2005 2 5 DMN High Bail/Dipnets APK, DG Oligocottus maculosus OMAC 66
2005 2 5 DMN High Bail/Dipnets APK, DG Oligocottus maculosus OMAC 62
2005 2 5 DMN High Bail/Dipnets APK, DG Oligocottus snyderi OSNY 52
2005 2 5 DMN High Bail/Dipnets APK, DG Oligocottus snyderi OSNY 46
2005 2 5 DMN High Bail/Dipnets APK, DG Oligocottus snyderi OSNY 50
2005 2 5 DMN High Bail/Dipnets APK, DG Oligocottus snyderi OSNY 54
2005 2 5 DMN High Bail/Dipnets APK, DG Oligocottus snyderi OSNY 35
2005 2 5 DMN High Bail/Dipnets APK, DG Oligocottus snyderi OSNY 53
2005 2 5 DMN High Bail/Dipnets APK, DG Pholis ornata PORN 61
2005 2 5 DMN High Bail/Dipnets APK, DG Scorpaenichthys marmoratus SMAR 47
2005 2 5 DMN High Bail/Dipnets APK, DG Sebastes melanops SMEL 83
2005 2 5 DMN Low Bail/Dipnets APK, DG Apodichthys flavidus AFLA 89
2005 2 5 DMN Low Bail/Dipnets KC Apodichthys flavidus AFLA 112
2005 2 5 DMN Low Bail/Dipnets APK, DG Artedius lateralis ALAT 79
2005 2 5 DMN Low Bail/Dipnets KC Artedius lateralis ALAT 140 2005 2 5 DMN Low Bail/Dipnets KC Artedius lateralis ALAT 138 2005 2 5 DMN Low Bail/Dipnets KC Artedius lateralis ALAT 55 2005 2 5 DMN Low Bail/Dipnets KC Artedius lateralis ALAT 125
2005 2 5 DMN Low Bail/Dipnets APK, DG Ascelicthys rhodorus ARHO 93
2005 2 5 DMN Low Bail/Dipnets APK, DG Cebidichthys violaceus CVIO 165
2005 2 5 DMN Low Bail/Dipnets APK, DG Clinocottus globiceps CGLO 76
2005 2 5 DMN Low Bail/Dipnets APK, DG Clinocottus globiceps CGLO 57
2005 2 5 DMN Low Poke poles KC Embiotoca lateralis ELAT 340

144
2005 2 5 DMN Low Fishing pole/shrimpbait KC Embiotoca lateralis ELAT 310
2005 2 5 DMN Low Fishing pole/shrimpbait KC Embiotoca lateralis ELAT 315
2005 2 5 DMN Low Bail/Dipnets KC Embiotoca lateralis ELAT 317 2005 2 5 DMN Low Poke poles KC Enophrys bison EBIS 105
2005 2 5 DMN Low Bail/Dipnets APK, DG Gobiesox maeandricus GMAE 67
2005 2 5 DMN Low Bail/Dipnets KC Gobiesox maeandricus GMAE 70 2005 2 5 DMN Low Bail/Dipnets KC Gobiesox maeandricus GMAE 44 2005 2 5 DMN Low Bail/Dipnets KC Gobiesox maeandricus GMAE 45
2005 2 5 DMN Low Bail/Dipnets APK, DG Hemilepidotus spinosus HSPI 67
2005 2 5 DMN Low Fishing pole/shrimpbait KC Hexagrammos decagrammus HDEC 213
2005 2 5 DMN Low Bail/Dipnets APK, DG Hexagrammos decagrammus HDEC 160
2005 2 5 DMN Low Bail/Dipnets APK, DG Hexagrammos decagrammus HDEC 239
2005 2 5 DMN Low Bail/Dipnets KC Hexagrammos superciliosus HSUP 315
2005 2 5 DMN Low Bail/Dipnets APK, DG Liparis florae LFLO 122
2005 2 5 DMN Low Bail/Dipnets APK, DG Oligocottus maculosus OMAC 41
2005 2 5 DMN Low Bail/Dipnets APK, DG Oligocottus snyderi OSNY 60
2005 2 5 DMN Low Bail/Dipnets APK, DG Oligocottus snyderi OSNY 43
2005 2 5 DMN Low Bail/Dipnets APK, DG Oligocottus snyderi OSNY 50
2005 2 5 DMN Low Bail/Dipnets APK, DG Oligocottus snyderi OSNY 49
2005 2 5 DMN Low Bail/Dipnets APK, DG Oligocottus snyderi OSNY 41
2005 2 5 DMN Low Bail/Dipnets APK, DG Oligocottus snyderi OSNY 36
2005 2 5 DMN Low Bail/Dipnets APK, DG Oligocottus snyderi OSNY 47
2005 2 5 DMN Low Bail/Dipnets APK, DG Oligocottus snyderi OSNY 35
2005 2 5 DMN Low Bail/Dipnets APK, DG Oligocottus snyderi OSNY 36
2005 2 5 DMN Low Bail/Dipnets APK, DG Oligocottus snyderi OSNY 75
2005 2 5 DMN Low Bail/Dipnets APK, DG Oligocottus snyderi OSNY 51
2005 2 5 DMN Low Bail/Dipnets APK, DG Oligocottus snyderi OSNY 67
2005 2 5 DMN Low Bail/Dipnets APK, DG Oligocottus snyderi OSNY 47
2005 2 5 DMN Low Bail/Dipnets APK, DG Oligocottus snyderi OSNY 41
2005 2 5 DMN Low Bail/Dipnets APK, DG Oligocottus snyderi OSNY 41
2005 2 5 DMN Low Bail/Dipnets APK, DG Oligocottus snyderi OSNY 38
2005 2 5 DMN Low Bail/Dipnets KC Oligocottus snyderi OSNY 54 2005 2 5 DMN Low Bail/Dipnets KC Oligocottus snyderi OSNY 55 2005 2 5 DMN Low Bail/Dipnets KC Oligocottus snyderi OSNY 45 2005 2 5 DMN Low Bail/Dipnets KC Oligocottus snyderi OSNY 43 2005 2 5 DMN Low Bail/Dipnets KC Oligocottus snyderi OSNY 42 2005 2 5 DMN Low Bail/Dipnets KC Oligocottus snyderi OSNY 37
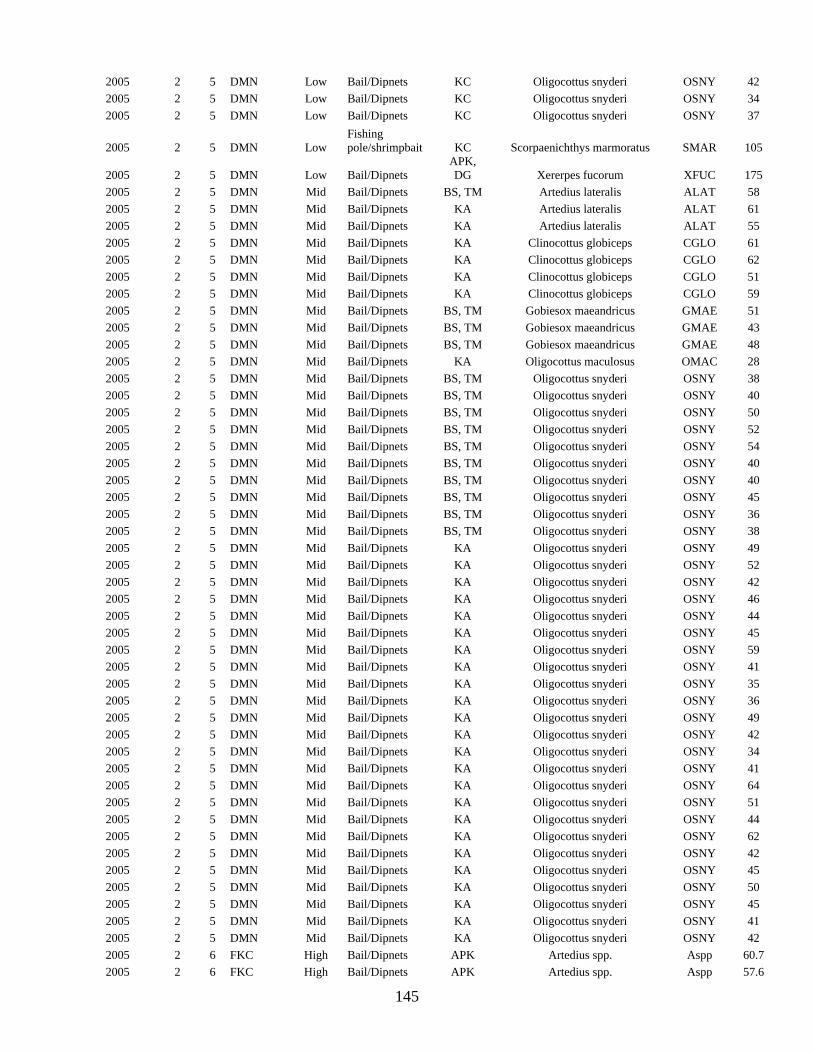
145
2005 2 5 DMN Low Bail/Dipnets KC Oligocottus snyderi OSNY 42 2005 2 5 DMN Low Bail/Dipnets KC Oligocottus snyderi OSNY 34 2005 2 5 DMN Low Bail/Dipnets KC Oligocottus snyderi OSNY 37
2005 2 5 DMN Low Fishing pole/shrimpbait KC Scorpaenichthys marmoratus SMAR 105
2005 2 5 DMN Low Bail/Dipnets APK, DG Xererpes fucorum XFUC 175
2005 2 5 DMN Mid Bail/Dipnets BS, TM Artedius lateralis ALAT 58 2005 2 5 DMN Mid Bail/Dipnets KA Artedius lateralis ALAT 61 2005 2 5 DMN Mid Bail/Dipnets KA Artedius lateralis ALAT 55 2005 2 5 DMN Mid Bail/Dipnets KA Clinocottus globiceps CGLO 61 2005 2 5 DMN Mid Bail/Dipnets KA Clinocottus globiceps CGLO 62 2005 2 5 DMN Mid Bail/Dipnets KA Clinocottus globiceps CGLO 51 2005 2 5 DMN Mid Bail/Dipnets KA Clinocottus globiceps CGLO 59 2005 2 5 DMN Mid Bail/Dipnets BS, TM Gobiesox maeandricus GMAE 51 2005 2 5 DMN Mid Bail/Dipnets BS, TM Gobiesox maeandricus GMAE 43 2005 2 5 DMN Mid Bail/Dipnets BS, TM Gobiesox maeandricus GMAE 48 2005 2 5 DMN Mid Bail/Dipnets KA Oligocottus maculosus OMAC 28 2005 2 5 DMN Mid Bail/Dipnets BS, TM Oligocottus snyderi OSNY 38 2005 2 5 DMN Mid Bail/Dipnets BS, TM Oligocottus snyderi OSNY 40 2005 2 5 DMN Mid Bail/Dipnets BS, TM Oligocottus snyderi OSNY 50 2005 2 5 DMN Mid Bail/Dipnets BS, TM Oligocottus snyderi OSNY 52 2005 2 5 DMN Mid Bail/Dipnets BS, TM Oligocottus snyderi OSNY 54 2005 2 5 DMN Mid Bail/Dipnets BS, TM Oligocottus snyderi OSNY 40 2005 2 5 DMN Mid Bail/Dipnets BS, TM Oligocottus snyderi OSNY 40 2005 2 5 DMN Mid Bail/Dipnets BS, TM Oligocottus snyderi OSNY 45 2005 2 5 DMN Mid Bail/Dipnets BS, TM Oligocottus snyderi OSNY 36 2005 2 5 DMN Mid Bail/Dipnets BS, TM Oligocottus snyderi OSNY 38 2005 2 5 DMN Mid Bail/Dipnets KA Oligocottus snyderi OSNY 49 2005 2 5 DMN Mid Bail/Dipnets KA Oligocottus snyderi OSNY 52 2005 2 5 DMN Mid Bail/Dipnets KA Oligocottus snyderi OSNY 42 2005 2 5 DMN Mid Bail/Dipnets KA Oligocottus snyderi OSNY 46 2005 2 5 DMN Mid Bail/Dipnets KA Oligocottus snyderi OSNY 44 2005 2 5 DMN Mid Bail/Dipnets KA Oligocottus snyderi OSNY 45 2005 2 5 DMN Mid Bail/Dipnets KA Oligocottus snyderi OSNY 59 2005 2 5 DMN Mid Bail/Dipnets KA Oligocottus snyderi OSNY 41 2005 2 5 DMN Mid Bail/Dipnets KA Oligocottus snyderi OSNY 35 2005 2 5 DMN Mid Bail/Dipnets KA Oligocottus snyderi OSNY 36 2005 2 5 DMN Mid Bail/Dipnets KA Oligocottus snyderi OSNY 49 2005 2 5 DMN Mid Bail/Dipnets KA Oligocottus snyderi OSNY 42 2005 2 5 DMN Mid Bail/Dipnets KA Oligocottus snyderi OSNY 34 2005 2 5 DMN Mid Bail/Dipnets KA Oligocottus snyderi OSNY 41 2005 2 5 DMN Mid Bail/Dipnets KA Oligocottus snyderi OSNY 64 2005 2 5 DMN Mid Bail/Dipnets KA Oligocottus snyderi OSNY 51 2005 2 5 DMN Mid Bail/Dipnets KA Oligocottus snyderi OSNY 44 2005 2 5 DMN Mid Bail/Dipnets KA Oligocottus snyderi OSNY 62 2005 2 5 DMN Mid Bail/Dipnets KA Oligocottus snyderi OSNY 42 2005 2 5 DMN Mid Bail/Dipnets KA Oligocottus snyderi OSNY 45 2005 2 5 DMN Mid Bail/Dipnets KA Oligocottus snyderi OSNY 50 2005 2 5 DMN Mid Bail/Dipnets KA Oligocottus snyderi OSNY 45 2005 2 5 DMN Mid Bail/Dipnets KA Oligocottus snyderi OSNY 41 2005 2 5 DMN Mid Bail/Dipnets KA Oligocottus snyderi OSNY 42 2005 2 6 FKC High Bail/Dipnets APK Artedius spp. Aspp 60.7 2005 2 6 FKC High Bail/Dipnets APK Artedius spp. Aspp 57.6

146
2005 2 6 FKC High Bail/Dipnets APK Artedius spp. Aspp 52.6 2005 2 6 FKC High Bail/Dipnets APK Artedius spp. Aspp 59.8 2005 2 6 FKC High Bail/Dipnets APK Ascelicthys rhodorus ARHO 117.2 2005 2 6 FKC High Bail/Dipnets APK Clinocottus globiceps CGLO 37 2005 2 6 FKC High Bail/Dipnets RS Clinocottus globiceps CGLO 48.3 2005 2 6 FKC High Bail/Dipnets APK Hemilepidotus spinosus HSPI 98.1 2005 2 6 FKC High Bail/Dipnets APK Hexagrammos decagrammus HDEC 146.7 2005 2 6 FKC High Bail/Dipnets APK Oligocottus maculosus OMAC 40.2 2005 2 6 FKC High Bail/Dipnets APK Oligocottus maculosus OMAC 81.1 2005 2 6 FKC High Bail/Dipnets APK Oligocottus maculosus OMAC 43.4 2005 2 6 FKC High Bail/Dipnets APK Oligocottus maculosus OMAC 32.5 2005 2 6 FKC High Bail/Dipnets APK Oligocottus maculosus OMAC 27.9 2005 2 6 FKC High Bail/Dipnets APK Oligocottus maculosus OMAC 33 2005 2 6 FKC High Bail/Dipnets APK Oligocottus maculosus OMAC 32 2005 2 6 FKC High Bail/Dipnets APK Oligocottus maculosus OMAC 31.2 2005 2 6 FKC High Bail/Dipnets APK Oligocottus maculosus OMAC 39.2 2005 2 6 FKC High Bail/Dipnets APK Oligocottus maculosus OMAC 47.6 2005 2 6 FKC High Bail/Dipnets APK Oligocottus maculosus OMAC 28 2005 2 6 FKC High Bail/Dipnets APK Oligocottus maculosus OMAC 78.9 2005 2 6 FKC High Bail/Dipnets APK Oligocottus maculosus OMAC 60.4 2005 2 6 FKC High Bail/Dipnets APK Oligocottus maculosus OMAC 46.8 2005 2 6 FKC High Bail/Dipnets APK Oligocottus maculosus OMAC 78.4 2005 2 6 FKC High Bail/Dipnets APK Oligocottus maculosus OMAC 70.6 2005 2 6 FKC High Bail/Dipnets APK Oligocottus maculosus OMAC 72.8 2005 2 6 FKC High Bail/Dipnets RS Oligocottus maculosus OMAC 36.9 2005 2 6 FKC High Bail/Dipnets RS Oligocottus maculosus OMAC 35.2 2005 2 6 FKC High Bail/Dipnets APK Oligocottus snyderi OSNY 41.8 2005 2 6 FKC High Bail/Dipnets APK Oligocottus snyderi OSNY 55.5 2005 2 6 FKC High Bail/Dipnets APK Oligocottus snyderi OSNY 39.9 2005 2 6 FKC High Bail/Dipnets APK Oligocottus snyderi OSNY 39.9 2005 2 6 FKC High Bail/Dipnets APK Oligocottus snyderi OSNY 62.6 2005 2 6 FKC High Bail/Dipnets APK Oligocottus snyderi OSNY 33.8 2005 2 6 FKC High Bail/Dipnets APK Oligocottus snyderi OSNY 29.5 2005 2 6 FKC High Bail/Dipnets APK Oligocottus snyderi OSNY 38.6 2005 2 6 FKC High Bail/Dipnets APK Oligocottus snyderi OSNY 59 2005 2 6 FKC High Bail/Dipnets RS Oligocottus snyderi OSNY 26.1 2005 2 6 FKC High Bail/Dipnets RS Oligocottus snyderi OSNY 40.1 2005 2 6 FKC High Bail/Dipnets RS Oligocottus snyderi OSNY 39.6 2005 2 6 FKC High Bail/Dipnets RS Oligocottus snyderi OSNY 43.7 2005 2 6 FKC High Bail/Dipnets RS Oligocottus snyderi OSNY 37.7 2005 2 6 FKC High Bail/Dipnets RS Oligocottus snyderi OSNY 25.9 2005 2 6 FKC High Bail/Dipnets APK Scorpaenichthys marmoratus SMAR 41.1 2005 2 6 FKC High Bail/Dipnets APK Scorpaenichthys marmoratus SMAR 103.4 2005 2 6 FKC High Bail/Dipnets APK Scorpaenichthys marmoratus SMAR 130.3 2005 2 6 FKC High Bail/Dipnets APK Scorpaenichthys marmoratus SMAR 111.3 2005 2 6 FKC High Bail/Dipnets APK Sebastes melanops SMEL 74.2 2005 2 6 FKC High Bail/Dipnets APK Sebastes melanops SMEL 96.1 2005 2 6 FKC High Bail/Dipnets APK Sebastes melanops SMEL 93.8 2005 2 6 FKC High Bail/Dipnets APK Sebastes melanops SMEL 83.3 2005 2 6 FKC High Bail/Dipnets APK Sebastes melanops SMEL 71 2005 2 6 FKC High Bail/Dipnets APK Sebastes melanops SMEL 92.4 2005 2 6 FKC High Bail/Dipnets APK Sebastes melanops SMEL 87.7 2005 2 6 FKC High Bail/Dipnets APK Sebastes melanops SMEL 85

147
2005 2 6 FKC High Bail/Dipnets APK Xiphister atropurpureus XATR 111.1 2005 2 6 FKC High Bail/Dipnets RS Xiphister atropurpureus XATR 67.6 2005 2 6 FKC High Bail/Dipnets RS Xiphister atropurpureus XATR 50.8 2005 2 6 FKC High Bail/Dipnets RS Xiphister atropurpureus XATR 85.9 2005 2 6 FKC Low Bail/Dipnets APK Ascelicthys rhodorus ARHO 76 2005 2 6 FKC Low Bail/Dipnets APK Gobiesox maeandricus GMAE 117 2005 2 6 FKC Low Bail/Dipnets APK Gobiesox maeandricus GMAE 41 2005 2 6 FKC Low Bail/Dipnets APK Gobiesox maeandricus GMAE 44 2005 2 6 FKC Low Bail/Dipnets APK Gobiesox maeandricus GMAE 31 2005 2 6 FKC Low Bail/Dipnets APK Hemilepidotus spinosus HSPI 62 2005 2 6 FKC Low Bail/Dipnets APK Hemilepidotus spinosus HSPI 98 2005 2 6 FKC Low Bail/Dipnets APK Oligocottus maculosus OMAC 41 2005 2 6 FKC Low Bail/Dipnets APK Oligocottus snyderi OSNY 71 2005 2 6 FKC Low Bail/Dipnets APK Oligocottus snyderi OSNY 92 2005 2 6 FKC Low Bail/Dipnets APK Oligocottus snyderi OSNY 62 2005 2 6 FKC Low Bail/Dipnets APK Oligocottus snyderi OSNY 45 2005 2 6 FKC Low Bail/Dipnets APK Oligocottus snyderi OSNY 82 2005 2 6 FKC Low Bail/Dipnets APK Oligocottus snyderi OSNY 35 2005 2 6 FKC Low Bail/Dipnets APK Oligocottus snyderi OSNY 84 2005 2 6 FKC Low Bail/Dipnets APK Oligocottus snyderi OSNY 79 2005 2 6 FKC Low Bail/Dipnets APK Oligocottus snyderi OSNY 75 2005 2 6 FKC Low Bail/Dipnets APK Oligocottus snyderi OSNY 62 2005 2 6 FKC Low Bail/Dipnets APK Oligocottus snyderi OSNY 53 2005 2 6 FKC Low Bail/Dipnets APK Oligocottus snyderi OSNY 43 2005 2 6 FKC Low Bail/Dipnets APK Oligocottus snyderi OSNY 39 2005 2 6 FKC Low Bail/Dipnets APK Oligocottus snyderi OSNY 42 2005 2 6 FKC Low Bail/Dipnets APK Oligocottus snyderi OSNY 51 2005 2 5 DMN Bail/Dipnets KC Artedius lateralis ALAT 72 2005 2 5 DMN Bail/Dipnets KC Artedius lateralis ALAT 134 2005 2 5 DMN Bail/Dipnets KC Artedius lateralis ALAT 134 2005 2 5 DMN Low Poke poles KC Artedius lateralis ALAT 117 2005 2 5 DMN Bail/Dipnets KC Artedius lateralis ALAT 54 2005 2 5 DMN Bail/Dipnets KC Oligocottus maculosus OMAC 71 2005 2 5 DMN Bail/Dipnets KC Oligocottus maculosus OMAC 87 2005 2 5 DMN Bail/Dipnets KC Oligocottus maculosus OMAC 37 2005 2 5 DMN Bail/Dipnets KC Sebastes melanops SMEL 86 2005 2 5 DMN Bail/Dipnets KC Clinocottus globiceps CGLO 74 2005 2 5 DMN Bail/Dipnets KC Clinocottus globiceps CGLO 58 2005 2 5 DMN Low Poke poles KC Enophrys bison EBIS 179 2005 2 5 DMN Low Bail/Dipnets KC Artedius lateralis ALAT 111 2005 2 5 DMN Low Bail/Dipnets KC Artedius lateralis ALAT 73 2005 2 5 DMN Low Bail/Dipnets KC Artedius lateralis ALAT 67 2005 2 5 DMN Low Bail/Dipnets KC Artedius lateralis ALAT 56 2005 2 5 DMN Bail/Dipnets KC Anoplarchus purpurescens APUR 108 2005 2 5 DMN Bail/Dipnets KC Cebidichthys violaceus CVIO 81 2005 2 5 DMN Bail/Dipnets KC Xererpes fucorum XFUC 91 2005 2 5 DMN Bail/Dipnets KC Ascelicthys rhodorus ARHO 109 2005 2 5 DMN Bail/Dipnets KC Ascelicthys rhodorus ARHO 103 2005 2 5 DMN Bail/Dipnets KC Ascelicthys rhodorus ARHO 93 2005 2 5 DMN Bail/Dipnets KC Artedius lateralis ALAT 131 2005 2 5 DMN Bail/Dipnets KC Hemilepidotus spinosus HSPI 68 2005 2 5 DMN Bail/Dipnets KC Gobiesox maeandricus GMAE 68 2005 2 5 DMN Bail/Dipnets KC Liparis florae LFLO 114

148
2005 2 5 DMN Bail/Dipnets KC Clinocottus globiceps CGLO 54 2005 2 5 DMN Bail/Dipnets KC Clinocottus globiceps CGLO 48 2005 2 5 DMN Bail/Dipnets KC Clinocottus globiceps CGLO 59 2005 2 6 FKC Bail/Dipnets KC Cebidichthys violaceus CVIO 88 2005 2 6 FKC Bail/Dipnets KC Xiphister atropurpureus XATR 117 2005 2 6 FKC Bail/Dipnets KC Xiphister atropurpureus XATR 66 2005 2 6 FKC Bail/Dipnets KC Gobiesox maeandricus GMAE 119 2005 2 6 FKC Bail/Dipnets KC Gobiesox maeandricus GMAE 153 2005 2 6 FKC Bail/Dipnets KC Ascelicthys rhodorus ARHO 155 2005 2 6 FKC Bail/Dipnets KC Ascelicthys rhodorus ARHO 150 2005 2 6 FKC Bail/Dipnets KC Hemilepidotus spinosus HSPI 95 2005 2 6 FKC Bail/Dipnets KC Hemilepidotus spinosus HSPI 96
2005 2 6 FKC Bail/Dipnets KC Clinocottus globiceps CGLO 47 2005 2 5 DMN Mid Bail/Dipnets KC Bothragonus swanii BSWA 73 2005 2 6 FKC Bail/Dipnets KC Clinocottus globiceps CGLO 38
Fish Beach Seining Data
Date Site Species Code Species Code
Avg Of Total
Length Total No.
5 /20/2004 Gold Bluffs Beach ARHO Amphistichus rhodoterus 127.44 126
5 /20/2004 Gold Bluffs Beach ARHO Amphistichus rhodoterus 134.24 17
5 /21/2004 Crescent Beach ARHO Amphistichus rhodoterus 157.50 4
5 /21/2004 Crescent Beach ARHO Amphistichus rhodoterus 142.80 5
5 /21/2004 Crescent Beach ARHO Amphistichus rhodoterus 136.00 1
5 /21/2004 Crescent Beach ARHO Amphistichus rhodoterus 130.40 5
5 /21/2004 Crescent Beach ARHO Amphistichus rhodoterus 149.60 5
5 /21/2004 Crescent Beach ARHO Amphistichus rhodoterus 133.67 3
5 /21/2004 Crescent Beach CSTI Citharichthys stigmaeus 40.00 2
7 /15/2004 Gold Bluffs Beach ACAL Atherinopsis califoniensis 101.67 9
7 /15/2004 Gold Bluffs Beach ACAL Atherinopsis califoniensis 83.50 2
7 /15/2004 Gold Bluffs Beach ACAL Atherinopsis califoniensis 158.50 8
7 /15/2004 Gold Bluffs Beach ACAL Atherinopsis califoniensis 173.94 16
7 /15/2004 Gold Bluffs Beach ACAL Atherinopsis califoniensis 173.94 32
7 /15/2004 Gold Bluffs Beach ARHO Amphistichus rhodoterus 71.00 1
7 /15/2004 Gold Bluffs Beach ARHO Amphistichus rhodoterus 72.00 1
7 /15/2004 Gold Bluffs Beach ARHO Amphistichus rhodoterus 74.00 1

149
7 /15/2004 Gold Bluffs Beach HARG Hyperprosopon argenteum 56.50 2
7 /15/2004 Gold Bluffs Beach HARG Hyperprosopon argenteum 60.00 3
7 /15/2004 Gold Bluffs Beach HARG Hyperprosopon argenteum 57.00 1
7 /15/2004 Gold Bluffs Beach HARG Hyperprosopon argenteum 59.04 23
7 /15/2004 Gold Bluffs Beach HARG Hyperprosopon argenteum 59.00 2
7 /15/2004 Gold Bluffs Beach PMEL Psettichthys melanostictus 132.00 1
7 /18/2004 Crescent Beach ARHO Amphistichus rhodoterus 103.50 2
7 /18/2004 Crescent Beach ARHO Amphistichus rhodoterus 63.59 301
7 /18/2004 Crescent Beach ARHO Amphistichus rhodoterus 103.00 2
7 /18/2004 Crescent Beach ARHO Amphistichus rhodoterus 118.00 3
7 /18/2004 Crescent Beach LARM Leptocottus armatus 1360.00 1
7 /18/2004 Crescent Beach OTSH Oncorhynchus tshawytscha 104.00 1
7 /18/2004 Crescent Beach PMEL Psettichthys melanostictus 109.00 2
8 /18/2005 Crescent Beach ARHO Amphistichus rhodoterus 136.67 3
8 /18/2005 Crescent Beach ARHO Amphistichus rhodoterus 181.37 19
8 /18/2005 Crescent Beach ARHO Amphistichus rhodoterus 260.91 11
8 /18/2005 Crescent Beach ARHO Amphistichus rhodoterus 287.33 3
8 /18/2005 Crescent Beach ARHO Amphistichus rhodoterus 209.78 9
8 /18/2005 Crescent Beach HARG Hyperprosopon argenteum 120.14 21
8 /18/2005 Crescent Beach HARG Hyperprosopon argenteum 104.75 76
8 /18/2005 Crescent Beach HARG Hyperprosopon argenteum 99.00 7
8 /18/2005 Crescent Beach HARG Hyperprosopon argenteum 135.00 5
8 /19/2005 Gold Bluffs Beach ARHO Amphistichus rhodoterus 143.00 1
8 /19/2005 Gold Bluffs Beach ARHO Amphistichus rhodoterus 173.00 1
8 /19/2005 Gold Bluffs Beach ARHO Amphistichus rhodoterus 75.00 1
8 /19/2005 Gold Bluffs Beach ARHO Amphistichus rhodoterus 128.57 14
8 /19/2005 Gold Bluffs Beach HARG Hyperprosopon argenteum 67.81 16
8 /19/2005 Gold Bluffs Beach HARG Hyperprosopon argenteum 84.76 41

150
8 /19/2005 Gold Bluffs Beach HARG Hyperprosopon argenteum 74.30 73
8 /19/2005 Gold Bluffs Beach HARG Hyperprosopon argenteum 106.90 11
8 /19/2005 Gold Bluffs Beach HARG Hyperprosopon argenteum 71.50 2
8 /19/2005 Gold Bluffs Beach OTSH Oncorhynchus tshawytscha 93.00 1

151
APPENDIX I: TEMPERATURE DATA Mean daily temperature (degrees Celsius) data for False Klamath Cove (FKC), Damnation Creek (DMN) and Enderts Beach (END) from 4 July 2004 to 15 November 2005. Temperature was recorded with ONSET tidbit temperature loggers on a 15 minute intervals. # of temp readings is the number of readings that were used to calculate the daily mean. SE1 is one standard deviation. ND = no data. Temperatures have been corrected for low tides by removing all data recorded when Mean Low Low water levels were less than +3.0 feet.
DATE Site Mean_
MP_PST SE1_
pPST #_Temp
dings Site Mean_
MP_PST SE1_
pPST #_Temp
dings Site Mean_
MP_PST SE1_
pPST #_Temp
dings
7/4/2004 FKC ND ND ND DMN 12.81 0.12 43 END 12.97 0.09 85
7/5/2004 FKC ND ND ND DMN 12.32 0.11 42 END 12.69 0.12 84
7/6/2004 FKC ND ND ND DMN 11.77 0.14 42 END 11.91 0.16 84
7/7/2004 FKC ND ND ND DMN 10.55 0.13 41 END 11.11 0.12 82
7/8/2004 FKC ND ND ND DMN 10.36 0.21 44 END 10.72 0.15 89
7/9/2004 FKC ND ND ND DMN 11.47 0.07 44 END 12.87 0.13 87
7/10/2004 FKC ND ND ND DMN 11.65 0.14 44 END 12.56 0.13 88
7/11/2004 FKC ND ND ND DMN 12.86 0.11 47 END 12.87 0.10 95
7/12/2004 FKC ND ND ND DMN 13.02 0.06 53 END 13.87 0.06 105
7/13/2004 FKC ND ND ND DMN 13.67 0.11 50 END 14.26 0.07 100
7/14/2004 FKC ND ND ND DMN 13.76 0.08 50 END 14.51 0.05 99
7/15/2004 FKC ND ND ND DMN 13.65 0.12 50 END 14.99 0.09 99
7/16/2004 FKC ND ND ND DMN 13.43 0.06 50 END 13.94 0.08 100
7/17/2004 FKC ND ND ND DMN 15.11 0.16 50 END 14.57 0.09 100
7/18/2004 FKC ND ND ND DMN 15.41 0.11 50 END 16.30 0.03 101
7/19/2004 FKC ND ND ND DMN 14.66 0.10 51 END 16.23 0.08 101
7/20/2004 FKC ND ND ND DMN 14.09 0.10 47 END 15.33 0.09 93
7/21/2004 FKC ND ND ND DMN 14.45 0.14 45 END 14.83 0.04 90
7/22/2004 FKC ND ND ND DMN 14.86 0.05 43 END 15.49 0.01 86
7/23/2004 FKC ND ND ND DMN 14.99 0.06 43 END 15.71 0.04 85
7/24/2004 FKC ND ND ND DMN 14.71 0.03 45 END 15.76 0.02 89
7/25/2004 FKC ND ND ND DMN 14.85 0.03 46 END 15.36 0.04 90
7/26/2004 FKC ND ND ND DMN 14.62 0.03 46 END 15.12 0.02 94
7/27/2004 FKC ND ND ND DMN 14.38 0.04 53 END 15.13 0.03 106
7/28/2004 FKC ND ND ND DMN 14.25 0.03 52 END 14.99 0.02 104
7/29/2004 FKC ND ND ND DMN 13.68 0.04 49 END 14.28 0.04 98
7/30/2004 FKC ND ND ND DMN 13.33 0.05 47 END 13.94 0.04 95
7/31/2004 FKC 13.52 0.03 78 DMN 13.60 0.06 45 END 14.14 0.04 89
8/1/2004 FKC 13.85 0.06 85 DMN 13.52 0.03 43 END 14.41 0.06 85
8/2/2004 FKC 13.72 0.04 83 DMN 13.49 0.05 42 END 14.38 0.04 83
8/3/2004 FKC 14.47 0.17 81 DMN 13.18 0.08 41 END 14.77 0.08 81
8/4/2004 FKC 14.61 0.09 81 DMN 13.50 0.09 40 END 14.42 0.06 81
8/5/2004 FKC 14.05 0.10 81 DMN 14.04 0.12 41 END 14.43 0.09 81
8/6/2004 FKC 14.22 0.06 90 DMN 14.64 0.02 45 END 14.90 0.01 90
8/7/2004 FKC 13.37 0.06 94 DMN 13.61 0.07 47 END 14.64 0.08 94
8/8/2004 FKC 14.19 0.05 106 DMN 14.93 0.15 53 END 15.18 0.05 106
8/9/2004 FKC 14.65 0.04 108 DMN 14.95 0.03 54 END 15.48 0.04 108

152
8/10/2004 FKC 14.26 0.05 106 DMN 14.18 0.07 53 END 14.92 0.07 106
8/11/2004 FKC 14.54 0.03 104 DMN 14.49 0.02 52 END 15.11 0.03 104
8/12/2004 FKC 14.77 0.03 101 DMN 14.64 0.03 51 END 15.16 0.02 101
8/13/2004 FKC 14.88 0.02 101 DMN 14.67 0.03 51 END 15.20 0.02 101
8/14/2004 FKC 14.98 0.02 102 DMN 14.81 0.04 51 END 15.13 0.02 102
8/15/2004 FKC 15.53 0.07 92 DMN 15.02 0.06 46 END 15.36 0.04 92
8/16/2004 FKC 15.32 0.06 88 DMN 14.75 0.04 44 END 16.14 0.07 88
8/17/2004 FKC 14.83 0.03 85 DMN 14.17 0.08 42 END 15.36 0.09 85
8/18/2004 FKC 13.97 0.05 84 DMN 13.83 0.04 41 END 14.89 0.05 84
8/19/2004 FKC 14.37 0.04 83 DMN 14.52 0.07 42 END 14.83 0.05 83
8/20/2004 FKC 14.18 0.05 81 DMN 14.36 0.03 40 END 14.91 0.02 81
8/21/2004 FKC 13.89 0.03 87 DMN 14.04 0.02 43 END 14.83 0.03 87
8/22/2004 FKC 13.61 0.02 93 DMN 13.50 0.02 47 END 14.50 0.02 93
8/23/2004 FKC 13.96 0.02 104 DMN 13.57 0.02 53 END 14.29 0.02 104
8/24/2004 FKC 14.05 0.04 107 DMN 13.92 0.05 54 END 14.61 0.04 107
8/25/2004 FKC 13.78 0.02 106 DMN 13.81 0.03 53 END 14.50 0.02 106
8/26/2004 FKC 13.72 0.05 105 DMN 13.34 0.09 53 END 14.40 0.08 105
8/27/2004 FKC 13.27 0.07 101 DMN 13.00 0.10 50 END 13.51 0.08 101
8/28/2004 FKC 12.37 0.06 87 DMN 12.48 0.07 44 END 12.56 0.06 87
8/29/2004 FKC 12.50 0.06 83 DMN 13.00 0.12 42 END 12.86 0.07 83
8/30/2004 FKC 13.01 0.03 81 DMN 13.09 0.07 40 END 13.58 0.03 81
8/31/2004 FKC 13.85 0.05 80 DMN 13.73 0.13 40 END 14.01 0.05 80
9/1/2004 FKC 13.87 0.05 80 DMN 13.58 0.06 40 END 14.13 0.04 80
9/2/2004 FKC 12.76 0.04 81 DMN 12.05 0.06 41 END 12.85 0.05 81
9/3/2004 FKC 11.07 0.03 83 DMN 10.66 0.05 42 END 10.92 0.06 83
9/4/2004 FKC 10.77 0.07 94 DMN 10.54 0.07 47 END 10.35 0.08 94
9/5/2004 FKC 10.19 0.02 112 DMN 10.34 0.07 56 END 10.59 0.02 112
9/6/2004 FKC 10.77 0.02 110 DMN 11.19 0.08 55 END 11.48 0.06 110
9/7/2004 FKC 11.77 0.05 108 DMN 12.07 0.08 54 END 12.38 0.07 108
9/8/2004 FKC 12.29 0.06 107 DMN 11.72 0.07 54 END 12.73 0.04 107
9/9/2004 FKC 12.50 0.06 107 DMN 12.14 0.09 53 END 12.83 0.08 107
9/10/2004 FKC 12.87 0.05 105 DMN 13.51 0.09 52 END 14.07 0.08 105
9/11/2004 FKC 12.50 0.06 98 DMN 12.29 0.08 49 END 13.71 0.08 98
9/12/2004 FKC 12.42 0.15 89 DMN 11.88 0.06 45 END 12.86 0.05 89
9/13/2004 FKC 13.49 0.08 85 DMN 13.00 0.10 43 END 14.20 0.05 85
9/14/2004 FKC 11.05 0.05 83 DMN 10.46 0.09 42 END 11.05 0.08 83
9/15/2004 FKC 10.08 0.02 80 DMN 9.63 0.05 40 END 9.84 0.02 80
9/16/2004 FKC 10.55 0.06 80 DMN 10.56 0.11 41 END 10.56 0.06 80
9/17/2004 FKC 11.41 0.05 81 DMN 11.61 0.05 41 END 11.69 0.06 81
9/18/2004 FKC 11.04 0.05 83 DMN 11.42 0.04 42 END 12.12 0.03 83
9/19/2004 FKC 11.24 0.06 92 DMN 11.56 0.04 46 END 12.42 0.03 92
9/20/2004 FKC 11.97 0.05 109 DMN 11.47 0.06 55 END 12.74 0.02 109
9/21/2004 FKC 11.61 0.07 108 DMN 11.28 0.11 54 END 11.99 0.08 108
9/22/2004 FKC 11.84 0.07 107 DMN 11.79 0.09 54 END 12.57 0.08 107
9/23/2004 FKC 12.35 0.08 107 DMN 12.23 0.11 53 END 12.93 0.07 107
9/24/2004 FKC 12.11 0.04 108 DMN 12.42 0.06 54 END 13.39 0.02 108
9/25/2004 FKC 12.26 0.03 88 DMN 12.19 0.05 44 END 13.46 0.02 88
9/26/2004 FKC 12.48 0.07 82 DMN 11.75 0.05 41 END 13.15 0.05 82
9/27/2004 FKC 12.51 0.07 80 DMN 12.24 0.07 40 END 13.44 0.02 80
9/28/2004 FKC 12.39 0.05 80 DMN 12.64 0.04 39 END 13.35 0.01 80

153
9/29/2004 FKC 12.25 0.07 80 DMN 12.54 0.04 40 END 13.35 0.02 80
9/30/2004 FKC 12.07 0.04 81 DMN 12.16 0.05 40 END 13.25 0.01 81
10/1/2004 FKC 12.29 0.05 85 DMN 12.27 0.05 42 END 13.36 0.02 85
10/2/2004 FKC 12.60 0.03 89 DMN 12.46 0.04 45 END 13.37 0.03 89
10/3/2004 FKC 12.76 0.04 107 DMN 12.26 0.05 54 END 13.00 0.05 107
10/4/2004 FKC 12.61 0.03 109 DMN 12.62 0.03 55 END 13.19 0.02 109
10/5/2004 FKC 12.64 0.01 108 DMN 12.05 0.02 54 END 12.92 0.04 108
10/6/2004 FKC 12.84 0.03 109 DMN 12.46 0.05 54 END 12.74 0.03 109
10/7/2004 FKC 12.03 0.03 108 DMN 12.12 0.03 54 END 12.96 0.03 108
10/8/2004 FKC 12.02 0.03 109 DMN 12.02 0.03 54 END 13.11 0.02 109
10/9/2004 FKC 11.94 0.02 110 DMN 11.86 0.03 55 END 13.08 0.02 110
10/10/2004 FKC 11.74 0.02 89 DMN 11.35 0.04 44 END 12.45 0.03 89
10/11/2004 FKC 11.33 0.05 85 DMN 11.26 0.08 43 END 11.46 0.06 85
10/12/2004 FKC 11.22 0.04 82 DMN 11.53 0.05 41 END 11.87 0.06 82
10/13/2004 FKC 11.44 0.06 82 DMN 11.37 0.06 42 END 11.34 0.06 82
10/14/2004 FKC 11.88 0.04 81 DMN 11.60 0.04 41 END 12.09 0.04 81
10/15/2004 FKC 11.72 0.04 83 DMN 11.92 0.04 42 END 12.32 0.03 83
10/16/2004 FKC 11.81 0.01 86 DMN 12.01 0.00 43 END 12.42 0.01 86
10/17/2004 FKC 11.79 0.02 91 DMN 11.84 0.02 46 END 12.29 0.01 91
10/18/2004 FKC 11.75 0.01 106 DMN 11.36 0.02 53 END 11.86 0.01 106
10/19/2004 FKC 11.98 0.00 106 DMN 11.48 0.02 53 END 11.94 0.01 106
10/20/2004 FKC 11.85 0.01 106 DMN 11.58 0.02 53 END 11.99 0.02 106
10/21/2004 FKC 11.89 0.02 108 DMN 11.70 0.03 54 END 11.84 0.01 108
10/22/2004 FKC 11.79 0.01 109 DMN 11.44 0.01 54 END 11.92 0.01 109
10/23/2004 FKC 11.88 0.02 95 DMN 11.56 0.03 48 END 12.14 0.03 95
10/24/2004 FKC 11.63 0.02 86 DMN 11.35 0.03 43 END 12.01 0.03 86
10/25/2004 FKC 11.53 0.00 82 DMN 11.15 0.00 41 END 11.72 0.01 82
10/26/2004 FKC 11.60 0.01 81 DMN 11.15 0.00 41 END 11.57 0.01 81
10/27/2004 FKC 11.61 0.01 83 DMN 11.13 0.02 41 END 11.47 0.02 83
10/28/2004 FKC 11.69 0.02 85 DMN 11.23 0.02 42 END 11.72 0.01 85
10/29/2004 FKC 11.83 0.01 90 DMN 11.36 0.03 45 END 11.89 0.01 90
10/30/2004 FKC 11.84 0.03 97 DMN 11.54 0.03 49 END 12.05 0.01 97
10/31/2004 FKC 11.69 0.01 102 DMN 11.27 0.02 54 END 11.66 0.02 102
11/1/2004 FKC 11.70 0.02 103 DMN 11.46 0.03 52 END 11.71 0.02 103
11/2/2004 FKC 11.63 0.01 106 DMN 11.52 0.02 53 END 11.85 0.01 106
11/3/2004 FKC 11.59 0.01 107 DMN 11.32 0.02 53 END 11.74 0.01 107
11/4/2004 FKC 10.70 0.01 108 DMN 10.42 0.02 54 END 10.38 0.01 108
11/5/2004 FKC 10.75 0.01 109 DMN 10.52 0.03 54 END 10.78 0.02 109
11/6/2004 FKC 10.78 0.02 112 DMN 10.63 0.02 56 END 11.08 0.03 112
11/7/2004 FKC 10.55 0.01 101 DMN 10.61 0.02 51 END 10.94 0.01 101
11/8/2004 FKC 10.71 0.01 92 DMN 10.57 0.00 46 END 10.88 0.00 92
11/9/2004 FKC 10.77 0.01 84 DMN 10.58 0.01 42 END 10.98 0.01 84
11/10/2004 FKC 10.83 0.02 84 DMN 10.61 0.02 42 END 11.07 0.01 84
11/11/2004 FKC 10.82 0.02 84 DMN 10.56 0.03 42 END 10.86 0.01 84
11/12/2004 FKC 10.72 0.01 87 DMN 10.43 0.02 44 END 10.89 0.01 87
11/13/2004 FKC 10.67 0.01 91 DMN 10.52 0.02 45 END 10.96 0.01 91
11/14/2004 FKC 10.64 0.01 101 DMN 10.39 0.02 50 END 10.98 0.01 101
11/15/2004 FKC 10.68 0.01 100 DMN 10.57 0.00 50 END 11.08 0.01 100
11/16/2004 FKC 10.54 0.02 105 DMN 10.57 0.00 53 END 11.07 0.01 105
11/17/2004 FKC 10.34 0.02 107 DMN 10.41 0.02 54 END 10.91 0.01 107

154
11/18/2004 FKC 10.41 0.01 107 DMN 10.38 0.02 54 END 10.82 0.02 107
11/19/2004 FKC 10.31 0.01 111 DMN 10.05 0.02 56 END 10.33 0.02 111
11/20/2004 FKC 10.11 0.01 99 DMN 9.62 0.03 49 END 9.89 0.04 99
11/21/2004 FKC 10.13 0.01 92 DMN 9.54 0.03 46 END 9.99 0.02 92
11/22/2004 FKC 10.14 0.01 88 DMN 9.68 0.02 44 END 10.09 0.03 88
11/23/2004 FKC 10.13 0.01 84 DMN 9.88 0.02 42 END 10.24 0.01 84
11/24/2004 FKC 10.08 0.01 87 DMN 10.03 0.03 43 END 10.27 0.01 87
11/25/2004 FKC 10.18 0.01 94 DMN 10.15 0.02 47 END 10.46 0.01 94
11/26/2004 FKC 10.17 0.01 103 DMN 10.00 0.00 51 END 10.40 0.01 103
11/27/2004 FKC 10.02 0.01 103 DMN 9.87 0.02 51 END 10.16 0.01 103
11/28/2004 FKC 9.75 0.01 102 DMN 9.51 0.02 51 END 9.56 0.01 102
11/29/2004 FKC 9.45 0.01 102 DMN 9.14 0.03 51 END 9.52 0.02 102
11/30/2004 FKC 9.32 0.01 102 DMN 9.15 0.03 51 END 9.59 0.01 102
12/1/2004 FKC 9.40 0.01 105 DMN 9.26 0.02 53 END 9.36 0.02 105
12/2/2004 FKC 9.25 0.01 107 DMN 8.99 0.02 53 END 9.31 0.02 107
12/3/2004 FKC 9.22 0.01 109 DMN 8.86 0.02 55 END 9.16 0.01 109
12/4/2004 FKC 9.18 0.01 111 DMN 8.81 0.01 56 END 9.17 0.00 111
12/5/2004 FKC 9.42 0.01 115 DMN 9.02 0.02 57 END 9.22 0.01 115
12/6/2004 FKC 9.30 0.01 100 DMN 8.96 0.02 50 END 9.24 0.02 100
12/7/2004 FKC 9.51 0.00 95 DMN 9.32 0.02 48 END 9.57 0.01 95
12/8/2004 FKC 9.77 0.02 89 DMN 9.56 0.03 44 END 9.89 0.01 89
12/9/2004 FKC 10.33 0.01 92 DMN 10.02 0.01 45 END 10.34 0.01 92
12/10/2004 FKC 10.49 0.01 98 DMN 10.14 0.02 49 END 10.37 0.01 98
12/11/2004 FKC 10.65 0.01 102 DMN 10.38 0.02 51 END 10.56 0.01 102
12/12/2004 FKC 10.75 0.00 88 DMN 10.53 0.01 50 END 10.64 0.01 101
12/13/2004 FKC 10.84 0.01 101 DMN 10.70 0.02 51 END 10.99 0.01 101
12/14/2004 FKC 10.99 0.01 101 DMN 10.86 0.00 50 END 11.09 0.01 101
12/15/2004 FKC 11.00 0.01 104 DMN 10.75 0.02 52 END 10.97 0.01 104
12/16/2004 FKC 10.81 0.01 108 DMN 10.38 0.04 54 END 10.59 0.02 108
12/17/2004 FKC 10.76 0.00 110 DMN 10.57 0.00 55 END 10.84 0.01 110
12/18/2004 FKC 10.79 0.01 102 DMN 10.69 0.02 51 END 10.97 0.01 102
12/19/2004 FKC 10.67 0.03 96 DMN 10.56 0.02 49 END 10.82 0.01 96
12/20/2004 FKC 10.72 0.01 96 DMN 10.48 0.02 48 END 10.74 0.01 96
12/21/2004 FKC 10.69 0.01 93 DMN 10.51 0.02 46 END 10.50 0.02 93
12/22/2004 FKC 10.79 0.01 106 DMN 10.33 0.02 53 END 10.38 0.02 106
12/23/2004 FKC 10.63 0.01 104 DMN 10.11 0.02 52 END 10.41 0.01 104
12/24/2004 FKC 10.52 0.01 103 DMN 10.00 0.03 52 END 10.08 0.03 103
12/25/2004 FKC 10.40 0.01 103 DMN 10.12 0.02 52 END 10.42 0.00 103
12/26/2004 FKC 10.47 0.01 102 DMN 10.26 0.01 51 END 10.35 0.01 102
12/27/2004 FKC 10.43 0.01 103 DMN 10.25 0.01 51 END 10.40 0.00 103
12/28/2004 FKC 10.39 0.01 103 DMN 9.92 0.02 52 END 10.20 0.01 103
12/29/2004 FKC 10.27 0.02 104 DMN 9.90 0.04 52 END 10.17 0.01 104
12/30/2004 FKC 10.35 0.01 105 DMN 10.07 0.02 53 END 10.13 0.02 105
12/31/2004 FKC 10.18 0.01 107 DMN 9.80 0.02 54 END 10.10 0.00 107
1/1/2005 FKC 10.14 0.01 111 DMN 9.80 0.02 55 END 9.88 0.02 111
1/2/2005 FKC 10.56 0.02 115 DMN 10.01 0.04 57 END 10.00 0.02 115
1/3/2005 FKC 10.53 0.01 103 DMN 9.74 0.05 51 END 9.92 0.03 103
1/4/2005 FKC 10.15 0.02 102 DMN 9.58 0.05 51 END 9.61 0.04 102
1/5/2005 FKC 10.40 0.01 103 DMN 9.87 0.02 51 END 9.80 0.02 103
1/6/2005 FKC 10.34 0.01 104 DMN 9.77 0.02 52 END 9.89 0.02 104

155
1/7/2005 FKC 10.35 0.03 102 DMN 9.75 0.03 51 END 9.76 0.01 102
1/8/2005 FKC 9.84 0.01 101 DMN 9.50 0.02 50 END 9.61 0.01 101
1/9/2005 FKC 9.87 0.01 101 DMN 9.62 0.03 51 END 9.58 0.01 101
1/10/2005 FKC 10.10 0.01 101 DMN 9.92 0.02 50 END 9.80 0.01 101
1/11/2005 FKC 10.04 0.02 102 DMN 9.79 0.04 51 END 9.87 0.02 102
1/12/2005 FKC 10.03 0.03 101 DMN 9.57 0.05 51 END 10.41 0.02 101
1/13/2005 FKC 9.82 0.02 96 DMN 9.57 0.15 2 END 9.40 0.04 96
1/14/2005 FKC 9.86 0.03 93 DMN ND ND 0 END 9.56 0.02 93
1/15/2005 FKC 10.06 0.02 93 DMN ND ND 0 END 9.92 0.01 93
1/16/2005 FKC 10.62 0.02 95 DMN ND ND 0 END 10.21 0.02 95
1/17/2005 FKC 10.70 0.01 98 DMN ND ND 0 END 10.44 0.01 98
1/18/2005 FKC 10.80 0.01 107 DMN ND ND 0 END 10.76 0.01 107
1/19/2005 FKC 10.83 0.01 105 DMN ND ND 0 END 10.75 0.01 105
1/20/2005 FKC 10.89 0.00 103 DMN ND ND 0 END 10.88 0.00 103
1/21/2005 FKC 10.65 0.02 103 DMN ND ND 0 END 10.49 0.03 103
1/22/2005 FKC 10.73 0.01 102 DMN ND ND 0 END 10.61 0.01 102
1/23/2005 FKC 11.09 0.01 103 DMN ND ND 0 END 10.92 0.01 103
1/24/2005 FKC 11.21 0.01 104 DMN ND ND 0 END 11.22 0.01 104
1/25/2005 FKC 11.22 0.00 104 DMN ND ND 0 END 11.04 0.03 104
1/26/2005 FKC 11.27 0.01 106 DMN ND ND 0 END 11.13 0.01 106
1/27/2005 FKC 11.41 0.01 106 DMN ND ND 0 END 11.19 0.01 106
1/28/2005 FKC 11.45 0.01 108 DMN ND ND 0 END 11.21 0.01 108
1/29/2005 FKC 11.44 0.01 99 DMN ND ND 0 END 11.20 0.01 99
1/30/2005 FKC 11.24 0.03 97 DMN ND ND 0 END 11.42 0.01 97
1/31/2005 FKC 11.39 0.01 95 DMN ND ND 0 END 11.36 0.02 95
2/1/2005 FKC 11.32 0.01 99 DMN ND ND 0 END 11.59 0.03 99
2/2/2005 FKC 11.20 0.00 108 DMN ND ND 0 END 11.57 0.01 108
2/3/2005 FKC 11.09 0.01 103 DMN ND ND 0 END 11.15 0.01 103
2/4/2005 FKC 11.11 0.01 101 DMN ND ND 0 END 11.04 0.00 101
2/5/2005 FKC 11.33 0.01 101 DMN 10.94 0.03 15 END 11.26 0.02 101
2/6/2005 FKC 10.98 0.03 101 DMN 10.72 0.04 51 END 11.19 0.02 101
2/7/2005 FKC 10.96 0.02 102 DMN 10.89 0.04 51 END 11.02 0.02 102
2/8/2005 FKC 10.99 0.01 96 DMN 10.75 0.03 49 END 10.85 0.02 96
2/9/2005 FKC 10.90 0.02 89 DMN 10.73 0.02 44 END 10.75 0.02 89
2/10/2005 FKC 11.03 0.01 86 DMN 10.74 0.04 44 END 10.90 0.02 86
2/11/2005 FKC 10.89 0.01 86 DMN 10.83 0.04 43 END 10.87 0.02 86
2/12/2005 FKC 11.05 0.00 86 DMN 11.02 0.02 44 END 11.11 0.01 86
2/13/2005 FKC 11.06 0.01 88 DMN 11.15 0.00 44 END 11.17 0.01 88
2/14/2005 FKC 10.89 0.02 93 DMN 10.91 0.02 46 END 11.18 0.02 93
2/15/2005 FKC 10.87 0.01 108 DMN 10.73 0.03 54 END 10.94 0.01 108
2/16/2005 FKC 10.88 0.02 104 DMN 10.76 0.03 52 END 10.82 0.02 104
2/17/2005 FKC 11.10 0.02 102 DMN 10.93 0.04 51 END 11.06 0.04 102
2/18/2005 FKC 11.20 0.01 102 DMN 11.23 0.02 51 END 11.28 0.01 102
2/19/2005 FKC 11.26 0.02 103 DMN 11.32 0.03 51 END 11.38 0.02 103
2/20/2005 FKC 11.23 0.01 103 DMN 11.33 0.02 51 END 11.43 0.01 103
2/21/2005 FKC 11.29 0.01 104 DMN 11.32 0.03 52 END 11.38 0.02 104
2/22/2005 FKC 11.49 0.02 106 DMN 11.47 0.03 53 END 11.54 0.02 106
2/23/2005 FKC 11.47 0.01 95 DMN 11.58 0.02 47 END 11.66 0.01 95
2/24/2005 FKC 11.44 0.01 90 DMN 11.48 0.02 45 END 11.63 0.01 90
2/25/2005 FKC 11.49 0.01 88 DMN 11.49 0.02 44 END 11.61 0.01 88

156
2/26/2005 FKC 11.59 0.02 86 DMN 11.33 0.03 43 END 11.49 0.01 86
2/27/2005 FKC 11.62 0.01 87 DMN 11.67 0.02 43 END 11.61 0.01 87
2/28/2005 FKC 11.83 0.02 88 DMN 11.83 0.02 44 END 11.76 0.02 88
3/1/2005 FKC 11.81 0.01 91 DMN 11.72 0.00 45 END 11.71 0.01 91
3/2/2005 FKC 11.97 0.01 105 DMN 11.91 0.02 52 END 11.88 0.02 105
3/3/2005 FKC 11.99 0.02 101 DMN 12.05 0.03 50 END 12.00 0.02 101
3/4/2005 FKC 11.91 0.01 99 DMN 12.02 0.00 49 END 12.13 0.02 99
3/5/2005 FKC 11.88 0.01 99 DMN 11.98 0.01 50 END 11.89 0.02 99
3/6/2005 FKC 11.92 0.01 100 DMN 12.02 0.00 50 END 12.05 0.03 100
3/7/2005 FKC 12.05 0.01 102 DMN 12.18 0.04 51 END 12.11 0.01 102
3/8/2005 FKC 12.05 0.01 91 DMN 12.32 0.04 46 END 12.30 0.02 91
3/9/2005 FKC 12.14 0.02 85 DMN 12.34 0.04 42 END 12.49 0.02 85
3/10/2005 FKC 12.19 0.01 81 DMN 12.53 0.04 40 END 12.63 0.01 81
3/11/2005 FKC 12.16 0.01 81 DMN 12.60 0.03 41 END 12.65 0.02 81
3/12/2005 FKC 12.17 0.01 81 DMN 12.79 0.03 41 END 12.81 0.02 81
3/13/2005 FKC 12.37 0.02 83 DMN 13.06 0.05 42 END 13.02 0.02 83
3/14/2005 FKC 12.69 0.06 86 DMN 13.10 0.08 43 END 12.93 0.03 86
3/15/2005 FKC 12.24 0.03 97 DMN 12.69 0.03 49 END 13.11 0.02 97
3/16/2005 FKC 12.00 0.01 102 DMN 12.41 0.04 51 END 12.65 0.02 102
3/17/2005 FKC 11.97 0.02 100 DMN 12.46 0.06 50 END 12.53 0.03 100
3/18/2005 FKC 12.35 0.04 100 DMN 12.78 0.04 50 END 12.79 0.04 100
3/19/2005 FKC 12.30 0.01 100 DMN 12.50 0.03 50 END 12.54 0.02 100
3/20/2005 FKC 12.39 0.01 102 DMN 12.03 0.00 51 END 12.29 0.00 102
3/21/2005 FKC 12.16 0.01 103 DMN 12.03 0.00 51 END 12.20 0.01 103
3/22/2005 FKC 12.22 0.01 93 DMN 12.03 0.00 46 END 12.16 0.01 93
3/23/2005 FKC 12.01 0.01 87 DMN 12.02 0.01 43 END 12.22 0.01 87
3/24/2005 FKC 11.91 0.03 84 DMN 11.65 0.05 42 END 11.72 0.03 84
3/25/2005 FKC 11.95 0.01 82 DMN 11.71 0.04 41 END 11.69 0.02 82
3/26/2005 FKC 11.66 0.02 82 DMN 11.69 0.02 41 END 11.75 0.01 82
3/27/2005 FKC 11.68 0.01 80 DMN 11.73 0.01 40 END 11.85 0.01 80
3/28/2005 FKC 11.92 0.02 82 DMN 11.86 0.02 41 END 11.87 0.01 82
3/29/2005 FKC 11.91 0.02 86 DMN 11.90 0.02 43 END 12.01 0.02 86
3/30/2005 FKC 11.94 0.01 95 DMN 11.82 0.02 47 END 12.07 0.01 95
3/31/2005 FKC 12.00 ND 53 DMN 12.36 0.09 49 END 12.37 0.03 98
4/1/2005 FKC 12.11 0.04 16 DMN 12.20 0.04 48 END 12.29 0.01 96
4/2/2005 FKC 11.93 0.06 16 DMN 12.19 0.04 48 END 12.08 0.01 97
4/3/2005 FKC 11.73 0.04 15 DMN 11.81 0.03 46 END 11.80 0.01 99
4/4/2005 FKC 11.81 0.07 17 DMN 11.62 0.05 51 END 11.75 0.03 102
4/5/2005 FKC 12.07 0.06 13 DMN 12.03 0.05 43 END 12.07 0.03 85
4/6/2005 FKC 12.09 0.05 14 DMN 12.22 0.04 41 END 12.29 0.02 81
4/7/2005 FKC 12.10 0.05 12 DMN 12.06 0.02 39 END 12.32 0.01 78
4/8/2005 FKC 12.03 0.03 13 DMN 11.97 0.02 40 END 11.98 0.01 78
4/9/2005 FKC 12.14 0.04 12 DMN 12.09 0.03 39 END 12.13 0.02 78
4/10/2005 FKC 11.99 0.03 14 DMN 12.12 0.03 40 END 12.19 0.02 81
4/11/2005 FKC 12.05 0.05 14 DMN 12.27 0.05 41 END 12.27 0.03 19
4/12/2005 FKC 12.03 0.04 15 DMN 12.19 0.04 45 END 12.32 0.05 30
4/13/2005 FKC 11.67 0.04 17 DMN 11.80 0.02 50 END 11.90 0.03 33
4/14/2005 FKC 11.55 0.07 17 DMN 11.74 0.03 49 END 11.91 0.04 33
4/15/2005 FKC 12.08 0.12 16 DMN 12.05 0.09 48 END 12.11 0.06 32
4/16/2005 FKC 11.80 0.03 17 DMN 12.01 0.01 48 END 12.21 0.02 33

157
4/17/2005 FKC 11.76 0.09 17 DMN 11.94 0.05 49 END 12.15 0.08 33
4/18/2005 FKC 11.41 0.05 17 DMN 11.65 0.03 51 END 11.69 0.05 34
4/19/2005 FKC 10.68 0.10 15 DMN 11.14 0.05 45 END 11.09 0.12 29
4/20/2005 FKC 10.75 0.24 13 DMN 11.06 0.13 42 END 10.84 0.16 27
4/21/2005 FKC 10.98 0.07 13 DMN 11.43 0.05 39 END 11.41 0.14 27
4/22/2005 FKC 11.19 0.12 13 DMN 11.68 0.05 39 END 11.57 0.09 26
4/23/2005 FKC 11.11 0.10 12 DMN 11.55 0.04 39 END 11.86 0.03 25
4/24/2005 FKC 11.29 0.07 14 DMN 12.09 0.10 40 END 11.80 0.07 27
4/25/2005 FKC 12.29 0.30 14 DMN 12.95 0.16 39 END 12.73 0.17 27
4/26/2005 FKC 12.20 0.16 15 DMN 12.58 0.13 42 END 12.49 0.13 28
4/27/2005 FKC 11.44 0.06 16 DMN 11.86 0.06 45 END 12.17 0.04 31
4/28/2005 FKC 11.78 0.13 16 DMN 12.39 0.06 49 END 12.39 0.12 32
4/29/2005 FKC 12.03 0.15 16 DMN 12.82 0.07 48 END 12.98 0.08 32
4/30/2005 FKC 11.73 0.08 16 DMN 12.33 0.05 49 END 12.52 0.07 32
5/1/2005 FKC 12.74 0.24 16 DMN 13.09 0.03 67 END 12.26 0.07 31
5/2/2005 FKC 12.13 0.14 15 DMN 12.24 0.04 91 END 12.54 0.11 31
5/3/2005 FKC 11.84 0.11 14 DMN 12.28 0.10 82 END 12.23 0.12 28
5/4/2005 FKC 12.57 0.11 13 DMN 12.75 0.07 78 END 13.16 0.03 27
5/5/2005 FKC 12.56 0.06 13 DMN 12.16 0.02 77 END 12.66 0.07 27
5/6/2005 FKC 12.89 0.15 13 DMN 12.83 0.08 77 END 12.46 0.11 26
5/7/2005 FKC 12.69 0.09 13 DMN 13.30 0.04 78 END 13.06 0.08 26
5/8/2005 FKC 13.01 0.09 14 DMN 13.14 0.08 81 END 13.62 0.07 28
5/9/2005 FKC 13.20 0.07 13 DMN 13.39 0.01 86 END 13.52 0.05 28
5/10/2005 FKC 13.42 0.09 16 DMN 13.44 0.02 92 END 13.35 0.04 31
5/11/2005 FKC 14.45 0.30 16 DMN 13.91 0.07 97 END 14.23 0.14 32
5/12/2005 FKC 14.87 0.24 16 DMN 14.41 0.12 97 END 14.43 0.09 33
5/13/2005 FKC 14.97 0.31 16 DMN 14.60 0.09 96 END 14.59 0.12 32
5/14/2005 FKC 15.03 0.19 16 DMN 15.22 0.05 96 END 15.20 0.13 32
5/15/2005 FKC 14.28 0.07 17 DMN 14.79 0.05 98 END 14.96 0.03 33
5/16/2005 FKC 13.97 0.06 17 DMN 14.22 0.03 100 END 14.54 0.06 34
5/17/2005 FKC 13.48 0.10 16 DMN 14.05 0.03 92 END 14.25 0.06 31
5/18/2005 FKC 13.38 0.10 14 DMN 13.68 0.02 82 END 13.77 0.02 28
5/19/2005 FKC 14.22 0.08 13 DMN 14.24 0.05 79 END 14.26 0.09 26
5/20/2005 FKC 14.31 0.09 14 DMN 14.35 0.02 78 END 14.15 0.03 27
5/21/2005 FKC 14.22 0.07 13 DMN 14.80 0.04 79 END 14.59 0.11 27
5/22/2005 FKC 14.23 0.03 14 DMN 14.29 0.04 81 END 14.66 0.08 27
5/23/2005 FKC 13.97 0.09 13 DMN 14.13 0.04 83 END 14.03 0.08 27
5/24/2005 FKC 13.48 0.13 15 DMN 13.82 0.06 87 END 13.50 0.08 30
5/25/2005 FKC 13.34 0.21 16 DMN 14.94 0.17 91 END 14.47 0.25 31
5/26/2005 FKC 14.80 0.20 16 DMN 15.24 0.06 96 END 15.74 0.09 32
5/27/2005 FKC 14.13 0.24 16 DMN 14.20 0.04 96 END 15.11 0.04 32
5/28/2005 FKC 13.77 0.14 16 DMN 14.57 0.12 97 END 14.41 0.12 33
5/29/2005 FKC 13.53 0.21 14 DMN 13.32 0.09 91 END 14.81 0.22 29
5/30/2005 FKC 13.15 0.18 16 DMN 12.81 0.06 91 END 13.00 0.13 31
5/31/2005 FKC 12.10 0.10 13 DMN 12.46 0.05 85 END 12.46 0.10 28
6/1/2005 FKC 11.20 0.15 13 DMN 11.11 0.06 78 END 11.03 0.18 26
6/2/2005 FKC 10.08 0.12 13 DMN 10.25 0.06 76 END 10.01 0.19 26
6/3/2005 FKC 10.44 0.29 13 DMN 10.23 0.06 78 END 9.85 0.12 26
6/4/2005 FKC 10.87 0.27 14 DMN 10.76 0.11 82 END 10.31 0.12 28
6/5/2005 FKC 11.10 0.20 15 DMN 11.66 0.10 88 END 11.00 0.16 29

158
6/6/2005 FKC 10.67 0.12 16 DMN 11.67 0.04 98 END 11.65 0.03 33
6/7/2005 FKC 11.86 0.20 16 DMN 12.50 0.08 97 END 12.34 0.10 32
6/8/2005 FKC 12.11 0.27 16 DMN 12.87 0.09 97 END 13.58 0.14 32
6/9/2005 FKC 12.85 0.25 16 DMN 13.72 0.11 97 END 14.63 0.14 33
6/10/2005 FKC 12.95 0.24 17 DMN 12.48 0.07 98 END 12.45 0.11 33
6/11/2005 FKC 11.10 0.15 16 DMN 11.09 0.07 98 END 10.46 0.13 32
6/12/2005 FKC 10.14 0.26 16 DMN 10.07 0.09 99 END 9.55 0.12 33
6/13/2005 FKC 10.01 0.30 17 DMN 10.15 0.09 100 END 9.28 0.12 33
6/14/2005 FKC 9.50 0.24 16 DMN 9.74 0.08 98 END 9.54 0.15 31
6/15/2005 FKC 10.57 0.51 15 DMN 10.96 0.19 87 END 10.70 0.23 29
6/16/2005 FKC 10.99 0.15 14 DMN 11.70 0.09 84 END 11.87 0.04 27
6/17/2005 FKC 10.62 0.08 14 DMN 10.84 0.04 82 END 10.45 0.02 28
6/18/2005 FKC 11.12 0.03 14 DMN 11.31 0.03 84 END 11.08 0.09 29
6/19/2005 FKC 11.81 0.18 14 DMN 11.81 0.05 89 END 11.72 0.07 29
6/20/2005 FKC 13.02 0.31 16 DMN 12.99 0.07 93 END 12.45 0.13 32
6/21/2005 FKC 13.03 0.23 17 DMN 13.72 0.05 98 END 13.39 0.13 33
6/22/2005 FKC 13.33 0.23 17 DMN 13.41 0.10 96 END 13.57 0.07 33
6/23/2005 FKC 13.04 0.22 15 DMN 13.80 0.13 90 END 13.28 0.13 30
6/24/2005 FKC 12.71 0.12 15 DMN 13.73 0.02 88 END 13.59 0.07 30
6/25/2005 FKC 13.01 0.06 15 DMN 13.69 0.08 87 END 13.83 0.04 30
6/26/2005 FKC 13.23 0.10 14 DMN 13.68 0.03 82 END 13.98 0.04 27
6/27/2005 FKC 13.40 0.29 14 DMN 13.43 0.09 89 END 14.13 0.13 28
6/28/2005 FKC 12.82 0.30 15 DMN 12.77 0.06 87 END 12.64 0.10 28
6/29/2005 FKC 12.35 0.23 14 DMN 13.01 0.06 84 END 12.53 0.17 28
6/30/2005 FKC 12.81 0.25 13 DMN 14.25 0.09 85 END 13.76 0.08 28
7/1/2005 FKC 12.29 0.06 15 DMN 13.91 0.09 86 END 13.11 0.06 30
7/2/2005 FKC 12.70 0.17 17 DMN 12.82 0.10 100 END 12.44 0.12 34
7/3/2005 FKC 12.95 0.18 17 DMN 12.94 0.07 99 END 13.14 0.16 33
7/4/2005 FKC 13.54 0.20 16 DMN 13.84 0.04 99 END 13.70 0.09 33
7/5/2005 FKC 13.44 0.20 16 DMN 13.06 0.10 99 END 14.07 0.09 33
7/6/2005 FKC 13.12 0.30 17 DMN 12.08 0.10 98 END 12.97 0.20 33
7/7/2005 FKC 12.18 0.37 16 DMN 11.72 0.12 99 END 13.18 0.20 33
7/8/2005 FKC 11.94 0.38 17 DMN 12.84 0.18 100 END 12.85 0.19 33
7/9/2005 FKC 13.28 0.47 16 DMN 14.25 0.09 100 END 14.36 0.05 33
7/10/2005 FKC 12.48 0.21 17 DMN 14.43 0.05 102 END 14.61 0.06 34
7/11/2005 FKC 14.36 0.36 17 DMN 15.15 0.09 93 END 15.74 0.21 32
7/12/2005 FKC 13.52 0.15 14 DMN 12.98 0.08 91 END 14.07 0.24 28
7/13/2005 FKC 11.47 0.22 15 DMN 11.69 0.11 92 END 11.56 0.09 30
7/14/2005 FKC 11.18 0.29 15 DMN 13.43 0.17 90 END 11.89 0.31 30
7/15/2005 FKC 12.85 0.21 16 DMN 14.37 0.11 90 END 13.62 0.18 31
7/16/2005 FKC 13.01 0.06 17 DMN 14.55 0.10 97 END 13.16 0.12 33
7/17/2005 FKC 13.63 0.16 17 DMN 15.55 0.18 101 END 14.26 0.18 34
7/18/2005 FKC 14.18 0.26 16 DMN 17.38 0.14 98 END 16.40 0.26 33
7/19/2005 FKC 14.93 0.14 17 DMN 16.33 0.05 98 END 15.53 0.08 33
7/20/2005 FKC 15.05 0.09 17 DMN 16.15 0.05 99 END 15.73 0.13 33
7/21/2005 FKC 14.59 0.15 15 DMN 15.87 0.04 89 END 15.82 0.08 30
7/22/2005 FKC 13.36 0.18 23 DMN 15.24 0.04 86 END 15.08 0.06 29
7/23/2005 FKC 11.84 0.08 27 DMN 14.90 0.02 83 END 15.50 0.38 35
7/24/2005 FKC 12.20 0.11 27 DMN 14.56 0.12 54 END 14.59 0.14 27
7/25/2005 FKC 12.25 0.07 26 DMN 14.57 0.10 80 END 14.02 0.11 26

159
7/26/2005 FKC 12.41 0.08 29 DMN 14.51 0.04 84 END 14.80 0.18 29
7/27/2005 FKC 13.04 0.06 30 DMN 14.78 0.04 88 END 14.84 0.06 30
7/28/2005 FKC 12.79 0.09 30 DMN 14.86 0.10 90 END 14.35 0.13 30
7/29/2005 FKC 13.06 0.03 33 DMN 15.30 0.04 100 END 14.78 0.07 33
7/30/2005 FKC 13.36 0.07 36 DMN 15.32 0.03 106 END 15.08 0.07 36
7/31/2005 FKC 13.47 0.04 34 DMN 15.50 0.03 104 END 15.30 0.07 34
8/1/2005 FKC 13.19 0.07 33 DMN 15.11 0.05 100 END 15.36 0.08 33
8/2/2005 FKC 13.11 0.07 34 DMN 15.68 0.05 101 END 15.09 0.06 34
8/3/2005 FKC 13.45 0.13 33 DMN 15.79 0.06 101 END 16.50 0.14 33
8/4/2005 FKC 13.61 0.08 34 DMN 15.50 0.05 102 END 16.16 0.05 34
8/5/2005 FKC 13.24 0.05 32 DMN 15.24 0.08 94 END 15.05 0.09 32
8/6/2005 FKC 13.31 0.03 31 DMN 15.32 0.03 91 END 15.00 0.10 31
8/7/2005 FKC 13.30 0.06 30 DMN 14.93 0.03 88 END 14.81 0.07 30
8/8/2005 FKC 12.74 0.04 28 DMN 14.97 0.05 85 END 14.79 0.07 28
8/9/2005 FKC 13.11 0.09 28 DMN 14.47 0.02 85 END 14.70 0.06 28
8/10/2005 FKC 12.59 0.06 28 DMN 14.31 0.02 83 END 14.34 0.06 28
8/11/2005 FKC 12.60 0.17 30 DMN 14.70 0.12 90 END 14.43 0.12 30
8/12/2005 FKC 12.82 0.06 31 DMN 14.82 0.04 95 END 14.51 0.06 31
8/13/2005 FKC 12.89 0.03 37 DMN 14.45 0.01 111 END 14.30 0.02 37
8/14/2005 FKC 12.35 0.08 36 DMN 14.07 0.01 106 END 13.92 0.02 36
8/15/2005 FKC 11.97 0.02 35 DMN 13.87 0.02 105 END 13.95 0.03 35
8/16/2005 FKC 12.44 0.05 34 DMN 13.89 0.03 104 END 13.45 0.05 34
8/17/2005 FKC 12.52 0.09 34 DMN 13.72 0.04 100 END 14.35 0.08 34
8/18/2005 FKC 12.78 0.06 28 DMN 14.19 0.05 87 END 14.23 0.07 28
8/19/2005 FKC 12.31 0.07 27 DMN 14.14 0.01 83 END 14.17 0.03 27
8/20/2005 FKC 12.68 0.07 27 DMN 14.41 0.06 81 END 14.54 0.05 27
8/21/2005 FKC 12.45 0.10 25 DMN 14.10 0.05 79 END 14.02 0.07 25
8/22/2005 FKC 12.39 0.06 26 DMN 13.87 0.06 78 END 14.11 0.05 26
8/23/2005 FKC 12.04 0.07 27 DMN 14.04 0.02 79 END 13.87 0.09 27
8/24/2005 FKC 12.01 0.00 29 DMN 13.53 0.04 85 END 13.15 0.12 29
8/25/2005 FKC 12.19 0.08 31 DMN 13.67 0.01 92 END 13.25 0.06 31
8/26/2005 FKC 11.90 0.02 37 DMN 13.08 0.01 111 END 13.15 0.04 37
8/27/2005 FKC 11.73 0.03 36 DMN 13.40 0.03 108 END 13.50 0.12 36
8/28/2005 FKC 12.13 0.14 36 DMN 13.52 0.03 107 END 14.01 0.10 36
8/29/2005 FKC 11.25 0.05 36 DMN 12.89 0.04 106 END 12.82 0.08 36
8/30/2005 FKC 10.66 0.16 34 DMN 12.19 0.05 104 END 12.00 0.08 34
8/31/2005 FKC 10.27 0.13 34 DMN 12.15 0.07 103 END 11.13 0.10 34
9/1/2005 FKC 10.23 0.07 31 DMN 12.47 0.08 94 END 11.61 0.09 31
9/2/2005 FKC 11.12 0.10 29 DMN 12.43 0.03 89 END 12.47 0.05 29
9/3/2005 FKC 10.97 0.06 29 DMN 12.20 0.02 86 END 12.16 0.04 29
9/4/2005 FKC 11.49 0.08 27 DMN 13.14 0.03 84 END 12.98 0.09 27
9/5/2005 FKC 11.78 0.06 28 DMN 13.52 0.03 83 END 13.92 0.12 28
9/6/2005 FKC 11.92 0.03 28 DMN 13.89 0.02 83 END 13.56 0.06 28
9/7/2005 FKC 11.92 0.04 28 DMN 13.52 0.02 84 END 13.29 0.05 28
9/8/2005 FKC 12.04 0.05 28 DMN 13.59 0.01 85 END 13.39 0.02 28
9/9/2005 FKC 12.03 0.04 33 DMN 13.50 0.03 97 END 13.31 0.05 33
9/10/2005 FKC 11.05 0.09 36 DMN 12.31 0.06 110 END 12.12 0.14 36
9/11/2005 FKC 11.50 0.11 36 DMN 13.46 0.04 108 END 13.22 0.07 36
9/12/2005 FKC 11.44 0.04 36 DMN 13.17 0.05 107 END 13.48 0.05 36
9/13/2005 FKC 11.47 0.06 35 DMN 13.31 0.02 106 END 13.64 0.03 35
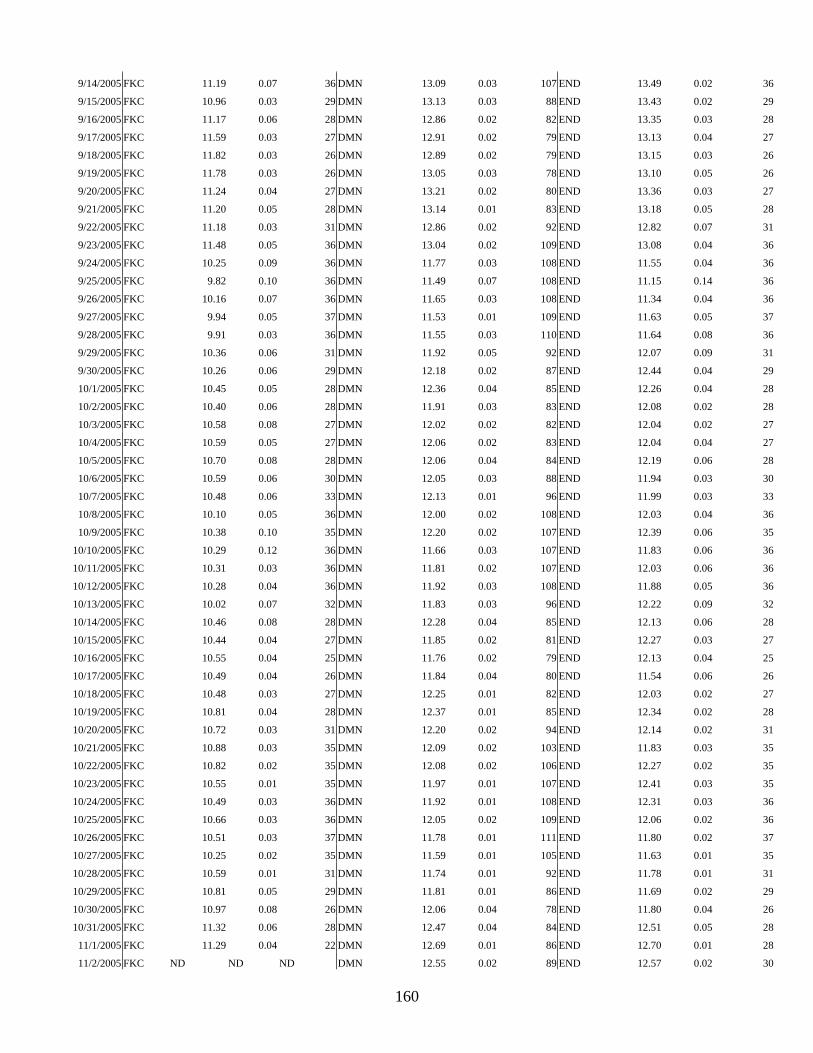
160
9/14/2005 FKC 11.19 0.07 36 DMN 13.09 0.03 107 END 13.49 0.02 36
9/15/2005 FKC 10.96 0.03 29 DMN 13.13 0.03 88 END 13.43 0.02 29
9/16/2005 FKC 11.17 0.06 28 DMN 12.86 0.02 82 END 13.35 0.03 28
9/17/2005 FKC 11.59 0.03 27 DMN 12.91 0.02 79 END 13.13 0.04 27
9/18/2005 FKC 11.82 0.03 26 DMN 12.89 0.02 79 END 13.15 0.03 26
9/19/2005 FKC 11.78 0.03 26 DMN 13.05 0.03 78 END 13.10 0.05 26
9/20/2005 FKC 11.24 0.04 27 DMN 13.21 0.02 80 END 13.36 0.03 27
9/21/2005 FKC 11.20 0.05 28 DMN 13.14 0.01 83 END 13.18 0.05 28
9/22/2005 FKC 11.18 0.03 31 DMN 12.86 0.02 92 END 12.82 0.07 31
9/23/2005 FKC 11.48 0.05 36 DMN 13.04 0.02 109 END 13.08 0.04 36
9/24/2005 FKC 10.25 0.09 36 DMN 11.77 0.03 108 END 11.55 0.04 36
9/25/2005 FKC 9.82 0.10 36 DMN 11.49 0.07 108 END 11.15 0.14 36
9/26/2005 FKC 10.16 0.07 36 DMN 11.65 0.03 108 END 11.34 0.04 36
9/27/2005 FKC 9.94 0.05 37 DMN 11.53 0.01 109 END 11.63 0.05 37
9/28/2005 FKC 9.91 0.03 36 DMN 11.55 0.03 110 END 11.64 0.08 36
9/29/2005 FKC 10.36 0.06 31 DMN 11.92 0.05 92 END 12.07 0.09 31
9/30/2005 FKC 10.26 0.06 29 DMN 12.18 0.02 87 END 12.44 0.04 29
10/1/2005 FKC 10.45 0.05 28 DMN 12.36 0.04 85 END 12.26 0.04 28
10/2/2005 FKC 10.40 0.06 28 DMN 11.91 0.03 83 END 12.08 0.02 28
10/3/2005 FKC 10.58 0.08 27 DMN 12.02 0.02 82 END 12.04 0.02 27
10/4/2005 FKC 10.59 0.05 27 DMN 12.06 0.02 83 END 12.04 0.04 27
10/5/2005 FKC 10.70 0.08 28 DMN 12.06 0.04 84 END 12.19 0.06 28
10/6/2005 FKC 10.59 0.06 30 DMN 12.05 0.03 88 END 11.94 0.03 30
10/7/2005 FKC 10.48 0.06 33 DMN 12.13 0.01 96 END 11.99 0.03 33
10/8/2005 FKC 10.10 0.05 36 DMN 12.00 0.02 108 END 12.03 0.04 36
10/9/2005 FKC 10.38 0.10 35 DMN 12.20 0.02 107 END 12.39 0.06 35
10/10/2005 FKC 10.29 0.12 36 DMN 11.66 0.03 107 END 11.83 0.06 36
10/11/2005 FKC 10.31 0.03 36 DMN 11.81 0.02 107 END 12.03 0.06 36
10/12/2005 FKC 10.28 0.04 36 DMN 11.92 0.03 108 END 11.88 0.05 36
10/13/2005 FKC 10.02 0.07 32 DMN 11.83 0.03 96 END 12.22 0.09 32
10/14/2005 FKC 10.46 0.08 28 DMN 12.28 0.04 85 END 12.13 0.06 28
10/15/2005 FKC 10.44 0.04 27 DMN 11.85 0.02 81 END 12.27 0.03 27
10/16/2005 FKC 10.55 0.04 25 DMN 11.76 0.02 79 END 12.13 0.04 25
10/17/2005 FKC 10.49 0.04 26 DMN 11.84 0.04 80 END 11.54 0.06 26
10/18/2005 FKC 10.48 0.03 27 DMN 12.25 0.01 82 END 12.03 0.02 27
10/19/2005 FKC 10.81 0.04 28 DMN 12.37 0.01 85 END 12.34 0.02 28
10/20/2005 FKC 10.72 0.03 31 DMN 12.20 0.02 94 END 12.14 0.02 31
10/21/2005 FKC 10.88 0.03 35 DMN 12.09 0.02 103 END 11.83 0.03 35
10/22/2005 FKC 10.82 0.02 35 DMN 12.08 0.02 106 END 12.27 0.02 35
10/23/2005 FKC 10.55 0.01 35 DMN 11.97 0.01 107 END 12.41 0.03 35
10/24/2005 FKC 10.49 0.03 36 DMN 11.92 0.01 108 END 12.31 0.03 36
10/25/2005 FKC 10.66 0.03 36 DMN 12.05 0.02 109 END 12.06 0.02 36
10/26/2005 FKC 10.51 0.03 37 DMN 11.78 0.01 111 END 11.80 0.02 37
10/27/2005 FKC 10.25 0.02 35 DMN 11.59 0.01 105 END 11.63 0.01 35
10/28/2005 FKC 10.59 0.01 31 DMN 11.74 0.01 92 END 11.78 0.01 31
10/29/2005 FKC 10.81 0.05 29 DMN 11.81 0.01 86 END 11.69 0.02 29
10/30/2005 FKC 10.97 0.08 26 DMN 12.06 0.04 78 END 11.80 0.04 26
10/31/2005 FKC 11.32 0.06 28 DMN 12.47 0.04 84 END 12.51 0.05 28
11/1/2005 FKC 11.29 0.04 22 DMN 12.69 0.01 86 END 12.70 0.01 28
11/2/2005 FKC ND ND ND DMN 12.55 0.02 89 END 12.57 0.02 30

161
11/3/2005 FKC ND ND ND DMN 12.30 0.02 94 END 12.34 0.02 31
11/4/2005 FKC ND ND ND DMN 12.57 0.00 101 END 12.52 0.01 33
11/5/2005 FKC ND ND ND DMN 12.37 0.01 100 END 12.36 0.00 34
11/6/2005 FKC ND ND ND DMN 12.42 0.00 106 END 12.36 0.00 36
11/7/2005 FKC ND ND ND DMN 12.25 0.01 106 END 12.31 0.01 36
11/8/2005 FKC ND ND ND DMN 11.95 0.03 107 END 12.14 0.04 36
11/9/2005 FKC ND ND ND DMN 11.91 0.03 110 END 11.85 0.05 36
11/10/2005 FKC ND ND ND DMN 12.07 0.02 100 END 12.18 0.02 34
11/11/2005 FKC ND ND ND DMN 12.18 0.01 92 END 12.27 0.02 31
11/12/2005 FKC ND ND ND DMN 12.04 0.01 85 END 12.25 0.04 28
11/13/2005 FKC ND ND ND DMN 12.21 0.01 82 END 12.18 0.03 28
11/14/2005 FKC ND ND ND DMN 12.24 0.02 84 END 13.58 0.37 28
11/15/2005 FKC ND ND ND DMN 11.73 0.02 89 END ND ND ND
11/16/2005 FKC ND ND ND DMN 11.63 0.03 80 END ND ND ND

18