
Marine Fisheries in Indian...
10
. Marine Fisheries in Indian Economy R. SATHIADHAS Central Marine Fi.~"eries Re.~earch IIU/iwle, Cochin 682 014 Marine fisheries sector has undergone vast structural changes during the last few years. The shift from the traditional to motorised and mechanised fishing is a major one. Export of processed fish and development in the internal marketing system transferred several backward regions along the coast into commercial centres. In spite of increased landings, the c,atch rate decreased due to over capacity in fishing fleet. Present status of fishing in Indian economy with respect to production, processing, marketing, earnings and related aspects are analysed. Suggestions for improving the socio-economic stntus of fishermen by proper management of resources, fishing regulations, product diversification, better bycatch utilisation etc. are also presented. Key words: Exploitation, fishing fleet, economy, employment, investment, infrastructure, marketing, earning A vailabi.1ity of technologies was a motivation for increased capital investments and higher fishing. intensity in the marine fishery sector. However, the increase in production is not commensurate with investment as yield is showing an inverse relationship. Balanced exploitation of resources is essential. for sustainable development. In appreciation of the importance of fishing in the Indian economy the present study was undertaken at macro level with the following specific objectives. . To examine the exploitation trend nnd contribution by mechanised, motorised and non-mechanised fishing units in total production . To evaluate recent structural changes in marine fisheries economy and its implications. . To estimate employment generated in harvest and post-harvest sectors. . To analyse sector-wise capital investment, earnings nnd capacity utilisation. of fishing fleets and processing facilities. . To assess the marketing problems, utilisation pattern of marine fish and fishermen's share in consumers' rupee. . To suggest policy measures for sustainable long-term development of marine fisheries. Matcrials and Methods Both primary and secondary data were collected. Data on labour requirements for ~aI.:11! aalll.geal' t:omo\:l1aI:J\:m i'11' {i":;I1i:11g' <111(1', emplbym~I1l' i'11 rl1~ pl'Oc~ssj"J\g' al1dl
Transcript of Marine Fisheries in Indian...
. Marine Fisheries in Indian Economy
R. SATHIADHASCentral Marine Fi.~"eries Re.~earch IIU/iwle, Cochin 682 014
Marine fisheries sector has undergone vast structural changes duringthe last few years. The shift from the traditional to motorised andmechanised fishing is a major one. Export of processed fish anddevelopment in the internal marketing system transferred severalbackward regions along the coast into commercial centres. In spiteof increased landings, the c,atch rate decreased due to over capacityin fishing fleet. Present status of fishing in Indian economy withrespect to production, processing, marketing, earnings and relatedaspects are analysed. Suggestions for improving the socio-economicstntus of fishermen by proper management of resources, fishingregulations, product diversification, better bycatch utilisation etc. arealso presented.
Key words: Exploitation, fishing fleet, economy, employment,investment, infrastructure, marketing, earning
A vailabi.1ity of technologies was a motivation for increased capital investmentsand higher fishing. intensity in the marine fishery sector. However, the increase inproduction is not commensurate with investment as yield is showing an inverserelationship. Balanced exploitation of resources is essential. for sustainabledevelopment. In appreciation of the importance of fishing in the Indian economy thepresent study was undertaken at macro level with the following specific objectives.
. To examine the exploitation trend nnd contribution by mechanised, motorisedand non-mechanised fishing units in total production
. To evaluate recent structural changes in marine fisheries economy and itsimplications.
. To estimate employment generated in harvest and post-harvest sectors.
. To analyse sector-wise capital investment, earnings nnd capacity utilisation. offishing fleets and processing facilities.
. To assess the marketing problems, utilisation pattern of marine fish andfishermen's share in consumers' rupee.
. To suggest policy measures for sustainable long-term development of marinefisheries.
Matcrials and Methods
Both primary and secondary data were collected. Data on labour requirements for~aI.:11! aalll.geal' t:omo\:l1aI:J\:m i'11' {i":;I1i:11g' <111(1', emplbym~I1l' i'11 rl1~ pl'Oc~ssj"J\g' al1dl
464 Advallces alld Priorities ill Fi.'Iheries Techllology
subsidiary activities were collected from sample centres. Marketing costs, handlingand transportation charges and, price of different fish at primary, wholesale and retailpoints were collected weekly during 1996-97 at selected markets in different maritimestates using simple-random~sampling technique. Most. of the major tish landingcentres in each maritime state were selected for primary data collection. Data onthe price of identical size fish in primary, wholesale and retail markets of eachmarketing channel were collected.
Secondary data on fish production, exports and strength of fishing fleet werecollected from Central Marine Fisheries Research Institute (CMFRI), Marine ProductsExport Development Authority (MPEDA) and concerned government departments. Asimple logical tabular analysis was used to meet the objectives set forth.
Results and Discussion
Exploitation trend and sector-wise contribution
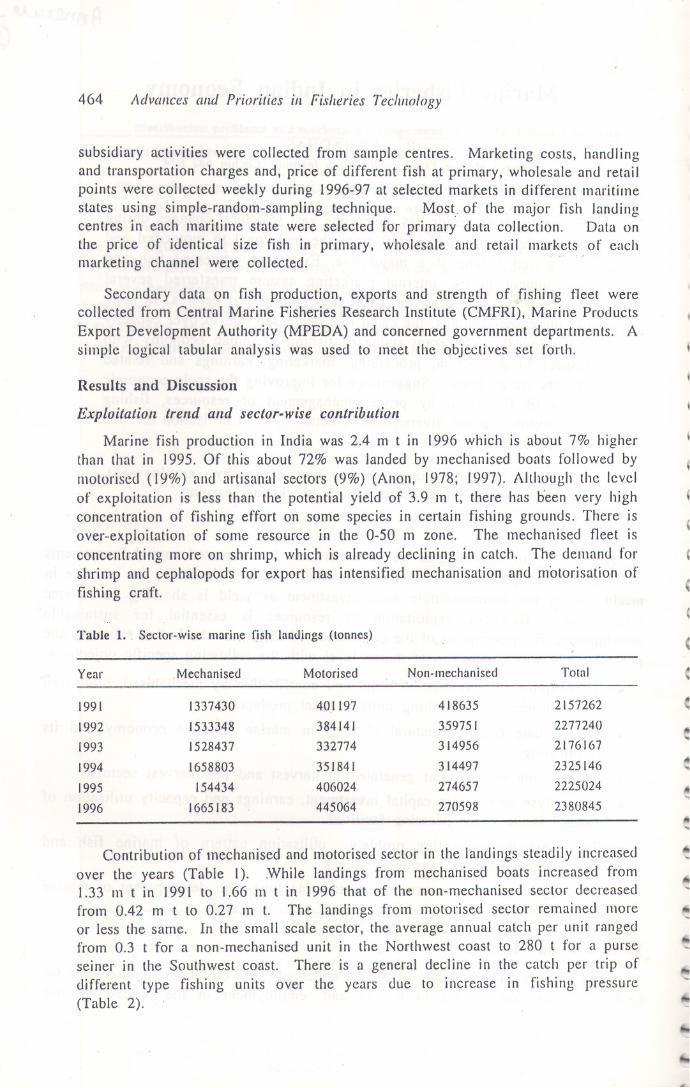
Marine fish production in India was 2.4 m t in 1996 which is about 7% higherthan that in 1995.Of this about 72% was landed by mechanisedboats followedbymotorised (19%) and artisanal sectors (9%) (Anon, 1978; 1997). Although the levelof exploitation is less than the potential yield of 3.9 m t, there has oeen very highconcentration of fishing effort on some species in certain fishing grounds. There isover-exploitation of some resource in the 0-50. m zone. The mechanised fleet isconcentrating more on shrimp, which is already declining in catch. The demand forshrimp and cephalopods for export has intensified mechanisation and motorisation offishing craft.
c
(
c
e
«
eof..
.'"
Contribution of mechanised and motorised sector in the landings steadily increasedover the years (Table I). ,While landings from mechanised boats increased from1.33 In t in 1991 to 1.66 m t in 1996 that of the non-mechanised sector decreasedfrom 0.42 m t to 0.27 m t. The landings from motorised sector remained moreor less the same. In the small scale sector, the average annual catch per unit rangedfrom 0.3 t for a non-mechanised unit in the. Northwest coast to 280 t for a purseseiner in the Southwest coast. There is a general decline in the catch per trip ofdifferent type fishing units over the years due to increase in fishing pressure(Table 2).
..
..
...
..
Table 1. . Sector-wise marine fish landings (tonnes)
Year Mechanised Motorised Non-mechanised Total
1991 1337430 401 197 418635 2157262
1992 1533348 384141 359751 2277240
1993 1528437 332774 314956 2176167
1994 1658803 351841 314497 2325146
1995 154434 406024 274657 2225024
J996 1665183 445064 270598 2380845
.Marine Fisherie,'jin Indian Economy 465
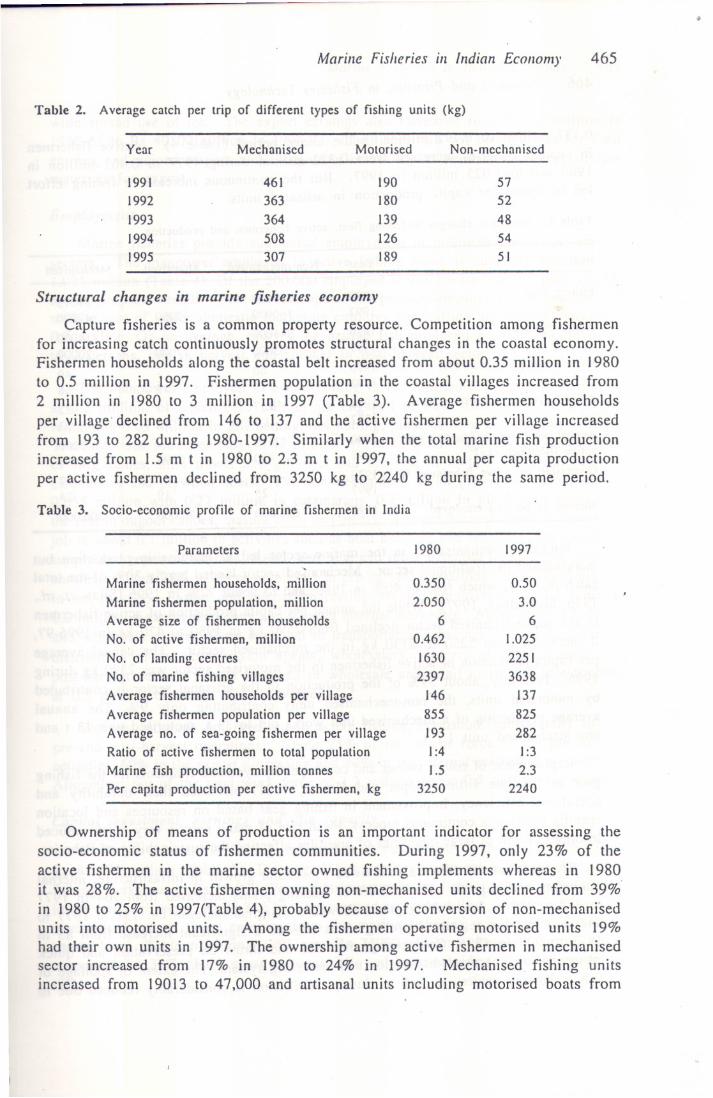
Table 2. Average catch per trip of different types of fishing units (kg)
Capture fisheries is a common property resource. Competition among fishermenfor increasing catch continuously promotes structural changes in the coastal economy.Fishermen households along the coastal belt increased from about 0.35 million in J980to 0.5 million in 1997. Fishermen population in the coastal villages increased from2 million in 1980 to 3 million in 1997 (Table 3). Average fishermen householdsper village' declined from 146 to. 137 and the active fishermen per village increasedfrom 193 to 282 during 1980-1997. Similarly when the total marine fish productionincreased from 1.5 m t in 1980 to 2.3 m t in 1997, the annual per capita productionper active fishermen declined from 3250 kg to 2240 kg during the same period.
Table 3. Socia-economicprofile of marine fishermen in India
Parameters 19971980
Marine fishermen households, millionMarine fishermen population, millionAverage size of fishermen householdsNo. of active fishermen, millionNo. of landing centresNo. of marine fishing villagesAverage fishermen households per villageAverage fishermen population per villageAverage no. of sea-going fishermen per villageRatio of active fishermen to total populationMarine fish production, million tonnesPer capita production per active fishermen, kg
0.3502.050
60.46216302397
1468551931:41.5
3250
0.503.0
61.02522513638
1378252821:32.3
2240
Ownership of means of production is an important indicator for assessing thesocio-economic status of fishermen communities. During 1997, only 23% of theactive fishetmen in the marine sector owned fishing implements whereas in 1980it was 28%. The active fishermen owning non-mechanised units declined from 39%in 1980 to 25% in I997(Table 4), probably because of conversion of non-mechanisedunits into motorised units. Among the fishermen operating motorised units 19%had their own units in 1997. The ownership among active fishermen in mechanisedsector increased from 17% in 1980 to 24% in 1997. Mechanised fishing unitsincreased from 19013 to 47,000 and artisanal units including motorised boats from
Year Mechaniscd Motorised Non-mcchaniscd
1991 461 190 571992 363 180 521993 364 139 481994 508 126 541995 307 189 5J
Strllctllral changes in marine fisheries economy
466 Advances and Priorities in Fisheries Technology
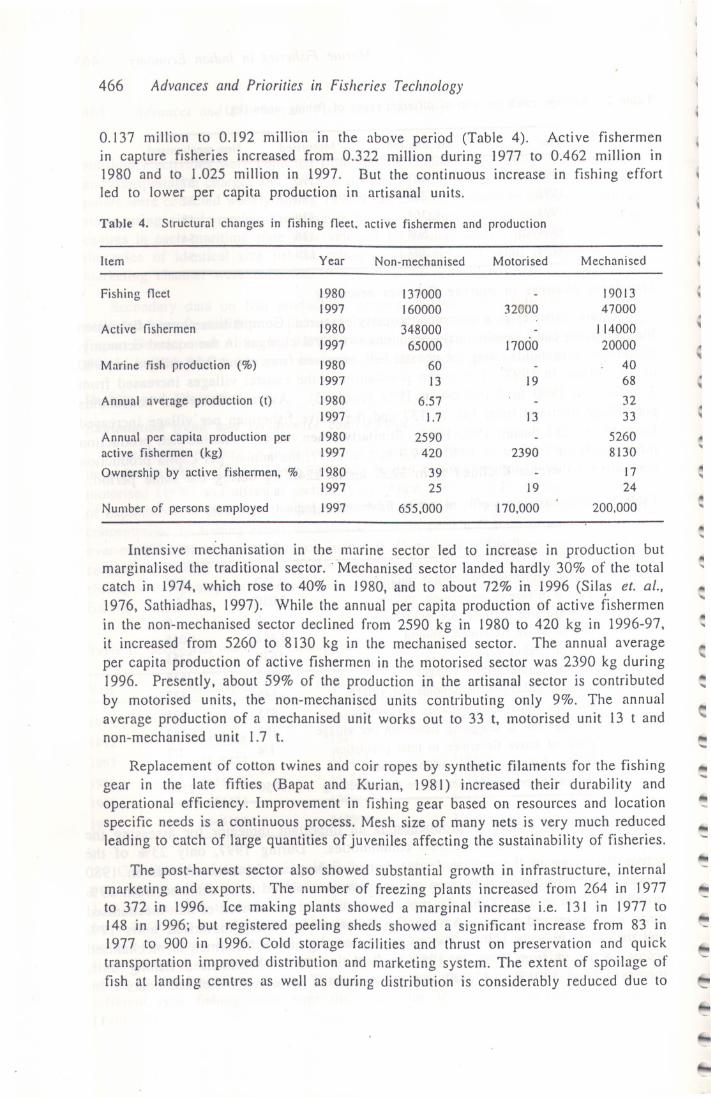
0.137 million to 0.192 mi11ion in the above period (Table 4). Active fishermenin capture fisheries increased from 0.322 million during 1977 to 0.462 million in1980 and to 1.025 million in 1997. But the continuous increase in fishing effortled to lower per capita production in artisanal units.
1II
....
....
Intensive mechanisation in the marine sector led to increase in production butmarginalised the traditional sector. . Mechanised sector landed hardly 30% of the totalcatch in 1974, which rose to 40% in 1980, and to about 72% in 1996 (Silas et. at...1976, Sathiadhas, (997). While the annual per capita production of active fishermenin the non-mechanised sector declined from 2590 kg in 1980 to 420 kg in 1996-97,it increased from 5260 to 8130 kg in the mechanised sector. The annual averageper capita production of active fishermen in the motorised sector was 2390 kg during1996. Presently, about 59% of the production in the artisanal sector is contributedby motorised units, the non-mechanised units contributing only 9%. The annualaverage production of a mechanised unit works out to 33 t, motorised unit 13 t andnon-mechanised unit 1.7 1.
Replacement of cotton twines and coir ropes by synthetic filaments for the fishinggear in the late fifties (Bapat and Kurian, 1981) increased their durability andoperational efficiency. Improvement in fishing gear based on resources and locationspecific needs is a continuous process. Mesh size of many nets is very much reducedleading to catch of large quantities of juveniles affecting the sustainability of fisheries.
The post-harvest sector also showed substantial growth in infrastructure, internalmarketing and exports. The number of freezing plants increased from 264 in 1977to 372 in 1996. Ice making plants showed a marginal increase i.e. 131 in 1977 to148 in 1996; but registered peeling sheds showed a significant increase from 83 in1977 to 900 in 1996. Cold storage facilities and thrust on preservation and quicktransportation improved distribution and marketing system. The extent of spoilage offish at landing centres as well as during distribution is considerably reduced due to
ill..
....
c:
"-
""-
...
...
Table 4. Structural changes in fishing neet. active fishermen and production
Item Year Non-mechanised Motorised Mechanised
Fishing neet 1980 137000 - 190131997 160000 32000 47000
Active fishermen 1980 348000 - 1140001997 65000 17000 20000
Marine fish production (%) 1980 60 - 401997 13 19 68
Annual average production (t) 1980 6.57 - 321997 1.7 13 33
Annual per capita productionper 1980 2590 - 5260active fishermen (kg) 1997 420 2390 8130
Ownership by active fishermen, % 1980 39 - 171997 25 19 24
Number of persons employed 1997 655,000 170,000 200,000
.
Marine Fisheries ill Indian Ecollomy 467
wide spread use of ice. The export earnings also increased from Rs 46 million in1960-61 to Rs 40500 million in 1996-97. The fisher-folk got better prices for theircatches and gained respect and recognition in society as primary producers of rawmaterials for export
Employmcnt
Marine fisheries provide substantial employment in production and post-harvestsectors. The manpower employed in active fishing alone is currently estimated at1.025 million (Table 4). Of the 200,000 employed in mechanised sector, only 10,000are in deepsea vessels. Post-harvest operations provide employment to another 1.2million, out of which domestic marketing employs one million and export marketing0.2 million. On an average, every 5 kg marine fish produced provides employmentto 2 persons, one in harvest and another in post-harvest sector.
The manpower employed in active fishing in the mechanised sector is estimatedat 0.2 million, of which 0.15 million are engaged in trawl fisheries alone and theremaining 0.05 million in gill netting, dol netting, 'purse seining and deepsea fishing.The motorised sector employs 0.17 million where 66% are engaged in the operationof ring seines, mini trawls and gill nets and the rest in motorised dugout canoes,catamarans and plywood boats. The non-mechanised sector provides employment to0.655 million with 0.27 million in catamarans, 0.2 million in plank-buHt boats andthe rest in dugout canoes, masula boats and others. The pre-harvest operations providejob to about 0.1 million in activities such as boat building and repairing, net mending,supp.ly and repair of engines, diesel, kerosene and other essential items at the landingcentres. About 25% of those employed in pre-harvest operations are women, mostlyin net making. Export and internal marketing provide employment to 1.1 million;
.0.2 million in export marketing and 0.9m in internal marketing. Auctioneers at landingand wholesale centres, those involved in transportation, loading, unloading, packing,distribution of ice, commission agents, wholesalers, retailers etc. come under thepost-harvest sector. People involved in wholesale and re\ail marketing is estimatedat 0.5 million of which 50% is wO\TIen.
Women, although not involved in active fishing, contribute substantially in thepre-and post-harvest operations. About 25% of the labour force in the pre-harvestactivities, 60% in the export processing and 40% in the internal marketing are women.Altogether,out of the total work force of J.2 million about 0.5 million are women.
Capital investmcnt, earnings and idle capacity
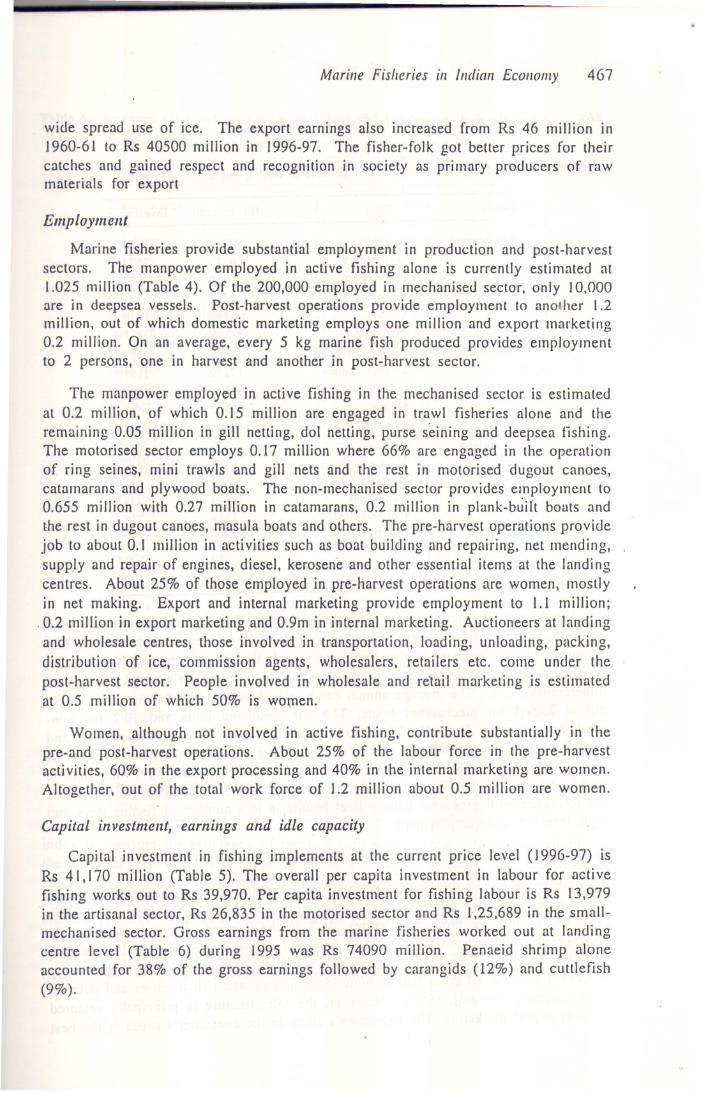
Capital investment in fishing implements at the current price level (J996-97) isRs 41,170 million (Table 5). The overall per capita investment in labour for activefishing works out to Rs 39,970. Per capita investment for fishing labour is Rs 13,979in the artisanal sector, Rs 26,835 in the motorised sector and Rs 1,25,689 in the small.mechanised sector. Gross earnings from the marine fisheries worked out at landingcentre level (Table 6) during 1995 was Rs 74090 million. Penaeid shrimp aloneaccounted for 38% of the gross earnings followed by carangids (12%) and cuttlefish(9%).
4
468 Advances CltfPPriorities in Fisheries Technology
Table 5. Estimated cp,pital investment (Rs million) in fishing implements (1996-97)
Decpsep vessels
Total
Sector
Mecha,\iscd
Non-mcchanised
Motorised
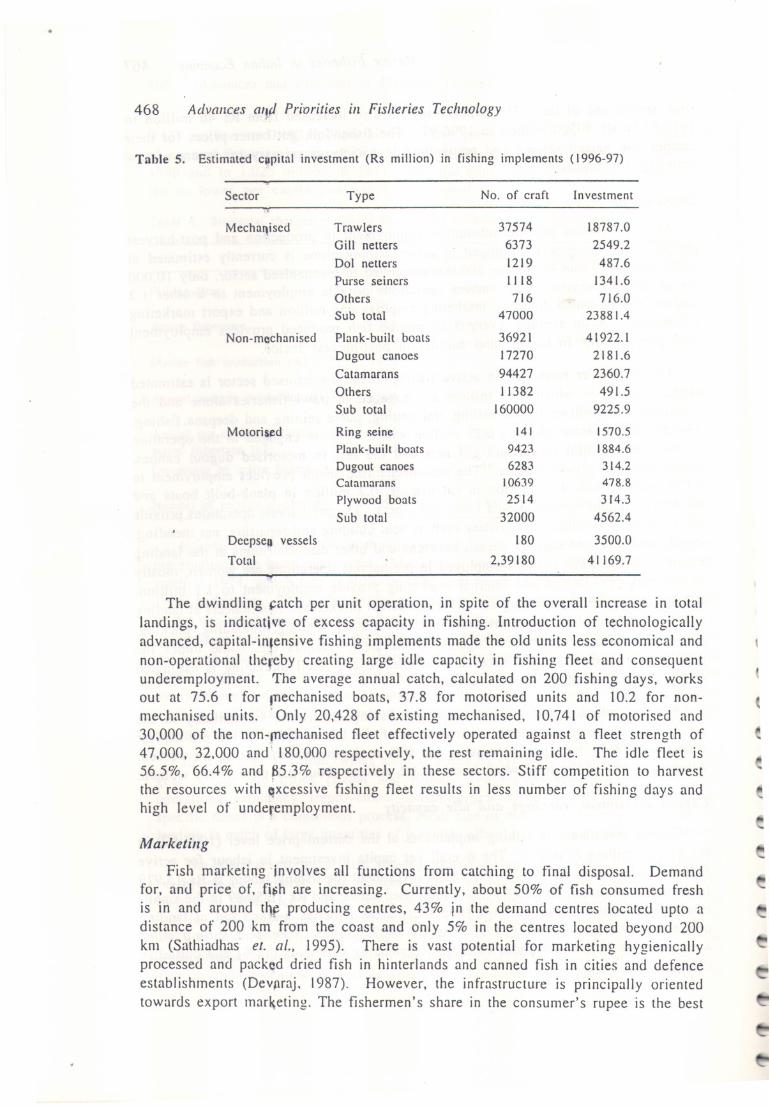
The dwindling -=atchper unit operation, in spite of the overall increase in totallandings, is indicative of excess capacity in fishing. Introduction of technologicallyadvanced, capital-in,ensive fishing implements made the old units less economical andnon-operational thei'eby creating large idle capacity in fishing fleet and consequentunderemployment. The average annual catch, calculated on 200 fishing days, worksout at 75.6 t for f11echanisedboats, 37.8 for motorised units and 10.2 for non-mechanised units. 'Only 20,428 of existing mechaniscd, 10,741 of motorised and30,000 of the non-f11echanisedfleet effectively operated against a fleet strength of47,000, 32.000 and' 180.000 respectively, the rest remaining idle. The idle fleet is56.5%. 66.4% and 85.3'70respectively in these sectors. Stiff competition to harvestthe resources with qxcessive fishing fleet results in less number of fishing days andhigh level of underemployment.
.'"
......
Marketing
Fish marketingjnvolves all functions from catching to final disposal. Demandfor. and price of. fitih are increasing. Currently, about 50% of fish consumed freshis in and around tqF producing centres, 43% in the demand centres located upto adistance of 200 km from the coast and only 5'70in the centres located beyond 200km (Sathiadhas et. at., 1995). There is vast potential for marketing hygienicallyprocessed and packod dried fish in hinterlands and canned fish in cities and defenceestablishments (DevAraj. 1987). However, the infrastructure is principally orientedtowards export mar~eting. The fishermen's share in the consumer's rupee is the best
Type No. of craft Investment
Trawlers 37574 18787.0Gill netters 6373 2549.2
Dol netters 1219 487.6Purse seiners 1118 1341.6Others 716 716.0Sub total 47000 23881.4
Plank-built boats 36921 41922.1
Dugout canoes 17270 2181.6
Catamarans 94427 2360.7Others 11382 491.5Sub total 160000 9225.9
Ring seine 141 1570.5Plank-built boats 9423 1884.6
Dugout canoes 6283 314.2Catamarans 10639 478.8
Plywood boats 2514 314.3Sub total 32000 4562.4
180 3500.0
2.39180 41169.7

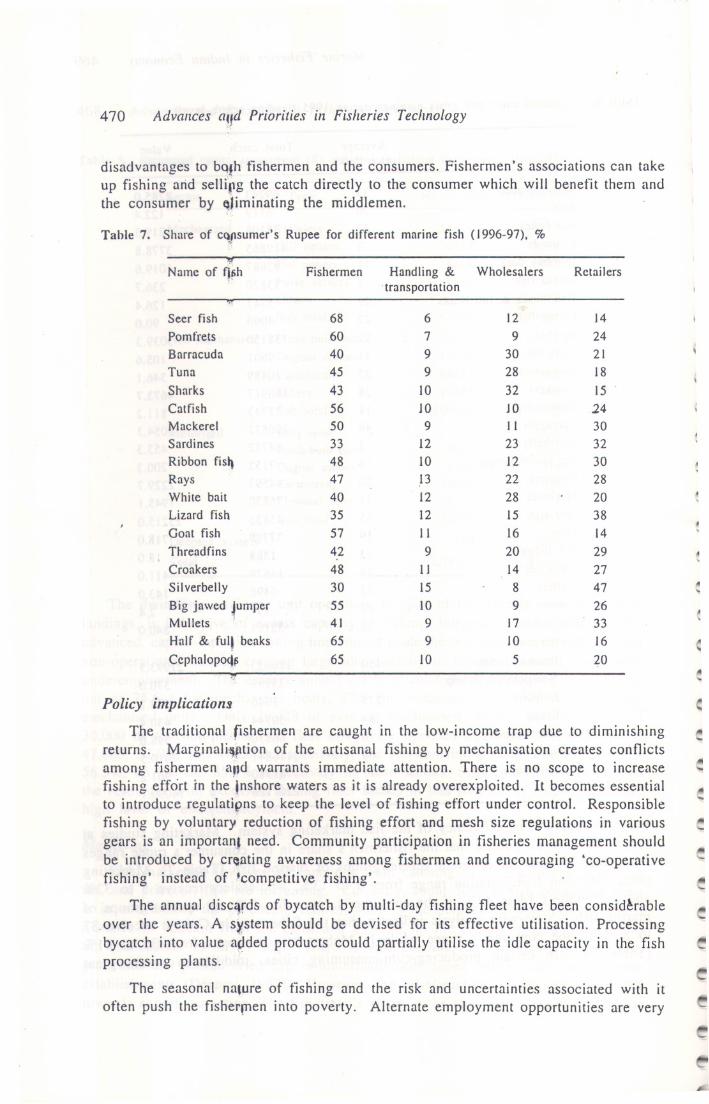
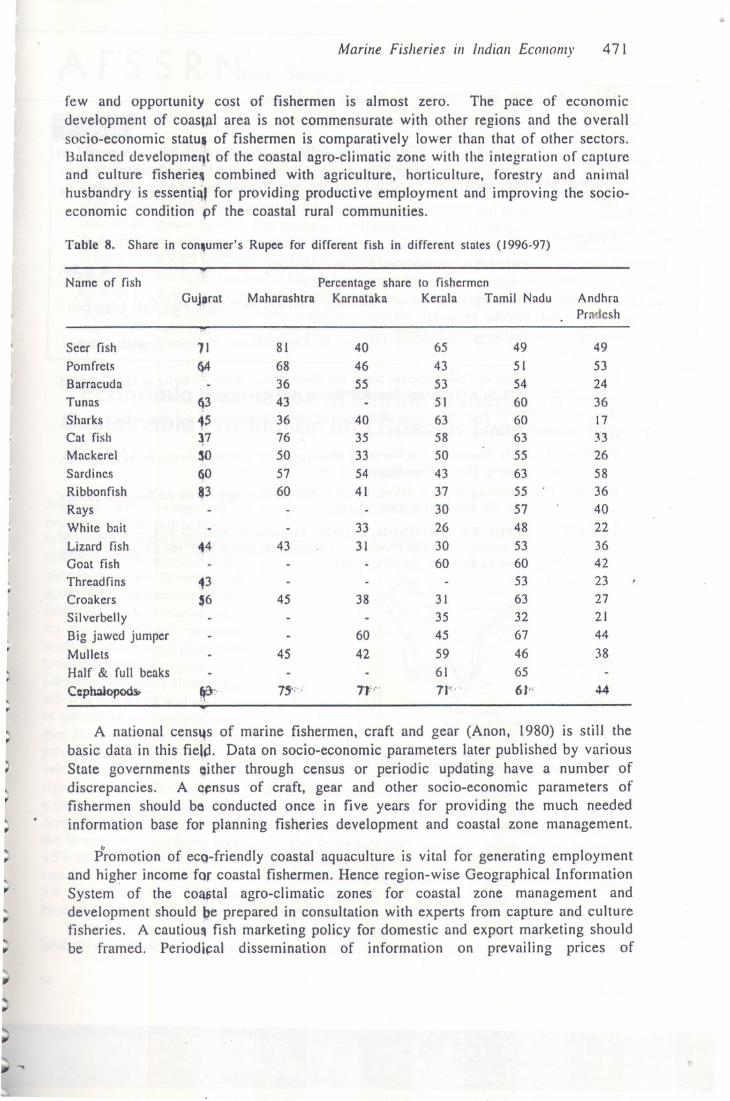
index to measure the efficiency of the fish marketing system. Marketing studies atthe all India level in~icate that the fishermen's share in the consumer's rupee rangesfrom 30% to 68% fQr different species/groups of marine fish (Table 7). Marketingcosts including transportation range from 6 to 13%, wholesalers receive 5 to 32%and the retailers 14 JP 47% of the consumer's rupee for different species/groups ofmarine fish. State-wise analysis indicates that the fishermen in Gujarat receive 37to 83% of the cons4mer's rupee while in Maharashtra it ranges from 36 to 81%(Table 8). In certuin producing-cum-consuming cities, middlemen create great
..
Marille Fisheries ill Illdian Ec(}/wl1lr 469
Table 6. Estim:llcd cch and gross earnings during 1995 (landing ccntrc levcl)
Average Total catch Valuepricc Rs/kg (lonncs) (Rs million)
Elasmobranc 33 69243 2285.0Eels 20 6119 122.4Cat fishes 32 38108 1219.5
Clupeids 9 419865 3778.8
Bombay duC 11 92687 1019.6Lizard fish 7 33820 236.7Half beaks full beaks 22 5747 126.4Flying fish 22 4090 90.0Perches 22 138150 3039.3Goat fish 11 9601 105.6Threadfins 33 10489 346.1Croakers 28 166917 4673.7Ribbon fish 11 73743 811.2
Carangids 46 196832 9054.3Siverbelly 7 64752 453.3
Big jawed jlfmper 28 7152 200.3Pomfrets 50 44593 229.7Mackerel II 176830 1945.1Seer fish 55 45853 25215.0Tuna 19 37789 718.0Bill fishes 13 1388 18.0.Barracuda 28 14679 411.0Mullets 22 6498 143.0Unicorn cod 17 139 2.4
. Flat fishes 22 38181 840.0Crustaceans
Penaeid hrimp 150 186623 27993.5
Non-penl\id shrimp 5 73999 370.0Lobsrers 215 f946 538.2Crabs 14 30744 430.4
Stomatoppds 6 66330 398.0Cephalopods 60 116841 7010.5Miscellaneou II 87380 961.2Total 32.68 2267128 74090.1
470 Advances a~fdPriorities in Fisheries Technology
disadvantages to bQ,h tishermen and the consumers. Fishermen's associations can takeup fishing arid se1Ir(lg the catch directly to the consumer which will benefit them andthe consumer by ~'iminating the middlemen.
Table 7. Share of cqpsumer's Rupee for different marine fish (1996-97),%
.'"
."
The traditional fishermen are caught in the low-income trap due to diminishingreturns. MarginalH,ptionof the artisanal fishing by mechanisation creates conflictsamong fishermen al,d warrants immediate attention. There is no scope to increasefishing effort rn the "inshorewaters as it is already overexploited. It becomes essentialto introduce regulatipns to keep the level of fishing effort under control. Responsiblefishing by voluntary reduction of fishing effort and mesh size regulations in variousgears is an important need. Community participation in fisheries management shouldbe introducedby creatingawarenessamongfishermenand encouraging'co-operativefishing' instead of 'competitive fishing'.
The annual disc'trds of bycatch by multi-day fishing fleet have been consid~rable.over the years. A s):'stemshould be devised for its effective utilisation. Processingbycatch into value apded products could partially utilise the idle capacity in the fishprocessing plants.
The seasonal na,ure of tishing and the risk and uncertainties associated with itoften push the fisherfTIeninto poverty. Alternate employment opportunities are very
A....
...-
..'-
.....
'f!
Name of fJh Fishermen Handling & Wholesalers Retailers
. transportation"'!'
Seer fish 68 6 12 14Pomfrets 60 7 9 24Barracuda 40 9 30 21Tuna 45 9 28 18Sharks 43 10 32 15Catfish 56 10 JO 24Mackerel 50 9 II 30Sardines 33 12 23 32Ribbon fis 48 10 12 30
Rays 47 13 22 28White bait 40 12 28 20Lizard fish 35 12 15 38Goat fish 57 II 16 14Threadfins 42 9 20 29Croakers 48 11 14 27
Silverbelly 30 15 8 47
Big jawed umper 55 10 9 26Mullets 41 9 17 33
Half & full beaks 65 9 10 16
CephalopQ(l 65 10 5 20."
Policy implications
..
Marine Fisheries ill [lldian Ecollomy 471
few and opportunity cost of fishermen is almost zero. The pace of economicdevelopment of coasJJlI area is not commensurate with other regions and the overallsocio-economic statuft of fishermen is comparatively lower than that of other sectors.Balanced developmel)t of the coastal agro-climatic zone with the integration of captureand culture fisherie~ combined with agriculture, horticulture, forestry and animalhusbandry is essenti~' for providing productive employment and improving the socio-economic condition pf the coastal rural communities.
Table 8. Share in con~umer'sRupee for different fish in different stales (1996-97)
.
.. A national cens'4s of marine fishermen, craft and gear (Anon, 1980) is still thebasic data in this field. Data on socio-economic parameters later published by variousState governments Qither through census or periodic updating have a number ofdiscrepancies. A qpnsus of craft, gear and other socio-economic parameters offishermen should be conducted once in five years for providing the much neededinformation base for planning fisheries development and coastal zone management.
~ .
Promotion of eco-friendly coastal aquaculture is vital for generating employmentand higher incomefQrcoastalfishermen.Henceregion-wiseGeographicalInformationSystem of the coa~tal agro-climatic zones for coastal zone management anddevelopment should ~e prepared in consultation with experts from capture and culturefisheries. A cautiou!lfish marketing policy for domestic and export marketing shouldbe framed. Periodi~al dissemination of information on prevailing prices of
.,,..,,,II',II'
I-
t.
'!I'Name of fish Percentage share to fishermen
Gujprat Maharashtra Karnataka Kerala Tamil Nadu AndhraPradesh
.,..
Seer fish 11 81 40 65 49 49
Pomfrets M 68 46 43 51 53Barracuda - 36 55 53 54 24Tunas 43 43 - 51 60 36Sharks 15 36 40 63 60 17Cat fish 7 76 35 58 63 33Mackerel . '0 50 33 50 55 26Sardines O 57 54 43 63 58Ribbonfish 83 60 41 37 55 36
Rays - - . 30 57 40White bait - - 33 26 48 22Lizard fish 44 43 31 30 53 36Goat fish - - . 60 60 42Threadfins 13 - - - 53 23Croakers 16 45 38 31 63 27
Silverbelly - . - 35 32 21
Big jawed jumper - - 60 45 67 44Mullets - 45 42 59 46 38Half & full beaks - - - 61 65
CcptuUop<xb> . fr)' . 7";"': 1l'" 71"" 6J!;' 44.,...
472 Advances and Priorities in Fisheries Technology
commercially importqrt varieties of fish in different markets will be much useful tothe fishermen, traderi; and consumers. Only products, which are capable to fetchcompetitive price, shp,uld be exported and the rest should be sold in the domesticmarket.
References
Anon (1978) Trend.r in T~JtalMarine Fi.rh Produc:tion in India, Mar. Fish. Infor. Serv.. T & E Ser.No.2, p. 2
Anon (1980) All India c,,~nsu.rof Marine Fi.rhermen. Craft and Gear 1980. Mar. Fish. Infor. Serv.,T & E Ser. No.f8, p. 31
Anon (1997) Vi.rion.2020,- Per.rpeC:livePlan, pp 70, Central Marine Fisheries Research Institute,Cochin . ,
Bapat, S.V. & Kurian, A, (1981) Pre.rentStatu.r and Role of Small Sc:aleFi.rherie.rof India. CMFRI
Bull. No. 30 A, ,.13, Central Marine Fisheries Research Institute, CochinDevnrnj, -M.(987) in 'P';"c. Nar. SYlllp. Utili.ration oJ'Living Re.fOurc:e.rof the Indian Sea.r. p. 101,
National Academ~ of Science of IndiaSathiadhas, R. (1997) Prcwuc:tionand Marketing Management of Marine Fi.rlleries in India. pp 193,
Daya Publishing tl0use, New Delhi
Sathiadhas, R., Narayanak.,mar, R. & Sehara. D.B.S. (1995) in Proc:eedings(~ftile 4tll Swacle.rlliScienc:e
Congre.r.r,p. 20, ~wadeshi Science, Cochin
Silas;' E.G., Dharmaraja, ~,K. & Rengarajan, K. (1976) Exploitation'of Marine Fishery Re,fOurc:esofIndia - A Synoptic.;'Survey with Comment.ron Potential Re.fOurc:e,Bull. No. 27. pp 25. CentralMarine Fisheries ~esearch Institute; Cochin
.,
.
.....
....
II...
II....
......
.....
....
..


![NATIONAL MARINE FISHERIES SERVICE …...NATIONAL MARINE FISHERIES SERVICE INSTRUCTIONS 01-101-03 [9/30/2015] Fisheries Management Fisheries Management Actions, NMFSPD -01-101 OPERATIONAL](https://static.fdocuments.in/doc/165x107/5f0d46657e708231d4398972/national-marine-fisheries-service-national-marine-fisheries-service-instructions.jpg)


