Marine Environment & Ecology - SARDI€¦ · project was funded by SafeWork SA, Winifred Scott...
61
Huveneers, C. et al Assessing the efficacy of the Shark Shield TM 1 Marine Environment & Ecology Effects of the Shark Shield™ electric deterrent on the behaviour of white sharks (Carcharodon carcharias) C. Huveneers 1,2 , P.J. Rogers 1 , J. Semmens 3 , C. Beckmann 2 , A.A. Kock 4,5 , B. Page 1 & S.D. Goldsworthy 1 SARDI Publication No. F2012/000123-1 SARDI Research Report Series No. 632 SARDI Aquatic Sciences PO Box 120 Henley Beach SA 5022 June 2012 Final Report to SafeWork South Australia
Transcript of Marine Environment & Ecology - SARDI€¦ · project was funded by SafeWork SA, Winifred Scott...

Huveneers, C. et al Assessing the efficacy of the Shark ShieldTM
1
Marine Environment & Ecology Effects of the Shark Shield™ electric deterrent on the behaviour of white sharks (Carcharodon
carcharias)
C. Huveneers1,2, P.J. Rogers1, J. Semmens3, C. Beckmann2, A.A. Kock4,5, B. Page1 & S.D. Goldsworthy1
SARDI Publication No. F2012/000123-1 SARDI Research Report Series No. 632
SARDI Aquatic Sciences
PO Box 120 Henley Beach SA 5022
June 2012
Final Report to SafeWork South Australia

Huveneers, C. et al Assessing the efficacy of the Shark ShieldTM
2
Effects of the Shark Shield™ electric deterrent on the behaviour of white sharks (Carcharodon
carcharias)
Final Report to SafeWork South Australia
C. Huveneers1,2, P.J. Rogers1, J. Semmens3, C. Beckmann2, A.A. Kock4,5, B. Page1 & S.D. Goldsworthy1
SARDI Publication No. F2012/000123-1 SARDI Research Report Series No. 632
June 2012

Huveneers, C. et al Assessing the efficacy of the Shark ShieldTM
3
This Publication may be cited as: Huveneers, C., Rogers, P.J., Semmens, J., Beckmann, C., Kock, A.A., Page, B. and Goldsworthy, S.D. (2012). Effects of the Shark Shield™ electric deterrent on the behaviour of white sharks (Carcharodon carcharias). Final Report to SafeWork South Australia. Version 2. South Australian Research and Development Institute (Aquatic Sciences), Adelaide. SARDI Publication No. F2012/000123-1. SARDI Research Report Series No. 632. 61pp. 1South Australian & Research Development Institute 2Flinders University, 3Institute of Marine and Antarctic Studies 4University of Cape Town 5Shark Spotters
Front cover photos © Peter Verhoog / Save Our Seas Foundation South Australian Research and Development Institute SARDI Aquatic Sciences 2 Hamra Avenue West Beach SA 5024 Telephone: (08) 8207 5400 Facsimile: (08) 8207 5406 http://www.sardi.gov.au DISCLAIMER The authors warrant that they have taken all reasonable care in producing this report. The report has been through the SARDI Aquatic Sciences internal review process, and has been formally approved for release by the Research Chief, Aquatic Sciences. Although all reasonable efforts have been made to ensure quality, SARDI Aquatic Sciences does not warrant that the information in this report is free from errors or omissions. SARDI Aquatic Sciences does not accept any liability for the contents of this report or for any consequences arising from its use or any reliance placed upon it. © 2012 SARDI This work is copyright. Apart from any use as permitted under the Copyright Act 1968 (Cth), no part may be reproduced by any process, electronic or otherwise, without the specific written permission of the copyright owner. Neither may information be stored electronically in any form whatsoever without such permission. Printed in Adelaide: June 2012 SARDI Publication No. F2012/000123-1 SARDI Research Report Series No. 632 Author(s): C. Huveneers, P.J. Rogers, J. Semmens, C. Beckmann, A.A. Kock, B. Page and S.D. Goldsworthy Reviewer(s): M. Deveney, T. Ward and G. Begg Approved by: Dr. M. Deveney Sub Program Leader – Marine Pests Signed: Date: 6 June 2012 Distribution: Safework South Australia, SAASC Library, University of Adelaide Library, Flinders University, Institute of Marine and Antarctic Stidues, University of Cape Town, Shark Spotters, Parliamentary Library, State Library and National Library Circulation: Public Domain

Huveneers, C. et al Assessing the efficacy of the Shark ShieldTM
4
TABLE OF CONTENTS 1. PREFACE.................................................................................................................... 10
2. INTRODUCTION ......................................................................................................... 10
2.1 Objectives ............................................................................................................. 14
3. METHODS ................................................................................................................... 14
3.1 Static bait experiments .......................................................................................... 15
3.1.1 Study site ....................................................................................................... 15
3.1.2 Experiments ................................................................................................... 15
3.1.3 Coding of the approaches and interactions with the deterrent ........................ 21
3.1.4 Data analysis ................................................................................................. 21
3.1.5 Assessment of the potential behavioural responses to the deterrent at a small
spatial scale – (a) Vemco Radio-Acoustic Positioning System ..................................... 23
3.1.6 Assessment of the impact of the deterrent on a large spatial scale – (b)
presence/absence experiments ................................................................................... 25
3.2 Dynamic bait experiments ..................................................................................... 25
3.2.1 Study site ....................................................................................................... 25
3.2.2 Tows of seal decoy ........................................................................................ 26
3.2.3 Selection of shark interactions and data coding ............................................. 28
3.2.4 Data analysis ................................................................................................. 30
4. RESULTS .................................................................................................................... 31
4.1 Static bait experiment ........................................................................................... 31
4.1.1 Temporal correlations .................................................................................... 31
4.1.2 Effects of the deterrent on the behaviour of white sharks ............................... 32
4.1.3 Assessment of the impact of the deterrent on a large spatial scale – (a) VRAP
component ................................................................................................................... 40
4.1.4 Assessment of the impact of the deterrent on a large spatial scale – (a)
presence/absence component ..................................................................................... 42
4.2 Dynamic tows ....................................................................................................... 42
5. DISCUSSION .............................................................................................................. 48
6. CONCLUSIONS .......................................................................................................... 54
7. FUTURE RESEARCH ................................................................................................. 55
8. REFERENCES ............................................................................................................ 55

Huveneers, C. et al Assessing the efficacy of the Shark ShieldTM
5
LIST OF TABLES
Table 1. Examples of shark deterrent available. .................................................................. 13
Table 2. Number of trials, approaches, and interactions during which sharks of known identity were observed. ....................................................................................................... 32
Table 3. Summary of Pearson product-moment correlation coefficients for each response variable. .............................................................................................................................. 32
Table 4. Summary of the results obtained from the static bait experiment. SE represents standard error; Distance is the minimum distance between a shark and the deterrent measured for each interaction. This table summarises all data recorded, included for unidentified sharks. ............................................................................................................. 33
Table 5. Number of trials during which a white shark took the bait within the 15-minute period. ................................................................................................................................. 34
Table 6. Generalised Linear Mixed-Model result summary. DF represents degree of freedom............................................................................................................................... 35
Table 7. Summary of tagged sharks and detections. TL is estimated total length; location estimates is the number of location estimates recorded by the VRAP system. .................... 40
Table 8. Summary of the number of tows and interactions obtained when testing the deterrent on a dynamic decoy in South Africa. .................................................................... 44
Table 9. Summary of the proportion of behaviours per video coded and sudden change of direction (used as a proxy for a reaction to the deterrent) per video coded. ........................ 47

Huveneers, C. et al Assessing the efficacy of the Shark ShieldTM
6
LIST OF FIGURES
Figure 1. Location of (A) the North Neptune Island group and (B) where static bait experiments were undertaken. ............................................................................................ 16
Figure 2. Schematic representation of the experimental set-up used to test the deterrent during static bait trials at North Neptune Island in South Australia....................................... 18
Figure 3. Schematic representation of shark approaches and interactions. The bold circle represents the range up to which observers were capable of reliably sighting sharks (20 m); the orange circle represents the position of the static bait; the dashed line represents the track of the shark. (a) shows one approach with three interactions; (b) shows two approaches with one interaction each; (c) represent one approach with two interactions; (d) represent one approach with one interaction. ...................................................................... 20
Figure 4. Study location at Seal Island in False Bay, South Africa. (A) shows the region and False Bay, (B) shows Seal Island with the white line representing the path of the tows. ...... 26
Figure 5. Schematic representation of the experimental set-up used to test the deterrent on dynamic bait (seal decoy) at Seal Island off the coast of South Africa. ................................ 28
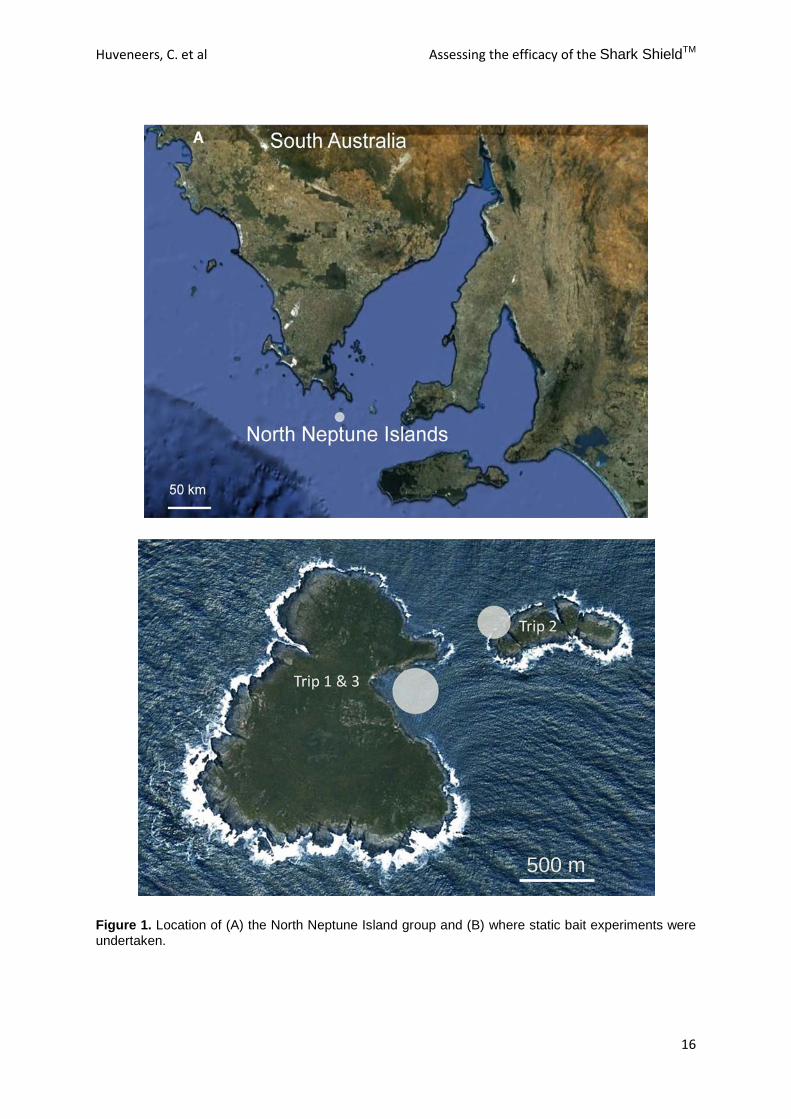
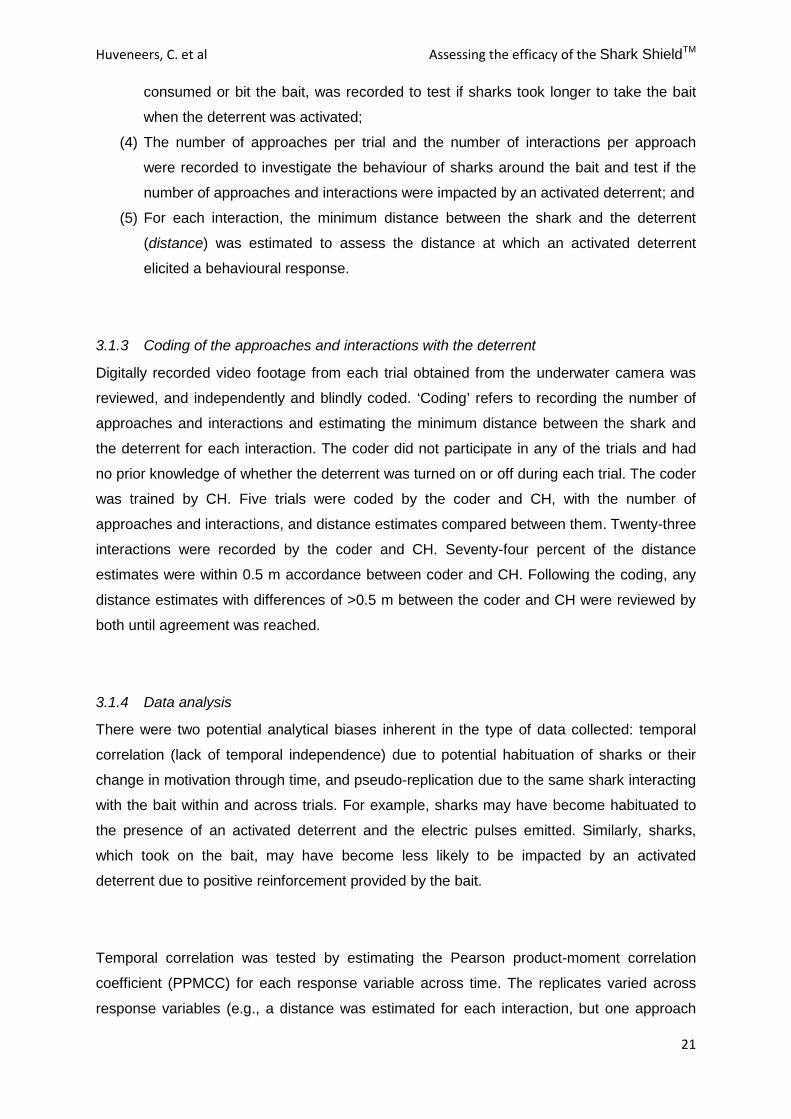
Figure 6. Example of (a) breach and (b) surface interaction. ............................................... 30
Figure 7. Number of seconds before a white shark first approached when the deterrent was turned off or on for each trip separately and for trips combined. White bars represent trials with the deterrent turned off; black bars represent trials with the activated deterrent; error bars represents standard error. ........................................................................................... 35
Figure 8. Number of seconds it took white sharks to take the bait when the deterrent was turned off or on for each trip separately and for trips combined. White bars represent trials with the deterrent turned off; black bars represent trials with the activated deterrent; error bars represents standard error. ........................................................................................... 36
Figure 9. Number of approaches per trial when the deterrent was turned off or on for each trip separately and for trips combined. White bars represent trials with the deterrent turned off; black bars represent trials with the activated deterrent; error bars represents standard error. ................................................................................................................................... 37
Figure 10. Number of interactions per approach when the deterrent was turned off or on for each trip separately and for trips combined. White bars represent trials with the deterrent turned off; black bars represent trials with the activated deterrent; error bars represents standard error. .................................................................................................................... 37
Figure 11. Minimum distance between white sharks and the deterrent bait when the deterrent was turned off and on for each trip separately and for trips combined. White bars represent trials with the deterrent turned off; black bars represents trials with the activated deterrent; error bars represents standard error. .................................................................. 38
Figure 12. Histograms of the minimum distance between white sharks and the deterrent for each interaction when it was turned off (white bars) and turned on (black bars) during (a) Trip 1, (b) Trip 2, (c) Trip 3, and (d) all trips combined. ........................................................ 39
Figure 13. Percentage of locations estimated according to the distance between tagged white sharks and vessels from which trials were undertaken. White bars represent periods during which no trials occurred; grey bars represent periods during which the deterrent was turned off; black bars represent periods during which the deterrent was turned on; N represents number of location estimates obtained per grouping. Location estimates were all obtained during Trip 3. ........................................................................................................ 41
Figure 14. Percentage of detections of 12 acoustically tagged white sharks obtained prior, during, and after the deterrent trials. Error bars represent standard deviation. .................... 42

Huveneers, C. et al Assessing the efficacy of the Shark ShieldTM
7
Figure 15. Proportion of breaches/tow (white), surface interactions/tow (light grey), underwater interactions/video (dark grey), and total number of interactions recorded (surface and on video)/video (black) for 2010 (a), 2011 (b), and years combined (c) compared when the deterrent was turned off or on. Numbers above bars indicate the number of events per replicate. ............................................................................................................................. 45
Figure 16. Proportion of investigations (light grey), aborted breaches (dark grey), and breaches (black) per assessable interaction compared when the deterrent was turned off or on. Numbers above bars indicate the number of event per replicate. .................................. 47
Figure 17. Proportion of sudden changes of direction (light grey), no change of direction (dark grey), and ‘unsure’ (black) per assessable interaction compared when the deterrent was turned off or on. Numbers above bars indicate the number of event per replicate. ....... 48

Huveneers, C. et al Assessing the efficacy of the Shark ShieldTM
8
ACKNOWLEDGMENTS
This project was carried out under the Department of the Environment and Natural
Resources permit number M25738 and M25738-2, PIRSA Exemption number 9902364,
while tagging was undertaken under ethics approval number E287. The South African
component of the project was conducted with a permit from the Department of
Environmental Affairs: Oceans and Coasts Branch (RES2010-74 and RES2011/40).This
project was funded by SafeWork SA, Winifred Scott Charitable Trust, Neiser Foundation,
University of Adelaide, Flinders University, Wildlife Conservation Fund; Nature Foundation of
South Australia, and Solar Online. This research was also partly supported under Australian
Research Council’s Discovery Projects funding scheme (project number DP0988554;
www.arc.gov.au). Fieldwork in South Africa was funded under the umbrella of a Save our
Seas Foundation grant provided to Alison Kock as part of a white shark monitoring project.
The authors thank Andrew Fox, Jennifer Taylor, and Rachel Robbins from the Rodney Fox
Shark Expeditions for the logistic and financial support. Andrew Fox and crew from Rodney
Fox Shark Expeditions, and Andrew Wright and crew from Calypso Star Charters maintained
the VRAP buoys and provided invaluable knowledge about white sharks at the Neptune
Islands. In South Australia, fieldwork was carried out with the help of Andrew Fox, Jennifer
Taylor, Matthew Heard, Jay Van Rijn, Mick Drew, Charles Carter-Richards, Ulysse Bove,
Shannon Corrigan, Nick Payne, Simon Bryars, Mark Whelan, and Jens Neiser. In South
Africa, fieldwork was carried out with the help of Adrian Hewitt, Alison Kock, Morne
Hardenberg, Brock Maxey, Candice Brittan, Lisa Holton, Timo Seckler. Yesmin Chikhani
coded the videos obtained from the GoPro™ digital camera in South Australia. Matthew
Heard, Shannon Corrigan, Holly Frazer, Giverny Rodgers, and Shaun Schroeder coded the
footage obtained from South Africa. Prior to the final coding, Adrian Hewitt, Morne
Hardenberg, Peter Verhoog, and Georgina Wiersma undertook a preliminary coding of the
videos obtained from South Africa. Giverny Rodgers reviewed the footage from the GoPro
from South Africa to identify each white shark interaction. We also thank Barry Drewer of
Seamaster Fishing Supplies for providing us with equipment at the last minute and opening
his shop after hours. Paul Burch and Rick McGarvey provided invaluable advice regarding
the statistical analyses. Barry Bruce and Russ Bradford from CSIRO Marine and
Atmospheric Research collected and kindly provided the data from the coded acoustic
telemetry component. Paul Von Blerk is thanked for the discussions and email exchange
regarding the earlier testing of electric repellents. This is contribution #6 of the Southern
Shark Ecology Group.

Huveneers, C. et al Assessing the efficacy of the Shark ShieldTM
9
EXECUTIVE SUMMARY
• Although shark attacks are rare, their impacts on humans can have serious
consequences. Attacks have increased in Australia from 6.5 to 15 incidents per year
in the last decade.
• One of the most popular personal protective devices used to reduce the risk of shark
attack is the Shark ShieldTM electric deterrent, although its effectiveness has never
been subject to independent scientific testing.
• The present study tested the effects of the Shark Shield Freedom7TM electric
deterrent on (1) the behaviour of white sharks (Carcharodon carcharias) around a
static bait, and (2) the rates of attacks on a towed seal decoy.
• A total of 116 trials using a static bait were undertaken at the Neptune Islands, South
Australia and 189 tows were conducted using a seal decoy near Seal Island, South
Africa.
• The proportion of baits taken during static bait trials was not affected by the
deterrent. The deterrent increased the time it took to take a static bait, and the
number of interactions per approach. The effect of the Shark ShieldTM was not
uniform across all sharks.
• The number of interactions within two metres of the deterrent decreased when it was
activated.
• No breaches and only two surface interactions were observed during the dynamic
seal decoy tows when the deterrent was activated, compared to 16 breaches and 27
surface interactions when the deterrent was not activated.
• Although the fine-scale positioning and presence/absence data collected to assess
the potential of the device to attract white sharks was limited to one trip, our results
did not suggest that sharks were attracted to the deterrent.
• The results showed that the deterrent had an effect on the behaviour of white sharks,
but did not deter or repel them in all situations.
• Future studies should focus on testing the effect of deterrents less than two metres
from the bait, in locations not frequented by cage-diving operators, and on other
potentially dangerous sharks, such as tiger sharks (Galeocerdo cuvier) and bull
sharks (Carcharhinus leucas).

Huveneers, C. et al Assessing the efficacy of the Shark ShieldTM
10
1. PREFACE
The potential for injuries or death in workplaces and during recreational activities as a result
of human-wildlife interactions poses significant concerns for employers and the general
public. Human-wildlife interactions that negatively impact human safety occur with large
terrestrial vertebrates, e.g. wolves (Linnell et al., 2002), tigers (Goodrich, 2010), and
crocodiles (Aust et al., 2009). Occupational Health Safety and Welfare (OHS&W) legislation
requires all employers to provide a safe workplace for their staff, including during fieldwork
and diving (e.g. Occupational Health, Safety and Welfare Act 1986 SA). Several private and
government organisations, especially in South Australia, use the Shark ShieldTM to reduce
the risk of shark attack, and provide a safer environment as part of their standard operating
procedures and OHS&W duty of care. Despite this, several shark attacks involving people
undertaking workplace activities have occurred. This includes attacks on a wildlife tourism
operator (Western Australia, October 2010), a scallop diver (South Australia, April 2002), a
scientific diver (South Australia, August 2005), and an abalone diver in February 2011
(Australian Shark Attack File, unpublished data). During these events, coronial inquests
revealed that an electric deterrent was not worn in one instance, that the device was either
turned off or not used appropriately in two instances, and that the operational status of the
electric deterrent in the last event is still subject to coronial investigations.
With the recent increasing occurrence of shark attacks, and the emphasis on workplace
safety, there is a need for risk reduction benefits of shark deterrent to be independently and
scientifically tested. As a result, SafeWork SA commissioned a study to improve our
understanding of the effects of the Shark ShieldTM on the behaviour of white shark
(Carcharodon carcharias). The study aimed to provide relevant data to assist decision-
making in the role of the Shark ShieldTM in the Australian/New Zealand StandardTM AS/NZ
2299 for occupational diving operations.
2. INTRODUCTION
Although shark attacks are rare, their impacts on humans can have serious consequences.
In general, the risk of shark attack is low when compared to other dangers potentially
encountered by beachgoers, such as drowning, rip currents, and surfboard accidents
(Klimley and Curtis, 2006; Burgess et al., 2010). For example, in Australia there were about
81 fatalities a year from drowning between 2005 and 2010 (Anonymous, 2011), compared to

Huveneers, C. et al Assessing the efficacy of the Shark ShieldTM
11
about one fatality per year from shark attack (International Shark Attack File, unpublished
data).
Globally, the number of shark attacks has been increasing (Burgess et al., 2010; Curtis et
al., 2012). In Australia, the number and risk of shark attacks have also increased, with the
number of recorded incidents more than doubling from about 7 per year in 1990–2000 to 15
per year in 2000–2010 (West, 2011). This has coincided with an increasing human
population (Burgess et al., 2010), more people visiting beaches, a rising popularity of the
coastal lifestyle and marine activities, and increased accessibility of previously isolated
coastal areas (West, 2011). While the risk of a fatality from a shark attack in Australia is low,
South Australia (SA) has had about 70% more fatalities per capita in 1990–2010 than any
other State or Territory (Australian Shark Attack File, unpublished data). The distribution and
number of fatalities is likely related to the distribution and abundance of the potentially
dangerous shark species along the Australian coastline (Curtis et al., 2012). One of the
greatest concentrations of white sharks, which are responsible for most of the fatal attacks
(West, 2011; Curtis et al., 2012), is considered to occur in South Australia (Last and
Stevens, 2009).
Substantial efforts have been made by government agencies to reduce the probability of
shark attacks on the general public. A series of fatal attacks in 2006 led to various meetings
and workshops around the world to describe and review the various shark attack mitigation
measures and shark safety programs worldwide, and assess the best means to mitigate and
respond to such shark attacks (Anonymous, 2006a; Anonymous, 2006b; Nel and Peschak,
2006). The increased recognition of shark vulnerability to population decline (Simpfendorfer
et al., 2011), and interest in shark attacks and means to reduce their likelihood has also led
to a recent publication reviewing shark attack patterns (West, 2011) and recommendations
to government agencies responsible for responding to incidents of shark attacks (Curtis et
al., 2012).
Prevention efforts and responses to shark attacks have varied temporally and regionally, and
have included shark hunts, organised shark culling programs, beach meshing and
drumlines, beach closures, shark fences, land- and aerial-based shark spotting, and acoustic
telemetry (for a review, see Curtis et al. (2012)). While these measures aim to reduce the
probability of a shark-human encounter, other measures aim to directly repel sharks from

Huveneers, C. et al Assessing the efficacy of the Shark ShieldTM
12
approaching individuals undertaking marine activities. These deterrents have been
developed to illicit a response by impacting on one or more of the shark senses, including
vision, smell, taste, and electro-reception (Table 1). For example, various aposematic colour
configurations (use of colours as anti-predator tactics) have been proposed to allegedly repel
sharks. The use of chemicals as shark repellents has also been proposed (Baldridge, 1990;
Rasmussen and Schmidt, 1992; Sisneros and Nelson, 2001). The sensitivity of the electro-
receptive organ of sharks, however, has been the most studied in relation to developing a
shark repellent.
Sharks and rays are capable of detecting weak electromagnetic fields (Kalmijn, 1966).
Several biological functions of the ampullary electrosense have been proposed, including
prey detection (Kalmijn, 1971; Blonder and Alevizon, 1988; Lowe et al., 1994; Haine et al.,
2001; Kajiura and Holland, 2002a), detection of predators (Peters and Evers, 1985; Sisneros
et al., 1998), social communication (Bratton and Ayers, 1987; Sisneros et al., 1998),
detection of mates (Tricas et al., 1995) and magnetoreception/geonavigation (Kalmijn, 1974;
Kalmijn, 1978; Paulin, 1995). The electro-reception detection threshold is species-specific,
but sharks and rays are able to respond physiologically and behaviourally to weak, low
frequency electric fields of 10 nV/cm and 5 nV/cm, respectively (Dijkgraff and Kalmijn, 1962;
Dijkgraaf and Kalmijn, 1966; Kalmijn, 1982), and show a behavioural response at levels as
low as <1nV/cm (Kajiura and Holland, 2002b; Jordan et al., 2011). Ongoing studies initiated
in the 1960s have attempted to overwhelm the electro-receptive organs to deter sharks by
applying a strong localised electric or magnetic field, (Smith, 1966; Gilbert and Gilbert, 1973;
Smith, 1973; Smith, 1974; Smith, 1990). It has also been speculated that sharks might
detect the pulses emitted by an electric deterrent from a long distance and confuse it with
that emitted by potential prey. This has created growing concerns that electric deterrents
may attract sharks from a distance prior to repelling them when in close proximity.

Huveneers, C. et al Assessing the efficacy of the Shark ShieldTM
13
Table 1. Examples of shark deterrent available.
Sensory organ Product Webpage
Vision-based deterrent The ‘Shark Camo’ surfershotshop.com/vmchk/surf-accessories/surf-
essentials/shark-camo-shark-repellent.html
Extreme green laser www.airbuddy.com/id47.htm
Sharkproof mask strap www.sharks-diving.com
Taste-based deterrent
Bite kit www.repelsharks.com/index.php?main_page=product_info&cP
ath=9&products_id=12
Smell-based deterrent
Aerosol canisters www.repelsharks.com/index.php?main_page=index&cPath=1
BCB Shark repellent www.bestglide.com/shark_repellent.html
Electro-reception-based
deterrent
Shark Shocker thesharkshocker.com
AquaShield www.aquashield.us.com
Magnetic string anklet www.repelsharks.com/index.php?main_page=index&cPath=7&
zenid=l43jeuqgptbhdbf08juusie4o6
Electronic Shark
Defence System
www.surfertoday.com/surfing/7071-electronic-shark-defense-
system-is-activated
Shark ShieldTM sharkshield.com
The scientific robustness of the tests undertaken to assess the efficacy of these various
devices varies extensively. Only a few shark repellents have been scientifically tested with
results published in peer-reviewed literature: rare earth metals (Kaimmer and Stoner, 2008;
Stoner and Kaimmer, 2008; Wang et al., 2008; Brill et al., 2009; Tallack and Mandelman,
2009; Robbins et al., 2011) and magnets have been tested for use as shark bycatch and
depredation mitigation (Rigg et al., 2009; Robbins et al., 2011), whereas semiochemical
repellents (Sisneros and Nelson, 2001) and electric impulses (Smit and Peddemors, 2003;
Robbins and Peddemors, unpublished data; Broad et al., 2010) have been tested as
personal shark deterrent.
Electric shark deterrents have become the most popular personal protective devices.
Research on electric deterrents was first initiated in the 1960s by the South African Council
for Scientific and Industrial Research (Smith, 1973; Smith, 1974; Smith, 1990) for beach
protection. This program was discontinued in 1988 due to the maintenance costs of such a
system and following an ineffective trial (Cliff, 1988). The inefficacy of the electric barrier was
later attributed to inadequate handling and lack of recovery of the shark test subjects, rather
than the actual failure of the system (Smith, 1990). The Natal Sharks Board (NSB), (now
called KwaZulu Natal Sharks Board, KZNSB), subsequently investigated the concept of
using electrical fields to create a personal deterrent. As a result, the SharkPODTM (Protective
Oceanic Device) was invented and patented in 1995. The KZNSB led various tests of the
SharkPODTM, which concluded that the probability of an attack was reduced from about 0.70
in power-off mode to about 0.08 in power-on mode (Smit and Peddemors, 2003). In 1999, an

Huveneers, C. et al Assessing the efficacy of the Shark ShieldTM
14
Australian company, SeaChange (now Shark Shield Pty Ltd), was established to develop
and produce a modern range of electric shark deterrents based on the SharkPODTM
patented waveform technology. Several personal protection devices were created under the
label of Shark ShieldTM.
While the electric waveform was not changed between the SharkPOD™ and SharkShield
Freedom7™, the configuration of the electrodes was, as well as the casing of the electronic
components and the way the device is worn. In the case of a SharkPODTM, one electrode
was worn on the scuba diver’s tank with the other electrode located on the ankle of the diver,
which is the equivalent to the Shark Shield Scuba7TM, whereas with a Shark Shield
Freedom7TM, divers have both electrodes streaming off an ankle strap with the first electrode
about 10–20 cm off the ankle and the second electrode about 200 cm from the diver. Due to
this change, SeaChange undertook in-house testing of the strength of the Shark ShieldTM
electric pulse (P. Gapp, pers. comm.). The effects of the currently available Shark ShieldTM,
however, have never been independently and scientifically tested.
2.1 Objectives
The objective of this study was to assess the effects of the Shark Shield Freedom7TM on the
behaviour of white sharks. This species was selected because it is responsible for the most
unprovoked attacks and fatalities (in Australia, 19.5% and 34%, respectively) (West, 2011;
Curtis et al., 2012). Specifically, we aimed to:
1. Assess the efficacy of the Shark Shield Freedom7TM at reducing or preventing white
sharks from obtaining (1) a natural prey item, and (2) a towed seal decoy;
2. Investigate the behavioural response of white sharks exposed to a Shark Shield
Freedom7TM; and
3. Determine if the Shark Shield Freedom7TM attracts white sharks from a distance prior
to repelling them at closer range.
3. METHODS
Field experiments were designed to test the effects of the Shark Shield Freedom7TM electric
deterrent (hereafter referred to as the deterrent) on (1) the behaviour of white sharks around
a static bait, and (2) rates of attacks on a towed seal decoy.

Huveneers, C. et al Assessing the efficacy of the Shark ShieldTM
15
3.1 Static bait experiments
3.1.1 Study site
The static bait experiments were undertaken at the North Neptune Island group (35°149 S;
136°049 E) about 25 km south of Spencer Gulf, on three occasions: Trip 1: 11/10/2010–
14/10/2010, Trip 2: 8/02/2011–10/02/2011, and Trip 3: 6/07/2011–7/07/2011 (Figure 1).
The Neptune Islands have been the site of commercial cage-diving with white sharks since
the late 1970s (Bruce 2009). While other areas were previously also used for cage-diving, in
2002 all commercial operations were restricted to the Neptune Islands Conservation Park.
Both the South and North Neptune groups are open to cage-diving operations, but the North
Neptune group is most frequently used (Bruce and Bradford, 2011).
3.1.2 Experiments
White sharks were attracted to the vessel using an odour corridor consisting of unrefined fish
oil, minced southern bluefin tuna Thunnus maccoyii (SBT) and its blood, and sea water,
delivered at a low rate through overflowing the container with a continuous flow of water.
Sections of SBT were attached with short lengths of natural fibre to a float and to a line of
about 15 m in length. The SBT section was allowed to drift from the stern of the vessel to
attract white sharks.
Huveneers, C. et al Assessing the efficacy of the Shark ShieldTM
16
Figure 1. Location of (A) the North Neptune Island group and (B) where static bait experiments were undertaken.
B
500 m

Huveneers, C. et al Assessing the efficacy of the Shark ShieldTM
17
Trials commenced after a white shark was sighted near the vessel at least twice within five
minutes or when a shark showed consistent interest in the tethered bait. Each trial consisted
of the deployment of fresh SBT bait (about 6 kg). The head and tail section of the SBT tuna
were not used during the trials to keep the size and weight of the bait consistent. The bait
was attached about 50 cm beneath a small foam float (150 mm diameter), which was kept
150 cm from a large foam float (305 mm diameter) by a PVC pipe (Figure 2). A 2-mm
diameter plastic-coated wire 550 mm in length was attached to the large foam float, with two
about 2 kg dive weights attached to its distal end. A deterrent was attached to the wire 150
cm below the large foam float and a waterproof camera (GoProTM) was attached at the end
of the wire, 400 cm away from the deterrent (550 cm from the large float). The large foam
float was connected to the stern of the anchored vessel and left to drift with the wind and tide
at a distance of 5–15 m from the vessel. The distance of the equipment from the vessel
varied depending on the wind, swell, tide, and glare conditions to ensure that surface
observers could record the behaviour of the sharks accurately. Another small foam float (150
mm diameter) was attached 3 m from the large foam float on the line between the vessel
and the large foam float to provide a known measurement and help with the estimation of
shark total length and distance between a shark and the equipment (Figure 2). The bait and
small foam float were kept away from the deterrent and camera to prevent sharks from biting
it or becoming entangled in the rope or wire. It also provided a known distance to calibrate
shark length and distance. The minimum distance between the bait and the deterrent was
100 cm with the maximum distance being about 300 cm. The static bait was mostly 160–180
cm from the deterrent due to wind and current acting on the deterrent and bait in a similar
direction and at the same intensity. The equipment was deployed to replicate the normal use
of the deterrent on the ankle of a swimmer or diver with the centre of the electrodes about
180 cm from the head of the user.

Huveneers, C. et al Assessing the efficacy of the Shark ShieldTM
18
Figure 2. Schematic representation of the experimental set-up used to test the deterrent during static bait trials at North Neptune Island in South Australia.
Each trial was observed by two people and lasted 15 minutes or until a shark took the bait.
The status of the deterrent (on or off) was randomised before each trial. Prior to and
following each trial during which the deterrent was switched on, the device was tested to
ensure that electric impulses were being emitted and that the individual trial was undertaken
with the deterrent operating according to the manufacturer’s specifications.
The following terminology was used to describe shark behaviour and assess the effects of
the deterrent.
Approach (Figure 3) – An approach was defined as when a shark was observed within 20 m
of the static bait and deterrent. In most situations, observers were not able to maintain visual
contact with a shark when it was > 20 m from the static bait and deterrent.
Interaction (Figure 3) – An interaction was defined as a directed swim towards the static
bait. Each time a shark veered away from the static bait and went back towards the static
bait, it was considered as a new interaction. The first interaction coincided with an approach
until the shark turned away from the static bait. A shark then either swam > 20 m away from

Huveneers, C. et al Assessing the efficacy of the Shark ShieldTM
19
the static bait (one approach, one interaction), or turned around and took another directed
swim towards the static bait (one approach, two interactions). An approach always had at
least one interaction, but could have several interactions within an approach sequence.
Supplementary electronic information A provides an example of a white shark taking the bait
preceded by one approach and one interaction. Supplementary electronic information B
provides an example of a white shark making one approach with six interactions before
taking the bait.
During each trial, the number of individual approaches was recorded. For each approach,
the number of interactions was recorded. For each interaction, the minimum distance
between the shark and the deterrent was recorded (hereafter referred to as distance) as well
as whether a shark took the static bait. The start time of the trial, the time of the first
approach (indicating how long it took for a shark to show initial interest in the bait), and the
length of the trial (15 minutes or less if a shark took the static bait) were also recorded.
Shark identity was recorded for each individual shark using natural markings and colouration
(Domeier and Nasby-Lucas, 2007). Three physical features were used for shark
identification: the trailing edge of the first dorsal fin (e.g., Anderson et al., 2011; Chapple et
al., 2011), the pigmentation of the lower caudal fin (e.g., Domeier and Nasby-Lucas, 2007),
and external markings or scars (e.g., fin damage, major scars).

Huveneers, C. et al Assessing the efficacy of the Shark ShieldTM
20
Figure 3. Schematic representation of shark approaches and interactions. The bold circle represents the range up to which observers were capable of reliably sighting sharks (20 m); the orange circle represents the position of the static bait; the dashed line represents the track of the shark. (a) shows one approach with three interactions; (b) shows two approaches with one interaction each; (c) represent one approach with two interactions; (d) represent one approach with one interaction.
Several response variables were used to assess the effects of the deterrent:
(1) The proportion of static baits taken by sharks was recorded to test whether an
activated deterrent was effective at reducing or preventing baits being eaten;
(2) The time for the first approach (hereafter referred to as ‘approach time’), defined as
the time between deployment of the experimental gear and the first approach within
20 m from the bait, was recorded to determine if sharks already present in the area
were attracted to an activated deterrent prior to being repelled from a closer distance;
(3) The time taken for a shark to take the bait (hereafter referred to as ‘bait time’),
defined as the time between deployment of the experimental gear and when sharks
Huveneers, C. et al Assessing the efficacy of the Shark ShieldTM
21
consumed or bit the bait, was recorded to test if sharks took longer to take the bait
when the deterrent was activated;
(4) The number of approaches per trial and the number of interactions per approach
were recorded to investigate the behaviour of sharks around the bait and test if the
number of approaches and interactions were impacted by an activated deterrent; and
(5) For each interaction, the minimum distance between the shark and the deterrent
(distance) was estimated to assess the distance at which an activated deterrent
elicited a behavioural response.
3.1.3 Coding of the approaches and interactions with the deterrent
Digitally recorded video footage from each trial obtained from the underwater camera was
reviewed, and independently and blindly coded. ‘Coding’ refers to recording the number of
approaches and interactions and estimating the minimum distance between the shark and
the deterrent for each interaction. The coder did not participate in any of the trials and had
no prior knowledge of whether the deterrent was turned on or off during each trial. The coder
was trained by CH. Five trials were coded by the coder and CH, with the number of
approaches and interactions, and distance estimates compared between them. Twenty-three
interactions were recorded by the coder and CH. Seventy-four percent of the distance
estimates were within 0.5 m accordance between coder and CH. Following the coding, any
distance estimates with differences of >0.5 m between the coder and CH were reviewed by
both until agreement was reached.
3.1.4 Data analysis
There were two potential analytical biases inherent in the type of data collected: temporal
correlation (lack of temporal independence) due to potential habituation of sharks or their
change in motivation through time, and pseudo-replication due to the same shark interacting
with the bait within and across trials. For example, sharks may have become habituated to
the presence of an activated deterrent and the electric pulses emitted. Similarly, sharks,
which took on the bait, may have become less likely to be impacted by an activated
deterrent due to positive reinforcement provided by the bait.
Temporal correlation was tested by estimating the Pearson product-moment correlation
coefficient (PPMCC) for each response variable across time. The replicates varied across
response variables (e.g., a distance was estimated for each interaction, but one approach

Huveneers, C. et al Assessing the efficacy of the Shark ShieldTM
22
time was obtained per trial), therefore the time variable changed depending on the response
variable being tested. Trial number was used for approach time, bait time, and number of
approaches per trial, whereas approach number was used for the number of interactions per
approach, and interaction number was used for the distance. Four months elapsed between
the field trips and different sharks were observed during each trip, so the PPMCCs were
calculated independently for each trip. A PPMCC between the response variables and the
respective time variable of ±0.9–1, 0.7–0.9, 0.5–0.7, 0.3–0.5, and 0–0.3 was considered as a
very strong correlation, a strong correlation, a moderate correlation, a weak correlation, and
negligible correlation, respectively.
The proportion of baits taken by sharks was compared using the minlike two-sided Poisson
exact test from the exactci R package (R statistical software, Ver. 2.13.1) (R Development
Core Team, 2011) (Fay, 2010). The minlike two-sided method was chosen because it is
generally more powerful than the central two-sided method (Fay, 2010).
Pseudo-replication was managed by testing the effects of the deterrent for all other response
variables using a Generalised Linear Mixed-Model (GLMM) through the functions with
individual shark as the ‘random effect’ and the deterrent operational status as the ‘fixed
effect’. This could not be undertaken for the proportion of baits taken due to the small
sample size. The error structure of GLMM corrects for non-independence of statistical units
due to shared temporal structure, and permits the ‘random effects’ variance explained at
different levels of clustering to be decomposed. The inclusion of individual shark as a
random effect enabled the analysis to account for the lack of independence in behaviour
within each identified shark. Each approach or interaction for which shark identification could
not be determined was excluded from this analysis. The most appropriate statistical family
and error distribution for each analysis was determined through the examination of the
distribution of the response variable, a visual inspection of the residuals for the saturated
models, and the Akaike Information Criteria value (measure of the relative goodness of fit of
a statistical model) (Burnham and Anderson, 2002) when available (depending on the R
function used between glmmPQL - library MASS, lmer - library lme4, and glmmML - library
glmmML).
Finally, the effects of the deterrent were tested by comparing the distributions of the
minimum distance recorded for each interaction using a Kolmogorov-Smirnov (K-S) test

Huveneers, C. et al Assessing the efficacy of the Shark ShieldTM
23
(Massey, 1951) and by comparing the proportion of interactions within 2 m using the minlike
two-sided Poisson exact test from the exactci R package.
3.1.5 Assessment of the potential behavioural responses to the deterrent at a small spatial scale – (a) Vemco Radio-Acoustic Positioning System
A Vemco Radio-Acoustic Positioning (VRAP) system (VEMCO Ltd., Halifax, Canada) was
deployed off North Neptune Islands to determine if the deterrent impacts the behaviour of
sharks at spatial scales of >20 m; i.e. outside the spatial scale of the static bait experiments.
This component of the project was undertaken to address the question of whether sharks
already within the area are attracted to the deterrent from a certain distance prior to being
repelled by it at a short distance.
The VRAP consisted of three surface buoys deployed in a near equilateral triangle
(distances between buoys ranged from 0.324 to 0.340 km, area = 0.052 km2) and a shore
station in line-of-sight. The locations and distance between the buoys were chosen to ensure
that all three hydrophones could detect sharks located in the middle of the array, taking into
account environmental noise caused by adverse weather or organisms such as snapping
shrimp, and to minimise exposure to extreme weather. O’Dor et al. (1998) and Klimley at al.
(2001) provide a detailed description of how the VRAP system estimates the position of
tagged organisms. In summary, each buoy is equipped with a multi-directional hydrophone
which detects pulses emitted by the transmitters. The received information is transmitted to
the shore station via radio signals where the position of each transmitter is calculated based
on the arrival times of the acoustic pulses to each buoy and triangulates the latitude and
longitude of each animal fitted with an acoustic transmitter. As the transmitters were also
fitted with a pressure sensor, the depth was also recorded by the buoys.
The precision of the estimated locations can be up to ±1 m (Zamora and Moreno-Amich,
2002; Barnett et al., 2010). The precision of calculated positions in the current study was
also high, with the deployment of sentinel transmitters following the deployment of the VRAP
showing a similar level of accuracy within our system.
The shore station was powered by a 167Ah gel battery and two Solar-E 80W solar panels
installed with a Powerstar 12 V 20A regulator. Following the first deployment, which required

Huveneers, C. et al Assessing the efficacy of the Shark ShieldTM
24
frequent recharging of the batteries (every one to two weeks), solar panels were installed on
the buoys, which prevented the need to recharge them. Buoys were powered by one Solar-E
20W solar panel installed with a Morningstar 4.5A regulator. Due to the remote location of
North Neptune Islands and the logistical difficulties involved in getting to the shore station,
the working order of the equipment was only checked every 1–2 months.
The buoy positions were calibrated by the VRAP at the start of each deployment. Further
calibration of the buoy positions after the initial calibration was unnecessary as the buoys
were securely moored and unlikely to be moving. This also increased the time the shore
station listened for the transmitters rather than re-calibrating at regular intervals. The VRAP
was set to listen to each selected frequency for 10 seconds with the number of frequencies
selected at any one time ranging from one to nine. The ten-second listening period for each
transmitter was, consequently, repeated about every 10 to 90 seconds depending on the
number of transmitters selected at the time.
Sharks were tagged with continuous acoustic transmitters (VEMCO Ltd., Halifax, Canada)
between the 13th of December 2009 and the 11th of September 2011. Transmitters recorded
depth via a calibrated pressure sensor. Transmitters were V16P-5H programmed to transmit
every about 1 second and had a predicted battery life of about 50 days. Transmitters were
glued to a small anti-fouled net float with waterproof Araldite to ensure that transmitters
would remain above the shark’s skin and reduce the likelihood of any potentially harmful
effects of friction. The net float was tethered to a plastic umbrella dart DomeierTM tag using a
10–15 cm long, 1 mm thick stainless wire trace. Transmitters were implanted using a pole
and stainless steel applicator in the dorsal musculature of sharks that were attracted to the
vessel with berley independently from the experiments.
A Pearson's goodness-of-fit test was undertaken to assess whether the percentage of
detections within specific distances from the berleying vessels (0–29, 30–59, 60–89, 90–
119, and > 120 m) changed when the deterrent was activated. These percentages were also
tested against periods during which trials were not being undertaken. Although no trials were
carried on during those periods, the berley vessels and bait were still present to maintain
sharks’ interest towards the vessel as part of normal cage-diving operations.

Huveneers, C. et al Assessing the efficacy of the Shark ShieldTM
25
3.1.6 Assessment of the impact of the deterrent on a large spatial scale – (b) presence/absence experiments
Due to the limited data obtained by the VRAP system (see results), further analysis was
undertaken using data collected by the Commonwealth Scientific and Industrial Research
Organisation (CSIRO), during a study that aimed to assess the effects of berleying on the
distribution and behaviour of white sharks (Bruce and Bradford, 2011). As part of this project,
ten acoustic receivers (VR2W and VR3-UWM) were deployed at North Neptune Islands over
two consecutive periods between December 2009 and April 2011, encompassing two of the
three trips undertaken to test the effects of the deterrent. This was also complemented by an
existing, iridium satellite-linked acoustic receiver (VR4-Global [VR4G]; Vemco-Amirix Ltd,
Halifax, Canada) which has been maintained within the main island’s bay since 1 April 2008
(Bradford et al., 2011). Sharks were tagged with coded V16-6H in a similar way to the
continuous transmitters, but without a net float and using a metal dart head instead of an
umbrella plastic dart.
For each shark present during the experiment, the number of coded acoustic detections
during days (four, three, and two days during Trip 1, 2, and 3, respectively) and times (8:00–
18:00 hrs) when the experiments were running was averaged as the number of
detections/day. These were then compared to the number of detections/day averaged over
the two days directly prior and after the trips were undertaken. A oneway-ANOVA was used
to test if the number of detections/day during the experiments was different to the days prior
or after the experiments.
3.2 Dynamic bait experiments
3.2.1 Study site
The dynamic bait experiments were conducted off Seal Island, in False Bay, south of Cape
Town, in the Western Cape region of South Africa (Figure 4). Seal Island is the second
largest Cape fur seal (Arctocephalus pusillus pusillus) breeding colony in South Africa, and
the largest island colony (between 36 000 and 77 000 individuals depending on the time of
the year) (Kirkman et al., 2007). The ocean floor off the southern and western sides of the
island descends quickly to depths > 20 m, while on the northern and eastern sides, the slope
is more gradual. The waters surrounding the island support large numbers of white sharks
from May through September (Hammerschlag et al., 2006; Laroche et al., 2008). This site
was chosen because it has a high recorded rate of predatory behaviour of white sharks on
pinnipeds (Laroche et al., 2008). At this location, sharks are regularly observed to breach out

Huveneers, C. et al Assessing the efficacy of the Shark ShieldTM
26
of the water during natural predation events. It was assumed that this breaching behaviour
would provide a good opportunity to test the effect of the deterrent when a shark is engaging
in predatory behaviour. Such breaching behaviour is regularly elicited by wildlife tourism
operators by towing a seal-shaped decoy around Seal Island (Hammerschlag et al., 2006).
Furthermore, experimental decoy tows have been successfully used to study Cape fur seal
predation risk when moving near Seal Island (De Vos and O’Riain, 2010). Therefore, we
undertook experimental tows of a seal decoy to determine if the deterrent reduced the
likelihood of a shark interacting with or undertaking breaching behaviour on a seal decoy.
Figure 4. Study location at Seal Island in False Bay, South Africa. (A) shows the region and False Bay, (B) shows Seal Island with the white line representing the path of the tows.
3.2.2 Tows of seal decoy
A fibreglass coated foam seal-shaped decoy was towed 20–25 m behind a vessel at a speed
of 8–10 km.hr-1. This speed was chosen based on records of travelling speeds of Cape fur
seals leaving Seal Island (De Vos and O’Riain, 2010). Towing was only undertaken when
wind speed was less than 15–20 knots. During stronger winds, the seal decoy regularly went
underwater making it impossible to tow adequately. To maximise the chance of eliciting a
predatory response to the decoys, tow time and route were chosen based on the knowledge
(A) (B)

Huveneers, C. et al Assessing the efficacy of the Shark ShieldTM
27
that predator-prey activity is spatio-temporally confined and predictable at Seal Island
(Laroche et al., 2008). Tows were confined to the sunrise (low light) and mid-morning
periods between 6:30–10:00 am and covered the area between 1 km south of Seal Island
towards the Island and the southern tip of the island called the “launch pad” (Laroche et al.,
2008), to the West about 50–150 m from the Island, and the Northwest area of Seal Island
(Figure 5). Tows were 1.7–2 km long and undertaken in both a North and South direction.
The deterrent was affixed to a small black trolling paravane or underwater glider (175 X 75
mm) to ensure that the equipment glided through the water at a suitable angle to record
shark approaches and interactions with the decoy. Two 2-pound (907 g) weights were
attached to the paravane to bring the deterrent to a water depth of about 180 cm and to
prevent the deterrent from streaming along the surface, which could reduce its effectiveness.
An underwater camera (GoProTM) was fixed to the paravane to record interactions between
sharks and the seal decoy, including those not visible from the surface (e.g. aborted
breaches). The deterrent, paravane, and camera were connected to the vessel via 2-mm
wire to avoid the loss of the equipment in case of a physical interaction between the
equipment and the shark. The seal decoy was linked to the wire by a 1.2-mm diameter nylon
fishing line of about 250 cm long. The equipment was configured so that the decoy would be
slightly behind the end tip of the deterrent to reduce the potential for visual and/or physical
distraction for a shark breaching. The distance between the seal-decoy and the deterrent
was about 210 cm.
Prior to each experimental tow, the wind direction and speed, cloud cover, and swell height
were estimated and the water visibility was measured using a secchi disk. During each tow,
the following data and observations were recorded: the start and end locations, duration of
the tow, breaches and/or investigations, and other seal and shark activities.

Huveneers, C. et al Assessing the efficacy of the Shark ShieldTM
28
Figure 5. Schematic representation of the experimental set-up used to test the deterrent on dynamic bait (seal decoy) at Seal Island off the coast of South Africa.
3.2.3 Selection of shark interactions and data coding
All digital recorded footage collected during the dynamic bait experiment was reviewed by
CH. Following the first year of towing, the video footage was also independently reviewed by
another scientist to ensure that CH was not missing interactions. CH recorded 34
interactions and the other scientist observed 31 of the same plus one interaction that was
not recorded by CH. The four interactions that were not detected by both scientists were of
very poor quality due to the sharks remaining away from the camera and decoy. As a result,
the behaviour of sharks during these interactions could not be determined and all
interactions close enough for behaviours to be determined were recorded by both scientists.
Footage from the second year of towing was only reviewed by CH. Once the interactions
were identified from the video footage, they were isolated and clipped with Camtasia Studio
7.0 (TechSmith, Okemos, Michigan, USA) for further coding. Out of those clipped portions of
the footage, interactions during which shark behaviour could not be determined (e.g., due to
low visibility, distance of the shark, and framing) were discarded to remove any ambiguous
interactions. Each interaction was categorised as:
• A breach: A breach is defined as an interaction during which a shark leaps out of the
water, with several subtypes described by Martin et al (2005) (Supplementary
electronic information C, D, Figure 6a);
• A surface interaction: interactions during which sharks did not leap out of the water
but during which dorsal or caudal fins were visible above the water such as during
lateral roll, surface arc, direct or surface approach in Martin et al (2005)
(Supplementary electronic information E, Figure 6b); or

Huveneers, C. et al Assessing the efficacy of the Shark ShieldTM
29
• An underwater interaction: interactions were not visible from the surface
(Supplementary electronic information F).
Seven scientists not present during the trials further coded each recorded interaction, based
on the underwater footage, into either investigation, breach, or aborted breach, and
assessed whether each approach concluded with a sudden change of direction (potential
response to an activated deterrent, categorised as ‘yes’, ‘no’, or ‘unsure’) (Supplementary
electronic information G, H).
• An investigation was defined as any interaction during which a shark approached the
decoy at a slow speed or at a vertical angle of less than 30° (Supplementary
electronic information I). Speed was assessed using the time between shark
appearance on the footage and when it got within 2 m of the seal decoy. Angle of
approach was estimated by looking at the angle difference between the shark body
and the water surface when 2 m away from the seal decoy.
• A breach was defined as when a shark approached the decoy with speed and at an
angle of more than 30°, and finished the approach by leaping partially or completely
out of the water (Supplementary electronic information C, D).
• An aborted breach was defined as when a shark approached the decoy with speed
and at an angle of more than 30° within 3 m, but did not complete the approach and
did not breach the water surface (Supplementary electronic information J).
Additionally, the level of confidence in the coding was recorded using a three-level
confidence scale from one to three with one indicating a small amount of confidence in the
coding assigned and three indicating a high level of confidence. To avoid including the
interactions where coders were not confident in their interpretation or where coders
disagreed, any coding data obtained with a confidence rating of one or with less than 70%
agreement between coders, were excluded from the analysis.
Huveneers, C. et al Assessing the efficacy of the Shark ShieldTM
30
Figure 6. Example of (a) breach and (b) surface interaction.
3.2.4 Data analysis
The efficacy of the activated deterrent in repelling white sharks from attacking a towed seal
decoy was assessed by comparing the number of breaches, surface interactions,
underwater interactions, and total number of interactions using the minlike two-sided
Poisson exact test from the exactci R package (Fay, 2010). The proportion of breaches,
aborted breaches and investigations coded and the proportion of interactions to include a
reaction to an activated deterrent were also tested using the same minlike two-sided Poisson
exact test. While the results are provided for each year independently and for years
combined, statistical tests were only undertaken on data combining both years due to the
limited number of interactions during individual years.
For all statistical analyses (for static and dynamic experiments), P<0.05 was considered
statistically significant.
© Cheryl-Samantha Owen/Save our Seas Foundation

Huveneers, C. et al Assessing the efficacy of the Shark ShieldTM
31
4. RESULTS
4.1 Static bait experiment
A total of 116 trials were completed, with 28, 64, and 24 during Trips 1, 2, and 3,
respectively. Of these, 49 trials were done with the deterrent turned off (16, 25, and 8 during
Trips 1, 2, and 3, respectively) and 67 with it turned on (12, 39, and 16 during Trips 1, 2, and
3, respectively). A total of 314 approaches and 527 interactions by 18 different white sharks
were observed. Most sharks approached the bait and equipment during trials when the
deterrent was both off and on. Out of the three trips, four sharks were observed only when
the deterrent was turned on while one shark was only observed when the deterrent was
turned off. Individual identification of white sharks was generally possible, but could not be
made during 132 approaches (42%) and 179 interactions (34%). Many of the individual
sharks interacted with the bait and the deterrent on several occasions, with the number of
trials during which an identified shark interacted with the deterrent ranging from 1 to 27
(mean ± standard deviation: 6.89 ± 7). The number of approaches per identified shark
ranged from 1 to 40 (10.11 ± 10), while the number of interactions per identified shark
ranged from 1 to 71 (19.33 ± 21) (Table 2). During a single trial, the maximum number of
approaches, interactions, and interactions per approach was 12, 29, and 18, respectively.
4.1.1 Temporal correlations
The behaviour of the sharks did not seem to change over time as little or no temporal
correlation (0–0.3) was found during each trip or for any response variable (Table 3). The
strongest correlations (-0.25 and -0.3) occurred during Trip 3 and were for bait time and the
number of approaches per trial. This suggested that during the third Trip, sharks were taking
the bait slightly faster and undertaking slightly fewer approaches as the trials were being
undertaken. These correlations, however, were weak.

Huveneers, C. et al Assessing the efficacy of the Shark ShieldTM
32
Table 2. Number of trials, approaches, and interactions during which sharks of known identity were observed.
Shark # of trials Approaches Interactions
1 9 10 20
2 8 17 22
3 27 40 67
4 14 25 39
5 13 17 71
6 1 1 2
7 11 12 21
8 4 5 19
9 1 1 1
10 9 18 23
11 1 1 8
12 3 3 3
13 11 13 17
14 4 6 7
15 1 1 3
16 2 3 12
17 1 1 1
18 4 8 12
Unknown 61 132 179
Total 185 314 527
Table 3. Summary of Pearson product-moment correlation coefficients for each response variable. Response variable Trip 1 Trip 2 Trip 3
Approach time -0.153 -0.041 -0.174
Bait time -0.182 -0.011 -0.247
Approaches per trial 0.013 0.001 -0.300
Interactions per approach 0.034 0.001 0.001
Distance -0.114 0.037 -0.175
4.1.2 Effects of the deterrent on the behaviour of white sharks
The bait was taken within the 15-minute period during 78% of the trials, with the deterrent
not affecting the likelihood of the baits being taken. There was no significant difference
between the proportion of bait taken when the deterrent was turned off or on, regardless of
the trips being combined (Poisson exact test: p=1.00) or separated (Poison exact test: Trip
1: p=0.60; Trip 2: p=0.89; and Trip 3: p=0.82) (Table 4).

Huveneers, C. et al Assessing the efficacy of the Shark ShieldTM
33
Table 4. Summary of the results obtained from the static bait experiment. SE represents standard error; Distance is the minimum distance between a shark and the deterrent measured for each interaction. This table summarises all data recorded, included for unidentified sharks. Trip 1 Trip 2 Trip 3 Total
OFF ON Total OFF ON Total OFF ON Total OFF ON Total
Number of trials 16 12 28 25 39 64 8 16 24 49 67 116
Number of sharks 2 2 3 9 12 12 3 4 4 14 17 18
Number of approaches 19 14 33 54 162 216 20 45 65 93 221 314
Number of interactions 27 23 50 65 324 389 29 59 88 121 406 527
Number of baits taken 10 5 15 22 33 55 6 15 21 38 53 91
Percentage of bait taken 62.5% 41.7% 53.6% 88.0% 84.6% 85.9% 75.0% 93.8% 87.5% 77.6% 79.1% 78.4%
Mean Approach time (sec) 168 119 151 88 67 75 94 51 66 112 69 87
SE Approach time (sec) 65 38 44 27 11 75 37 15 66 24 9 12
Mean Bait time (sec) 222 244 229 133 248 202 173 196 189 163 233 204
SE Bait time (sec) 82 87 60 27 36 25 82 64 50 29 30 21
Mean Approaches/trial 1.46 2.00 1.65 2.16 4.15 3.38 2.50 2.81 2.71 2.02 3.56 2.91
SE Approaches/trial 0.31 0.38 0.24 0.27 0.51 0.35 0.60 0.59 0.44 0.20 0.37 0.24
Mean Interactions/approach 1.42 1.64 1.52 1.20 2.00 1.80 1.45 1.31 1.35 1.30 1.84 1.67
SE Interactions/approach 0.19 0.31 0.17 0.06 0.16 0.12 0.15 0.08 0.07 0.06 0.12 0.09
Mean Distance 1.35 1.94 1.63 2.54 2.81 2.76 1.96 2.19 2.12 2.13 2.67 2.55
SE Distance 0.33 0.34 0.24 0.30 0.11 0.11 0.35 0.27 0.22 0.20 0.10 0.09

Huveneers, C. et al Assessing the efficacy of the Shark ShieldTM
34
Out of the 18 individually identified sharks that interacted with the bait, 14 (78%) removed
baits from the floats. While at least eight individuals (44%) took the bait when the deterrent
was turned off, 13 (72%) took the bait when the deterrent was turned on. Among these, six
sharks only took the bait when the deterrent was turned on and one shark only took the bait
when the deterrent was turned off. The remaining seven sharks took the bait both when the
deterrent was both turned off and on. Six sharks took the bait on several occasions, with one
shark (Shark 3) taking the bait a total of 23 times including 14 times when the deterrent was
turned on. The shark responsible for taking the bait could not be identified on 15 occasions
(16%) (Table 5).
Table 5. Number of trials during which a white shark took the bait within the 15-minute period. Shark OFF ON Total
1 2 4 6
2 - 1 1
3 9 14 23
4 7 4 11
5 4 3 7
6 - 1 1
7 3 8 11
8 1 1 2
9 - 1 1
10 - - -
11 - 1 1
12 - 1 1
13 2 7 9
14 - 1 1
15 - - -
16 1 - 1
17 - - -
18 - - -
Unknown 9 6 15
Total 38 53 91
Out of the remaining five response variables used to assess the effects of the deterrent (i.e.
approach time, bait time, approach per trial, interaction per approach, and distance), the time
it took to take the bait, number of interaction per approach, and the minimum distance
between sharks and the deterrent were significantly different when the deterrent was
activated. Additionally, the random factor (individual sharks) was also significantly different

Huveneers, C. et al Assessing the efficacy of the Shark ShieldTM
35
for all parameters (Table 6) indicating that there were variations in behaviour between
individual sharks.
Table 6. Generalised Linear Mixed-Model result summary. DF represents degree of freedom. Parameters analysed DF Shark ID
(intercept) Deterrent
t P t P
Approach time 49 3.86 <0.001 -0.17 0.87 Bait time 61 5.54 <0.001 -2.58 0.01 Approach per trial 105 9.52 <0.001 0.87 0.38 Interaction per trial 163 2.42 0.02 3.66 <0.001 Distance 292 8.25 <0.001 2.6 0.01
Once the experimental equipment was deployed, sharks first approached the bait rapidly (80
± 11 seconds, mean ± standard error - SE). The deterrent did not affect the speed at which
sharks first appeared and approached the bait. There was no significant difference in the
time it took sharks to first be sighted whether the deterrent was turned off (77 ± 21 seconds,
mean ± SE) or on (82 ± 12 seconds, mean ± SE) (GLMM (Gamma, inverse): t49=-0.17,
P=0.87) (Figure 7).
Figure 7. Number of seconds before a white shark first approached the deterrent was turned off or on for each trip separately and for trips combined. White bars represent trials with the deterrent turned off; black bars represent trials with the activated deterrent; error bars represents standard error.
0
20
40
60
80
100
120
140
160
180
Trip 1 Trip 2 Trip 3 Combined
Tim
e to
firs
t app
roac
h (s
econ
ds)

Huveneers, C. et al Assessing the efficacy of the Shark ShieldTM
36
On average it took 197 ± 23 seconds (mean ± SE) from the start of a trial for sharks to take
the bait. Although the deterrent did not affect the time it took sharks to be first sighted,
sharks took significantly longer to take the bait when the deterrent was turned on (244 ± 32
seconds, mean ± SE) than when it was turned off (122 ± 24 seconds, mean ± SE) (GLMM
(Gamma, inverse): t61=-2.58, P=0.01) (Figure 8).
Figure 8. Number of seconds it took white sharks to take the bait when the deterrent was turned off or on for each trip separately and for trips combined. White bars represent trials with the deterrent turned off; black bars represent trials with the activated deterrent; error bars represents standard error.
There was no significant difference in the number of approaches per trial when the deterrent
was activated (GLMM (Poisson, identity): t105=0.87, P=0.39) (Figure 9). The number of
interactions per approach, however, increased from 1.33 ± 0.08 (mean ± SE) when the
deterrent was turned off to 2.20 ± 0.20 (mean ± SE) when the deterrent was turned on
(GLMM (Poisson, log): t163=3.66, P<0.001. This suggests that the sharks did not approach
the bait more often when the deterrent was activated, but they interacted with the bait more
often within each approach (Figure 10). The greatest difference in the number of approaches
per trial occurred during Trip 2 and was mostly driven by one shark for which the number of
approaches quadrupled when the deterrent was activated.
.
0
50
100
150
200
250
300
350
Trip 1 Trip 2 Trip 3 Combined
Tim
e it
took
to ta
ke b
ait (
seco
nds)

Huveneers, C. et al Assessing the efficacy of the Shark ShieldTM
37
Figure 9. Number of approaches per trial when the deterrent was turned off or on for each trip separately and for trips combined. White bars represent trials with the deterrent turned off; black bars represent trials with the activated deterrent; error bars represents standard error.
Figure 10. Number of interactions per approach when the deterrent was turned off or on for each trip separately and for trips combined. White bars represent trials with the deterrent turned off; black bars represent trials with the activated deterrent; error bars represents standard error.
0
0.5
1
1.5
2
2.5
Trip 1 Trip 2 Trip 3 Combined
Num
ber o
f app
roac
hes
per t
rial
0
0.5
1
1.5
2
2.5
3
Trip 1 Trip 2 Trip 3 Combined
Num
ber o
f int
erac
tions
per
app
raoc
h

Huveneers, C. et al Assessing the efficacy of the Shark ShieldTM
38
Although sharks were still able to take the bait when the deterrent was activated, the
deterrent had impacts on the behaviour of the shark and significantly increased the mean
minimum distance between the shark and the deterrent from 1.77 ± 0.20 to 2.44 ± 0.11 m
(mean ± SE) when activated (GLMM (Gamma, identity): t292=2.60, P=0.01). The greatest
difference in the minimum distance occurred during Trip 2 (Figure 11).
Figure 11. Minimum distance between white sharks and the deterrent bait when the deterrent was turned off and on for each trip separately and for trips combined. White bars represent trials with the deterrent turned off; black bars represents trials with the activated deterrent; error bars represents standard error.
The distribution of the minimum distance between the sharks and the deterrent changed
significantly (K-S test: P<0.001), with less interactions being within 2 m of the deterrent when
it was turned on (Poisson exact: P=0.0001). This was, again, mostly driven by Trip 2 (K-S
test: P=0.02; Poisson exact: P=0.002), because the distribution of the minimum distance
was not significantly different whether or not the deterrent was turned on during Trip 1 (K-S
test: P=0.06; Poisson exact: P=0.09) or Trip 3 (K-S test: P=0.96; Poisson exact: P=0.51)
(Figure 12).
0
0.5
1
1.5
2
2.5
3
Trip 1 Trip 2 Trip 3 Combined
Dis
tanc
e (m
)

Huveneers, C. et al Assessing the efficacy of the Shark ShieldTM
39
Figure 12. Histograms of the minimum distance between white sharks and the deterrent for each interaction when it was turned off (white bars) and turned on (black bars) during (a) Trip 1, (b) Trip 2, (c) Trip 3, and (d) all trips combined.
0%
10%
20%
30%
40%
50%
60%
0 0.5 1 2 3 4 5 >5
0%
5%
10%
15%
20%
25%
30%
0 0.5 1 2 3 4 5 >5
0%
5%
10%
15%
20%
25%
30%
0 0.5 1 2 3 4 5 >5
0%
5%
10%
15%
20%
25%
30%
0 0.5 1 2 3 4 5 >5
Distance between shark and Shark Shield (m)
(a)
(b)
(c)
(d)

Huveneers, C. et al Assessing the efficacy of the Shark ShieldTM
40
4.1.3 Assessment of the impact of the deterrent on a large spatial scale – (a) VRAP component
Between November 2009 and September 2011, the VRAP system was deployed at the
same location for three monitoring periods ranging from 96 to 187 days each. During these
periods, 21 white sharks were tagged with acoustic transmitters. Two, ten, and nine sharks
were tagged and monitored during the three deployment periods, respectively. White sharks
were detected within the monitored area for 1 (Shark 6, 7, 8, and 11) to 17 days (Shark 21)
(mean ± standard error = 3.5 days ± 0.9) while no locations were estimated for three of the
21 tagged sharks (Shark 2, 12, and 15). A total of 22,329 locations were calculated, with the
number of locations estimated per shark ranging from 2 (Shark 7) to 6,116 (Shark 21) (mean
± standard error = 1,063 ± 333.6) (Table 7).
Table 7. Summary of tagged sharks and detections. TL is estimated total length; location estimates is the number of location estimates recorded by the VRAP system.
Shark TL (mm) Sex Date tagged Last transmission Days detected Location estimate
1 3600 Male 14/12/2009 15/12/2009 2 413
2* 3500 Male 18/01/2010 18/01/2010 0 0
3 3300 Female 26/06/2010 27/06/2010 2 641
4 3000 Female 27/06/2010 29/06/2010 3 418
5 4500 Female 27/06/2010 29/06/2010 3 182
6 2500 Female 17/08/2010 17/08/2010 1 5
7 4200 Female 17/08/2010 17/08/2010 1 2
8 4000 Male 4/10/2010 4/10/2010 1 7
9 4000 Male 14/10/2010 1/11/2010 12 3830
10 3500 Male 22/10/2010 2/11/2010 5 2714
11 3800 Male 22/10/2010 22/10/2010 1 11
12* 4200 Male 12/12/2010 12/12/2010 0 0
13 4500 Female 5/07/2011 7/07/2011 3 1466
14 2900 Male 5/07/2011 7/07/2011 3 576
15* 4000 Male 6/07/2011 6/07/2011 0 0
16 3600 Male 6/07/2011 7/07/2011 2 1263
17 3800 Female 6/07/2011 7/07/2011 2 771
18 2800 Male 6/07/2011 7/07/2011 2 1339
19 3500 Female 11/09/2011 30/09/2011 4 798
20 4000 Male 11/09/2011 26/09/2011 9 1777
21 4200 Male 11/09/2011 28/09/2011 17 6116 * sharks not detected by VRAP array
The effects of the deterrent on the behaviour of sharks could only be tracked by the VRAP
during Trip 3 due to logistical limitations and weather conditions. None of the sharks tagged

Huveneers, C. et al Assessing the efficacy of the Shark ShieldTM
41
prior to or during Trip 1 were present or detected when trials were being undertaken. During
Trip 2, while tagged sharks were present and interacted with the equipment deployed, the
strong southeast wind conditions prevented trials from being undertaken in the VRAP array.
Weather conditions allowed trials during Trip 3 to take place in the VRAP array, and a total
of 3,984 location estimates from six sharks (mean 797, range 423–1103 location estimates
per shark) were obtained. Five hundred and thirteen of these location estimates were
obtained at night and were removed from further analysis. Of the remaining location
estimates, 121 and 179 were obtained when the deterrent was turned off and on,
respectively.
Based on the data obtained from the VRAP, the proportion of detections in close proximity to
the experimental vessel (0–60 m) significantly decreased from 60% when the deterrent was
turned off to 42% when it was turned on (χ2=12.62; P=0.013). The location estimates
obtained when trials were not undertaken, however, were also significantly different to the
data obtained during trials with the deterrent turned off (χ2=12.48; P=0.014) (Figure 13).
Figure 13. Percentage of locations estimated according to the distance between tagged white sharks and vessels from which trials were undertaken. White bars represent periods during which no trials occurred; grey bars represent periods during which the deterrent was turned off; black bars represent periods during which the deterrent was turned on; N represents number of location estimates obtained per grouping. Location estimates were all obtained during Trip 3.
0%
5%
10%
15%
20%
25%
30%
35%
0-29.9 30-59.9 60-89.9 90-119.9 >200
Perc
enta
ge o
f loc
atio
n es
timat
es
Distance from vessel (m)
Nno experiment = 3,717 NOFF = 121
NON = 179

Huveneers, C. et al Assessing the efficacy of the Shark ShieldTM
42
4.1.4 Assessment of the impact of the deterrent on a large spatial scale – (a) presence/absence component
An additional 12 sharks (nine males, one female, two unknown, ranging from 3.2–4.5 m total
length) were tagged with coded acoustic transmitters and were detected before, during, and
after the trials being undertaken. A total of 8,464 detections of tagged sharks were obtained,
with 4,701 of these detections recorded during the deterrent trials. Although slightly more
detections were obtained during the days when the trials took place (1017 detections/day –
43%) than before (951 detections/day – 40%) or after (408 detections/day – 17%) the trials
(Figure 14), this was not significantly different (ANOVA: F2,33=1.96; P=0.16).
Figure 14. Percentage of detections of 12 acoustically tagged white sharks obtained prior, during, and after the deterrent trials. Error bars represent standard deviation.
4.2 Dynamic tows
A total of 190 tows were undertaken in July and August 2010 (94 tows) and 2011 (96 tows).
Of these, 98 tows were undertaken with the deterrent turned off (47 in 2010, 51 in 2011) and
91 with the deterrent turned on (47 in 2010, 44 in 2011). Tows occurred over 37 hours 39
minutes (19 hours 06 minutes with the deterrent turned off, 18 hours 2 minutes with the
deterrent turned on) with each tow lasting an average of 11 minutes 44 seconds. Towing
took place on 22 days (11 days in each 2010 and 2011). Due to logistical difficulties such as
the electrodes wrapping around the equipment, poor visibility, and lack of light penetrating
through the water surface, video footage was only obtained from 169 tows (74 in 2010 and
95 in 2011). Of these, 86 videos were taken with the deterrent turned off (35 in 2010, 51 in
2011) and 83 with the deterrent turned on (39 in 2010, 44 in 2011) (Table 8).
0%
10%
20%
30%
40%
50%
60%
70%
80%
Before During After
Perc
enta
ge o
dete
ctio
ns/d
ay

Huveneers, C. et al Assessing the efficacy of the Shark ShieldTM
43
Sixty-one interactions, 43 with deterrent off, 18 with deterrent on, between a shark and the
decoy were recorded when surface and underwater interactions were combined. Of these,
35 interactions occurred in 2010 (23 with deterrent off, 12 with deterrent on) and 26 in 2011
(20 with deterrent off, 6 with deterrent on). Interactions visible from the surface (e.g., breach,
aborted breach close to decoy, lunge, swimming on the surface behind the decoy)
accounted for 29 of the 61 interactions observed (27 with deterrent off, 2 with deterrent on).
Of these, 18 interactions occurred in 2010 (17 with deterrent off, 1 with deterrent on) and 11
in 2011 (10 with deterrent off, 1 with deterrent on). Sixteen breaches occurred during the
tows (9 in 2010 and 7 in 2011) with all breaches occurring when the deterrent was turned off
(Table 8).
Taking into account the number of tows undertaken and suitable videos available, the
number of interactions per tow across all experiments was 0.33 and decreased from 0.44 to
0.22 when the deterrent was turned on. While the number of surface interactions per tow
decreased from 0.28 to 0.02 when the deterrent was turned on, the strongest effects of the
deterrent was recorded for breaches, with no breach observed when the deterrent was
turned on (Table 8, Figure 15).

Huveneers, C. et al Assessing the efficacy of the Shark ShieldTM
44
Table 8. Summary of the number of tows and interactions obtained when testing the deterrent on a dynamic decoy in South Africa. 2010 2011 TOTAL
OFF ON Total OFF ON Total OFF ON Grand total
Tow duration (mean) 0:11:49 0:12:01 0:11:55 0:11:35 0:11:29 0:11:32 0:11:42 0:11:46 0:11:44
Total duration of towing 9:15:44 9:25:06 18:40:50 9:50:42 8:37:07 18:27:49 19:06:26 18:02:13 37:38:39
No of tows 47 47 94 51 44 95 98 91 189
No of videos 35 39 74 51 44 95 86 83 169
No of breaches 9 0 9 7 0 7 16 0 16
No of surface interaction 17 1 18 10 1 11 27 2 29
No of total interactions 23 12 35 20 6 26 43 18 61
No of breach/tow 0.19 0.00 0.10 0.14 0.00 0.07 0.16 0.00 0.08
No of surface interaction/tow 0.36 0.02 0.19 0.20 0.02 0.12 0.28 0.02 0.15
No of interaction on video 18 12 30 20 6 26 38 18 56
No of interaction on video/video 0.51 0.31 0.41 0.39 0.14 0.27 0.44 0.22 0.33

Huveneers, C. et al Assessing the efficacy of the Shark ShieldTM
45
Figure 15. Proportion of breaches/tow (white), surface interactions/tow (light grey), underwater interactions/video (dark grey), and total number of interactions recorded (surface and on video)/video (black) for 2010 (a), 2011 (b), and years combined (c) compared when the deterrent was turned off or on. Numbers above bars indicate the number of events per replicate.
0.00
0.10
0.20
0.30
0.40
0.50
0.60
0.70
0.80
0.90
1.00
OFF ON
9/47 0/47 17/47 11/39 12/39 18/35 1/47
(a)
6/35
0.00
0.10
0.20
0.30
0.40
0.50
0.60
0.70
0.80
0.90
1.00
OFF ON
7/51 0/44 10/51 20/51 1/44 6/44
(b)
10/51 5/44
0.00
0.10
0.20
0.30
0.40
0.50
0.60
0.70
0.80
0.90
1.00
OFF ON
16/86 27/98 16/98 38/86 16/83 2/91 0/91 18/83
(c)

Huveneers, C. et al Assessing the efficacy of the Shark ShieldTM
46
The number of breaches per tow, surface interactions per tow, and total number of
interactions recorded were significantly less when the deterrent was turned on compared to
when the deterrent was turned off (Table 8, Figure 15, p <0.001). The number of underwater
interactions per video, however, did not change significantly whether the deterrent was
turned on or off (P=1.00).
Fifty-six interactions, 38 vs. 18 when the deterrent was turned off and on, respectively, were
detected in the underwater camera footage, and 47 interactions (32 vs. 15 when the
deterrent was turned off and on, respectively) were considered assessable by CH. Additional
filtering following coding of the data resulted in 15% of the coding for behavioural approach
(7 interactions) and 38% of the coding for change of direction (18 interactions) being
removed. There was no difference in the amount of data filtered relative to the operational
status of the deterrent for behavioural approach (16% vs. 13% for off and on) and change of
direction (37% vs. 40% for off and on).
The proportions of investigations and aborted breaches increased more than two-fold when
the deterrent was turned on compared to when it was turned off (from 0.31 to 0.80 and from
0.03 to 0.07 for investigation and aborted breach, respectively). While the proportion of
investigations were significantly different when the deterrent was turned on from when it was
turned off (Poisson exact test: p=0.003), the proportion of aborted breaches was not
significantly different (Poisson exact test: p=0.54) due to the small number of aborted
breaches coded (one each when turned on or off). The proportion of breaches decreased
significantly from 0.5 to 0.0 (Poisson exact test: p=0.04) when the deterrent was turned on
compared to when it was turned off (Table 9, Figure 12). The proportion of interactions
where a sudden change of direction (used as a proxy for a reaction to the deterrent) was not
observed decreased from 0.59 to 0.27, but was not significantly different (Poisson exact test:
p=0.18) when the deterrent was turned on. The proportion of interactions where a sudden
change of direction was observed increased significantly from 0.0 to 0.2 (Poisson exact test:
p=0.03), while the proportion of interactions where a sudden change was ‘unsure’ also
increased from 0.03 to 0.13, but was not significantly different (Poisson exact test: p=0.24)
(Table 9, Figure 17).

Huveneers, C. et al Assessing the efficacy of the Shark ShieldTM
47
Table 9. Summary of the proportion of behaviours per video coded and sudden change of direction (used as a proxy for a reaction to the deterrent) per video coded.
OFF ON Total
Number of video coded 32 15 47
Proportion of behaviour
Investigation 0.31 0.80 0.47
Aborted approach 0.03 0.07 0.04
Breach 0.50 0.00 0.34
Total behaviour coded 0.84 0.87 0.85
Proportion of sudden change of direction (reaction)
Yes 0.00 0.20 0.06
No 0.59 0.27 0.49
Unsure 0.03 0.13 0.06
Total 'Reaction' coded 0.63 0.60 0.62
Figure 16. Proportion of investigations (light grey), aborted breaches (dark grey), and breaches (black) per assessable interaction compared when the deterrent was turned off or on. Numbers above bars indicate the number of event per replicate.
0.00
0.10
0.20
0.30
0.40
0.50
0.60
0.70
0.80
0.90
1.00
OFF ON
10/32
12/15
1/32 16/32
1/15 0/15

Huveneers, C. et al Assessing the efficacy of the Shark ShieldTM
48
Figure 17. Proportion of sudden changes of direction (light grey), no change of direction (dark grey), and ‘unsure’ (black) per assessable interaction compared when the deterrent was turned off or on. Numbers above bars indicate the number of event per replicate.
5. DISCUSSION
This study is the first scientific assessment of the effects of the Shark Shield Freedom7TM on
the behaviour of white sharks. The deterrent increased the time it took to take a static bait
and the number of interactions per approach. On average, sharks did not approach as close
when the deterrent was activated. There were some individual sharks that exhibited
behaviours different to the mean trend; one shark took the bait four times faster when the
deterrent was activated. Tows of a seal decoy showed that the deterrent reduced the
number of breaches, surface interactions, and total number of interactions. The deterrent did
not, however, affect the proportion of static baits consumed, nor did it reduce the number of
underwater interactions with a dynamic bait. Sharks were also observed in some trials and
tows within less than 0.5 m from the deterrent. The results showed that the deterrent had an
effect on white shark behaviour, but did not deter or repel them in all situations, and for all
individual sharks.
While this study is the first to test the effects of the Shark Shield Freedom7TM on white
sharks, a previous study tested the efficiency of a previous model, the SharkPODTM, and
found a 80% reduction in the probability of white shark taking a bait (Smit and Peddemors,
2003). This contrasted with the results from this study which did not find any differences in
the proportion of baits consumed, regardless of whether the deterrent was activated. The
0.00
0.10
0.20
0.30
0.40
0.50
0.60
0.70
0.80
0.90
1.00
OFF ON
0/32 3/15 19/32 1/32 4/15 2/15

Huveneers, C. et al Assessing the efficacy of the Shark ShieldTM
49
disparity between these results might be due the position of the electrodes differing between
the two models and potentially producing a geometrically different electrical field. Both
models, however, have the same electronic circuit and produce the same pulse and
waveform (Shark Shield Pty Ltd, pers. comm.). The position of the bait in relation to the
deterrent was also different between the two studies. Smit and Peddemors (2003) attached
the bait to the deterrent, whereas this study placed the deterrent 150–200 cm away from the
bait, similarly to how a diver would wear the deterrent. This disparity in the experimental set-
up potentially resulted in the discrepancy of the results obtained. Considering that the
distance from the deterrent could have such large influence on its effectiveness in reducing
the probability of an interaction, further testing should assess the impact that distance
between the deterrent and a bait has on the probability of the bait being consumed.
While sharks were still capable of taking baits 150–200 cm away from the deterrent, the
number of interactions within two metres of the deterrent decreased when it was activated.
The mean minimum distance to the deterrent in this study of about 2.5 m was similar to that
seen by Smit and Peddemors (2003). Using the same electronic deterrent as in this study,
Galapagos sharks (Carcharhinus galapagensis) did not approach a bait canister two metres
from the deterrent (Robbins and Peddemors, unpublished data). Sharks are, however,
capable of being close to an activated deterrent, with the minimum distance recorded in this
study being <0.5 m (Supplementary electronic information K, L). Sardines placed two metres
away from an activated deterrent could also be taken by Galapagos sharks (Robbins and
Peddemors, unpublished data). These studies indicate that electric deterrents can have an
effect on sharks, but that sharks can approach and consume baits closer than 5 m to an
activated deterrent.
During this study, white sharks took, on average, twice as long (120 seconds) to take the
bait when the deterrent was activated compared to when it was switched off. An increase in
the time it takes to consume a bait is consistent with findings for Galapagos sharks (Robbins
and Peddemors, unpublished data). The number of interactions per approach also increased
when the deterrent was activated, similar to the previous study on white sharks (Smit and
Peddemors, 2003). This suggests that some white sharks may hesitate when taking a bait
when a deterrent is activated
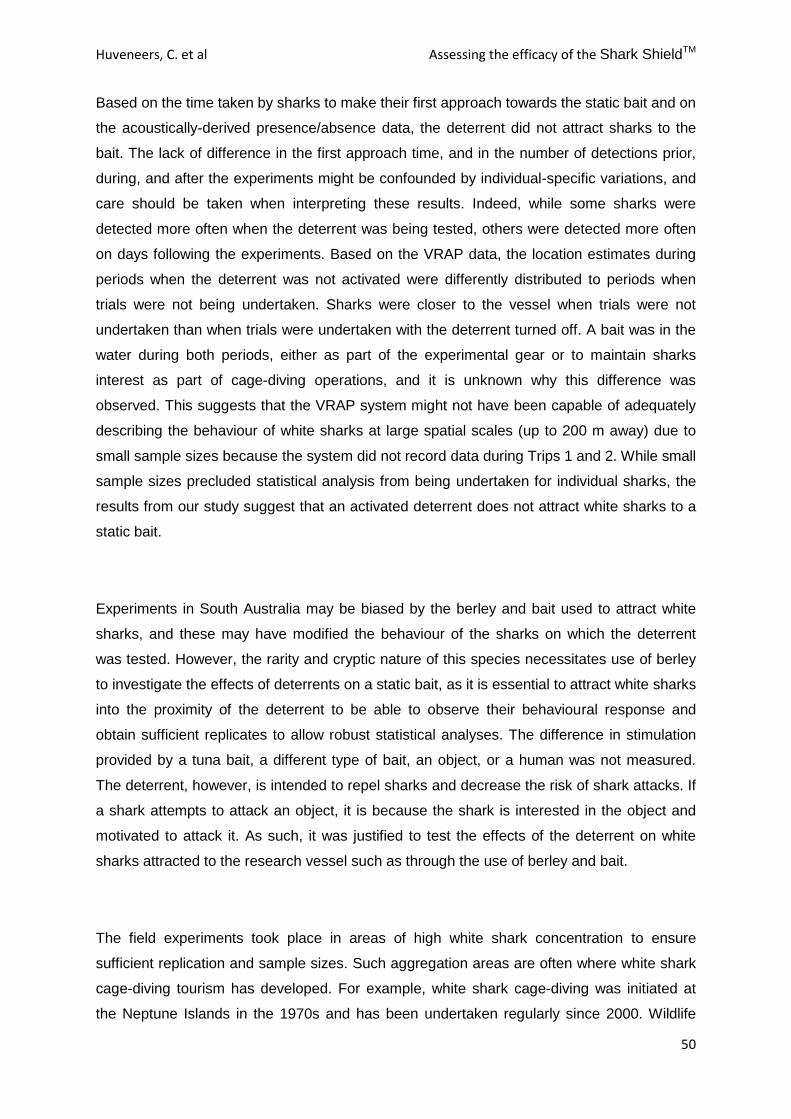
Huveneers, C. et al Assessing the efficacy of the Shark ShieldTM
50
Based on the time taken by sharks to make their first approach towards the static bait and on
the acoustically-derived presence/absence data, the deterrent did not attract sharks to the
bait. The lack of difference in the first approach time, and in the number of detections prior,
during, and after the experiments might be confounded by individual-specific variations, and
care should be taken when interpreting these results. Indeed, while some sharks were
detected more often when the deterrent was being tested, others were detected more often
on days following the experiments. Based on the VRAP data, the location estimates during
periods when the deterrent was not activated were differently distributed to periods when
trials were not being undertaken. Sharks were closer to the vessel when trials were not
undertaken than when trials were undertaken with the deterrent turned off. A bait was in the
water during both periods, either as part of the experimental gear or to maintain sharks
interest as part of cage-diving operations, and it is unknown why this difference was
observed. This suggests that the VRAP system might not have been capable of adequately
describing the behaviour of white sharks at large spatial scales (up to 200 m away) due to
small sample sizes because the system did not record data during Trips 1 and 2. While small
sample sizes precluded statistical analysis from being undertaken for individual sharks, the
results from our study suggest that an activated deterrent does not attract white sharks to a
static bait.
Experiments in South Australia may be biased by the berley and bait used to attract white
sharks, and these may have modified the behaviour of the sharks on which the deterrent
was tested. However, the rarity and cryptic nature of this species necessitates use of berley
to investigate the effects of deterrents on a static bait, as it is essential to attract white sharks
into the proximity of the deterrent to be able to observe their behavioural response and
obtain sufficient replicates to allow robust statistical analyses. The difference in stimulation
provided by a tuna bait, a different type of bait, an object, or a human was not measured.
The deterrent, however, is intended to repel sharks and decrease the risk of shark attacks. If
a shark attempts to attack an object, it is because the shark is interested in the object and
motivated to attack it. As such, it was justified to test the effects of the deterrent on white
sharks attracted to the research vessel such as through the use of berley and bait.
The field experiments took place in areas of high white shark concentration to ensure
sufficient replication and sample sizes. Such aggregation areas are often where white shark
cage-diving tourism has developed. For example, white shark cage-diving was initiated at
the Neptune Islands in the 1970s and has been undertaken regularly since 2000. Wildlife

Huveneers, C. et al Assessing the efficacy of the Shark ShieldTM
51
tourism targeting sharks has previously been documented to impact the behaviour of some
shark species (Bruce et al., 2005; Laroche et al., 2007; Semeniuk et al., 2007; Meyer et al.,
2009; Clua et al., 2010; Smith et al., 2010; Barker et al., 2011b; Barker et al., 2011a; Bruce
and Bradford, 2011; Fitzpatrick et al., 2011; Maljković and Côté, 2011). The behavioural
response of white sharks to the deterrent might have also been modified by the impact of the
cage-diving industry. Some white sharks are known to be ‘temporary resident’ at the
Neptune Islands with regular visitations lasting up to 92 days (Bruce and Bradford, 2011).
Some individuals involved in the static bait experiments might have been interacting with the
cage-diving operators in previous years or during days prior to the trials. The white sharks
that had previously interacted with the cage-diving vessels could also be considered as
being accustomed to the disturbances associated with cage-diving operations. An additional
disturbance in the form of a deterrent might not have the same impact as it would have in
another location where white sharks are not as accustomed to human presence and
disturbances. Sharks may have also been previously conditioned to taking baits leading to
positive reinforcement. To reduce this potential bias, a future study should be conducted at
locations where shark abundance is adequate to run trials, and where cage-diving does not
occur.
Throughout the trials, sharks may have also become used to the effect and pulses of the
deterrent, resulting in the potential for habituation in response to the pulse, or conditioning in
response to the positive rewards obtained when baits were taken. For example, a shark
which took the bait on the first trial when the deterrent was not activated, may be more likely
to take the bait during subsequent trials. A shark that took a bait when the deterrent was
activated may also be more likely to take a subsequent bait, as the discomfort caused by the
deterrent may not have been strong enough to counter the food reward. Such temporal
correlation has been observed in Galapagos shark interactions with a berley canister, where
interactions declined following continued failures to obtain a food reward (Robbins and
Peddemors, unpublished data). Sharks demonstrate cognitive ability (Clark, 1959; Aronson
et al., 1967) and form associative learning behaviours as rapidly as other vertebrates
(Guttridge et al., 2009), including following repeated exposure to electropositive metal
deterrents (Brill et al., 2009). This potential bias was examined but there was no decrease
with time in the number of approaches per trial, interactions per approach, minimal distance
to the deterrent, time to first appear or time to take the bait. It is likely that the small number
of food rewards provided and the alternation of positive and negative reinforcements from
the deterrent being randomly activated for each trial prevented habituation from occurring
and inducing any temporal effects in the study. The proportion of unidentified sharks (30.6%)
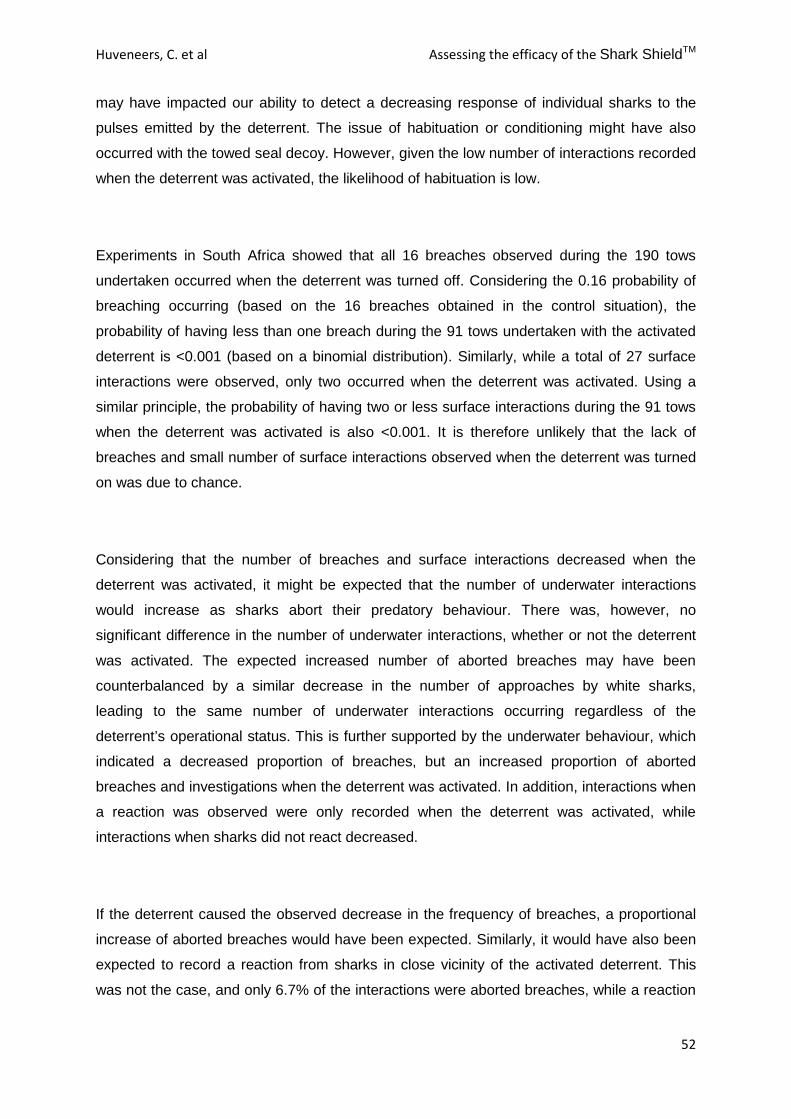
Huveneers, C. et al Assessing the efficacy of the Shark ShieldTM
52
may have impacted our ability to detect a decreasing response of individual sharks to the
pulses emitted by the deterrent. The issue of habituation or conditioning might have also
occurred with the towed seal decoy. However, given the low number of interactions recorded
when the deterrent was activated, the likelihood of habituation is low.
Experiments in South Africa showed that all 16 breaches observed during the 190 tows
undertaken occurred when the deterrent was turned off. Considering the 0.16 probability of
breaching occurring (based on the 16 breaches obtained in the control situation), the
probability of having less than one breach during the 91 tows undertaken with the activated
deterrent is <0.001 (based on a binomial distribution). Similarly, while a total of 27 surface
interactions were observed, only two occurred when the deterrent was activated. Using a
similar principle, the probability of having two or less surface interactions during the 91 tows
when the deterrent was activated is also <0.001. It is therefore unlikely that the lack of
breaches and small number of surface interactions observed when the deterrent was turned
on was due to chance.
Considering that the number of breaches and surface interactions decreased when the
deterrent was activated, it might be expected that the number of underwater interactions
would increase as sharks abort their predatory behaviour. There was, however, no
significant difference in the number of underwater interactions, whether or not the deterrent
was activated. The expected increased number of aborted breaches may have been
counterbalanced by a similar decrease in the number of approaches by white sharks,
leading to the same number of underwater interactions occurring regardless of the
deterrent’s operational status. This is further supported by the underwater behaviour, which
indicated a decreased proportion of breaches, but an increased proportion of aborted
breaches and investigations when the deterrent was activated. In addition, interactions when
a reaction was observed were only recorded when the deterrent was activated, while
interactions when sharks did not react decreased.
If the deterrent caused the observed decrease in the frequency of breaches, a proportional
increase of aborted breaches would have been expected. Similarly, it would have also been
expected to record a reaction from sharks in close vicinity of the activated deterrent. This
was not the case, and only 6.7% of the interactions were aborted breaches, while a reaction

Huveneers, C. et al Assessing the efficacy of the Shark ShieldTM
53
was only observed in 20% of the interactions. This could be explained by: (1) the differences
in the number of breaches, surface interactions, and behaviour type is not due to the
deterrent but to another factor that was unaccounted for; (2) the behaviours of the sharks
could not be reliably coded; or (3) some white sharks affected by the deterrent were not
detected by the underwater filming due to being outside the visibility range of the camera.
On most days, the visibility was estimated to be 3–5 m or less. As such, if sharks were
affected by the deterrent from further than the visibility range of the camera, they would have
to be affected by the deterrent further away than 3–5 m. This contradicts the results obtained
from the static bait experiments, which suggests that the deterrent did not affect white sharks
further than a distance of two metres. While the deterrent can affect sharks to a distance of
up to two metres, white sharks could also be able to detect the pulse of the deterrent from
further away and react to it from a distance not observable by the underwater camera. If
white sharks are capable of detecting the electric pulse emitted by the deterrent prior to
initiating a predatory attack, they might decide not to initiate a breaching approach, which
would explain the small number of aborted breaches observed. The minimum detection
threshold and voltage strength that elicits a behavioural response has been measured for
several shark species (Marcotte and Lowe, 2008; Jordan et al., 2011). An accurate mapping
of the electric field emitted by the deterrent would enable quantification of the expected
distance from which sharks first detect the field and the distance from which sharks could be
expected to respond behaviourally.
The trials using the towed seal decoy off South Africa suggested that the deterrent affected
the predatory behaviour of white sharks. Although the deterrent appeared to impact the
predatory behaviour of white sharks, several individuals were observed in close proximity to
the deterrent, some touched the electrode (Supplementary electronic information M), and
two surface interactions were observed when the deterrent was activated. The deterrent
emits an electric pulse every about 0.6 seconds (Shark Shield Pty Ltd, pers. comm.). White
sharks have been estimated to breach at speeds of 35 km/hr (or 9.7 m/s) (Martin and
Hammerschlag, 2012) and lamnid sharks have been estimated to be capable of burst
speeds of up to 56 km/hr (15.6 m.s-1) (e.g., Isurus oxyrinchus (De Maddalena et al., 2005)).
A white shark could, therefore, theoretically travel at least 5.82 m and up to 9.3 m during the
time between the two pulses emitted by the deterrent. Therefore, a white shark undertaking
a predatory targeted strike or at full speed could reach the centre of the electric field emitted
by the deterrent during the 0.6 second interval between the two pulses. In addition to white
sharks being observed in close proximity (<0.5 m) to the activated deterrent, they could also
theoretically reach the deterrent between two pulses.

Huveneers, C. et al Assessing the efficacy of the Shark ShieldTM
54
The main findings of the static and dynamic experiments were different. The operational
state of the deterrent did not affect the proportion of static baits taken, but an activated
deterrent did significantly decrease the number of breaches and surface interactions on a
towed seal decoy. While the differences observed could be due to location or the different
white shark populations (Gubili et al., 2012), it is more likely related to the behavioural states
being tested. White sharks that investigate a static bait are mostly swimming at slower
speeds than when hunting natural prey. It is likely that the energy required for a breach is
higher than that expended during inquisitive behaviour. Considering the energetic cost of
breaching, white sharks might be less likely to breach if they can sense any factor that could
reduce their chance of being successful or which seems unusual. In the presence of a
deterrent, a white shark might still be inquisitive around a static bait where energetic cost is
similar to normal swimming, but they might be less likely to breach because of the higher
energetic cost. The investigatory nature of the inquisitive behaviour is supported by the
number of times the same white sharks were observed (e.g., one white shark approached
the static bait in 35 different trials, while another individual had 18 interactions in one trial).
While we tested the response to the deterrent in two interaction types, it cannot be assumed
that white sharks would respond similarly when interacting with humans or other visual or
chemical stimuli, such as from a marine mammal carcass or other potential prey items. The
results obtained also cannot be extrapolated to different types of predatory behaviour (e.g.
non-breaching surface predation, subsurface predation) as different behavioural responses
may occur in response to the deterrent.
6. CONCLUSIONS
This study suggests that white shark behaviour is environmentally and contextually specific,
and that the degree of risk reduction afforded by use of the electric deterrent we tested is
likely to depend on the behavioural state of sharks. The deterrent we tested had an effect on
white shark behaviour, but did not deter or repel them in all situations nor did it repel all
individual sharks. While it was expected that the deterrent would dissuade white sharks from
taking a static bait (Smit and Peddemors, 2003), the ability of the deterrent to stop a white
shark in a targeted predatory behaviour was unknown.

Huveneers, C. et al Assessing the efficacy of the Shark ShieldTM
55
Results suggest that the incidence of predatory strike may be reduced by an activated
deterrent and that the deterrent affected the behaviour of white sharks at up to two metres
from the source of the field. It is not known whether the effective distance of the deterrent
varies between species, which warrants further investigation to better define performance
guidelines. Given that the static bait experiments showed that an activated deterrent did not
reduce the likelihood of baits being taken, the risk reduction observed in the seal decoy
study would not be provided in all situations. Although the data were limited, our results
suggest that white sharks were not attracted to the deterrent.
7. FUTURE RESEARCH
Future studies should focus on testing the effects of the deterrent at different distances, to
assess if a deterrent closer than two metres to the attractant can prevent white sharks from
taking a bait. An accurate map of the electric field emitted by the deterrent would also aid in
determining the distance from which sharks can be expected to first detect and react to the
deterrent. Similar tests to those undertaken during this study should be conducted at other
locations where regular berleying and cage-diving does not occur. A different site would
facilitate testing of the deterrent without the potential biases of habituation to human
disturbance, berley, and use of the tuna teaser baits that are used at cage-diving sites.
Finally, the study was undertaken on white sharks and should also include other sharks that
have been implicated in attacks on humans, such as tiger sharks (Galeocerdo cuvier), and
bull sharks (Carcharhinus leucas).
8. REFERENCES
Anderson, S. D., Chapple, T. K., Jorgensen, S. J., Klimley, A. P. and Block, B. A. (2011) Long-term individual identification and site fidelity of white sharks, Carcharodon carcharias, off California using dorsal fins. Marine Biology, 158, 1233-1237.
Anonymous 2006a. A Report on the Queensland Shark Safety Program. Queensland Department of Primary Industries.
Anonymous 2006b. Scientific Shark Protection Summit. NSW Department of Primary Industries and Sydney Aquarium.
Anonymous 2011. National Coastal Safety Report 2011. A summar of coastal drowning deaths in Australia. Surf Life Savings Australia.
Aronson, L. R., Aronson, F. R. and Clark, E. (1967) Instrumental Conditioning and Light-Dark Discrimination in Young Nurse Sharks. Bulletin of Maine Science, 17, 249-256.

Huveneers, C. et al Assessing the efficacy of the Shark ShieldTM
56
Aust, P., Boyle, B., Fergusson, R. and Coulson, T. (2009) The Impact of Nile Crocodiles on Rural Livelihoods in Northeastern Namibia. South African Journal of Wildlife Research, 39, 57-69.
Baldridge, H. J. (1990) Shark repellent: not yet, maybe never. Military Medecine, 155, 358-361.
Barker, S. M., Peddemors, V. and Williamson, J. E. (2011a) Recreational SCUBA diver interactions with the critically endangered Grey Nurse Shark. Pacific Conservation Biology, 16, 261–269.
Barker, S. M., Peddemors, V. and Williamson, J. E. (2011b) A video and photographic study of aggregation, swimming and respiratory behaviour changes in the Grey Nurse Shark (Carcharias taurus) in response to the presence of SCUBA divers. Marine and Freshwater Behaviour and Physiology, iFirst, 1–18.
Barnett, A., Abrantes, K., Stevens, J., Bruce, B. and Semmens, J. M. (2010) Fine-Scale Movements of the Broadnose Sevengill Shark and Its Main Prey, the Gummy Shark. PLoS one, 5, e15464.
Blonder, B. and Alevizon, W. (1988) Prey discrimination and electroreception in the stingray Dasyatis sabina. Copeia, 1988, 33–36.
Bradford, R. W., Bruce, B. D., McAuley, R. B. and Robinson, G. (2011) An evaluation of passive acoustic monitoring using satellite communication technology for near real-time detection of tagged animals in a marine setting. The Open Fish Science Journal, 4, 10-20.
Bratton, B. and Ayers, J. (1987) Observations on the electric discharge of two skate species (Chondrichthyes: Rajidae) and its relationship to behavior. Environmental Biology of Fishes, 20, 241–254.
Brill, B., Bushnell, P., Smith, L., Speaks, C., Sundaram, R., Stroud, E. and Wang, J. (2009) The repulsive and feeding-deterrent effects of electropositive metals on juvenile
sandbar sharks (Carcharhinus plumbeus). Fisheries Bulletin, 107, 298–307.
Broad, A., Knott, N., Turon, X. and Davis, A. R. (2010) Effects of a shark repulsion device on rocky reef fishes: no shocking outcomes. Marine Ecology Progress Series, 408, 295-298.
Bruce, B. D. and Bradford, R. W. 2011. The effects of berleying on the distribution and behaviour of white sharks, Carcharodon carcharias, at the Neptune Islands, South Australia. Final report to the Department of Environment and Natural Resources, South Australia. Hobart, Tasmania: CSIRO MAR.
Bruce, B. D., Stevens, J. D. and Bradford, R. W. 2005. Site fidelity, residence times and home range patterns of white sharks around pinniped colonies. Hobart, Tasmania: Australian Governmnet Department of Environment and Heritage.
Burgess, G. H., Buch, R. H., Carvalho, F., Garner, B. A. and Walker, C. J. 2010. Factors contributing to shark attacks on humans: A Volusia County, Florida, case study. In: CARRIER, J. C., MUSICK, J. A. & HEITHAUS, M. R. (eds.) Sharks and their relatives: II. Biodiversity, adaptive physiology, and conservation. Boca Raton, Florida: CRC Press.
Burnham, K. P. and Anderson, D. R. 2002. Model selection and multimodel inference: a practical information-theoretic approach, New York, USA, Springer-Verlag.

Huveneers, C. et al Assessing the efficacy of the Shark ShieldTM
57
Chapple, T. K., Jorgensen, S. J., Anderson, S. D., Kanive, P. E., Klimley, A. P., Botsford, L. W. and Block, B. A. (2011) A first estimate of white shark, Carcharodon carcharias, abundance off central California. Biology Letters, 7, 581-583.
Clark, E. (1959) Instrumental Conditioning of Lemon Sharks. Science, 130, 217-218.
Cliff, G. (1988) Keeping sharks at bay. The Naturalist, 32, 4-8.
Clua, E., Buray, N., Legendre, P., Mourier, J. and Planes, S. (2010) Behavioural response of sicklefin lemon sharks Negaprion acutidens to underwater feeding for ecotourism purposes. Marine Ecology Progress Series, 414, 257-266.
Curtis, T. H., Bruce, B. D., Cliff, G., Dudley, S. F. J., Klimley, A. P., Kock, A. A., Lea, R., N., Lowe, C. G., McCosker, J. E., Skomal, G. B., Werry, J. M. and West, J. 2012. Recommendations for governmental organizations responding to incidents of white shark attacks on humans. In: DOMEIER, M. L. (ed.) Global Perspectives on the Biology and Life History of the Great White Shark. Boca Raton, Florida: CRC Press.
De Maddalena, A., Preti, A. and Smith, R. 2005. Mako Sharks, Malabar, Krieger Publishing.
De Vos, A. and O’Riain, M. (2010) Sharks shape the geometry of a selfish seal herd: Experimental evidence from seal decoys. Biology Letters, 6, 48-50.
Dijkgraaf, S. and Kalmijn, A. J. (1966) Versuche zur biologischen Bedeutung der Lorenzinischen Ampullen bei den Elasmobranchieren. Zeitschrift fur vergleichende Physiologie, 47, 438-456.
Dijkgraff, S. and Kalmijn, A. J. (1962) Verhaltungsversuche zur Funktion der Lorenzinischen Ampullen. Naturwissenschaften, 49, 400.
Domeier, M. and Nasby-Lucas, N. (2007) Annual re-sightings of photographically identitifed white sharks (Carcharodon carcharias) at an eastern Pacific aggregation site (Guadalupe Island, Mexico). Marine biology, 150, 977–984.
Fay, M. P. (2010) Two-sided Exact Tests and Matching Confidence Intervals for Discrete Data. The R Journal, 2, 53-58.
Fitzpatrick, R., Abrantes, K. G., Seymour, J. and Barnett, A. (2011) Variation in depth of whitetip reef sharks: does provisioning ecotourism change their behaviour? Coral Reefs, 30, 569–577.
Gilbert, P. W. and Gilbert, C. (1973) Sharks and shark deterrents. Underwater Journal, 5, 69–79.
Goodrich, J. M. (2010) Human–tiger conflict: A review and call for comprehensive plans. Integrative Zoology, 5, 300–312.
Gubili, C., Duffy, C., Cliff, G., Wintner, S., Shivji, M. S., Chapman, D. D., Bruce, B. D., Martin, A. P., Sims, D. W., Jones, C. S. and Noble, L. R. 2012. Application of Molecular Genetics for Conservation of the Great White Shark, Carcharodon carcharias, L. 1758. In: DOMEIER, M. L. (ed.) Global perspectives on the biology and life history of the great white shark.
Guttridge, T., Myrberg, A., Porcher, I., Sims, D. and Krause, J. (2009) The role of learning in shark behaviour. Fish and Fisheries, 10, 450-469.

Huveneers, C. et al Assessing the efficacy of the Shark ShieldTM
58
Haine, O., Ridd, P. and Rowe, R. (2001) Range of electrosensory detection of prey by Carcharhinus melanopterus and Himantura granulata. Marine and Freshwater Research, 52, 291–296.
Hammerschlag, N., Martin, R. A. and Fallows, C. (2006) Effects of envrionmental conditions on predator-prey interactions between white sharks (Carcharodon carcharias) and Cape fur seals (Arctocephalus pusillus pusillus) at Seal Island, South Africa. Environmental Biology of Fishes, 76, 341–350.
Jordan, L. K., Mandelman, J. W. and Kajiura, S. M. (2011) Behavioral responses to weak electric fields and a lanthanide metal in two shark species. Journal of Experimental Biology and Ecology, 409.
Kaimmer, S. M. and Stoner, A. W. (2008) Field investigation of rare-earth metal as a deterrent to spiny dogfish in the Pacific halibut fishery. Fisheries Research, 94, 43–47.
Kajiura, S. and Holland, K. (2002a) Electroreception in juvenile scalloped hammerhead and sandbar sharks. Journal of Experimental Biology, 205, 3609–3621.
Kajiura, S. M. and Holland, K. N. (2002b) Electroreception in juvenile scalloped hammerhead and sandbar sharks. journal of Experimental Biology, 205, 3609–3621.
Kalmijn, A. (1966) Electro-perception in sharks and rays. Nature, 212, 1232–1233.
Kalmijn, A. (1971) The electric sense of sharks and rays. Journal of Experimental Biology, 55, 371–383.
Kalmijn, A. 1974. The detection of electric fields from inanimate and animate sources other than electric organs. In: FESSARD, A. (ed.) Handbook of Sensory Physiology Vol III/3. Berlin: Springer-Verlag.
Kalmijn, A. 1978. Electric and magnetic sensory world of sharks, skates, and rays. In: HODGSON, E. & MATHEWSON, R. (eds.) Sensory Biology of Sharks. Skates, and Rays. Arlington, VA: Office of Naval Research.
Kalmijn, A. J. (1982) Electric and magnetic-field detection in elasmobranch fishes. Science, 218, 916–918.
Kirkman, S. P., Oosthuizen, W. H., Meyer, M. A., Kotze, P. G. H., Roux, J.-P. and Underhill, L. G. (2007) Making sense of censuses and dealing with missing data: trends in pup counts of Cape fur seal Arctocephalus pusillus pusillus for the period 1972-2004. South African Journal of Marine Science 29, 161-176.
Klimley, A., Le Boeuf, B., Cantara, K., Richert, J., Davis, S. and Van Sommerman, S. (2001) Radio acoustic positioning as a tool for studying site-specific behavior of the white shark and other large marine species. Marine Biology, 429-446.
Klimley, A. P. and Curtis, T. H. Shark attack versus ecotourism: Negative and positive interactions. In: TIMM, R. M. & O'BRIEN, J. M., eds. Proceedings of the 22nd Vertebrate Pest Conference, 2006. University of California, 33–44.
Laroche, K. R., Kock, A. A., Dill, L. M. and Oosthouizen, W. H. (2008) Running the gauntlet: a predator-prey game between sharks and two age classes of seals. Animal Behaviour, 76, 1901-1917.

Huveneers, C. et al Assessing the efficacy of the Shark ShieldTM
59
Laroche, K. R., Kock, A. A., Dill, L. M. and Oosthuizen, H. (2007) Effects of provisioning ecotourism activity on the behaviour of white sharks Carcharodon carcharias. Marine Ecology Progress Series, 338, 199-209.
Last, P. R. and Stevens, J. D. 2009. Sharks and Rays of Australia, Australia, CSIRO Australia.
Linnell, J., Andersen, R., Andersone, Z., Balciauskas, L., Blanco, J., Boitani, L., Brainerd, S., Breitenmoser, U., Kojola, I., Liberg, O., Løe, J., Okarma, H., Pedersen, H., Promberger, C., Sand, H., Soldberg, E., Valdmann, H. and Wabakken, P. (2002) The fear of wolves: A review of wolf attacks on humans. NINA Oppdragsmelding, 731, 1–65.
Lowe, C., Bray, R. and Nelson, D. (1994) Feeding and associated electrical behavior of the Pacific electric ray Torpedo californica in the field. Marine Biology, 120, 161–169.
Maljković, A. and Côté, I. (2011) Effects of tourism-related provisioning on the trophic signatures and movement patterns of an apex predator, the Caribbean reef shark. Biological Conservation, 144, 859-865.
Marcotte, M. and Lowe, C. (2008) Behavioral response of two species of sharks to pulsed, direct current electrical fields: testing a potential shark deterrent. Marine Technology Society Journal, 42, 53-61.
Martin, R. A. and Hammerschlag, N. (2012) Marine predator–prey contests: Ambush and speed versus vigilance and agility. Marine Biology Research, 8, 90-94.
Martin, R. A., Hammerschlag, N., Collier, R. S. and Fallows, C. (2005) Predatory behaviour of white sharks (Carcharodon carcharias) at Seal Island, South Africa. Journal of the marine Biological Association of the United Kingdom, 85, 1121–1135.
Massey, F. J. (1951) The Kolmogorov-Smirnov Test for Goodness of Fit. Journal of the American Statistical Association, 76, 68-78.
Meyer, C. G., Dale, J. J., Papastamatiou, Y. P., Whitney, N. M. and Holland, K. N. (2009) Seasonal cycles and long-term trends in abundance and species composition of sharks associated with cage diving ecotourism activities in Hawaii. Environmental Conservation, 36, 104-111.
Nel, D. C. and Peschak, T. P. 2006. Finding a balance: white shark conservation and recreational safety in the inshore waters of Cape Town, South Africa. WWF South Africa Report Series 2006/Marine/001. Cape Town, South Africa: WWF.
O'Dor, R. K., Andrade, Y., Webber, D., Sauer, W., Roberts, M., Smale, M. and Voegeli, F. (1998) Applications and performance of Radio-Acoustic Positioning and Telemetry (RAPT) systems. Hydrobiologia, 371, 3721-3728.
Paulin, M. (1995) Electroreception and the compass sense in sharks. Journal of Theoretical Biology, 174, 325–339.
Peters, R. and Evers, H. (1985) Frequency selectivity in the ampullary system of an elasmobranch fish (Scyliorhinus canicula). Journal of Experimental Biology, 118, 99–109.
Rasmussen, L. E. L. and Schmidt, M. J. 1992. Are sharks chemically aware of crocodiles? In: DOTY, R. L. & MÜLLER-SCHWARZE, D. (eds.) Chemical Signals in Vertebrates IV. New York: Plenum Press.

Huveneers, C. et al Assessing the efficacy of the Shark ShieldTM
60
Rigg, D. P., Peverell, S. C., Hearndon, M. and Seymour, J. E. (2009) Do elasmobranch reactions to magnetic fields in water show promise for bycatch mitigation. Marine Freshwater Research, 60, 942–948.
Robbins, W. D., Peddemors, V. and Kennelly, S. J. (2011) Assessment of permanent magnets and electropositive metals to reduce the line-based capture of Galapagos sharks, Carcharhinus galapagensis. Fisheries Research, 109, 100-106.
Semeniuk, C. A. D., Speers-Roesch, B. and Rothley, K. D. (2007) Using Fatty-Acid Profile Analysis as an Ecologic Indicator in the Management of Tourist Impacts on Marine Wildlife: A Case of Stingray-Feeding in the Caribbean. Environmental Management, 40, 665-677.
Simpfendorfer, C. A., Heupel, M. R., White, W. T. and Dulvy, N. K. (2011) The importance of research and public opinion to conservation management of sharks and rays: a synthesis. Marine and Freshwater Research, 62, 518–527.
Sisneros, J., Tricas, T. and Luer, C. (1998) Response properties and biological function of the skate electrosensory system during ontogeny. Journal of Comparative Physiology A Sensory Neural and Behavioral Physiology, 183, 87–99.
Sisneros, J. A. and Nelson, D. R. (2001) Surfactants as Chemical Shark Repellents: Past, Present, and Future. Environmental Biology of Fishes, 60, 117-130.
Smit, C. F. and Peddemors, V. M. (2003) Estimating the probability of a shark attack when using an electric repellent. South African Journal of Statistics, 37, 59–78.
Smith, E. D. (1966) Electrical shark barrier research. Geo-marine technology, 2, 10-14.
Smith, E. D. (1973) Electric anti-shark cable. Civil engineering and public works review, 68, 174-176.
Smith, E. D. (1974) Electro-physiology of the electrical shark-repellant. The Transactions of the Institute of Electrical Engineers, 166-181.
Smith, E. D. (1990) A new perspective on electrical shark barriers. South African Shipping New & Fishing Industry Review, 40-41.
Smith, K., Scarr, M. and Scapaci, C. (2010) Grey nurse shark (Carcharias taurus) diving tourism: tourist compliance and shark behaviour at Fish Rock, Australia. Environmental Management, 46, 699-710.
Stoner, A. W. and Kaimmer, S. M. (2008) Reducing elasmobranch bycatch: laboratory investigation of rare earth metal and magnetic deterrents with spiny dogfish and Pacific halibut. Fisheries Research, 92, 162–168.
Tallack, S. M. L. and Mandelman, J. (2009) Do rare-earth metals deter spiny dogfish? A feasibility study on the use of electropositive “mischmetal” to reduce the bycatch of Squalus acanthias by hook gear in the Gulf of Maine. ICES Journal of Marine Science, 66, 315–322.
Tricas, T., Michael, S. and Sisneros, J. (1995) Electrosensory optimization to conspecific phasic signals for mating. Neuroscience Letters, 202, 129–132.
Wang, J. H., McNaughton, L. and Swimmer, Y. Galapagos and sandbar shark aversion to electropositive metal (Pr–Nd alloy). . In: SWIMMER, Y., WANG, J. H. & MCNAUGHTON, L.

Huveneers, C. et al Assessing the efficacy of the Shark ShieldTM
61
S., eds. Shark Deterrent and Incidental Capture Workshop, April 10–11, 2008. NOAA Technical Memorandum NMFSPIFSC-16, 2008. U.S. Department of Commerce, 28–32.
West, J. (2011) Changing patterns of shark attacks in Australian waters. Marine and Freshwater Research, 62, 744–754.
Zamora, L. and Moreno-Amich, R. (2002) Quantifying the activity and movement of perch in a temperate lake by integrating acoustic telemetry and a geographic information system. Hydrobiologia, 483.