Marin County Market Update | Q2 2014
9
All data within this document is pulled from the Bay Area Real Estate Information Services (BAREIS) Marin County Market Update Second Quarter 2014 SAN FRANCISCO BROKERAGE 117 Greenwich Street San Francisco, CA 94111 t. 415.901.1700 sothebyshomes.com Ross, CA | web: 0086832
-
Upload
sothebys-international-realty-inc -
Category
Documents
-
view
217 -
download
2
description
Â
Transcript of Marin County Market Update | Q2 2014
All data within this document is pulled from the Bay Area Real Estate Information Services (BAREIS)
Marin County Market UpdateSecond Quarter 2014SAn FRAnCISCo BRokERAgE
117 greenwich Street
San Francisco, CA 94111
t. 415.901.1700
sothebyshomes.com
Ross, CA | web: 0086832
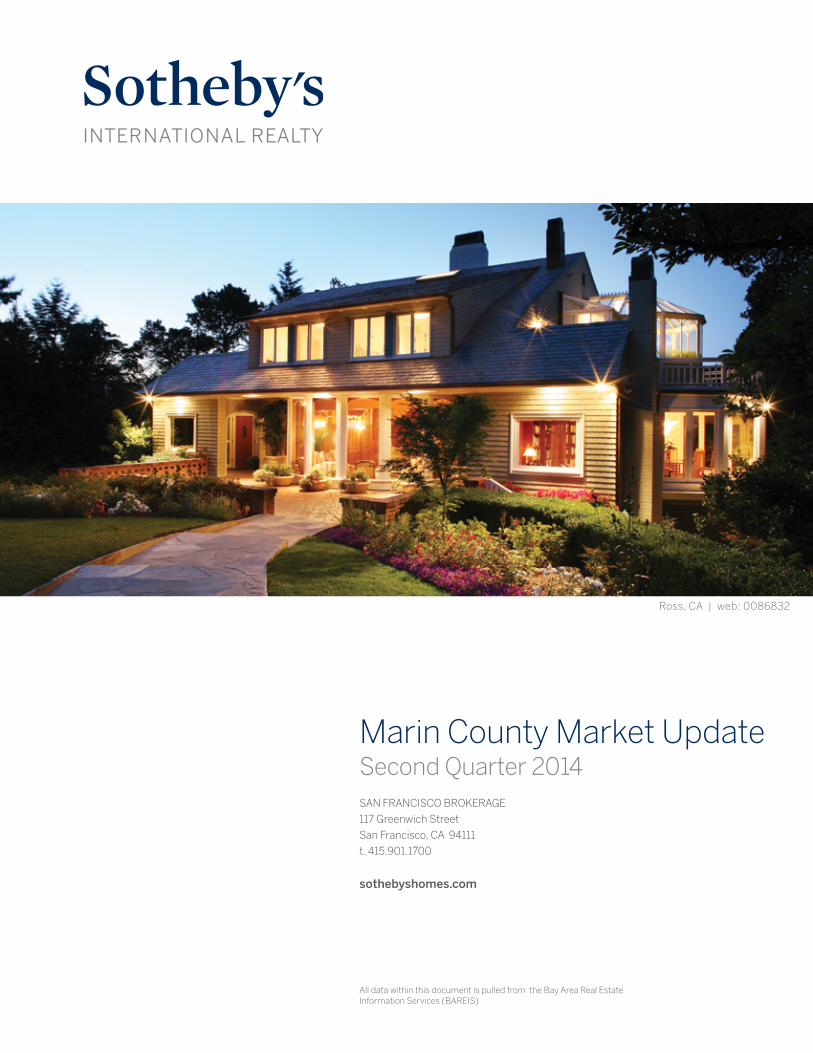
A MESSAGE FROM OUR MANAGER: Jeffrey G. Gibson
As we reach the second half of 2014, the Marin County high end real estate market in the second quarter of 2014 performed extremely well compared to the second quarter of 2013 according to the Bay Area Real Estate Information Service (BAREIS). In Marin County, both overall sales volume and average sales price of single family homes continued to grow. Total sales volume in Marin County experienced a 10 percent gain, bringing the total volume to more than $1 billion ($1,047,312,199) in the second quarter of 2014. The average sales price also grew 13 percent, from $1,214,955 in Q2 2013 to $1,374,425 in Q2 2014.
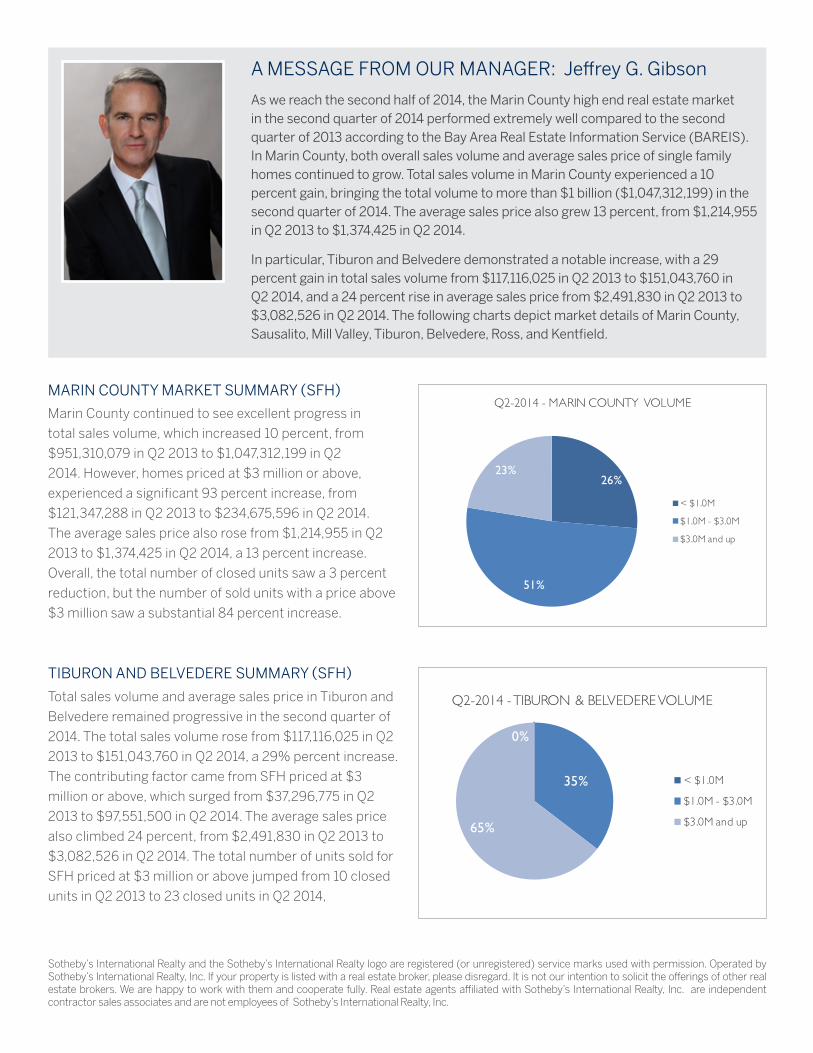
In particular, Tiburon and Belvedere demonstrated a notable increase, with a 29 percent gain in total sales volume from $117,116,025 in Q2 2013 to $151,043,760 in Q2 2014, and a 24 percent rise in average sales price from $2,491,830 in Q2 2013 to $3,082,526 in Q2 2014. The following charts depict market details of Marin County, Sausalito, Mill Valley, Tiburon, Belvedere, Ross, and Kentfield.
MARIN COUNTy MARKET SUMMARy (SFH)
TIBURON ANd BElVEdERE SUMMARy (SFH)
Marin County continued to see excellent progress in
total sales volume, which increased 10 percent, from
$951,310,079 in Q2 2013 to $1,047,312,199 in Q2
2014. However, homes priced at $3 million or above,
experienced a significant 93 percent increase, from
$121,347,288 in Q2 2013 to $234,675,596 in Q2 2014.
The average sales price also rose from $1,214,955 in Q2
2013 to $1,374,425 in Q2 2014, a 13 percent increase.
overall, the total number of closed units saw a 3 percent
reduction, but the number of sold units with a price above
$3 million saw a substantial 84 percent increase.
Total sales volume and average sales price in Tiburon and
Belvedere remained progressive in the second quarter of
2014. The total sales volume rose from $117,116,025 in Q2
2013 to $151,043,760 in Q2 2014, a 29% percent increase.
The contributing factor came from SFH priced at $3
million or above, which surged from $37,296,775 in Q2
2013 to $97,551,500 in Q2 2014. The average sales price
also climbed 24 percent, from $2,491,830 in Q2 2013 to
$3,082,526 in Q2 2014. The total number of units sold for
SFH priced at $3 million or above jumped from 10 closed
units in Q2 2013 to 23 closed units in Q2 2014,
Sotheby’s International Realty and the Sotheby’s International Realty logo are registered (or unregistered) service marks used with permission. operated by Sotheby’s International Realty, Inc. If your property is listed with a real estate broker, please disregard. It is not our intention to solicit the offerings of other real estate brokers. We are happy to work with them and cooperate fully. Real estate agents affiliated with Sotheby’s International Realty, Inc. are independent contractor sales associates and are not employees of Sotheby’s International Realty, Inc.
0%
35%
65%
Q2-2014 - TIBURON & BELVEDERE VOLUME
< $1.0M
$1.0M - $3.0M
$3.0M and up
26%
51%
23%
Q2-2014 - MARIN COUNTY VOLUME
< $1.0M
$1.0M - $3.0M
$3.0M and up

3
SINGLE FAMILY HOME SALES
Across the golden gate Bridge from San Francisco lies Marin County, an
area renowned for its natural beauty. Marin County is home to Muir Woods
redwood forest, the Marin Headlands, Stinson Beach, the Point Reyes
national Seashore and Mount Tamalpais. Most of the county’s population
resides on the eastern side, with the interior of the city consisting of large
areas of agricultural and open space.
MARIN COUNTy
PRICE RANGE 2011 2012 2013 2014 % CHANGE(2014 v 2013)
Up TO $1 MIllION 364 456 416 371 -11%
$1 - $3 MIllION 169 201 336 334 -1%
$3 MIllION ANd Up 19 20 31 57 84%
TOTALS 552 677 783 762 -3%
Q2 CLoSED UnITS: # oF SIDES (SFH)
PRICE RANGE 2011 2012 2013 2014 % CHANGE(2014 v 2013)
Up TO $1 MIllION $233,997,099 $289,894,334 $297,418,865 $275,683,542 -7%
$1 - $3 MIllION $272,812,338 $327,983,241 $532,543,926 $536,953,061 1%
$3 MIllION ANd Up $79,548,660 $91,297,000 $121,347,288 $234,675,596 93%
TOTALS $586,358,097 $709,174,575 $951,310,079 $1,047,312,199 10%
Q2 CLoSED VoLUME (SFH)
PRICE RANGE 2011 2012 2013 2014 % CHANGE(2014 v 2013)
Up TO $1 MIllION $642,849 $635,733 $714,949 $743,082 4%
$1 - $3 MIllION $1,614,274 $1,631,757 $1,584,952 $1,607,644 1%
$3 MIllION ANd Up $4,186,772 $4,564,850 $3,914,429 $4,117,116 5%
TOTALS $1,062,243 $1,047,525 $1,214,955 $1,374,425 13%
Q2 AVERAgE SALES PRICE (SFH)
$- $200,000 $400,000 $600,000 $800,000
$1,000,000 $1,200,000 $1,400,000 $1,600,000
2011 2012 2013 2014
Average List Price Average Sales Price
-
100
200
300
400
500
600
700
800
900
2011 2012 2013 2014
$-
$200,000,000
$400,000,000
$600,000,000
$800,000,000
$1,000,000,000
$1,200,000,000
2011 2012 2013 2014

4SERVIng MARIn CoUnTy AnD SAn FRAnCISCo sothebyshomes.com/sanfrancisco
SINGLE FAMILY HOME SALES
Mill Valley, about 14 miles north of San Francisco, is located on the western and
northern shores of Richardson Bay. Mill Valley is known for being a town with
a strong artistic heritage, with its many art galleries and town sponsorship of
the Mill Valley Film Festival, which is part of the California Film Institute. The
combination of Mill Valley’s idyllic location beneath Mount Tamalpais and
its ease of access to San Francisco has made it a popular home for many
commuters.
MIll VAllEy
PRICE RANGE 2011 2012 2013 2014 % CHANGE(2014 v 2013)
Up TO $1 MIllION 46 46 39 30 -23%
$1 - $3 MIllION 35 51 70 82 17%
$3 MIllION ANd Up 2 1 3 9 200%
TOTALS 83 98 112 121 8%
Q2 CLoSED UnITS: # oF SIDES (SFH)
PRICE RANGE 2011 2012 2013 2014 % CHANGE(2014 v 2013)
Up TO $1 MIllION $35,642,350 $34,425,400 $30,766,400 $25,492,572 -17%
$1 - $3 MIllION $58,850,488 $79,858,857 $106,368,050 $137,269,875 29%
$3 MIllION ANd Up $7,003,160 $3,300,000 $12,590,000 $35,091,275 179%
TOTALS $101,495,998 $117,584,257 $149,724,450 $197,853,722 32%
Q2 CLoSED VoLUME (SFH)
PRICE RANGE 2011 2012 2013 2014 % CHANGE(2014 v 2013)
Up TO $1 MIllION $774,834 $748,378 $788,882 $849,752 8%
$1 - $3 MIllION $1,681,443 $1,565,860 $1,519,544 $1,674,023 10%
$3 MIllION ANd Up $3,501,580 $3,300,000 $4,196,667 $3,899,031 -7%
TOTALS $1,222,843 $1,199,839 $1,336,825 $1,635,155 22%
Q2 AVERAgE SALES PRICE (SFH)
$- $200,000 $400,000 $600,000 $800,000
$1,000,000 $1,200,000 $1,400,000 $1,600,000 $1,800,000
2011 2012 2013 2014
Average List Price Average Sales Price
-
20
40
60
80
100
120
140
2011 2012 2013 2014
$-
$50,000,000
$100,000,000
$150,000,000
$200,000,000
$250,000,000
2011 2012 2013 2014

5
SINGLE FAMILY HOME SALES
The quaint residential towns of Ross and kentfield, with their small-town feel,
tree-covered hills, winding creeks, graciously landscaped streets and gardens,
serve as an ideal oasis for both locals and visitors alike. Ross is located just
north of San Francisco and is bordered by kentfield and greenbrae to the
east. kentfield is home to the main campus for the College of Marin, which is
well known for its theatre department.
ROSS and KENTFIEld
PRICE RANGE 2011 2012 2013 2014 % CHANGE(2014 v 2013)
Up TO $1 MIllION 2 6 4 3 -25%
$1 - $3 MIllION 18 24 29 27 -7%
$3 MIllION ANd Up 9 6 11 14 27%
TOTALS 29 36 44 44 0%
Q2 CLoSED UnITS: # oF SIDES (SFH)
PRICE RANGE 2011 2012 2013 2014 % CHANGE(2014 v 2013)
Up TO $1 MIllION $1,862,500 $4,905,000 $3,367,000 $2,380,000 -29%
$1 - $3 MIllION $33,899,000 $50,062,300 $55,405,175 $49,674,214 -10%
$3 MIllION ANd Up $45,305,500 $34,970,000 $46,710,500 $62,767,221 34%
TOTALS $81,067,000 $89,937,300 $105,482,675 $114,821,435 9%
Q2 CLoSED VoLUME (SFH)
PRICE RANGE 2011 2012 2013 2014 % CHANGE(2014 v 2013)
Up TO $1 MIllION $931,250 $817,500 $841,750 $793,333 -6%
$1 - $3 MIllION $1,883,278 $2,085,929 $1,910,523 $1,839,786 -4%
$3 MIllION ANd Up $5,033,944 $5,828,333 $4,246,409 $4,483,373 6%
TOTALS $2,795,414 $2,498,258 $2,397,334 $2,609,578 9%
Q2 AVERAgE SALES PRICE (SFH)
$-
$500,000
$1,000,000
$1,500,000
$2,000,000
$2,500,000
$3,000,000
$3,500,000
2011 2012 2013 2014
Average List Price Average Sales Price
-
5
10
15
20
25
30
35
40
45
50
2011 2012 2013 2014
$-
$50,000,000
$100,000,000
$150,000,000
$200,000,000
$250,000,000
2011 2012 2013 2014 $-
$20,000,000
$40,000,000
$60,000,000
$80,000,000
$100,000,000
$120,000,000
$140,000,000
2011 2012 2013 2014

6SERVIng MARIn CoUnTy AnD SAn FRAnCISCo sothebyshomes.com/sanfrancisco
SINGLE FAMILY HOME SALES
The waterfront town of Sausalito is located just across the golden gate Bridge
from San Francisco. The charming town offers an array of boutique shops,
art studios and galleries, restaurants and outdoor cafes and bistros, many
with incredible views of the San Francisco Bay and city skyline. Sausalito is
adjacent to the protected areas of the golden gate national Recreation Area,
a popular camping and tourist destination.
SAUSAlITO
PRICE RANGE 2011 2012 2013 2014 % CHANGE(2014 v 2013)
Up TO $1 MIllION 7 7 4 5 25%
$1 - $3 MIllION 14 9 17 12 -29%
$3 MIllION ANd Up 1 1 2 3 50%
TOTALS 22 17 23 20 -13%
Q2 CLoSED UnITS: # oF SIDES (SFH)
PRICE RANGE 2011 2012 2013 2014 % CHANGE(2014 v 2013)
Up TO $1 MIllION $5,138,000 $5,110,000 $2,769,000 $4,173,000 51%
$1 - $3 MIllION $21,488,850 $14,722,000 $26,803,500 $23,203,300 -13%
$3 MIllION ANd Up $3,000,000 $3,260,000 $7,100,013 $10,849,000 53%
TOTALS $29,626,850 $23,092,000 $36,672,513 $38,225,300 4%
Q2 CLoSED VoLUME (SFH)
PRICE RANGE 2011 2012 2013 2014 % CHANGE(2014 v 2013)
Up TO $1 MIllION $734,000 $730,000 $692,250 $834,600 21%
$1 - $3 MIllION $1,534,918 $1,635,778 $1,576,676 $1,933,608 23%
$3 MIllION ANd Up $3,000,000 $3,260,000 $3,550,007 $3,616,333 2%
TOTALS $1,346,675 $1,358,353 $1,594,457 $1,911,265 20%
Q2 AVERAgE SALES PRICE (SFH)
$-
$500,000
$1,000,000
$1,500,000
$2,000,000
$2,500,000
2011 2012 2013 2014
Average List Price Average Sales Price
-
5
10
15
20
25
2011 2012 2013 2014
$-
$5,000,000
$10,000,000
$15,000,000
$20,000,000
$25,000,000
$30,000,000
$35,000,000
$40,000,000
$45,000,000
2011 2012 2013 2014

7
SINGLE FAMILY HOME SALES
Tiburon occupies most of the Tiburon Peninsula, while the smaller city of
Belvedere occupies the southeast portion of the Peninsula. Tiburon is a
popular town amongst commuters and tourists, linked by ferry services
to San Francisco. The town offers a high concentration of restaurants and
boutiques and is the closest mainland point to Angel Island. Belvedere is
home to many properties renowned for their spectacular views of the Bay
Area, Angel Island, San Francisco, Sausalito, the golden gate Bridge and
Mount Tamalpais.
TIBURON and BElVEdERE
PRICE RANGE 2011 2012 2013 2014 % CHANGE(2014 v 2013)
Up TO $1 MIllION 3 5 n/a n/a n/a
$1 - $3 MIllION 25 31 37 26 -30%
$3 MIllION ANd Up 5 9 10 23 130%
TOTALS 33 45 47 49 4%
Q2 CLoSED UnITS: # oF SIDES (SFH)
PRICE RANGE 2011 2012 2013 2014 % CHANGE(2014 v 2013)
Up TO $1 MIllION $2,610,300 $4,115,500 n/a n/a n/a
$1 - $3 MIllION $50,060,500 $52,440,374 $79,819,250 $53,492,260 -33%
$3 MIllION ANd Up $17,240,000 $37,367,000 $37,296,775 $97,551,500 162%
TOTALS $69,910,800 $93,922,874 $117,116,025 $151,043,760 29%
Q2 CLoSED VoLUME (SFH)
PRICE RANGE 2011 2012 2013 2014 % CHANGE(2014 v 2013)
Up TO $1 MIllION $870,100 $823,100 n/a n/a n/a
$1 - $3 MIllION $2,002,420 $1,691,625 $2,157,277 $2,057,395 -5%
$3 MIllION ANd Up $3,448,000 $4,151,889 $3,729,678 $4,241,370 14%
TOTALS $2,118,509 $2,087,175 $2,491,830 $3,082,526 24%
Q2 AVERAgE SALES PRICE (SFH)
$-
$500,000
$1,000,000
$1,500,000
$2,000,000
$2,500,000
$3,000,000
$3,500,000
2011 2012 2013 2014
Average List Price Average Sales Price
-
10
20
30
40
50
60
2011 2012 2013 2014
$-
$20,000,000
$40,000,000
$60,000,000
$80,000,000
$100,000,000
$120,000,000
$140,000,000
$160,000,000
2011 2012 2013 2014
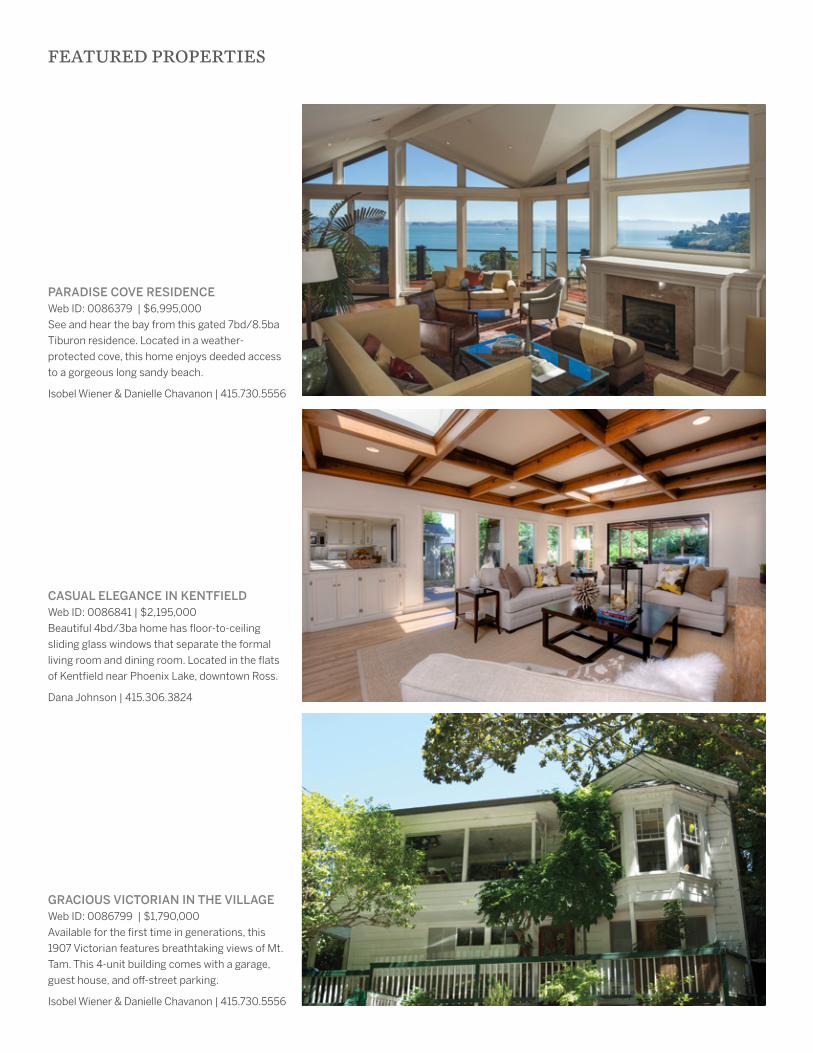
PARAdISE COvE RESIdENCEWeb Id: 0086379 | $6,995,000
See and hear the bay from this gated 7bd/8.5ba
Tiburon residence. located in a weather-
protected cove, this home enjoys deeded access
to a gorgeous long sandy beach.
Isobel Wiener & danielle Chavanon | 415.730.5556
CASuAL ELEGANCE IN KENTfIELdWeb Id: 0086841 | $2,195,000
Beautiful 4bd/3ba home has floor-to-ceiling
sliding glass windows that separate the formal
living room and dining room. located in the flats
of Kentfield near phoenix lake, downtown Ross.
dana Johnson | 415.306.3824
GRACIOuS vICTORIAN IN THE vILLAGEWeb Id: 0086799 | $1,790,000
Available for the first time in generations, this
1907 Victorian features breathtaking views of Mt.
Tam. This 4-unit building comes with a garage,
guest house, and off-street parking.
Isobel Wiener & danielle Chavanon | 415.730.5556
featured properties
Visit us in OuR stORe OR Online. Our specialists will help you shop for the best wines for all occasions.
Available for immediate delivery.
1334 YORk AVenue At 72nd stReet, nY, nY 10021 | MOndAY tO FRidAY 10AM – 7PM, sAtuRdAY 10AM – 6PM
Sothebyswine.com

Visit us in OuR stORe OR Online. Our specialists will help you shop for the best wines for all occasions.
Available for immediate delivery.
1334 YORk AVenue At 72nd stReet, nY, nY 10021 | MOndAY tO FRidAY 10AM – 7PM, sAtuRdAY 10AM – 6PM
Sothebyswine.com


![Investor Update Q2 FY16 / H1 FY16 [Company Update]](https://static.fdocuments.in/doc/165x107/577ca80a1a28abea748caad0/investor-update-q2-fy16-h1-fy16-company-update.jpg)

![Q2 Result Presentation [Company Update]](https://static.fdocuments.in/doc/165x107/577ca7871a28abea748c70f6/q2-result-presentation-company-update.jpg)