
Mariassunta Giannetti, Mike Burkart and Tore Ellingsen …eprints.lse.ac.uk/69543/1/Burkhart_What...
66
Mariassunta Giannetti, Mike Burkart and Tore Ellingsen What you sell is what you lend? Explaining trade credit contracts Article (Accepted version) (Refereed) Original citation: Giannetti, Mariassunta, Burkart, Mike and Ellingsen, Tore (2011) What you sell is what you lend? Explaining trade credit contracts. The Review of Financial Studies, 24 (4). pp. 1261-1298. ISSN 0893-9454 DOI: 10.1093/rfs/hhn096 © 2008 The Author This version available at: http://eprints.lse.ac.uk/69543/ Available in LSE Research Online: February 2017 LSE has developed LSE Research Online so that users may access research output of the School. Copyright © and Moral Rights for the papers on this site are retained by the individual authors and/or other copyright owners. Users may download and/or print one copy of any article(s) in LSE Research Online to facilitate their private study or for non-commercial research. You may not engage in further distribution of the material or use it for any profit-making activities or any commercial gain. You may freely distribute the URL (http://eprints.lse.ac.uk) of the LSE Research Online website. This document is the author’s final accepted version of the journal article. There may be differences between this version and the published version. You are advised to consult the publisher’s version if you wish to cite from it.
-
Upload
truongmien -
Category
Documents
-
view
216 -
download
0
Transcript of Mariassunta Giannetti, Mike Burkart and Tore Ellingsen …eprints.lse.ac.uk/69543/1/Burkhart_What...

Mariassunta Giannetti, Mike Burkart and Tore Ellingsen
What you sell is what you lend? Explaining trade credit contracts Article (Accepted version) (Refereed)
Original citation: Giannetti, Mariassunta, Burkart, Mike and Ellingsen, Tore (2011) What you sell is what you lend? Explaining trade credit contracts. The Review of Financial Studies, 24 (4). pp. 1261-1298. ISSN 0893-9454 DOI: 10.1093/rfs/hhn096 © 2008 The Author This version available at: http://eprints.lse.ac.uk/69543/ Available in LSE Research Online: February 2017 LSE has developed LSE Research Online so that users may access research output of the School. Copyright © and Moral Rights for the papers on this site are retained by the individual authors and/or other copyright owners. Users may download and/or print one copy of any article(s) in LSE Research Online to facilitate their private study or for non-commercial research. You may not engage in further distribution of the material or use it for any profit-making activities or any commercial gain. You may freely distribute the URL (http://eprints.lse.ac.uk) of the LSE Research Online website. This document is the author’s final accepted version of the journal article. There may be differences between this version and the published version. You are advised to consult the publisher’s version if you wish to cite from it.

What You Sell Is What You Lend?
Explaining Trade Credit Contracts�
Mariassunta Giannetti
Stockholm School of Economics,
CEPR and ECGI
Mike Burkart
Stockholm School of Economics,
London School of Economics,
CEPR, ECGI and FMG
Tore Ellingsen
Stockholm School of Economics,
and CEPR
�We thank two anonymous referees, Allan Berger, Mike Cooper, Hans Degryse, Paolo Fulghieri (the editor),Ron Masulis, Mitchell Petersen, Greg Udell and seminar participants at the RFS Conference on The FinancialManagement of Financial Intermediaries (Wharton), the European Finance Association (Zurich), the CEPR Sum-mer Symposium in Financial Markets, the Chicago Fed Bank Structure Conference, the ECB Conference on Cor-porate Finance and Monetary Policy, The Financial Intermediation Research Society Conference (Shanghai), theUniversity of Utah, Tilburg University, Norwegian School of Management and Business Administration (Bergen),the World Bank, the Bank of Sweden, and the Stockholm School of Economics for their comments. Financial sup-port from the Jan Wallander och Tom Hedelius Foundation (Giannetti), the Riksbankens Jubileumsfond (Burkartand Ellingsen) and the Torsten and Ragnar Söderberg Foundation (Ellingsen) is gratefully acknowledged. Addresscorrespondence to: Mariassunta Giannetti, Stockholm School of Economics, Box 6501, SE� 113 83 Stockholm,Sweden; telephone: +46-8-7369607, email: [email protected].

Abstract
We relate trade credit to product characteristics and aspects of bank-�rm relationships and document
three main empirical regularities. First, the use of trade credit is associated with the nature of the
transacted good. In particular, suppliers of di¤erentiated products and services have larger accounts
receivable than suppliers of standardized goods and �rms buying more services receive cheaper trade
credit for longer periods. Second, �rms receiving trade credit secure �nancing from relatively unin-
formed banks. Third, a majority of the �rms in our sample appears to receive trade credit at low cost.
Additionally, �rms that are more creditworthy and have some buyer market power receive larger early
payment discounts.
JEL classification: G32.
Keywords: Trade credit, contract theory, collateral, moral hazard

Trade credit is an important source of funds for most �rms and is considered to be crucial for �rms
that are running out of bank credit.1 Previous empirical work has primarily investigated how the
borrower�s performance and �nancial health a¤ect the volume of trade credit. We broaden the analysis
in two directions. First, we show how trade credit usage is correlated not only with the �rm�s balance
sheet position, but also with the characteristics of the traded product and with the buyer�s banking
relationships. Second, we analyze both trade credit volumes and contract terms. Overall, while our
�ndings provide some support for existing trade credit theories, they also challenge received wisdom.
Relating trade credit to the nature of the inputs and banking relationships enables us to uncover
three novel empirical regularities about trade credit use and practice in the United States.
The �rst empirical regularity is that the use of trade credit is associated with the nature of the
transacted good. More speci�cally, after controlling for debt capacity, suppliers of di¤erentiated products
and services have larger accounts receivable than suppliers of standardized goods. Service suppliers also
appear to o¤er cheaper trade credit for longer periods, and do not refuse lending on the basis of the
buyer�s creditworthiness.
This �rst set of results demonstrates the empirical relevance of theories that implicitly attribute
trade credit to product characteristics. As we argue, these explanations have in common that the prod-
ucts sold on credit are not homogeneous o¤-the-shelf goods, but each proposes a di¤erent economic
mechanism. Overall, the empirical evidence lends most support to theories maintaining that suppli-
ers are less concerned about borrower opportunism either because of strong customer relationships or
because of the low diversion value of some inputs. Suppliers of services and di¤erentiated products
may be hard to replace because they provide unique or highly customized inputs. The consequent high
switching costs make buyers reluctant to break up relationships and thus less tempted to default on
these suppliers [Cunat (2007)]. Hence, suppliers of services and di¤erentiated products should be more
3

willing to sell on credit than suppliers of standardized products.
Di¤erentiated products and services are also more di¢ cult or even impossible to divert for unintended
purposes. While standardized products command a market price and can be easily sold to many di¤erent
users, resale revenues may be low for di¤erentiated goods because it may be hard to identify suitable
buyers and there is no reference price. Services are virtually impossible to resell. This should contribute
to shield suppliers of di¤erentiated goods and services against buyer opportunism [Burkart and Ellingsen
(2004)] in the same way as strong relationships with customers do.
Other theories that also implicitly associate trade credit with non-standardized goods �nd limited
support in the data. First, di¤erentiated goods are more often tailored to the needs of particular
customers. Original suppliers can redeploy these goods better than other lenders following buyer default
because they know the pool of potential alternative buyers or because they can modify the goods more
easily to the needs of other customers. Hence, these goods should be sold on credit [Longhofer and
Santos (2003); and Frank and Maksimovic (2004)]. This theory appears incapable of accounting for the
widespread use of trade credit in the United States, not least because of the suppliers�limited ability
to repossess the good. In case of default, U.S. laws allow suppliers to repossess the good only within
10 days since delivery,2 whereas in our sample the maturity of trade credit typically exceeds 10 days.
Additionally, this theory cannot explain why service suppliers are inclined to provide trade credit as
services have no collateral value.
Second, di¤erentiated products and services tend to have more quality variation, making buyers
more reluctant to pay before having had time to inspect the merchandise or ascertained the quality of
services [Smith (1987)].3 However, we �nd that suppliers�reputations do not decrease their propensity
to o¤er trade credit.
Finally, other theories propose that suppliers may be concerned with losing crucial customers and
4

they may be willing to support these customers when they have temporary �nancial di¢ culties [Wilner
(2000)]. We �nd no evidence that buyers of services and di¤erentiated products receive more assis-
tance. However, the data support the notion that suppliers sustain �rms with �nancial problems, thus
con�rming that trading relationships are important to understand trade credit.
The second empirical regularity is that �rms receiving trade credit secure �nancing from relatively
uninformed banks. After controlling for �rm creditworthiness and outstanding �nancial loans, �rms that
use trade credit tend to borrow from a larger number of banks, utilize more distant banks, and have
shorter relationships with their banks. Additionally, these �rms are o¤ered better deals from banks, in
particular lower fees for their credit lines.
Firms borrowing from numerous and distant banks for short periods are generally considered to have
arm�s length relations with their lenders who gather only limited information about their businesses
[e.g., Von Thadden (1995) and Degryse and Ongena (2004)]. Hence, it appears that �rms that are
being o¤ered trade credit can secure funding from less informed �nancial intermediaries. The positive
relationship between uninformed bank credit and trade credit is consistent with Biais and Gollier�s
(1997) theoretical result that the extension of trade credit reveals favorable information to other lenders,
thereby increasing their willingness to lend. While we cannot exclude that more public information is
available about these �rms, our �nding reveals that suppliers do not enjoy an informational monopoly. In
either case, suppliers have no persistent informational advantage and other suppliers should be willing
to do business with the �rm as easily as less informed banks. Thus, trading relationships are more
likely to arise because of high switching costs and not because the current supplier�s private information
about the customer deters new suppliers, as is believed to be the case for bank-�rm relationships [Sharpe
(1990); and Rajan (1992)]. In addition, this �nding challenges the notion that �rms using trade credit
are unable to access bank credit.
5

The third empirical regularity is that a majority of our sample �rms receives trade credit at low
cost. Additionally, large �rms and �rms with many suppliers are o¤ered more trade credit with longer
maturity and larger early payment discounts.
Only a minority of �rms in our sample report that their main supplier o¤ers early payment discounts.
To the extent that foregone discounts are the predominant cost of trade credit, as suggested by previous
literature [e.g., Petersen and Rajan (1994)], most trade credit appears cheaper than bank credit. In
principle, suppliers could implicitly charge for trade credit by raising input prices. While we are unable
to directly control for this possibility, we �nd evidence of the contrary: Within an industry, �rms with
large accounts payable have a lower cost of inputs. Hence, this �nding goes against the common view
that trade credit is primarily a last funding resort for �rms that are running out of bank credit.
We also �nd that large �rms receive more discounts. Since large �rms are usually less risky, discounts
are unlikely to capture a risk premium. It seems more plausible that the discounts re�ect a price
reduction o¤ered to customers that are able to pay early. Such an interpretation is also consistent with
the �nding that �rms with many suppliers, which arguably have greater bargaining power, receive larger
discounts. Large �rms and especially �rms with many suppliers also receive more trade credit for longer
periods. This again suggests that buyer market power a¤ects the availability of trade credit. Existing
theories fail to explain why suppliers provide trade credit to customers with bargaining power instead
of o¤ering (larger) price reductions.
Our work is related to several previous studies. Following Elliehausen and Wolken (1993) and
Petersen and Rajan (1997), we use detailed �rm-level survey data from the National Survey of Small
Businesses Finances (NSSBF). We add to their work by exploiting industry variation in trade credit to
discriminate among di¤erent theories. In addition, we analyze both how much trade credit is o¤ered �as
they do �and how trade credit is o¤ered. Using a di¤erent data set, Ng, Smith, and Smith (1999) study
6

variation in trade credit contract terms, focussing on how supplier characteristics a¤ect the decision to
o¤er early payment discounts. Bringing these two approaches together, our paper attempts to analyze
the complete trade credit contract. More importantly, we introduce theoretically motivated measures
of product characteristics to explain the broad set of contract characteristics and thereby evaluate the
empirical relevance of di¤erent theories.
McMillan and Woodru¤ (1999), Johnson, McMillan, and Woodru¤ (2002), and Uchida, Udell, and
Watanabe (2007) document that in emerging markets as well as in Japan longer duration of trading
relationships is often associated with more trade credit. Complementing these �ndings, our study
indicates that the extent to which relationships may help to explain the suppliers�willingness to extend
credit depends crucially on the type of goods that they provide.
Some recent papers investigate the relative importance of trade credit across countries and over time.
Demirguc-Kunt and Maksimovic (2002) and Fisman and Love (2003) document that �rms in countries
with weak legal systems rely relatively more on trade credit. Similarly, increased reliance on trade credit
during recessions [Nilsen (2002)] suggests that trade credit helps mitigating agency problems.
Our work is also related to the growing literature that studies the determinants of contract terms in
di¤erent contexts [e.g., Berger and Udell (1995); and Kaplan and Strömberg (2003)]. Besides studying
the contract terms that suppliers o¤er, the data also allow us to analyze how contract terms a¤ect
actual borrower behavior.
The remainder of the paper is organized as follows. Section 1 provides the theoretical background
and derives the hypotheses. Section 2 describes the data and provides summary statistics. Sections 3,
4 and 5 report our results on trade credit volume, contract terms and usage. Section 6 concludes.
7

1. Theories
In this section, we review the implications of trade credit theories and explain to what extent systematic
di¤erences in the nature of the products transacted in di¤erent industries can help to shed light on their
empirical relevance. Among the various theories, we focus almost exclusively on �nancial and contract
theoretical explanations,4 while attempting to control in the empirical analysis for other potential de-
terminants of trade credit. It is beyond the scope of our paper to test theories based on imperfect
competition, as full tests of these theories would require observing transacted quantities and prices.
Besides the amount of input sold on credit, a supplier�s trade credit decision includes other terms such
as due date and interest rate. These terms determine the cost of credit and its maturity, but may also
re�ect the reason(s) why a supplier is willing to sell on credit. In what follows, we divide the discussion
of the theoretical background into two parts. We begin by reviewing the various explanations for (the
existence of) trade credit. We then describe the various contract terms and discuss the implications of
�nancial contracting theories for these terms.
1.1 Existence of trade credit
Following most theoretical papers, we discuss the trade credit decision from the supplier�s perspective.
To this end, we present a simple formal framework to explore why a supplier may be more willing than
a bank to fund the input purchase of a customer. In so doing, we identify the supplier and customer
characteristics that are predicted to explain variation in trade credit. We also want to point out that
while our simple framework is static, the underlying logic sometimes relies on dynamic considerations.
Consider a penniless entrepreneur who wants to purchase inputs with a market value (price) of L.
For simplicity, suppose that the entrepreneur borrows either from a bank or a supplier, but not from
8

both. Let Li denote lender i�s opportunity cost of extending the loan. The index denotes whether
the lender is a bank (B) or a supplier (S). For a competitive bank with constant marginal cost of
funds r, the cost is LB = (1 + r)L. Let Di denote the repayment obligation associated with the loan.
Initially, we want to compare the willingness of banks and suppliers to lend, leaving aside the issue of
optimal contracting. We therefore �x the repayment period and set DB = DS = D. Let pi denote the
true probability that the borrower repays the loan, and let Ai(pi) denote lender i�s assessment of the
probability. In case the borrower defaults, the lender gets some collateral Ci. Hence, lender i�s expected
pro�tability of granting the entrepreneur the loan L can be written as:
E[�i] = Ai(pi)D + (1�Ai(pi))Ci � Li: (1)
This expected pro�tability formula allows us to distinguish four reasons why suppliers may be more
willing than banks to fund input purchases:
1. Collateral liquidation; CS > CB. In defaults, creditors are entitled to seize the �rm�s inputs and
other assets.5 A repossessed input may be worth more to the supplier than to the bank precisely
because the supplier is in the business of selling this good [Frank and Maksimovic (1998); and
Longhofer and Santos (2003)]. This comparative advantage is more pronounced for di¤erentiated
goods because these are often tailored to the needs of few customers.6 Knowing their customer
base and being able to reverse product specialization more cheaply, suppliers can re-sell the good
at higher price (collateral hypothesis). In contrast, sellers of standardized products and services do
not have a repossession advantage: Standardized products have a reference price that any lender
should be able to obtain, whereas services have no liquidation value.
2. Moral hazard; pS > pB. A supplier may be willing to extend (more) credit because the entre-
9

preneur is more likely to repay him than to repay the bank. Cunat (2007) argues that if the
supplier is vital for the entrepreneur�s future business due to the lack of alternative producers,
the entrepreneur has a stronger incentive to strategically default on the bank than on the supplier
(switching cost hypothesis). Since their goods are tailored to the needs of the buyer, suppliers
of di¤erentiated goods and services are more costly to replace. Indeed, using survey evidence,
Johnson, McMillan, and Woodru¤ (2002) show that �rms are more likely to switch suppliers
when they buy standardized o¤-the-shelf goods. When breaking up the relationships is costly,
customers are less tempted to default. Hence, suppliers of di¤erentiated products and services
should be more inclined to extend trade credit. In addition, suppliers may be less susceptible
to the risk of strategic default than banks because inputs are less liquid and thus less easily di-
verted than cash [Burkart and Ellingsen (2004)]. Accordingly, defaults related to the diversion of
corporate resources are less likely if the supplier grants the loan (diversion hypothesis). Survey
evidence shows that credit fraud is a concern for most �rms, especially when dealing with new
potential customers, as diversion is most often perpetrated by �ctitious entrepreneurs. However,
suppliers of services, such as energy and transportation, and producers of di¤erentiated goods,
such as technology, are signi�cantly less likely to be subject to this type of fraud than suppliers
of standardized goods, such as basic materials, and retailers and wholesalers [Credit Research
Foundation (2005)]. Since di¤erentiated products and (to a larger extent) services are harder to
divert than standardized products, they should be associated with more trade credit. Conversely,
retailers and wholesalers should supply less trade credit, as they trade highly liquid �nal products.
3. Informational advantage; AS > AB: Although banks gather information to assess the creditwor-
thiness of potential borrowers, a supplier may sometimes have access to superior information [Biais
10

and Gollier (1997); and Jain (2001)]. For instance, an informational advantage may arise because
the supplier and the entrepreneur operate in closely related lines of business. In such situations,
banks are reluctant to be exclusive lenders, because they face a lemon problem and would end up
with an adverse selection of borrowers. Banks may become more inclined to lend if they observe
that suppliers extend credit (information advantage hypothesis). Even though there exists no
formal model, it is possible that suppliers that entertain long-term relationships with �rms accu-
mulate private information about their customers similarly to banks. In this case, they should be
willing to lend more than less informed �nancial intermediaries and suppliers. Existing empirical
evidence shows that trade credit volume increases over the course of the relationship, with the
increase being concentrated in the �rst year [McMillan and Woodru¤ (1999); and Johnson, McMil-
lan, and Woodru¤ (2002)]. This suggests that suppliers learn most about the customers especially
during the �rst few months, in particular whether a customer is a �ctitious entrepreneur. This
is the most common concern of suppliers of highly liquid products [Credit Research Foundation
(2005)].
4. Imperfect competition; LS < LB. The supplier�s opportunity cost can sometimes be considerably
smaller than that of the bank, or equivalently, the forgone pro�ts from denying a loan can be
substantially higher. When an entrepreneur has exhausted his bank credit limit, the supplier may
�nd it pro�table to make additional sales on credit, as pointed out by Nadiri (1969). Complete
versions of this argument must also explain why the supplier does not simply selectively lower
the price to credit-constrained customers. After all, it is the additional sale that generates the
supplier�s pro�t, not the credit transaction as such. Smith (1987) and Brennan, Maksimovic,
and Zechner (1988) both introduce asymmetric information about customer characteristics to
11

explain why suppliers o¤er trade credit and early payment discounts. Customers reveal their credit
needs by choosing whether to take advantage of the early payment discounts (price discrimination
hypothesis). Trade credit may also be the result of market power on the customer side. Wilner
(2000) argues that a dependent supplier may help a customer with temporary �nancial problems
because his own prospects are positively related to those of the customer.
Our simple framework fails to accommodate some trade credit theories, notably explanations based
on product quality considerations [Smith (1987); Lee and Stowe (1993); and Long, Malitz, and Ravid
(1993)]. The supplier may have superior information about the input�s true market value L. To al-
leviate the customer�s fears of being cheated, the supplier may thus grant the customer an inspection
period before demanding payment. That is, o¤ering trade credit is a way to guarantee product quality
by enabling the buyer to return inferior goods without paying (quality guarantee hypothesis). As dif-
ferentiated products and services are less readily checked for quality than standardized goods, implicit
guarantees through trade credit should be more frequently o¤ered for di¤erentiated goods and services.
Relatedly, o¤ering trade credit can mitigate lender moral hazard. If the quality of the supplier�s input
directly a¤ects the customer�s commercial success, bundling input sale and credit increases the supplier�s
incentive to provide high quality, and thereby the customer�s probability of success is higher than if the
bank is the creditor.
1.2 Contract terms
Since maturity and cost of credit are integral parts of a supplier�s trade credit decision, observed contract
terms can help to evaluate the empirical relevance of di¤erent theories. However, many trade credit
models o¤er �at best �predictions for a subset of contract terms. Therefore, we resort to generic lending
models that address similar agency problems or directly apply insights from the �nancial contracting
12

literature. Before discussing the emerging implications for the contract terms, we describe the various
dimensions of trade credit contracts.
Suppose trade credit is given at date t0. The associated repayment D may, in principle, be any
function of the repayment date t > t0. However, in practice, trade credit contracts can almost always
be described as a step function:
D(t) =
8>><>>:D1 if t � t1;
D2 if t 2 (t1; t2];(2)
where t1 is the discount date and t2 is the due date. The interval (t0; t1] is the discount period and
the interval (t0; t2] is the payment period. When t1 = t2, there is no early payment discount, and when
t1 = t0, there is a cash discount.7 It is conventional that D2 = L and, if an early payment discount
is o¤ered, that D1 < L. Thus, the trade credit interest is positive only once the discount period has
elapsed. Furthermore, the buyer has little incentive to repay prior to the due date (end of the discount
period) as the repayment remains D2 (D1) over the entire period (t1; t2] ((0; t1] ).
The cost of trade credit is commonly computed assuming repayment at t2 and considering only �rms
that have been o¤ered early payment discounts. In this case, the annualized trade credit interest rate
for the period t2 � t1, call it rA, is given by:
rA =
�1 +
D2 �D1D1
� 365(t2�t1)
� 1: (3)
The cost of forgoing early payment discounts often implies a very high annualized interest rate.8
The actual cost is on average lower both because some �rms are not o¤ered early payment discounts
and because trade credit has zero interest during the discount period.
13

The interest rate on trade credit, like on any �nancial loan, ought to depend on the perceived
riskiness of the borrowers. The riskiness is a¤ected by the borrower�s creditworthiness and also by
the seller�s ability to ease �nancial market imperfections. In competitive markets, suppliers that have
superior information or that are able to obtain a higher liquidation value should be willing to o¤er
better terms than other lenders. Similarly, suppliers that are able to mitigate borrower moral hazard
should o¤er cheaper loans.9 Hence, product characteristics should be related to the cost of trade credit
in a similar fashion as is the willingness to sell on credit in the �rst place.10
To the extent that �rms have some �nancial slack or unused credit facilities enabling them to take
advantage of discount o¤ers, discounts are essentially price reductions. In non-competitive markets,
early payment discounts may be a way to price discriminate across customers with di¤erent propensity
to pay early and are therefore expected to be increasing in the seller�s market power.
A high interest rate on trade credit may also re�ect that the seller has high opportunity cost of funds.
If there are buyers whose �nancial condition is good relative to that of the seller, these buyers should be
induced to pay early using a cash discount. In this way, the contract avoids the ine¢ ciency associated
with a loan from a credit-constrained seller to an unconstrained buyer. However, in a competitive
market, sellers�desire for early repayment can justify only relatively small early payment discounts.
The reason is that receivables are usually quite easy for the seller to fund, and therefore do not crowd
out other investments to a great extent.11
Only some of the trade credit theories have direct implications for the determination of maturity
dates. The quality guarantee hypothesis ties maturity to the time it takes to inspect the good. The
collateral liquidation theory and the diversion theory tie maturity to the transformation time of the
input. Once the input has been transformed or sold, the supplier loses his comparative advantage relative
to other lenders. The supplier�s ability to repossess the good, crucial for the collateral liquidation theory,
14

also depends on legal rules. In the U.S., the Uniform Commercial Code gives the seller the right to
reclaim the good sold to an insolvent buyer within ten days from the delivery [Garvin (1996)]. Since
suppliers�potential liquidation advantage vanishes after ten days, the collateral hypothesis implies that
the maturity of trade credit should not be longer than that.
Finally, �nancial contracting theories emphasize that short(er) maturity is a means for lenders to
obtain control, thereby mitigating borrower moral hazard [e.g., Aghion and Bolton (1992)]. Accordingly,
suppliers that have a comparative advantage in controlling borrower opportunism should o¤er longer
payment and/or discount periods. Based on the discussion in the previous subsection, we thus expect
that suppliers of di¤erentiated products and services o¤er trade credit with longer maturity.
2. Data and Descriptive Statistics
2.1 Data sources
Our main data source is the 1998 National Survey of Small Business Finances (NSSBF), which was
conducted in 1999-2001 by the Board of Governors of the Federal Reserves System and the U.S. Small
Business Administration. The NSSBF provides a nationally representative sample of small non-�nancial,
non-farm U.S. businesses with less than 500 employees that were in operation as of December 1998.
The NSSBF contains �rm-level cross-sectional information that goes well beyond balance sheet items
and is regarded as the most detailed source of data available on small business �nance [Wolken (1998)].
Accordingly, it is frequently used to study the use and extension of trade credit [Elliehausen and Wolken
(1993); and Petersen and Rajan (1997)], the role of lending relationships and credit availability to small
businesses [Petersen and Rajan (1994, 1995); Berger and Udell (1995); and Berger, Miller, Petersen,
Rajan, and Stein (2005)]. From the NSSBF we obtain information on accounts payable, accounts
15

receivable, the purchases �nanced by trade credit and associated contract terms.
We match the NSSBF data with industry-speci�c information. From the NSSBF we can identify
industries at the two-digit SIC level. While this is obviously a coarse measure, we are not aware
of any other data source that includes detailed information on trade credit use and a �ner industry
disaggregation. We run a robustness check using the 2001 Compustat data, which allows us to identify
industries at the four-digit SIC level. Due to data limitations, this robustness test can be performed
only for the accounts receivable. In the rest of the analysis, the coarse two-digit industry classi�cation
is bound to lead to measurement errors, thereby biasing our estimates against �nding any results.
Consequently, our positive results can be downward-biased by measurement errors, while our negative
results should be interpreted more cautiously as the lack of statistical signi�cance may re�ect the fact
that our proxies are too noisy.
The nature of the product is the main characteristic along which we classify each industry. We follow
the product classi�cation of Rauch (1999), who distinguishes between standardized goods (goods with a
clear reference price listed in trade publications), and di¤erentiated goods (goods with multidimensional
characteristics and therefore highly heterogeneous prices). The latter are thought as more di¢ cult
to liquidate and more adapted to the needs of speci�c buyers. Remaining industries are classi�ed as
services. In the Appendix we provide the complete list assigning each industry to one of the three
product classes.
Each product category includes rather disparate industries. For instance, accountants and food
stores are both classi�ed as services. This heterogeneity should limit concerns that our product clas-
si�cation captures omitted industry characteristics, such as growth opportunities or di¤erences in the
relation between buyers and sellers.12
With this product classi�cation we can straightforwardly investigate whether the amount of trade
16

credit that a �rm extends depends on the nature of the product. To analyze the determinants of the
trade credit o¤ered to a given �rm, we need to identify the nature of the various inputs that the �rm
purchases. We construct proxies for the input characteristics with the help of the input-output matrices
from the U.S. Bureau of Economic Analysis. These matrices provide information on the amount of
di¤erent inputs required to produce one dollar of industry output. Using the SIC code, we combine
the input-output matrices with our product classi�cation, obtaining industry-speci�c measures for the
average use of inputs with di¤erent characteristics. That is, we construct proxies for the relative amount
of standardized products, di¤erentiated products, and services that a �rm uses as inputs. Importantly,
input-output matrices also allow us to identify the components of a purchase. For instance, if a �rm
purchases a car, the latter is classi�ed as input from the automotive industry, while the act of selling
the car is recorded as a service (retail) in the input-output matrices.
We control for industry di¤erences in market structure, which could be correlated with our proxies
for the nature of the good. To capture the extent of competition in the market in which a given
�rm �whether relatively large or small�operates, we use the market share of the eight largest �rms,
constructed by Pryor (2001). By combining the input-output matrices with Pryor�s concentration indices
in a similar way as above, we construct measures of market concentration in the input markets.
Finally, for information on contract terms from the suppliers�viewpoint, we rely on Ng, Smith, and
Smith (1999).13 They document the most common practices in di¤erent industries, notably the length
of the payment period and the provision of early payment discounts.
2.2 Sample �rms
The 1998 NSSBF covers 3,561 �rms. As the available information is not complete for all �rms, our �nal
sample includes 3,489 �rms. Additionally, we lose some observations when matching sample �rms with
17

product classi�cation and input information. For this reason, the number of observations in di¤erent
regressions varies according to the chosen speci�cations.
Table 1 summarizes the main characteristics of our sample. Panel A shows that �rms are relatively
young and small. They are, on average, younger than 15 years and have less than US$ 4 million in sales
and less than US$ 2 million in assets. A majority of �rms in our sample supply services. Among these,
slightly more than one-third are wholesalers and retailers.14
[Insert Table 1 here]
Even though the sample �rms are relatively small, there is considerable heterogeneity in size. Firms
in the lowest decile have less than US$ 3,600 in assets while those in the highest decile have more than
US$ 3.2 million in assets. The di¤erences in �rm size have a material impact on the extension of and
access to trade credit as our subsequent analysis shows. Using the 1993 NSSBF data, Berger, Miller,
Petersen, Rajan, and Stein (2005) document that di¤erences in size (and accounting records) also a¤ect
the nature of the bank-�rm relationship and the availability of bank credit.
A �rm�s willingness to extend trade credit, and its ability to obtain credit from suppliers depend on
its need for funds and access to other �nancing sources. Panel A of Table 1 also reports a number of
�rm characteristics capturing access to funds and proxies for access to (bank) credit. In addition, we
provide information on the �rms�relationship with their bank(s).
Panel B of Table 1 presents the industry-speci�c proxies that we have constructed. It suggests that
�rms producing standardized products operate in more concentrated industries and also use inputs from
relatively more concentrated industries. We present also our proxies for the average use of standardized,
di¤erentiated goods and services in di¤erent industries. While services are highly heterogeneous, the
services most commonly used by our sample �rms are electric utilities; gas production and distribution;
18

transportation; communications, except radio and TV; automotive repair and services; and insurance.
All these services have a relatively low resale value and are di¢ cult to replace either because of technology
reasons (as for utilities) or because they are tailored to the needs of the customer (as for automotive
repairs).
The input-output matrices are also useful because they include information on how much �rms in a
given industry sell (buy) to (from) other �rms in the same industry. The intra-industry trade captures
sales to customers and purchases from suppliers in related business lines. Arguably, �rms know more
about other �rms in related business lines. Hence, we use intra-industry trade as a proxy for the
informational advantage of suppliers.
2.3 Trade credit contracts
Since trade credit is the outcome of a bilateral relationship, we would ideally want to match suppliers
with their customers. As the data do not permit such a matching procedure, we study the roles of
supplier characteristics and customer characteristics separately. That is, we view the sample �rms �rst
as suppliers and analyze trade credit from the lenders�perspective. Thereafter, we consider the very
same �rms in their role as customers and investigate trade credit from the borrowers�perspective. We
have information on the contract terms for purchases but not for sales, so we can examine the contract
terms only from the customers�perspective.
2.3.1 Suppliers�perspective.
A supplier�s willingness to extend credit corresponds to the amount of sales for which he does not ask
payment at or before delivery. Since we do not observe how much each �rm sells on account, we use
receivables as a proxy for how much suppliers are willing to lend.15 The shortcoming of this proxy is that
19

receivables are simultaneously determined by the �rm�s willingness to sell on credit and by its customers�
demand for trade credit. Relatively small receivables may be a manifestation of a low willingness to sell
on credit or of a low demand for trade credit.
Due to this ambiguity, our �ndings may underestimate the importance of industry-speci�c charac-
teristics for the willingness to extend trade credit. If �rms in some industries are more willing to lend,
banks may also be willing to do so. Having access to more bank credit, these �rms may rely less on
trade credit �nancing, and their suppliers may have less receivables.
Another source of bias stems from the fact that the demand for trade credit facing a �rm is a¤ected
by a variety of customer characteristics that we do not observe. If customers with di¤erent charac-
teristics were equally distributed across suppliers, each supplier�s receivables would be equally a¤ected
by the �rm-speci�c component of trade credit demand. However, it seems more plausible that less
�nancially constrained and more reputable buyers match with comparable suppliers. Hence, our proxy
may underestimate the importance of trade credit.
Panel C of Table 1 shows that �rms in industries that produce di¤erent types of goods also di¤er
in the extent to which they provide trade credit. Thus, it appears that our product classi�cation in
standardized, di¤erentiated, and services captures relevant di¤erences. For instance, service �rms have
a lower accounts receivable to sales ratio. Provided that these variations persist after controlling for
�rm characteristics �which may not be the case as �rms in the service industries appear systematically
smaller �this would indicate that the collateral value of the product matters for the �rms�willingness
to sell on credit. Closer scrutiny of the data suggests that service �rms have very di¤erent attitudes
in providing trade credit. In particular, �rms providing communication services or transportation have
a receivables to sales ratio that is comparable to the average of �rms supplying di¤erentiate products.
The ratio is much lower for retailers and wholesalers.
20

Panel C of Table 1 also includes the terms of credit o¤ered by suppliers in di¤erent industries, taken
from Ng, Smith, and Smith (1999). Ng, Smith, and Smith report wide variations across industries in
trade credit terms o¤ered but little variations within industries: Firms in some industries tend not to
o¤er early payment discounts, whereas �rms in other industries o¤er a choice between net terms and
discounts. Also the quoted discount terms vary little within industries but considerably across industries
where discounts are common. To the extent that these �ndings generalize to our sample (the rest of
our analysis casts some doubt on this), we analyze how well the nature of the product captures the
variation in the contract terms o¤ered by suppliers.
Panel C of Table 1 shows that on average providers of di¤erentiated products extend trade credit for
thirty days. This is well beyond the ten days interval in which they are able to repossess the good and
casts doubts on the hypothesis that the advantage of these suppliers in extending credit derives from
being able to redeploy the good more e¢ ciently. Moreover, service �rms appear to grant their customers
an almost equally long payment period as producers of di¤erentiated goods and are less likely to o¤er
discounts. Contrary to the descriptive statistics on receivables, this suggests that service suppliers may
be more inclined to provide trade credit than suppliers in other industries. In general, it illustrates that
analyzing contract terms as well as volume allows for a more complete interpretation of the evidence.
2.3.2 Buyers�perspective
Firms participating in the NSSBF survey not only report their receivables but are also asked the
percentage of purchases o¤ered on account. Like Petersen and Rajan (1997), we use the percentage of
input purchases on account to identify the quantity of trade credit o¤ered to a �rm. As there is usually
some interest-free period, a �rm�s purchases on account are indeed largely supply driven. Only when a
discount is o¤ered and the discount date is reached, do supply e¤ects mingle with demand e¤ects. The
21

distribution of purchases on account indicates large heterogeneity in the supply of trade credit to our
sample �rms. For instance, more than 35% of all �rms report that they never purchase on account,
whereas almost 20% make all their purchases on account.
Since purchases on account is a �ow variable, it is still not a clean measure of the supply of trade
credit, unless it is linked with the purchasing frequency and the repayment period. The NSSBF sur-
vey only contains information on the percentage of inputs that �rms purchase on account during the
entire year of 1998, but not on the purchasing or repayment patterns. We mitigate this problem by
incorporating information on how trade credit is o¤ered. The maturity and the cost of using trade
credit a¤ect the frequency of purchases and repayment, and therefore the extent to which purchases on
account translates into actual trade credit supply.
Panel D of Table 1 reveals that the amount of trade credit o¤ered to our sample �rms di¤ers
across industries. Service �rms in particular seem to receive less trade credit. In addition, trade credit
appears pervasive even in the early stages of the life of a �rm, when relationships with suppliers are not
yet established: Firms younger than one year already make 30% of their purchases on account. This
percentage increases until the �rm becomes �ve years old and remains stable thereafter.
Firms also report the terms at which their suppliers o¤er trade credit. This enables us to study the
terms of trade credit from the buyer�s point of view. The collected information includes the percentage
of suppliers o¤ering cash discounts, and, for the most important supplier, the due date, the size of the
early payment discount, the duration of the discount period and the size of the late payment penalty.
Additionally, �rms are asked whether they used cash discounts and whether they paid after the due
date.
When the seller o¤ers net terms only, trade credit duration is simply the time between the billing
date and the due date. If the seller o¤ers a discount, the discount period is a measure of trade credit
22

duration as well.
The NSSBF survey includes data on due dates only for the most important supplier of each �rm.
Moreover, this information is not reported in terms of number of days but in terms of 11 di¤erent
intervals, ranging from immediate payment, payment between one and seven days, ..., up to payment
more than 90 days after delivery. Accordingly, due dates in our analysis do not refer to the actual
number of days but to the mean of each interval in which the bill of the most important supplier is due.
Panel D of Table 1 shows that, on average, trade credit is due in about 25 days, with buyers of
standardized inputs being granted longer payment periods. More than 70% of the �rms report the due
dates by their most important supplier in the interval including 30 days. This is consistent with earlier
studies documenting the wide spread use of a 30 days payment period. Among the remaining �rms,
shorter payment periods are prevalent, though periods of more than two months also occur.
Panel D of Table 1 also shows that �rms making purchases on account are on average o¤ered a
discount by 20% of the suppliers. Only 5% of these �rms receive discounts by all their suppliers. Even
more strikingly, 50% of the most important suppliers do not o¤er discounts. This variation may be
caused by di¤erences in the composition of inputs employed: Some �rms may use more inputs from
industries where discounts are standard practice, others may purchase more inputs that are only sold on
net terms. Alternatively, the variation may be due to individual buyer characteristics. In the empirical
analysis, we investigate the latter hypothesis.
We also observe the discount period that the most important supplier o¤ers to our sample �rms.
Among the �rms whose most important supplier o¤ers an early payment discount, the average discount
period is 14 days. A vast majority (80%) obtains a discount when paying within ten days. This is again
consistent with the �ndings of Ng, Smith, and Smith (1999). Like the other contract terms, the length
of the discount period, however, is not an entirely rigid parameter. For the remaining �rms, longer
23

discount periods are more common than shorter.
For the subsample of �rms o¤ered discounts from their most important supplier, the most common
discount term practice is 2% discount for payment within ten days, as noted in previous studies [Petersen
and Rajan (1995); and Ng, Smith, and Smith (1998)]. However, 10% of �rms receive discounts of less
that 1% or more than 5%. We consider to what extent these di¤erences may be related to longer
maturity by taking the ratio of the discount size to the di¤erence between the due date and the last
day of the discount period to obtain the discount per day. Using this correction, we �nd even larger
variation in discount sizes.
To compare the cost of trade credit with the cost of other sources of funding, we calculate a proxy
for the annualized cost of trade credit similarly to Petersen and Rajan (1994), but take into account
that trade credit typically has some interest-free period (discount period). Because of this correction,
we �nd that the average annualized trade credit interest rate is 28% for �rms receiving early payment
discounts from their most important supplier. A quarter of the �rms can borrow from suppliers at an
interest rate that is less than 13% and not signi�cantly larger than the bank interest rate for our sample
�rms. By contrast, another quarter of �rms indeed borrows from suppliers at a rate above 40%. If we
include in the computation �rms that are not o¤ered discounts, the median �rm receives trade credit
at zero cost.
These estimates are subject to the quali�cation that the cost of trade credit could be embedded
in the price of the good. Like other empirical studies, we do not observe input prices. However, if a
supplier o¤ers the buyer to pay either a lower price immediately or a higher price later, this should
appear in the survey as an early payment discount with no discount period. Hence, even when trade
credit comes with no discounts, its cost may not be concealed by the price of the good. Moreover, in
the empirical analysis, we show that, within an industry, �rms with higher payables do not pay more
24

for their inputs.
These �ndings challenge the common wisdom that trade credit is necessarily an expensive source
of �nance and are consistent with growing anecdotal evidence that attributes the good performance of
successful companies to cheap trade credit.16 More relevant for small �rms, the National Association
of Credit Management estimates that the e¤ective rates behind early payment discounts can be as low
as 3% [Miwa and Ramseyer (2002)].
In order to enforce their due dates, suppliers may impose a penalty for late payment even if they
do not allow purchases on account: More than seventy% of the sample �rms face penalties for late
payment. Among the �rms that are allowed to make purchases on account, only 50% face penalties for
late payment. Penalties are typically around 1% of the purchasing price.
Panel E of Table 1 shows that the correlations between the various contract terms o¤ered are low
and only a few are statistically signi�cant at the 10% level. Rather intuitively, purchases on account
are positively related to the number of suppliers o¤ering to sell on account and the percentage of
suppliers o¤ering a discount. Similarly, �rms are o¤ered to make more purchases on account when the
late payment penalty is lower; both features indicate that the supplier is relatively unconcerned about
default. Discount period and due date, the two measures of trade credit duration, are positively related
as are the di¤erent measures of the e¤ective price, such as the size of the discount and the late payment
penalty. Furthermore, the maturity of trade credit is positively related to the e¤ective price measures,
re�ecting the suppliers�higher opportunity cost of lending for longer periods.
Notwithstanding the low correlation, the various contract characteristics are clearly determined
simultaneously at the time the credit is o¤ered to a �rm. We lack, however, comprehensive theories
o¤ering predictions on how the di¤erent contract characteristics, such as volume and late payment
penalty or maturity, are interrelated (e.g., whether the volume determines the late payment penalty or
25

vice versa). Therefore, we simply consider reduced form equations in which contract terms and volume
are posited to depend on �rm and industry characteristics.17
2.3.3 The use of trade credit.
A �rm�s outstanding debt to its suppliers depends on the extent to which suppliers are willing to sell
on account and on the average e¤ective payment period. The e¤ective payment period depends in
turn both on the terms of the suppliers�contract and on the �rm�s behavior. Contracts without early
payment discounts and with long payment periods induce larger payables, but payables can also be
large due to the �rm�s decisions to forego discounts and to pay after the due date.
Panel F of Table 1 shows that more than half of our sample �rms use trade credit. Interestingly, the
actual maturity of trade credit, proxied by the ratio of payables to the per day cost of doing business
(payables�turnover), is longer than the contractual maturity.18 This is consistent with the fact that
almost half of the sample �rms paid at least one of their bills after the due date, and that the fraction
of input purchases paid late exceeds 10%. The use of discounts is negatively related to the use of trade
credit as a source of funding, suggesting that some contractual provisions a¤ect behavior.
In the empirical analysis, we relate payables and repayment behavior to �rm characteristics that
a¤ect the demand for trade credit and to the contract terms o¤ered by the suppliers.
3. Results on Trade Credit Volume
We measure the volume of trade credit from the supplier�s and the buyer�s side, respectively, by using
(1) the ratio of receivables to sales (a proxy for the suppliers�willingness to extend trade credit to all
customers), and (2) the percentage of purchases on account by a given �rm (capturing the supply of
trade credit to a given �rm from all suppliers). We relate our two proxies for the volume of trade credit
26

to the nature of the transacted product in di¤erent industries. In the case of receivables, the output is
classi�ed as standardized good, di¤erentiated good, or services. In the case of purchases on account,
the nature of the inputs is de�ned by the relative amounts of standardized goods, di¤erentiated goods,
and services that �rms in these industries on average employ in production. We control for proxies of
�rms�access to internal and external funds, creditworthiness, and industrial structure.19
Panels A and B of Table 2 present our results for the ratio of accounts receivable to sales and the
purchases on account respectively. In both cases, the �rst column presents the regression including
industry �xed e¤ects for comparison with the following columns where we include our industry-speci�c
variables instead of industry �xed e¤ects.20 In all cases, errors are clustered at the industry level, since
a large part of the evidence derives from cross-industry di¤erences. In what follows, we present the
main �ndings sorted by the di¤erent theories.
[Insert Table 2 here]
3.1 Collateral hypothesis
Panel A of Table 2 (Column 2) shows that �rms producing di¤erentiated products are more willing to
supply trade credit as they have a higher ratio of receivables to sales. This is unlikely to depend on a
greater availability of funds in these industries as we control for a number of variables that capture
access to internal and external funds. Additionally, the result is robust to using the 2001 Compustat
data (Column 3), which allow for the �ner four-digit SIC disaggregation and include much larger �rms
(with an average total assets of over US$ 5 million). The consistency of the results for the receivables
across the two data sets increases our con�dence that the subsequent �ndings are unlikely to be driven
by the coarse two-digit SIC classi�cation.
Panel B of Table 2 con�rms this �nding from the buyer�s point of view. Firms that buy a larger
27

fraction of di¤erentiated products make more purchases on account (Column 2). Additionally, �rms
buying a larger fraction of di¤erentiated products are more likely to be o¤ered trade credit (Column 4).
These results are again unlikely to be driven by systematic industry di¤erences in �rm creditworthiness
as we control for a large range of �rm characteristics. Since di¤erentiated goods are worth more in the
hands of the original supplier, this evidence is consonant with the collateral liquidation hypothesis.
However, other �ndings are di¢ cult to reconcile with the collateral hypothesis. First, we �nd that
service suppliers are equally likely as suppliers of di¤erentiated products to o¤er trade credit, once we
control for debt capacity. (In the descriptive statistics, this relationship was obscured by the fact that
service �rms are on average smaller and thus have a lower debt capacity.21) This �nding cannot be
explained by the collateral hypothesis because services have no collateral value. Second, the collateral
hypothesis implies that suppliers of di¤erentiated inputs should lend relatively more when the probability
of having to redeploy the input is higher. Yet, Panel B (Column 3) shows that riskier �rms do not receive
more trade credit when they buy a larger proportion of di¤erentiated products. Hence, di¤erentiated
product suppliers do not appear more inclined to lend to �rms with a high likelihood of default than
other suppliers. Quite to the contrary, the estimates in Panel B (Column 7) suggests that �rms buying
more di¤erentiated products are more likely to be denied credit because of suppliers�concerns about
their repayment ability. Finally, companies that have established a lien on their assets in order to obtain
bank loans appear to be o¤ered more trade credit. In this case, suppliers are more likely to be junior
to other creditors even during the �rst ten days after delivery. Hence, their comparative advantage in
redeploying the good becomes futile, and they should lend less not more. These �ndings together with
the previously mentioned limited ability of suppliers to repossess the good cast doubts on the relevance
of the collateral hypothesis.
28

3.2 Moral hazard hypotheses
An alternative reason why suppliers of di¤erentiated goods and services o¤er more trade credit is their
comparative advantage in mitigating buyer moral hazard. The source of this advantage may be either
the buyer�s cost of switching suppliers or the di¢ culty of diverting inputs.
Theories based on borrower moral hazard can explain why both suppliers of di¤erentiated products
and of services are inclined to o¤er more trade credit, as found in Panel A of Table 2. Defaulting
on these suppliers may entail large costs, as the suppliers are di¢ cult to replace, or low bene�ts, as
the inputs have low diversion value. Borrower moral hazard can also explain the considerably lower
receivables in retail and wholesale, as these industries trade highly liquid �nal products, which are easy
to divert.
Panel B of Table 2, however, provides con�icting evidence. Firms that buy relatively more services
receive less trade credit from their suppliers (Columns 2 and 3) and are also less likely to use trade
credit at all (Column 4). The low supply of trade credit to �rms buying more services may be reconciled
with the ample lending by service suppliers if the latter cannot �nance the extension of more trade
credit due to their small size. Indeed, their propensity to provide trade credit is as high as that of
producers of di¤erentiated goods only after controlling for size (Table 2, Panel A). Also, the Compustat
sample �rms support the notion that limited access to external funds prevents small service �rms from
providing more trade credit. Being much larger than NSSBF �rms, Compustat �rms are less likely to
be credit constrained. Contrary to NSSBF �rms, the service suppliers in the Compustat sample have
on average a substantially higher receivables to sales ratio (0.58) than suppliers of standardized (0.23)
and di¤erentiated goods (0.17).
While �rms buying more services are more rarely allowed to make purchases on account, they are
29

less often denied trade credit (Panel B, Column 5, Table 2). This suggests that these �rms may be more
likely to have access to trade credit when they need it. We explore this possibility by considering the
reasons why �rms are denied trade credit. We �nd that service providers do not deny credit because
of concerns about customers� repayment ability, while providers of di¤erentiated goods do, as noted
before.
It is di¢ cult to further evaluate why suppliers may be able to mitigate borrower moral hazard
because we lack information about the length of the �rms�relationships with their suppliers. If older
�rms have established relationships, the switching cost hypothesis suggests that trade credit volumes
should vary positively with age. We �nd no such correlation for receivable in Panel A of Table 2.
Also, neither suppliers of di¤erentiated goods nor of services deny trade credit because of the lack of
established relationships (Panel B of Table 2). Yet, older �rms seem to receive more trade credit. To
the extent that we already capture �rm creditworthiness with the �rm credit score and the access to
bank credit, this is consistent with the notion that relationships improve access to trade credit.
3.3 Information advantage hypothesis
We attempt to test the information advantage hypothesis by including variables re�ecting possible
reasons why suppliers know more about their customers than other lenders. First, suppliers in related
business lines may have an information advantage, which we proxy with the share of intra-industry
trade. This variable turns out not to be signi�cant (Panel A, Column 4, Table 2). Similarly, �rms
buying more from �rms in related business lines do not appear to receive more trade credit (results
not reported). Second, suppliers may know more about nearby customers. Yet, we �nd that �rms
whose sales are concentrated in the area of their main o¢ ce do not provide more trade credit (Table 2,
Panel A). Third, producing the input may involve learning about the customer, notably when providing
30

information-related services. To capture this, we include in the receivable equation a dummy that
equals one if the �rm belongs to an information-related service sector (business services, legal services,
commercial engineering, accounting, and research). This dummy is not signi�cant at conventional
levels (unreported estimates), suggesting that �rms in information-related service industries do not
o¤er more trade credit. This result also indicates that service providers are unlikely to sell more on
credit because they have better information about customers�creditworthiness than do other lenders.
However, retailers and wholesalers are allowed to make more purchases on account. To the extent that
they are likely to interact more frequently with their suppliers, this is consistent with the interpretation
that their suppliers have superior information.
While this evidence o¤ers little support for the information advantage hypothesis, it is based on
tests of joint hypotheses: the source(s) of the suppliers�information advantage and the implications in
terms of trade credit supply. Consequently, our tests are not valid if suppliers know more about their
customers for other reasons, such as repeated business interactions or purchase volumes. Furthermore,
suppliers�information advantage, may be customer, not industry speci�c.
To further evaluate the information advantage hypothesis, we explore its implications for the avail-
ability of bank credit. Bias and Gollier (1997) argue that the extension of trade credit by suppliers with
private information constitutes a credible signal about the customer�s creditworthiness. Observing this
signal, banks should be more inclined to lend without comprehensive information about the borrower.
Based on the available evidence in the banking literature [Degryse and Ongena (2004)], our presump-
tion is that �rms borrowing from distant banks for short periods have arm�s length relations with their
lenders that consequently gather only limited information about their businesses. Firms that are of-
fered trade credit, as captured by the dummy trade credit usage, have, on average, shorter relations
with their banks and rely on more distant lenders (Table 2, Panel C). Similarly, we use the number of
31

banks from which a �rm borrows as an inverse measure of the banks�information production.22 The
estimates in Panel C of Table 2 show that �rms that are o¤ered trade credit have a larger number of
banks. Additionally, �rms that receive trade credit pay lower fees for obtaining a bank loan suggesting
that banks are more inclined to extend credit to these �rms. Other loan characteristics, such as the
interest rate on the loan and its maturity do not seem to be related to the supplier�s decision to extend
trade credit.
These �ndings are consistent with the notion that trade credit reveals favorable information to
other lenders. They cannot be driven by the fact that some �rms with large demand for external funds
borrow from many banks, because in all regressions we include controls for the �rm�s credit line, its other
�nancial loans, and its size. While we control for creditworthiness, we cannot exclude the possibility
that there is simply more public information available about these �rms.
Whether suppliers have an informational advantage or not, the �rms�success in approaching less
informed banks suggests that suppliers do not enjoy an informational monopoly. Hence, any information
that some suppliers have must be available to other suppliers as well as banks. This leads us to conjecture
that any trading relationships between buyer and supplier arise because of high switching costs and not
because of inside information, as is believed to be the case for bank customer relationships [Sharpe
(1990); and Rajan (1992)].
3.4 Further �ndings
In this subsection, we discuss (1) to what extent our estimates are consistent with other trade credit
theories and (2) to what extent these theories could provide alternative explanations for the previous
�ndings.
A common alternative explanation of trade credit is that suppliers sell on credit as a guarantee of
32

high product quality. Accordingly, more reputable or established �rms need to o¤er less trade credit,
because their reputation vouches for the quality of their product [Long, Malitz and Ravid (1993)]. Our
estimates contradict this notion: Large �rms o¤er more trade credit, as predicted by �nancial theories
of trade credit. Additionally, while there is some (weak) evidence that young �rms provide more trade
credit, small and young �rms providing services or di¤erentiated products do not appear to o¤er more
trade credit than more established companies (estimates not reported). In our sample, young and small
�rms behave similarly.
A related concern is that services may be provided on a long-term contract basis. In this case, service
�rms�higher propensity to provide trade credit could simply re�ect the practice of reporting amounts
owed for an on-going service as trade credit, even if the service is paid in full once it is completed. As we
have no information on how services are provided, we cannot fully disregard this possibility. However,
long-term contracts cannot account for the result that �rms supplying di¤erentiated product also extend
more trade credit. In addition, Section 5 will show that service suppliers do not o¤er longer payment
periods (the e¤ect of buying more services on the due date is statistically insigni�cant). Hence, our
results are unlikely to depend on the fact that payments are made at the end of long-term contracts.
Our results do not depend on industry concentration in the suppliers�market. Panel A of Table 2
shows that the level of industry concentration in the product markets is not related to the receivables
to sales ratio.23 The result could be due to a poor match between the two-digit industry concentration
measure and actual market concentration, or even to a weak link between actual concentration and
gross margins. Yet, the two-digit industry concentration measure is positively related to the industry�s
propensity to o¤er early payment discounts (the correlation coe¢ cient is 35%). This is consistent with
the notion that suppliers in concentrated industries attempt to price discriminate. Discounts in turn
may account for the weak link between concentration and receivables. Firms in concentrated industries
33

may give trade credit, but also encourage early repayment by o¤ering discounts. In line with this
reasoning, we �nd that industry payment practices matter for receivables (estimates not reported). In
particular, �rms o¤ering discounts (dummy Two-Parts) have lower receivables to sales ratios. Together,
these �ndings suggest that price discrimination may be a signi�cant cause of expensive trade credit.
It is important to note that we can no longer identify the e¤ect of product characteristics once we
include industry payment practices. Product characteristics and payment practices are highly correlated
since our measures vary across industries but not across �rms within industries. As documented in Panel
C of Table 1, suppliers of services, standardized and di¤erentiated products o¤er di¤erent credit terms
to their customers. In particular, �rms that are more prone to extend trade credit �namely, �rms in
the services and di¤erentiated good industries �do so by o¤ering longer payment periods and fewer
discounts, thereby enabling their customers to use trade credit �nance to a larger extent and at lower
cost. The example illustrates the bene�t from looking jointly at all trade credit terms when explaining
trade credit. We return to this topic in the next section.
Unsurprisingly, the �rm-speci�c controls demonstrate that �rms with better access to �nance (large
�rms and �rms with a higher ratio of loans to sales) have a higher receivables to sales ratio and that
riskier �rms receive less trade credit. Interestingly, suppliers are more likely to deny trade credit to
more pro�table �rms, which are also less likely to be o¤ered trade credit. A possible interpretation
is that sellers have an incentive to lend to buyers with �nancial problems that are important for their
business, as proposed by Wilner (2001). However, we do not �nd that this tendency is more accentuated
for suppliers of services and di¤erentiated products that may be more dependent on their customers.
Finally, we like to point out that large �rms, �rms operating in concentrated industries and, es-
pecially, �rms with many customers make signi�cantly more purchases on account. These �ndings
indicate that suppliers are more generous in providing trade credit to customers that have more bar-
34

gaining power. A challenge for future theoretical work is to explain why sellers do not simply lower the
price to these customers instead.
4. Contract Terms
As argued earlier, a supplier�s willingness to extend trade credit is re�ected not only in the amount
of trade credit, but also in the contract terms. To understand how the contract terms are related to
our variables of interest, we need to consider that contract terms are only observed for the subset of
�rms that are o¤ered trade credit. To correct for the sample selection, we use a two-step Heckman
procedure. In the �rst stage, we estimate the probability that a �rm is o¤ered to make purchases on
account including the same explanatory variables that we include in Panel B of Table 2 (Column 2).
We then include the Mill ratio in the second stage (estimates not reported). Table 3 documents our
results for the various contract terms from the buyer�s perspective.24
[Insert table 3 here]
We �nd that �rms buying a larger proportion of services have a smaller proportion of suppliers
o¤ering discounts (Column 1, Table 3), are less likely to be o¤ered discounts by their most important
supplier (Column 2), are o¤ered smaller discounts, conditionally on receiving discounts (Column 3),
and have longer discount periods (Column 6). These �ndings suggest that �rms buying more services
are given weaker incentives for early repayment. To the extent that input prices are not higher when
trade credit is cheaper, the results also indicate that �rms buying more services receive trade credit at
lower cost, although the coe¢ cient for the cost of trade credit is not signi�cant at conventional levels
(Column 4). Service suppliers are smaller and believed to have lower debt capacity. Hence, the �ndings
are unlikely to be driven by better �nancial health.25 It seems more plausible that service suppliers
35

have an advantage in controlling borrower opportunism. This may be due to service producers being
harder to replace or services being more di¢ cult to divert.
Retailers and wholesalers face stronger incentives for early repayment (Columns 1, 2, and 3 of Table
3) and shorter discount periods (Column 6), and wholesalers face larger penalties for late payment.
Since wholesalers and retailers trade highly liquid �nal products, these �ndings suggest that the ability
of mitigating borrower opportunism contributes to shape trade credit contracts. More surprisingly,
retail �rms are o¤ered longer payment periods than other buyers (Column 5). This may depend on the
fact that these buyers interact frequently with their suppliers that therefore have more information and
may be willing to o¤er better terms.
Firms buying more di¤erentiated goods receive trade credit at a higher cost (Column 4, Table 3).
This is at odds with the collateral hypothesis because the higher liquidation value that suppliers of
di¤erentiated goods can obtain ought to translate in lower trade credit cost. Also some of the control
variables provide interesting evidence. First, �rms that have pledged �rm assets to guarantee their
�nancial loans obtain cheaper trade credit for longer periods. Since suppliers cannot repossess goods on
which other lenders have a lien, this evidence is in direct contrast to the collateral hypothesis. Second,
payment periods (Column 6) as well as the length of discount periods (Column 7) are positively related
to the ratio of inventories to total assets. This �nding is consistent with the collateral hypothesis
provided that inventories can be repossessed by the original supplier. Hence, the discount (payment)
period must be at most 10 days and the inputs should remain untrasformed. To the extent that inputs
are untransformed, this �nding is also consistent with the diversion hypothesis, which also ties maturity
to the time it takes to convert the input, but not to the 10-days legal constraint. Interestingly, 90%
of the �rms that buy predominantly di¤erentiated goods have a payment period longer than 10 days.
Additionally, more than half of the �rms whose inputs are predominantly di¤erentiated goods have a
36

discount period longer than 10 days. This suggests that even if the collateral hypothesis may have some
scope to explain trade credit, at least in the U.S. it cannot be the primary rationale for the existence
of trade credit.
We �nd no evidence that buying inputs from more concentrated industries is related to higher
discounts. Perhaps, price discrimination is practiced only by relatively large �rms, like the ones surveyed
by Ng, Smith, and Smith (1999), which are indeed more likely to o¤er discounts when they operate in
more concentrated industries.
The relation between contract terms and �rm characteristics reveals some surprising patterns. Larger
�rms receive larger discounts, but for shorter periods. It seems that discounts are aimed to encourage
early payment by those customers that have �nancial slack. Suppliers in need of cash would thus target
early payment discount o¤ers at larger �rms with better access to funds. To the extent that larger
�rms have the �nancial slack to take advantage of discount o¤ers, these discounts are essentially price
reductions. Alternatively, discounts may represent favorable treatment due to bargaining power. The
latter interpretation is consistent with the fact that larger �rms are charged smaller penalties for late
payment (Column 5, Table 3) and �rms with many suppliers are more likely to be o¤ered discounts
(Column 2). We also observe that riskier �rms are less likely to be o¤ered discounts (Column 2)
and are o¤ered smaller discounts (Column 3) as the coe¢ cient of Credit Risk is consistently negative
and signi�cant. Possibly, suppliers anticipate that inducing early repayment from �rms with �nancial
di¢ culties may be di¢ cult or impossible. Hence, they do not o¤er discounts. The absence of a risk
premium may also be interpreted along the lines of Wilner (2000), who argues that suppliers subsidize
customers in �nancial distress.
[Insert table 4 here]
37

To evaluate the full cost of trade credit,we check whether more trade credit is associated with higher
input prices (Column 1, Table 4). As a proxy for a �rm�s average input prices, we use the cost of inputs
de�ned as the ratio between the cost of doing business and sales.26 We explore whether the cost of
inputs is positively related to payables�turnover, which measures the actual use of trade credit, after
controlling for total assets, age, number of employees, proxies for �rm access to �nancial loans, and
industry �xed e¤ects. Strikingly, we �nd that �rms funding more of their purchases with trade credit
have lower, not higher cost of inputs. The e¤ect is similar if we use the 2001 Compustat sample, where
we observe the cost of goods sold, but we can only control for total assets, leverage, and industry e¤ects
(not reported).
Overall, our analysis suggests that discounts do not re�ect �rm risk and that early payment discounts
overstate the cost of trade credit. Moreover, our results also challenge the view that contract terms
vary across industries but not within industries27 and suggest that they are an important component
of the suppliers�decision to o¤er trade credit.
5. The Use of Trade Credit
A �rm�s stock of payables as well as the repayment behavior depend both on �rm characteristics that
a¤ect the demand for trade credit and on the contract terms o¤ered by the suppliers. As before,
we proxy for the �rms�demand for trade credit using assets, age, the pro�t to sales ratio, and other
variables capturing access to �nancial loans. In accordance with the theoretical framework and our
interpretation of the previous results, we assume that the contract terms are set by suppliers. We thus
treat the percentage of purchases on account and the other contract terms as exogenous with respect to
the �rm�s choice of trade credit use and repayment behavior.28 In the regressions in Table 4, we include
38
those contract characteristics that we believe to be the most salient for understanding trade debt and
the �rms�propensity to forgo discounts or to pay late. In other speci�cations that we do not report, we
include di¤erent and less judiciously chosen contract characteristics. Their coe¢ cients are insigni�cant.
The extent to which �rms use trade credit depends on the purchases that they are able to make
on account (Column 2, Table 4). Other contract characteristics, including the payment period and the
discount size (estimates not reported), do not appear to have a signi�cant impact on the payables to
assets ratio. Consistent with previous studies, we �nd that smaller �rms use more trade credit.
Firms�repayment behavior reveals several noteworthy patterns. Firms that fear to be denied other
loans and �rms with �nancial problems pay a larger fraction of their trade credit late and are more likely
to pay after the due date (Columns 3 and 4, Table 4). More surprisingly, large �rms and �rms with
longer bank relationships, which arguably have easier access to bank credit, are more likely to pay late.
One possible explanation is that suppliers do not enforce late penalties for �rms with good payment
records and for large �rms. Although we are not aware of any direct evidence, such a size bias in the
enforcement of penalties seems likely in view of anecdotal evidence that many suppliers accept, from
customers with bargaining power, discounted payments after the discount period has elapsed [Smith
(1987); and Ng, Smith, and Smith (1999)]. Weak contract enforcement may also explain why higher
penalties do not signi�cantly induce more timely repayment or why �rms with a longer payment period
are more likely to pay after the due date. Indeed, the actual trade credit maturity, proxied by the
payables�turnover, increases with both contractual maturity and penalties (Column 5). This suggests
that suppliers demand penalties when customers are extremely slow in their payments.
Column 6 of Table 4 documents how �rms respond to �nancial incentives. A larger discount in-
creases the likelihood that a �rm takes advantage of the discount�s o¤er. Firms with longer bank-�rm
relationships are more likely to take advantage of discounts. Similarly, �rms are more likely to forgo
39

discounts if they fear being denied bank loans or have �nancial problems. Not surprisingly, we �nd
that these �rms fund their purchases with trade credit for longer periods. This is again consistent with
Petersen and Rajan (1994), who �nd that �rms with less access to bank loans are less likely to take
advantage of early payment discounts. In addition to being more prone to pay late, large �rms are also
less likely to take advantage of early payment discounts. Given that large �rms ought to have better
access to other sources of credit, a possible explanation is again that suppliers concede discounts to
large �rms even after the discount period has elapsed.
To summarize, �rms appear to respond to �nancial incentives implicit in the contract terms. They
take cheap trade credit when they can get it and utilize costly trade credit when they must. However,
some �rms appear to be able to take advantage of their suppliers beyond the contractual agreement by
paying late or by unilaterally extending the discount period.
6. Conclusions
We relate trade credit volumes and contract terms to di¤erent product characteristics and aspects of
bank-�rm relationships. Overall, the evidence seems to favor theories based on borrower opportunism
and suppliers� informational advantage. Some of our �ndings challenge the common view that trade
credit is primarily a last resort for �rms that are running out of bank credit. First, trade credit seems
to facilitate �nancing by uninformed lenders. Second, a majority of the �rms in our sample appears to
receive cheap trade credit. Third, �rm-speci�c characteristics, possibly capturing customer bargaining
power, a¤ect contract terms (even for �rms within the same industry), questioning the notion that
contract terms vary across industries but not within industries.
Our results also indicate paths for future theoretical research. Suppliers appear to carefully choose
40

contract terms to give incentives to �rms. Current theories, however, tend to emphasize only one or
two. For example, the price discrimination theory deals only with early payment discounts. A natural
ambition for future work is to develop models that relate suppliers�reasons for o¤ering trade credit to
the type of optimal contract they o¤er. Such models would provide more stringent testable implications
concerning the relationships between contract terms, credit volumes, and �rm characteristics that we
have documented here.
41

References
Aghion, P., and P. Bolton. 1992. An Incomplete Contracts Approach to Financial Contracting. Review
of Economic Studies, 59:473-494.
Berger, A. N., N. H. Miller, M. Petersen, R. G. Rajan, and J. C. Stein. 2005. Does Function Follow
Organizational Form? Evidence from the Lending Practices of Large and Small Banks. Journal of
Financial Economics, 76:237�269.
Berger, A. N., and G. F. Udell. 1995. Relationship Lending and Lines of Credit in Small Firm Finance.
Journal of Business, 68:351�381.
Biais, B., and C. Gollier. 1997. Trade Credit and Credit Rationing. Review of Financial Studies,
10:903�937.
Brennan, M. J., V. Maksimovic, and J. Zechner. 1988. Vendor Financing. Journal of Finance, 43:1127�
1141.
Brick, I E., and K. H. Fung. 1984. Taxes and the Theory of Trade Debt. Journal of Finance, 39:1169�
1176.
Burkart, M., and T. Ellingsen. 2004. In�Kind Finance. A Theory of Trade Credit. American Economic
Review, 94:569�590.
Carletti, E. 2004. The Structure of Bank Relationships, Endogenous Monitoring and Loan Rates.
Journal of Financial Intermediation, 13:58�86.
Cocco, J., F. J. Gomes, and N. C. Martins. 2005. Lending Relationships in the Interbank Market.
Working Paper, London Business School.
42

Credit Research Foundation. 2005. The Business of Fraud: What You Don�t Know Can Hurt You?
https://www.crfonline.org/store/
Cunat, V. M. 2007. Trade Credit: Suppliers as Debt Collectors and Insurance Providers. Review of
Financial Studies, 20:491�527.
Degryse H., and S. Ongena. 2004. The Impact of Technology and Regulation on the Geographical
Scope of Banking. Oxford Review of Economic Policy, 20:571�590.
Demirguc-Kunt, A., and V. Maksimovic. 2002. Firms as Financial Intermediaries: Evidence from
Trade Credit Data. Working Paper, University of Maryland.
Financial Times. 2004. Pity the Poor Old Suppliers. November 15:16.
Economist. 2007. Big Chains Enjoy a Buyer�s Market, February 17:74.
Elliehausen, G. E., and J. D. Wolken 1993. The Demand for Trade Credit: An Investigation of Motives
for Trade Credit Use by Small Businesses. Working Paper, Board of Governors of the Federal Reserve
System.
Ferris, J. S. 1981. A Transactions Theory of Trade Credit Use. Quarterly Journal of Economics,
94:243�270.
Fisman, R., and I. Love 2003. Trade Credit, Financial Intermediary Development and Industry
Growth. Journal of Finance, 58:353�374.
Frank, M., and V. Maksimovic. 1998. Trade Credit, Collateral, and Adverse Selection. Working Paper,
University of Maryland.
43

Gavin, Larry T. 1996. Credit, Information, and Trust in the Law of Sales: The Credit Seller�s Right
of Reclamation. UCLA Law Review, 44:247�360.
Giannetti, M. 2003. Do Better Institutions Mitigate Agency Problems? Evidence from Corporate
Finance Choices. Journal of Financial and Quantitative Analysis, 38:185�212.
Hart, O. D., and J. Moore. 1994. A Theory of Debt Based on the Inalienability of Human Capital.
Quarterly Journal of Economics, 109:841�879.
Jain, N. 2001. Monitoring Costs and Trade Credit. Quarterly Review of Economics and Finance,
41:89�110.
Johnson, S., J. McMillan, and C. Woodru¤. 2002. Courts and Relational Contracts. Journal of Law,
Economics and Organization, 18:221�277.
Kaplan, S. N., and P. J. Stromberg. 2003. Financial Contracting Theory Meets the Real World: An
Empirical Analysis of Venture Capital Contracts. Review of Economic Studies, 70:281�315.
Lee, Y. W., and J. D. Stowe. 1993. Product Risk, Asymmetric Information, and Trade Credit. Journal
of Financial and Quantitative Analysis, 28:285�300.
Long, M. S., I. B. Malitz, and S. A. Ravid. 1993. Trade Credit, Quality Guarantees, and Product
Marketability. Financial Management, 22:117�127.
Longhofer, S. D., and J. A. C. Santos. 2003. The Paradox of Priority. Financial Management, 32:69�
81.
McMillan, J., and C. Woodru¤. 1999. Inter�rm Relationships and Informal Credit in Vietnam. Quar-
terly Journal of Economics, 114:1285�1320.
44

Mian, S. L., and C. W. Smith. 1992. Accounts Receivable Management Policy: Theory and Evidence.
Journal of Finance, 47:169�200.
Miwa, Y., and J. M. Ramseyer. 2005. Trade Credit, Bank Loans and Monitoring: Evidence from
Japan. Harvard John M. Olin Center for Law, Economics and Business Discussion Paper No. 527.
Nadiri, M. I. 1969. The Determinants of Trade Credit in the U.S. Total Manufacturing Sector. Econo-
metrica, 37:408�423.
Nilsen, J. H. 2002. Trade Credit and the Bank Lending Channel. Journal of Money, Credit and
Banking, 34:226�253.
Ng, C. K., J. K. Smith, and R. L. Smith 1999. Evidence on the Determinants of Credit Terms in
Inter�rm Trade. Journal of Finance, 54:1109�1129.
Petersen, M. A., and R. G. Rajan. 1994. The Bene�ts of Firm-Creditor Relationships: Evidence from
Small Business Data. Journal of Finance, 49:3�37.
Petersen, M. A., and R. G. Rajan. 1995. The E¤ect of Credit Market Competition on Lending
Relationships. Quarterly Journal of Economics, 60:407�444.
Petersen, M. A., and R. G. Rajan. 1997. Trade Credit: Theory and Evidence. Review of Financial
Studies, 10:661�691.
Pryor, F. L. 2001. New Trends in U.S. Industrial Concentration. Review of Industrial Organization,
18:301�326.
Rajan R. G., and L. Zingales. 1995. What Do We Know about Capital Structure? Some Evidence
from International Data. Journal of Finance, 50:1421�1460.
45

Rauch, J. E. 1999. Networks versus Markets in International Trade, Journal of International Eco-
nomics, 48:7�35.
Sharpe, S. A. 1990. Asymmetric Information, Bank Lending, and Implicit Contracts: A Stylized
Model of Customer Relationships. Journal of Finance, 45: 1069�1087.
Smith, J. 1987. Trade Credit and Informational Asymmetry. Journal of Finance, 42:863�869.
Uchida, H., G. F. Udell, and W. Watanabe. 2007. Are Trade Creditors Relationship Lenders? Working
Paper, Indiana University.
Von Thadden, E. L. 1995. Long-Term Contracts, Short-Term Investment and Monitoring. Review of
Economic Studies, 62:557�575.
Wilner, B. S. 2000. The Exploitation of Relationships in Financial Distress: The Case of Trade Credit.
Journal of Finance, 55:153�178.
Wolken, J. D. 1998. �New�Data Sources for Research on Small Business Finance. Journal of Banking
and Finance, 22:1067�1076.
46

Notes
1. For evidence on capital structure, see Rajan and Zingales (1995) and Giannetti (2003); for the relation between bank
credit rationing and trade credit, see Petersen and Rajan (1997).
2. This is the case unless suppliers establish a lien, which is a costly and infrequent practice. Additionally, it is impossible
to establish a lien if the good is transformed in the production process.
3. See also Lee and Stowe (1993), and Long, Malitz, and Ravid (1993).
4. The most common explanations of trade credit that we neglect are taxes [Brick and Fung (1984)] and liquidity
management [Ferris (1981)].
5. The supplier�s repossession advantage also depends on priority rules and bankruptcy laws that may severely limit its
relevance in the U.S. In fact, trade credit is generally junior debt and an unsecured trade creditor can reclaim a good that
has not been transformed only within ten days from the sale [Garvin (1996)]. In addition, establishing a security interest
on the good is a costly and infrequent practice.
6. For our identi�cation assumption to be valid, the di¤erentiated product should not be taylored to the the need of an
unique customer, because in this case its liquidation value would clearly be zero. Since di¤erentiated products include a
broad range of sectors, we believe that from an empirical point of view it is unlikely that a large proportion of di¤erentiated
products has an unique potential user.
7. We consider payments after the due date t2 to be contract violations. The late payment penalty could be viewed as
an additional contract term.
8. For example, the often used contract terms "30 days net, -2% if paid within 10 days" imply an annualized trade credit
interest rate of 44.59%.
9. The logic of the quality guarantee theories has no apparent implications for the cost of trade credit.
10. If both suppliers and customers are locked in the relationship, it is unclear to what extent the surplus generated by
the lending advantage is transferred to the borrower.
11. As a rule of thumb, U.S. banks are willing to give short-term loans (factoring) up to about 80% of the value of the
receivables [Mian and Smith (1992)]. Therefore, only about 20% of the receivables crowd out other investments by the
supplier. Miwa and Ramseyer (2005) also provide evidence that, thanks to the possibility of discounting notes, suppliers
are able to provide trade credit at a cost that does not exceed the interest rate on �nancial loans.
47

12. We further attempt to address concerns related to omitted industry factors by controlling for a large number of
�rm-speci�c characteristics.
13. The NSSBF data include information on the contract terms at which trade credit is o¤ered to �rms but not on the
terms at which �rms extend credit.
14. As explained in Section 2, the inclusion of retailers and wholesalers in the analysis allows us to evaluate an implication
of the diversion hypothesis, as these �rms are likely victims of credit frauds. Retailers and wholesalers are a particular
type of service �rms as they trade highly liquid goods even though their value added is a service (i.e., selling the good).
For this reason, we check whether the results are sensitive to the exclusion of retailers and wholesalers. All results that we
omit for brevity are qualitatively invariant.
15. In the survey, accounts receivable include invoices to customers for goods or services that have been delivered but not
yet paid, but not eventual credit card receivables, which are categorized as "other assets." Other studies using the NSSBF
[e.g., Petersen and Rajan (1997)] also proxy �rm supply of trade credit with accounts receivable.
16. See for instance Financial Times (November 15, 2004) and Economist (February 17, 2007).
17. An alternative way to estimate the contract terms would be to use Seemingly Unrelated Regression Equations (SURE),
to account for the correlation of errors across di¤erent equations, similarly to Cocco, Gomes, and Martins (2005), who
study contracts in the interbank market. While SURE is more e¢ cient, it is more likely to lead to inconsistent estimates.
For this reason, we have chosen to use single equation estimation methods.
18. Uchida, Udell, and Watanabe (2007) use a similar proxy for the actual maturity of trade credit.
19. We estimate regressions in which the dependent variable is truncated by ordinary least squares instead of using a Tobit
model, because the dependent variables�distribution is non-normal. Estimates using a Tobit model are similar to the ones
we report.
20. The impact of the �rm-speci�c variables is similar in the benchmark regression including sectoral dummies and in the
speci�cations including only the industry characteristics mentioned above. This gives us con�dence that our estimates
are unlikely to be biased by omitted variables and that product characteristics indeed capture salient sectoral di¤erences.
Furthermore, the reported results are robust to the inclusion/exclusion of a number of �rm-speci�c characteristics that we
do not report.
21. Interestingly, this result obtains only if we control for �rm assets. In our view, this is due to the fact that assets
capture the �rms�access to funds better than other proxies for �rm size, such as the number of employees.
48

22. Carletti (2003) provides a theoretical justi�cation.
23. Non-reported estimates reveal that the average concentration in the input market is not related to the amount of trade
credit that a �rm is o¤ered.
24. Our results on the e¤ect of �rm characteristics are similar to the ones we report if we include industry dummies instead
of the proxies for the use of di¤erentiated products and services in the second stage.
25. The proportion of services used as input is not related to the interest rate on bank loans (Panel C, Table 2).
26. As the cost of doing business includes both input and labor costs, we control for the number of employees and include
industry dummies.
27. The e¤ects of �rm-speci�c characteristics remain statistically signi�cant when we include industry dummies.
28. In other not reported speci�cations, we instrument the contract terms using our industry-speci�c variables. The results
remain qualitatively invariant although the signi�cance levels are often lower.
49

Table 1. Descriptive statistics Panel A: Firms Characteristics
Assets are total assets in million of dollars, Age is in years, and Sales are in million of dollars per year. Cost of Inputs/Sales is defined as the ratio of the cost of doing business to sales. Credit Line is the bank credit limit on the firm’s overdraft facility divided by sales. Other Loans include all loans other than credit lines and trade credit. Credit Risk is the firm’s credit risk and varies between 1 (low) and 5 (high). Fear of Denial is a dummy variable that takes the value 1 if the firm needed credit during the last three years but did not apply due to fear of denial and zero otherwise. Financial Problems is a dummy variable that takes the value 1 if the firm reports that its most important problem is related to financing, interests rates, or cash flow and zero otherwise. Unused Credit is the difference between the bank credit limit and the amount drawn as a fraction of assets. Average Bank Distance is the average distance in miles between the firm’s and the banks’ headquarters. Average Bank Months is the average number of months of the firm’s relationship with its banks. Guarantee is a dummy variable that takes the value 1 if the firm has pledged any of its assets as collateral and zero otherwise. Last Loan Interest Rate is the annualized interest rate in percentage points on the last bank loan received by the firm. Fees are the total dollar cost of obtaining the bank loan, which includes title transfer taxes, lawyer fees, environmental surveys, appraisals, application fees, other expenses at the time of the last loan application, and fees to close the loan.

Means (Standard Deviations)
Firm Characteristics Whole Sample
Standardized Goods
Differentiated Goods Services
Obs.
3489
497
270
2722
Assets 1.48 (5.374)
2.46 (7.97)
3.91 (9.50)
1.06 (3.95)
Age
14.46 (12.15)
16.30 (12.68)
16.70 (13.36)
13.87 (11.86)
Sales 3.473 (15.1)
6.03 (31.0)
5.74 (1.07)
2.78 (10.2)
Profit/Sales
-0.040 (4.94)
0.028 (1.23)
-0.069 (1.67)
-0.049 (5.54)
Fixed Assets/Assets 0.30 (0.31)
0.32 (0.30)
0.32 (0.26)
0.29 (0.31)
Inventories/Sales 0.14 (0.13)
0.11 (0.57)
0.21 (0.72)
0.13 (0.66)
Cost of Inputs/Sales 1.09 (5.07)
0.99 (1.23)
1.09 (1.76)
1.10 (5.69)
No. of Employees/Assets 23.78 (53.67)
32.77 (65.38)
48.89 (79.19)
19.64 (46.89)
Credit Line
0.14 (1.66)
0.09 (0.22)
0.14 (0.55)
0.15 (1.87)
Other Loans/ Sales 0.09 (0.97)
0.03 (0.12)
0.14 (1.02)
0.09 (1.05)
Credit Risk
2.98 (1.04)
2.91 (1.12)
2.89 (1.22)
3.00 (1.01)
Fear of Denial 0.22 (0.42)
0.23 (0.42)
0.20 (0.40)
0.23 (0.42)
Financial Problems
0.12 (0.32)
0.15 (0.36)
0.12 (0.33)
0.11 (0.31)
Unused Credit
2.76 (45.30)
1.04 (3.30)
0.83 (3.28)
3.54 (54.21)
Number of Banks 2.44 (1.71)
2.54 (1.73)
2.87 (2.11)
2.37 (1.65)
Average Bank Distance 148 (286)
131 (232)
167 (309)
149 (292)
Average Bank Months 86 (80)
92 (84)
84 (69)
86 (80)
Guarantee 0.50 (0.50)
0.60 (0.49)
0.64 (0.48)
0.46 (0.50)
Last Loan Interest rate 11 (36)
12 (33)
7.2 (28)
12 (38)
Fees 10649 (139735)
36208 (328031)
16137 (71848)
3639 (18298)

Table 1. Descriptive statistics Panel B: Industry Characteristics
Own Concentration is the market share of the eight largest firms in the firm’s two-digit industry (Pryor’s concentration index). Input Concentration is the weighted sum of Pryor’s concentration indices in the suppliers’ industries where the weights correspond to the input shares used by the firms as given by the input-output tables. Differentiated Inputs is the share of inputs that comes from sectors producing differentiated products. Service Inputs and Standardized Inputs are defined accordingly. Own Industry Share is the share of output sold to firms in the same industry.
Means (Standard Deviations)
Sector Characteristics
Whole Sample
Standardized Goods
Differentiated Goods Services
Own Concentration 19.87 (13.42)
46.61 (14.50)
42.13 (11.11)
16.07 (8.92)
Input Concentration 0.16 (0.08)
0.36 (0.11)
0.27 (0.08)
0.13 (0.04)
Differentiated Inputs 0.058 (0.068)
0.071 (0.067)
0.140 (0.107)
0.046 (0.050)
Service Inputs 0.280 (0.051)
0.198 (0.036)
0.198 (0.026)
0.297 (0.037)
Standardized Inputs 0.068 (0.125)
0.388 (0.092)
0.246 (0.190)
0.023 (0.020)
Own Industry Share 0.102 (0.053)
0.235 (0.072)
0.130 (0.085)
0.089 (0.027)

Table 1. Descriptive statistics Panel C: Suppliers’ perspective
Net Terms are the number of days of the typical industry payment period. Two-Part is a dummy variable that takes the value 1 if discounts are common in the industry and zero otherwise. Both variables are defined at the two-digit industry level. The source for both variables is Ng, Smith, and Smith (1999).
Means (Standard Deviations)
Receivables Characteristics Whole Sample
Standardized Goods
Differentiated Goods Services
Receivables/Sales 0.100 (0.513)
0.161 (1.161)
0.135 (0.248)
0.086 (0.294)
Net Terms 29.34 (3.82)
27.59 (8.17)
30 (0)
29.59 (2.44)
Two-Part 0.078 (0.268)
0.155 (0.362)
0.444 (0)
0.027 (0.163)
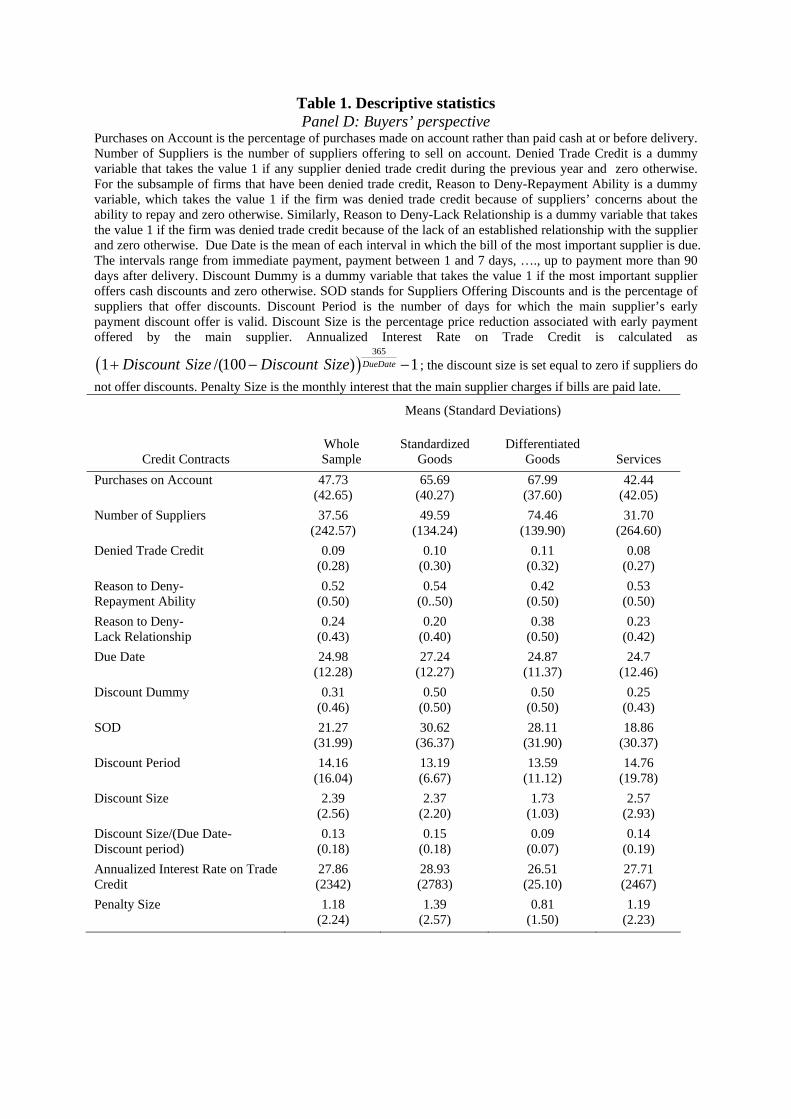
Table 1. Descriptive statistics Panel D: Buyers’ perspective
Purchases on Account is the percentage of purchases made on account rather than paid cash at or before delivery. Number of Suppliers is the number of suppliers offering to sell on account. Denied Trade Credit is a dummy variable that takes the value 1 if any supplier denied trade credit during the previous year and zero otherwise. For the subsample of firms that have been denied trade credit, Reason to Deny-Repayment Ability is a dummy variable, which takes the value 1 if the firm was denied trade credit because of suppliers’ concerns about the ability to repay and zero otherwise. Similarly, Reason to Deny-Lack Relationship is a dummy variable that takes the value 1 if the firm was denied trade credit because of the lack of an established relationship with the supplier and zero otherwise. Due Date is the mean of each interval in which the bill of the most important supplier is due. The intervals range from immediate payment, payment between 1 and 7 days, …., up to payment more than 90 days after delivery. Discount Dummy is a dummy variable that takes the value 1 if the most important supplier offers cash discounts and zero otherwise. SOD stands for Suppliers Offering Discounts and is the percentage of suppliers that offer discounts. Discount Period is the number of days for which the main supplier’s early payment discount offer is valid. Discount Size is the percentage price reduction associated with early payment offered by the main supplier. Annualized Interest Rate on Trade Credit is calculated as
( )365
1 /(100 ) 1DueDateDiscount Size Discount Size+ − − ; the discount size is set equal to zero if suppliers do not offer discounts. Penalty Size is the monthly interest that the main supplier charges if bills are paid late.
Means (Standard Deviations)
Credit Contracts Whole Sample
Standardized Goods
Differentiated Goods Services
Purchases on Account 47.73 (42.65)
65.69 (40.27)
67.99 (37.60)
42.44 (42.05)
Number of Suppliers 37.56 (242.57)
49.59 (134.24)
74.46 (139.90)
31.70 (264.60)
Denied Trade Credit 0.09 (0.28)
0.10 (0.30)
0.11 (0.32)
0.08 (0.27)
Reason to Deny- Repayment Ability
0.52 (0.50)
0.54 (0..50)
0.42 (0.50)
0.53 (0.50)
Reason to Deny- Lack Relationship
0.24 (0.43)
0.20 (0.40)
0.38 (0.50)
0.23 (0.42)
Due Date 24.98 (12.28)
27.24 (12.27)
24.87 (11.37)
24.7 (12.46)
Discount Dummy 0.31 (0.46)
0.50 (0.50)
0.50 (0.50)
0.25 (0.43)
SOD 21.27 (31.99)
30.62 (36.37)
28.11 (31.90)
18.86 (30.37)
Discount Period 14.16 (16.04)
13.19 (6.67)
13.59 (11.12)
14.76 (19.78)
Discount Size 2.39 (2.56)
2.37 (2.20)
1.73 (1.03)
2.57 (2.93)
Discount Size/(Due Date-Discount period)
0.13 (0.18)
0.15 (0.18)
0.09 (0.07)
0.14 (0.19)
Annualized Interest Rate on Trade Credit
27.86 (2342)
28.93 (2783)
26.51 (25.10)
27.71 (2467)
Penalty Size 1.18 (2.24)
1.39 (2.57)
0.81 (1.50)
1.19 (2.23)

Table 1. Descriptive statistics Panel E: Correlation Table for Contract Terms
All variables are defined in Panel D. Starred correlations are statistically significant at the 10 percent level. Account
Ratio SOD Discount
Size Discount Period
Penalty Size
Due Date
Purchases on Account 1
SOD 0,1028* 1 Discount Size -0,0203 0,0309 1 Discount Period -0,0335 0,0127 0,1521* 1 Penalty Size 0,0347* 0,0845* 0,2207* 0,0308 1 Due Date -0,0547* 0,0257 0,0024 0,1070* 0,0253 1
Table 1. Descriptive statistics Panel F: Use of Trade Credit
Payables’ Turnover is defined as the ratio of payables to the cost of doing business, multiplied by 365. Trade Credit Usage is a dummy variable that takes the value 1 if the firm used trade credit during the past year and zero otherwise. Discount Usage is the fraction of discount offers that firms take advantage of. Late Dummy takes the value 1 if the firm has paid after the due date during the previous year and zero otherwise. Late Fraction is the percentage of purchases on account paid after the due date.
Means (Standard Deviations)
Credit Usage Whole Sample
Standardized Goods
Differentiated Goods Services
Payables/ Assets 0.20 (0.64)
0.06 (0.31)
0.19 (0.53)
0.38 (4.01)
Payables’ Turnover 31.00 (79.06)
47.74 (96.82)
39.31 (84.21)
28.39 (74.45)
Trade Credit Usage 0.66 (0.47)
0.80 (0.40)
0.84 (0.36)
0.62 (0.49)
Discount Usage 0.57 (0.44)
0.60 (0.45)
0.45 (0.44)
0.59 (0.44)
Late Dummy 0.46 (0.50)
0.48 (0.50)
0.55 (0.50)
0.44 (0.50)
Late Fraction 0.14 (0.26)
0.16 (0.29)
0.15 (0.24)
0.13 (0.26)

Table 2. The volume of trade credit Panel A: Suppliers’ Perspective
The dependent variable is the ratio of accounts receivable to sales. All independent variables are defined in Table 1, except for the following. Same Area is a dummy variable that takes the value 1 if the firm’s main office is located in its primary sales area and zero otherwise. Retail is a dummy variable that takes the value 1 if the firm is a retail firm and zero otherwise. Wholesale is defined analogously for wholesalers. Constants are included in all regressions but parameter estimates are not reported. In Column (1), 59 two-digit SIC indicators are also included. Estimates in Column (3) are based on the 2001 Compustat sample and all the industry-level variables are defined using the four-digit SIC disaggregation. Parameters have been estimated by ordinary least squares. Numbers in parentheses denote t-values. Standard errors are White-corrected for heteroskedasticity and clustered at the industry level. * Significant at the 10% level; ** Significant at the 5% level; *** Significant at the 1% level.
(1) (2) (3) Compustat
(4)
Log Assets 0.02 (6.89)***
0.02 (5.56)***
0.03 (2.70)***
0.02 (4.93)***
Profit/Sales
-0.01 (-0.21)
-.002 (-0.51)
0.00003 (3.15) ***
-0.004 (-0.32)
Fixed Assets/ Assets
-0.15 (-4.35)***
-0.13 (-4.77)***
-0.02 (-3.27)***
-0.11 (-3.89)***
Log Age -0.01 (-1.73)*
-0.01 (-0.93)
-0.001 (-0.17)
Credit Line
0.01 (0.81)
0.002 (0.44)
0.002 (0.16)
Other Loans/ Sales
0.02 (1.91)*
0.02 (1.82)*
0.02 (1.57)
Credit Risk 0.01 (0.90)
-.00003 (-0.01)
0. 0001 (0.01)
Average Bank Distance
-.00003 (-2.21)***
-.00002 (-2.26)**
-0.00002 (-1.58)
Average Bank Months
.0001 (1.68)*
.000048 (1.12)
0.00002 (0.50)
Same Area -0.03 (-1.16)
-0.01 (-1.16)
-0.02 (-2.04)**
Differentiated Goods
0.05 (2.40)**
0.02 (2.58)***
Services 0.04 (2.34)**
0.03 (3.25)***
Retail -0.06 (-2.33)**
-0.04 (-3.67)***
Wholesale -0.1 (-5.77)***
-0.12 (-10.25)***
Own Concentration
-.0003 (-0.43)
0.00003 .27)
-.0004 (-0.46)
Own Industry Share
0.02 (0.15)
Obs. 3299 2696 7434 2696 R-squared 0.04 0.06 0.08 0.04

Table 2. The volume of trade credit Panel B: Buyers’ Perspective
All variables are defined in Table 1, except for (Diff Inp) x Financial Problems, which interacts the Differentiated Inputs dummy with the Financial Problems dummy. Constants are included in all regressions but parameter estimates are not reported. In Column (1), 59 two-digit SIC indicators are also included. In Columns (1), (2), (3), and (6), the dependent variable is the percentage of purchases made on account, and parameters are estimated by ordinary least squares. In Column (4), the dependent variable is a dummy equal to 1 if the firm uses trade credit and zero otherwise. In Column (5), the dependent variable is a dummy equal to 1 if the firm using trade credit has been denied trade credit and equal to zero otherwise. In Column (7), the dependent variable is a dummy variable, defined only for firms that have been denied trade credit, which takes the value 1 if the firm was denied trade credit because of suppliers’ concerns about the ability to repay and zero otherwise. In Column (8), the dependent variable is a dummy variable, defined only for firms that have been denied trade credit, which takes the value 1 if the firm was denied trade credit because of the lack of an established relationship with the supplier and zero otherwise. Firms that do not use trade credit are not included. In Columns (4) and (5), estimates are obtained using a probit model. In Columns (7) and (8), parameters are estimated using a probit model with sample selection. The selection equation is estimated like in Column (5), but we include industry dummies instead of the industry-specific variables. In Columns (4), (5), (7), and (8), we report marginal effects, calculated by taking the mean of all independent variables, instead of parameter estimates. Numbers in parentheses denote t-values. Standard errors are White-corrected for heteroskedasticity and clustered at the industry level. * Significant at the 10% level; ** Significant at the 5% level; *** Significant at the 1% level.
(1) Purchases
on Account
(2) Purchases
on Account
(3) Purchases
on Account
(4) Trade Credit
Usage
(5) Trade Credit Denial
(6) Purchases on
Account
(7) Reason to
Deny-- Repayment
Ability
(8) Reason to
Deny-- Lack
Relationship Log Assets 5.04
(11.45)*** 5.46
(11.62)*** 5.633
(11.66)*** 0.05
(9.19)*** -0.007
(-2.52)** -0.70
(-2.67)** -0.10
(-2.48)** 0.06
(0.94) Profit/Sales
-0.12 (-0.81)
0.16 (0.40)
-0.721 (-1.71)*
-0.02 (-2.06)**
0.008 (2.07)**
-0.32 (-1.47)
Fixed Assets/Assets -3.05 (-0.97)
-3.31 (-0.88)
-2.929 (-0.79)
-0.03 (-0.78)
-0.002 (-0.09)
2.74 (1.26)
Log Age 3.01 (2.78)***
0.16 (0.40)
3.268 (2.47)**
0. 03 (1.86)*
-0.021 (-2.00)**
-0.42 (-0.60)
-0.41 (-2.62)***
0.68 (3.11)**
Credit Line
-0.22 (-1.74)*
-0.48 (-1.12)
-0.949 (-1.60)
-0.02 (-1.57)
0.003 (0.29)
-0.35 (-1.46)
Other Loans/ Sales 0.12 (0.20)
-0.02 (-0.03)
-0.105 (-0.14)
-0.003 (0.35)
-0.002 (-0.30)
0.57 (1.03)
Credit Risk -1.66 (-2.53)**
-1.39 (-1.69)*
-1.441 (-1.58)
-0.004 (-0.33)
0.037 (4.67)***
-1.02 (-1.99)*
0.09 (0.53)
0.18 (0.63)
Average Bank Distance
0.001 (0.51)
0.0002 (0.08)
0.000 (0.11)
0.000 (1.76)
0.000 (0.43)
-0.04 (-2.40)**

Average Bank Months
-0.01 (-0.88)
-0.02 (-1.57)
-0.020 (-1.70)*
-0.000 (2.75)***
-0.000 (-0.38)
-0.01 (-0.86)
Guarantee 6.01 (2.99)***
4.83 (2.23)***
5.440 (2.52)**
0.074 (3.49)**
0.007 (0.52)
-0.44 (-0.34)
Differentiated Inputs
32.10 (1.93)*
28.184 (0.93)
0.57 (2.36)**
-0.014 (-0.15)
23.94 (2.17)**
1.76 (3.11)**
-1.42 (-1.80)*
Service Inputs -58.29 (-2.83)***
-57.622 (-2.59)**
-0.57 (-1.71)*
-0.218 (-1.94)*
-17.45 (-1.43)
-0.81 (-1.17)
0.47 (0.50)
(Diff Inp) x Credit Risk
1.930 (0.24)
Retail 11.04 (3.78)***
11.60 (3.87)***
.04 (1.01)
0.029 (2.25)**
7.27 (3.71)***
0.27 (3.02)***
-0.13 (-1.99)**
Wholesale 9.38 (3.87)***
11.606 (3.87)***
0.10 (3.62)***
0.004 (0.31)
3.58 (2.30)**
0.22 (3.10)*
-0.19 (-2.14)**
Own Concentration 0.23 (2.92)***
10.011 (3.88)***
0.001 (1.12)
0.013 (2.31)*
0.04 (0.86)
Number of Suppliers 0.256 (3.05)***
17.97 (28.50)***
Obs. 3299 2234 2234 2234 1543 2234 139 139 R-squared 0.23 0.23 0.22 0.13 0.08 0.59

Table 2. The volume of trade credit Panel C: Bank Relationships and Trade Credit Usage
All dependent and independent variables are defined in Table 1. Constants are included in all regressions but parameter estimates are not reported. Numbers in parentheses denote t-values. All parameters are estimated by ordinary least squares. Standard errors are White-corrected for heteroskedasticity and clustered at the industry level. * Significant at the 10% level; ** Significant at the 5% level; *** Significant at the 1% level.
(1) (2) (3) (4) (5) (6) Average Bank
Distance Average Bank
Months Fees Number of
Banks Interest Rate on Last Loan
Maturity of Last Loan
Log Assets 20.248 -0.401 4,637.368 0.310 -0.329 2.055 (7.43)*** (0.56) (2.71)*** (18.36)*** (5.53)*** (1.73)* Profit/Sales -2.087 1.016 -1,206.329 0.003 0.215 3.777 (-0.83) (1.82)* (0.42) (0.14) (1.16) (1.57) Log Age -18.538 42.412 -4,168.736 -0.062 -0.226 -3.714 (-2.15)* (15.62)** (-0.90) (-1.42) (-1.64) (-0.95) Credit Line -0.562 0.654 5,925.576 0.025 0.119 0.675 (0.22) (1.16) (0.71) (1.39) (0.62) (0.10) Other Loans/ Sales 0.371 -0.219 39.893 0.009 0.734 31.077 (0.09) (-0.33) (0.00) (0.29) (1.70)* (1.84)* Credit Risk 3.618 -1.299 -9,868.846 0.133 0.171 -3.853 (0.58) (-0.84) (-1.04) (3.95)** (2.11)** (-1.81)* Trade Credit Usage 32.828 -7.583 -6,199.356 0.217 0.017 -6.461 (2.39)** (-2.06)** (-1.76)* (3.15)** (0.06) (-0.86) Differentiated Inputs 117.024 -59.515 -93,385.352 1.427 -1.204 -92.330 (1.32) (-2.90)*** (-0.98) (1.41) (0.56) (-2.73)*** Service Inputs 111.881 7.289 -307,869.587 1.530 0.314 -77.596 (0.92) (0.21) (-1.31) (1.79) (0.19) (-1.48) Obs. 2234 2234 555 2234 555 516 R-squared 0.03 0.18 0.02 0.20 0.13 0.04

Table 3. Contract terms All dependent and independent variables are defined in Table 1. Constants are included in all regressions but parameter estimates are not reported. Parameters in Column (5) are estimated by ordinary least squares. In Column (2), parameters have been estimated using a maximum-likelihood probit model with sample selection. In all other columns, parameters are estimated using a two-stage Heckman selection model. The selection equation is presented in Column (4) of Table 2, Panel B. In Column (2), we report marginal effects, calculated by taking the mean of all independent variables, instead of parameter estimates. Numbers in parentheses denote t-values. Standard errors are White-corrected for heteroskedasticity and clustered at the industry level. * Significant at the 10% level; ** Significant at the 5% level; *** Significant at the 1% level.

(1) (2) (3) (4) (5) (6) (7) SOD Discount
Dummy Discount
Size Annualized Interest Rate
Penalty Discount Period
Due Date
Log Assets 0.670 -0.006 0.019 347.436 -0.03 -0.046 -0.373 (1.52) (0.86) (3.87)*** (2.25)** (-2.67)** (-2.08)** (-1.41) Profit/Sales 0.095 -0.014 0.001 -11.333 0.02 -0.001 0.405 (0.15) (-2.15)** (0.58) (-0.11) (1.76)* (-0.07) (2.26)** Fixed Assets/ Assets -1.314 0.050 0.034 -235.612 0.051 -0.088 -3.360 (-0.48) (1.31) (2.25)** (-0.54) (0.91) (-0.73) (-1.90)* Log Age 1.094 0.013 0.017 188.813 0.012 -0.031 0.772 (1.04) (0.77) (1.37) (0.94) (0.54) (-0.62) (1.67)* Credit Line 0.045 -0.022 0.021 -109.661 0.011 0.083 0.548 (0.05) (-2.52)** (1.17) (-0.24) (0.64) (0.56) (2.17)** Other Loans/Sales -0.405 -0.009 0.004 7.130 0.016 0.007 0.106 (1.24) (-1.39) (1.87)* (0.03) (1.19) (0.14) (0.28) Credit Risk -0.590 -0.023 -0.013 -27.643 -0.009 0.013 0.489 (-0.83) (-2.66)*** (-2.85)*** (-0.23) (-0.70) (0.45) (1.02) Average Bank Distance -0.001 0.000 0.000 -0.316 -0.0001 0.000 0.002 (-0.51) (1.15) (0.05) (-0.84) (-1.76)* (0.04) (1.25) Average Bank Months 0.007 0.000 -0.000 -0.370 0.0002 -0.000 -0.009 (0.69) (1.72)* (-0.72) (-0.28) (1.67) (-0.70) (2.07)** Guarantee 1.593 -0.020 -0.017 -76.191 0.021 0.073 1.817 (0.93) (-0.78) (-2.45)** (-0.29) (0.62) (1.76)* (2.08)** Differentiated Inputs 11.587 0.286 -0.006 5,930.512 0.169 -0.910 1.105 (0.82) (0.65) (-0.12) (1.87)* (0.62) (-1.25) (0.19) Service Inputs -61.749 -1.039 -0.242 -7,381.735 -0.001 1.653 -5.241 (-3.20)*** (-2.96)*** (-2.33)** (-1.59) (-0.00) (2.15)** (0.60) Retail 10.486 0.159 0.093 698.391 -0.011 -0.358 1.829 (2.20)** (2.60)*** (3.63)*** (1.33) (0.21) (-3.68)*** (2.44)** Wholesale 9.947 0.167 0.089 1,128.090 0.104 -0.217 -0.239 (3.77)*** (3.78)*** (3.38)*** (1.85)* (2.24)** (-2.01)** (-0.10) Number of Suppliers -0.218 0.032 0.000 6.773 0.004 -0.004 0.642 (-0.33) (3.99)*** (0.14) (0.08) (0.32) (-0.28) (2.11)** Input Concentration 4.340 0.038 0.073
(0.33) (0.12) (1.11) Inventories/Sales 0.017 0.538 (2.90)*** (1.70)* Obs. 2260 2271 2273 1179 2256 2274 2271 R-squared 0.02

Table 4. Payables and payment behavior All dependent and independent variables are defined in Table 1. Constants are included in all regressions but parameter estimates are not reported. In Column (1), 59 two-digit SIC indicators are also included. In Columns (1) to (6), parameters are estimated by ordinary least squares. In Column (4), estimates are obtained using a probit model, and we report marginal effects, calculated by taking the mean of all independent variables, instead of parameter estimates. In Column (1), the coefficient of payables turnover is multiplied by 100. Numbers in parentheses denote t-values. Standard errors are White-corrected for heteroskedasticity. * Significant at the 10% level; ** Significant at the 5% level; *** Significant at the 1% level. (1) (2) (3) (4) (5) (6) Cost of
Inputs/Sales Payables/Assets Late
Fraction Late
Dummy Payables Turnover
Discount Usage
Purchases on Account 0.021 0.051 0.001 0.947 -0.030 (1.87)* (1.48) (2.14)** (1.01) (-0.48) Payables Turnover -0.004 (-3.97)*** Due Dates 0.007 0.024 0.002 4.496 (0.32) (0.38) (2.89)*** (2.41)** Penalty Size 0.002 0.064 -0.006 80.193 (0.01) (0.15) (-1.22) (6.38)*** SOD -0.005 0.012 0.000 -0.387 0.010 (-0.51) (0.40) (1.43) (0.45) (0.20) Discount Size 15.030 (1.71)* Discount Period 3.297 (1.07) Fear of Denial 0.006 -0.850 9.632 0.234 159.289 -15.243 (0.06) (-0.97) (4.11)*** (8.35)*** (2.13)** (-3.21)*** Financial Problems -0.068 0.076 3.129 0.072 -23.680 -20.451 (0.91) (0.07) (1.18) (2.03)** (0.26) (-3.57)*** Profit/Sales 0.016 0.519 0.003 4.844 -1.957 (0.16) (1.24) (1.17) (0.56) (-3.06)*** Log Assets -0.011 -0.821 -0.259 0.024 18.515 -2.171 (0.27) (-5.00)*** (-0.53) (4.40)*** (1.32) (-2.32)** Log Age -0.020 0.205 -1.191 -0.005 21.183 2.658 (0.35) (0.42) (-0.84) (-0.32) (0.51) (1.04) Credit Line 0.000 0.000 -0.000 0.000 0.000 -0.000 (1.21) (1.19) (-2.54)** (1.81)* (0.61) (-0.23) Other Loans/Sales 0.402 -0.021 -0.897 -0.009 -9.061 -1.342 (2.31)** (-0.06) (-1.56) (-0.80) (0.31) (-0.32) Average Bank Distance 0.000 0.000 0.001 0.000 -0.052 -0.009 (0.36) (0.22) (0.28) (1.13) (0.53) (-1.39) Average Bank Months -0.000 0.001 0.029 0.000 -0.179 0.060 (0.57) (0.19) (1.67)* (2.39)** (0.45) (3.02)*** Employees 0.000 (0.12) Obs. 3282 2271 1045 2271 2266 623 R-squared 0.03 0.01 0.03 0.02 0.09

Appendix
The industry classification is based on Rauch (1999). Differentiated Inputs is the share of inputs that comes from sectors producing differentiated products. Service Inputs and Standardized Inputs are defined analogously. The sum of service inputs, standardized inputs, and differentiated inputs is 1.
Sector SIC code Services Differentiated Goods Standardized Goods Service Inputs Differentiated Inputs Standardized Inputs
Manufacturing
Coal mining 12 0 0 1 0.25 0.24 0.52
Non metallic minerals 14 0 0 1 0.22 0.20 0.57
Food, kindred products 20 0 0 1 0.27 0.18 0.55
Textile mill products 22 0 0 1 0.45 0.15 0.40
Apparel 23 0 0 1 0.31 0.21 0.48
Lumber, wood products 24 0 0 1 0.43 0.17 0.40
Furniture, fixture 25 0 1 0 0.28 0.17 0.55
Paper, allied products 26 0 0 1 0.19 0.21 0.60
Printing publishing 27 0 1 0 0.07 0.20 0.73
Chemicals 28 0 0 1 0.41 0.22 0.36
Petroleum, coal products 29 0 0 1 0.20 0.20 0.59
Rubber, plastic products 30 0 1 0 0.31 0.18 0.50
Leather 31 0 0 1 0.14 0.17 0.70
Stone, glass, clay products 32 0 1 0 0.30 0.22 0.48
Primary metal industries 33 0 0 1 0.38 0.30 0.32
Fabricated metal products 34 0 1 0 0.50 0.25 0.25
Machinery 35 0 1 0 0.46 0.18 0.36
Electrical, electronic equipment 36 0 1 0 0.34 0.17 0.50
Transportation, equipment 37 0 1 0 0.56 0.22 0.22
Instruments 38 0 1 0 0.19 0.16 0.65
Miscellaneous products 39 0 1 0 0.23 0.20 0.57

Transportation, communication, public utilities
Other surface passenger transportation 41 1 0 0 0.12 0.26 0.62
Motor freight transportation, warehousing 42 1 0 0 0.07 0.42 0.51
Water transportation 44 1 0 0 0.10 0.53 0.37
Air transportation 45 1 0 0 0.15 0.30 0.54
Transportation services 47 1 0 0 0.12 0.26 0.62
Communications 48 1 0 0 0.06 0.37 0.57
Electric, gas, sanitary services 49 1 0 0 0.03 0.23 0.74
All wholesale trade
Durable goods 50 1 0 0 0.08 0.28 0.64
Non-durable goods 51 1 0 0 0.08 0.28 0.64
All retail trade
Building materials 52 1 0 0 0.09 0.29 0.62
Department stores 53 1 0 0 0.09 0.29 0.62
Food stores 54 1 0 0 0.09 0.29 0.62
Automotive 55 1 0 0 0.09 0.29 0.62
Apparel, accessory stores 56 1 0 0 0.09 0.29 0.62
Furniture 57 1 0 0 0.09 0.29 0.62
Miscellaneous retail stores 59 1 0 0 0.09 0.29 0.62
Drug and proprietary stores 61 1 0 0 0.03 0.39 0.58
Finance, insurance, real estate
Insurance agents, brokers 64 1 0 0 0.04 0.56 0.41
Real Estate 65 1 0 0 0.08 0.23 0.69
Other services

Business services 73 1 0 0 0.15 0.30 0.55
Automobile repair, services, parking 75 1 0 0 0.26 0.25 0.49
Legal services 78 1 0 0 0.09 0.38 0.53
Com. Engineering, accounting, research 79 1 0 0 0.09 0.38 0.53