Maria Grazia Pia, INFN Genova through an application example.
Upload
brooke-whiteCategory
view
213download
0
Maria Grazia Pia, INFN Genova 1
Data analysis with R in an experimental physics environment
Andreas Pfeiffer (CERN) and Maria Grazia Pia (INFN Genova)
IEEE NSS 201327 October – 2 November 2013
Seoul, Korea

Maria Grazia Pia, INFN Genova 2
Daily work
© 2013 CERN, for the benefit of the CMS Collaboration (License: CC-BY-SA-3.0)
Maria Grazia Pia, INFN Genova 3
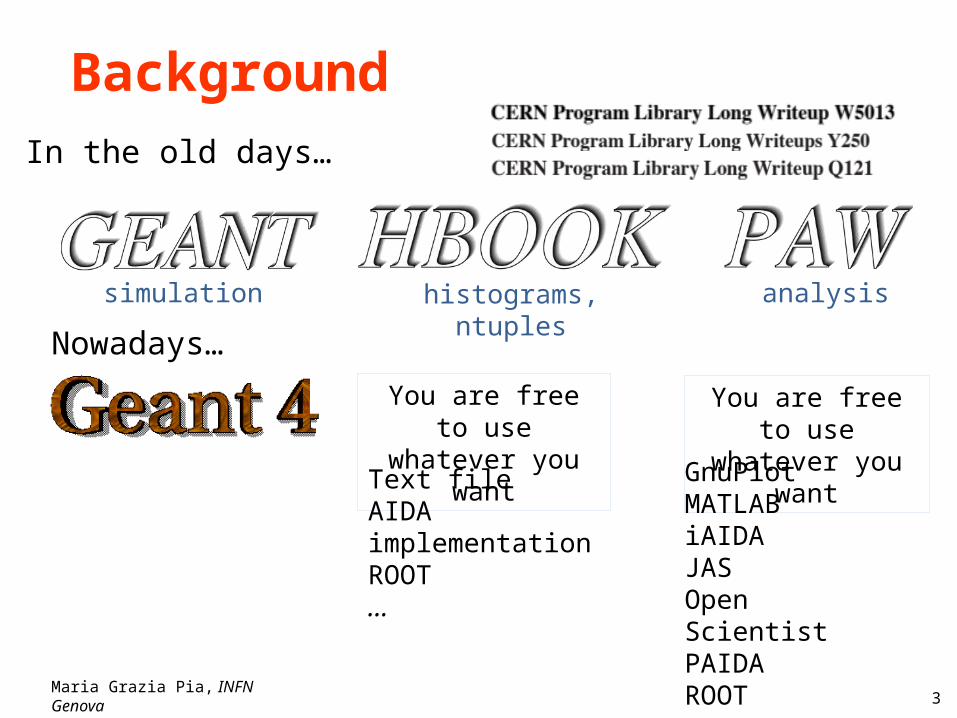
BackgroundIn the old days…
simulation histograms, ntuples analysis
You are free to use whatever you want
You are free to use whatever you want
Nowadays…
Text fileAIDA implementationROOT …
GnuPlotMATLABiAIDAJASOpen ScientistPAIDAROOT …

Maria Grazia Pia, INFN Genova 4
Different conceptual models
begin of runCreate histograms, ntuples
event loopFill (accumulate)
histograms, ntuples
end of runStore histograms, ntuples
data analysis
data
data analysis
Strong as a producer of analysis objects
Outstanding data analysis capabilities
Maria Grazia Pia, INFN Genova 5
AIDA - Abstract Interfaces for Data Analysis
Started in 1999, defining full set of interfaces −http://aida.freehep.org
“The goal of the AIDA project is to define abstract interfaces for common physics analysis objects, such as histograms, ntuples, fitters.
The adoption of these interfaces makes it easier for developers and users to select and use different tools without having to learn new interfaces or change their code.
In addition it is possible to exchange data (objects) between AIDA compliant applications through a standard XML format.”

Maria Grazia Pia, INFN Genova 6
AIDA objects
Data types − Histograms 1D, 2D, 3D as statistical entities
also “dynamic”/”unbinned” ones (“Clouds”)
− Profile Histograms − Ntuple − DataPoints
vectors of “free form” N-dim data with errors
Non-data types − Annotations to add statistics/summary and “free form” info
provided by user (key/value pairs) − Fitter, Functions, Plotter, Analyzer
Defined XML format for data storage − “.aida” files (compressed XML)

Maria Grazia Pia, INFN Genova 7
AIDA implementationsModular design to maximise flexibility − Factory pattern to create objects − Plugin modules for different implementations
e.g. native, Root, HBook stores to read/write histograms and tuples
Implementations of interfaces in several languages − C++
iAIDA - http://iaida.dynalias.net OpenScientist - http://openscientist.lal.in2p3.fr
− Java JAS (Java Analysis Studio) - http://jas.freehep.org
− Python paida - http://paida.sourceforge.net
Flexibility through XML data interchange format − “.aida” files can be read by all across languages

Maria Grazia Pia, INFN Genova 8
R
R is a language and environment for statistical computing and graphics− Similar to S (can be considered as a different implementation of S)
GNU project
Provides a wide variety of statistical and graphical tools
It is highly extensible
Used by a huge multi-disciplinary community
Strong at producing well-designed, publication-quality plots
Runs on Windows, MacOs X, Linux (various distros)
In 1998 John Chambers won the ACM Software Systems award for the S language, which the ACM heralded as having
"forever altered how people analyze, visualize, and manipulate data”

Maria Grazia Pia, INFN Genova 9
Getting the best of both worlds
A lightweight system for dealing with analysis objects in experimental software scenarios
A powerful, extensible data analysis system
A transparent bridge between the two
begin of runCreate histograms, ntuples
event loopFill
histograms, ntuples
end of runStore histograms, ntuples
data analysis
Maria Grazia Pia, INFN Genova 10
aidar - Interfacing AIDA with R Interface to read AIDA XML files into R − Exploiting the power of R for analysis −Using the existing XML package in R
aidar converts AIDA objects from (XML) file into data.frames −Histograms, Clouds, Profiles, Ntuples − getFileInfo(<fileName>) to get overview
Developer version available from github: − https://github.com/apfeiffer1/aidar
Easy install via devtools package (see Readme on github)
Plan to have it as regular CRAN module by end November
Seamless data production and analysis, transparent use in R

Maria Grazia Pia, INFN Genova 11
Initialization (start of run) // Create the analysis factory and the tree factory … // Creating a tree mapped to a new XML file std::auto_ptr< AIDA::ITree > tree( tf->create( "comptoncs.xml", "xml", readOnly, createFile, "uncompressed" ) );
// Create a tuple factor and a histogram factory… // Create a 1D histogram AIDA::IHistogram1D* hSigma = hf->createHistogram1D("10","Cross section", 100,0.,1.);
// Create a ntuple AIDA::ITuple* ntuple = tpf->create( "1", "Compton cross section”, "float z, e, lib, pen, std" );
// Do your calculations in the event/track loop … // Fill histogramhSigma->fill(sigmaEPDL);
// Add data row to Ntuplentuple->fill( ntuple1->findColumn( "z" ), z );ntuple->fill( ntuple1->findColumn( "e" ), e );ntuple->fill( ntuple1->findColumn( ”lib" ), sigmaEPDL );ntuple->fill( ntuple1->findColumn( "pen" ), sigmaPenelope );ntuple->fill( ntuple1->findColumn( "std" ), sigmaStandardntuple->addRow();
Event loop// Committing the transaction with the treetree->commit();tree->close();
End of run
e.g.

Maria Grazia Pia, INFN Genova 12
R session
Load devtools and aidar packages
histoFile = "comptoncs.xml” t1 = getTuple(histoFile, '1')
plot(t1$e, t1$lib, …)
T1 (AIDA ntuple) gets converted into
a R data.frame

Maria Grazia Pia, INFN Genova 13
Recent Geant4 validation

Maria Grazia Pia, INFN Genova 14
It works!
This conference:
N29-4, Physics Methods for the Simulation of Photoionization
N29-5, Validation of Compton Scattering Monte Carlo Simulation Models
NPO2-141, Validation of Geant4 Electron Pair Production by Photons

Maria Grazia Pia, INFN Genova 15
ConclusionsBridge between two conceptually different data analysis scenarios− Addresses typical use cases in daily experimental practice− Best of two worlds
Transparent to users
Lightweight, robust analysis system for data production
Powerful system for data elaboration and graphics
Use it!Feedback from the experimental community is welcome