2013-12 - NDC GO x Temp. AS - C&N - Romero-Cardoso-Marcuzzo-Barros.pdf
1
Maria Cristina Marcuzzo
Sapienza, Università di Roma
Giulia Zacchia
Università di Macerata
Weight for citations or weights for numerousness?
Evaluating Italy’s academic economists.
Abstract
The aim of this paper is to offer a contribution to the work of analysing which bibliometric
indicators are best suited to the functions they could be expected to perform with the ongoing
reform of the Italian university system. We will compare two pictures representing Italian
economists as a whole on the basis of the Cineca 2007 data, using two indexes deriving from two
different approaches. The first approach is based on the idea that the quality of research is to be
measured in terms of its ‘impact’ on the scientific community, and that the impact can in turn be
gauged by the number of citations. The second approach, by contrast, takes reference from the
weight to be attributed – by the evaluators – to products of research, on the basis of characteristics
(place and publication typology) from which are derived weighted numerousness indexes (the
number of publications weighted in terms of their ‘importance’). The former index, h, attributes
importance to the quantity of citations of research products corrected on the basis of the number of
publications, while the latter, EconlitNumber, attaches importance to the numerousness of
publications corrected on the basis of the weight attributed to them. Comparing the results obtained
calculating the two indexes of Italian economists, we demonstrate that they give rise to strikingly
different rankings of individuals, Universities and Faculties, and are therefore to be approached
very gingerly.
Codici JEL: A13. I2
Key words: evaluation, bibliometric indicators, Italian economists
2
1. Introduction: two approaches to evaluation1
The reform of the Italian university system now being implemented contains, in the mechanisms for
evaluation of the quality of academic research, the linchpin for the changes that are to be brought
about in Italy. For the purposes of selection – competitive examinations, research projects,
assignment of resources in general – the uses of bibliometric indicators to measure scientific
production is receiving consensus,2 albeit in the context of a debate that sees a wide range of
positions that are far from concurring.3 The aim of this paper is to offer a contribution to analysis of
which bibliometric indicators are best suited to the situation in Italy, considering two broad pictures
of the economic disciplines painted in the light of two indexes, themselves the product of two
different approaches.
The first is based on the idea that the quality of research is to be measured by its ‘impact’ in the
scientific community and that this, in turn, is to be measured by the number of citations. In most
cases measurement of impact is in terms of the numerousness of citations of the journal where the
article is published. The most famous example is the Impact Factor4 which, as readers will probably
know, was formulated by the ISI (Institute for Scientific Information) Web of Science, initially as
indicator of the importance of the journal for library purchase decisions, but subsequently to
1 We wish to express our gratitude for comments and suggestions to Alberto Baccini, Adriano Birolo, Carlo d’Ippoliti, Annalisa Rosselli, Giordano Sivini, Patrizia Tiberi Vipraio, the participants in a workshop held at the University of Modena and Udine, and a workshop organised by the Storia dell’Economia Politica (STOREP) at Alessandria, where earlier drafts of this paper were presented. The comments and suggestions of an anonymous referee have proved particularly useful.
2 The CUN has requested that in the coming CIVR five-year research evaluation programme (2004-2008) “peer review
evaluation of a selected number of products should be accompanied by bibliometric indexes recognised at international level, also making use of appropriate databases, where possible uniform at the national level” (CUN Telematic Bulletin, n. 42 – 5 and 6 May 2009). Actually, the VQR 2004-2008 guidelines make no explicit reference to bibliometric indicators, simply pointing out “two methodologies: a) analysis of citations (where applicable), made directly by each Panel, using for the purpose databases agreed upon with the CIVR; b) peer review by external experts chosen collectively by the Panel (normally no more than two), whose task it is to provide anonymous comment on the quality of the publications selected”. http://www.civr.miur.it/vqr_decreto.html
3 See “The open letter on evaluation of research in the economic disciplines”, signed by a group of Italian economists (by 24-05-09 it had received 128 signatures), expressing dissent over “research evaluation systems based on indirect indicators, evaluating individual contributions to research on the basis of the journal in which they are published.” http://www.letteraapertavalutazionericerca.it/
4 The Impact Factor is calculated thus: for example, IF 2009 for a given journal is the ratio between the number of
citations received in 2009 and the number of articles published by the journal in the previous two years (2007 and 2008).
3
become (especially in the biomedical disciplines) progressively also a measure of the quality of
research products. Recently, however, thanks to the arrival on the scene of search engines like
Google Scholar, able to track down citations rapidly, the possibility is now at hand to calculate the
impact of individual articles, with the constraint, of course, of the citations actually present in the
underlying database. It was, for example, the criterion of quality measured by impact that guided
the choice of products to be sent to the CIVR in the Italian University assessment programme 2001-
2003, mainly of articles published in journals with a high Impact Factor.5
The second approach, on the other hand, makes reference to the weights to be attributed by the
evaluators to the individual products of research, on the basis of certain characteristics (place and
publication typology), from which weighted indexes of numerousness (number of publications,
weighted according to their ‘importance’) are drawn for individuals or academic aggregations. The
difficulty is, of course, to come to some agreement on which and how many weights are to be
attributed (for example, number of co-authors, number of pages, whether the article was published
in the journal or in a book of collected articles, etc.); although the possibility is not ruled out of
using impact indicators like the numerousness of citations, this approach does not determine the
‘quality’ of a product or journal solely on the basis of the citations received.
We may take as an example of weighted numerousness the CUN proposal6 of ‘minimum requisites’
for admission to the various levels of the academic career: it identifies the number of publications,
how many must satisfy the requisite of “having been published in journals having considerable
scientific importance”, how many “of international standing” and with “publishers who make
transparent, documented use of the services of anonymous, independent referees”, and with the
constraint of having been produced within a set interval of time7. However, the requisites of
5 The Chairman of Panel 13, Franco Peracchi, had this comment to make on the results: “On average, the papers in
journals with IF receive higher evaluations, the chapters in a book lower evaluations. It can be demonstrated that, for
papers in journals with IF the probability of receiving a judgement of "Good" or "Excellent" grows with the IF of the
journal”. http://www.lavoce.info/dossier/pagina2173.html. For an analysis of the CIVR evaluation procedure see Corsi-
D’Ippoliti and Lucidi 2010.
6 http://www.scribd.com/doc/9698886/Requisiti-Minimi-CUN-26-Dic-2008.
7 Within area 13 these constraints are, for researchers, at least 1-2 publications in the last 3 years (according to the date
of award of doctorate), for associated professors at least 6 in the last five years, and for full professors at least 10 in the
last eight years. As regards the context of publication constraint -“journals of considerable scientific importance” and,
4
“considerable scientific importance” and “international standing” for the journal are not defined.
These criteria leave discretional margins open, and apparently attest to a failure to reach consensus
on the way to measure the “importance” of a journal, the classification at present available having
been constructed on different criteria producing non-convergent rankings8.
Similarly, for evaluation of publications the VQR 2004-2008 guidelines make reference “to analysis
of the citations (where applicable), conducted directly by each Panel, using to this end the databases
agreed upon with the CIVR”, but fail to specify the method to calculate the numerousness of
citations and how to apply it (whether to the publication itself or where it appears).
These examples offer elegant evidence of the expediency of discussing the issue starting from a
preliminary knowledge of the data regarding the relevant population, and of the limitations and
advantages of adopting a bibliometric index or some other and comparing the results. Such is the
purpose of the present paper: we will make use of two databases, Econlit and Google Scholar, to
describe the characteristics of Italy’s academic economists, and we will use two indicators to
evaluate their scientific production: the h index created by Jorge E. Hirsh in 2005 and the
EconlitNumber, an index of weighted numerousness constructed by ourselves (Marcuzzo-Zacchia
2007). Both measure quality, but on the basis of two different approaches: the first, h index,
attributes importance to the numerousness of citations of research products, adjusted according to
the number of products themselves. The second, EconlitNumber, attributes importance to the
numerousness of publications, adjusted according to the weights ascribed to them.
In section 2 we search the two databases, Econlit and Google Scholar, for data on the numerousness
of publications, supplemented with search in Google Libri; in section 3 we compare the two
indexes, h and Econlit, while section 4 sets out some findings and on the evaluation of individual
production and construction of the ranking of structures, i.e. Faculties and Departments. In the final
section we set out our conclusions.
among these, those of “international standing”- the numbers are: for associated professor (2.1) and for full professor (4.
2).
8 For an extensive review of the literature, see Baccini 2010.
5
2. “Italy’s academic economists according to Econlit and Google Scholar”
The first step in our investigation is to survey how much and what has been published; as will be
seen, these apparently simple data are influenced by the database consulted. We will begin, then, by
describing the scientific production of the today’s academic economists making use of two different
databases: Econlit and Google Scholar.
The universes for analysis are the permanent staff of full professors, associate professors and
researchers as of 31/01/20079 in the scientific discipline sectors SECS-P/01-SECS-P/06 according
to the Cineca-MIUR database. In all there are 1606 economists, including 43.8% full professors,
28.7% associate professors and 27.5% researchers. Women account for only 25.4% of the universe:
13.1% full professors, 27.2% associate professors and 41.5% researchers.
Econlit is one of the most complete databases used in the economic field, bringing together papers
published in journals, dissertations, monographic studies, proceedings of conferences and working
papers regarding all the fields of economic research. It offers wide geographical coverage (for the
journals 65 countries are represented), an ample time to span (starting from 1969) and it is updated
on a monthly basis. For our data-processing we drew on the Econlit database for July 2007, a year
in which 1215 journals were represented, including 46 Italian publications.
Google Scholar is a search engine that can be used to identify texts of various types including
articles, graduate and doctorate theses, books, reviews and working papers10 in all the sectors of
9 We used data updated to 2007 (for academic economists the Cineca Miur updated to 31/01/2007 and for publications
the Econlit database consulted between February/April 2007). The choice of the universe of Italian academic
economists on permanent staff as of 31/01/2007 was dictated by the need for continuity with the previous work (see
Marcuzzo, Zacchia 2007), but the universe has so far remained essentially unchanged. The academics on permanent
staff as of 31/12/2009 had increased by about 7%; the distribution between positions was practically the same, the
largest group represented by full professors (40.5%) followed by researchers (33.5%) and, finally, associated professors
(26%). However, there was a considerable increase in the number of researchers as compared with full and associate
professors. There were 1526 identical names in the two versions of the CINECA database (2007 and 2009) accounting
for 88% of the universe as a of 31/12/2009. Of the 202 new names present in 2009, 80.2% were researchers. On the
other hand, 80 names were present in 2007 but no longer in 2009, most of these (43.4%) being full professors no longer
active.
10 Actually, the coverage of working papers (May 2010) was limited to 267 series, mainly American. For Italy were
entered only those of Sant’Anna and the University of Trento. REPEC entered 2407.
6
scientific research. Since 2004 – the year when the two information technology engineers Alex
Verstak and Anurag Acharya launched Google Scholar, this search engine has, with the agreement
of the publishers, been providing links to the entire texts of scientific articles in a vast number of
publications and disciplines. For each single text, the number of citations received is calculated and
access is provided to the series of texts containing the citations. Despite the limitations of the
algorithm (see Noruzi, 2005) and coverage (the search engine can only recognise digitalised texts),
Google Scholar today stands as one of the richest databases in terms of citations, albeit not totally
reliable; for example, titles and citations are occasionally to be found in Google Libri that do not
appear in Google Scholar11.
To ensure that the records deriving from the two databases be comparable, we consulted Google
Scholar through the Publish and Perish program (freeware available on the web in 2006,
programmed by Anne Will Harzing of the University of Melbourne), which enables users to delimit
the time span of research and narrow down the discipline area. For our purposes we drew on data
limited to the areas of Business, Administration, Finance and Economics (which we will call
BAFE) together with a broader set that also included publications in Social Science and Humanities
(SSH). A preliminary point to be made here is that the calculation of publications is vitiated by a
great many inaccuracies for authors with two first names or two surnames in both the Econlit and
Google Scholar databases, occasionally resulting in underestimation of the effective number of
publications by the authors concerned. Moreover, there are many errors in the classification of
publications by field of discipline, again resulting in underestimated figures. In some cases, for
example, Publish or Perish came up with a lower number of publications than were obtained with
direct consultation of Google Scholar.
The first major division within the universes is between those who have publications in the
databases considered and those who have none in the period from 1969 to the present day. As can
be seen in Tables 1 and 2, for Google Scholar we have two indexes, according as to whether the
publications belong only to Business, Administration and Finance in Publish or Perish (googleBAFE)
or there are also publications in Social Science and Humanities ( googleSSH).
11 For example, a book in Italian by one of the two authors of this paper is cited by a text in English, but the citation was
detected only by Google Libri, while Google Scholar gave only the title of the Italian book and not the source of
citation. In Publish or Perish the record (title of the Italian book) is simply missing.
7
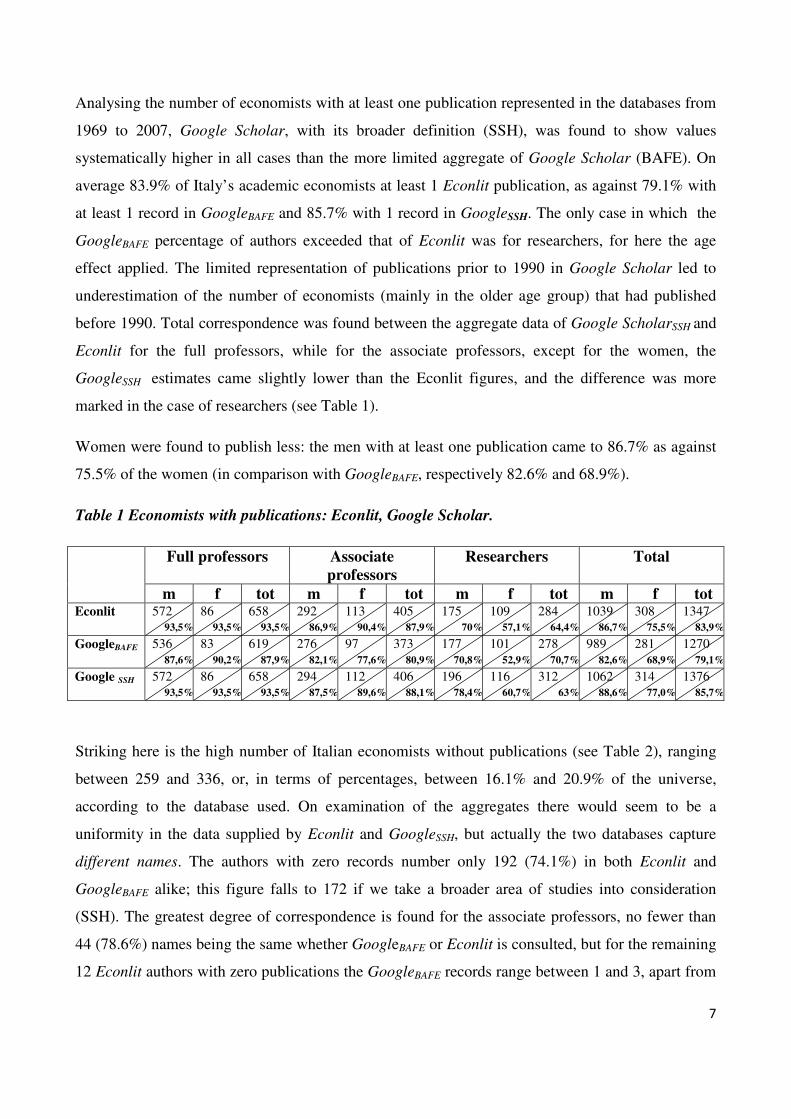
Analysing the number of economists with at least one publication represented in the databases from
1969 to 2007, Google Scholar, with its broader definition (SSH), was found to show values
systematically higher in all cases than the more limited aggregate of Google Scholar (BAFE). On
average 83.9% of Italy’s academic economists at least 1 Econlit publication, as against 79.1% with
at least 1 record in GoogleBAFE and 85.7% with 1 record in GoogleSSH. The only case in which the
GoogleBAFE percentage of authors exceeded that of Econlit was for researchers, for here the age
effect applied. The limited representation of publications prior to 1990 in Google Scholar led to
underestimation of the number of economists (mainly in the older age group) that had published
before 1990. Total correspondence was found between the aggregate data of Google ScholarSSH and
Econlit for the full professors, while for the associate professors, except for the women, the
GoogleSSH estimates came slightly lower than the Econlit figures, and the difference was more
marked in the case of researchers (see Table 1).
Women were found to publish less: the men with at least one publication came to 86.7% as against
75.5% of the women (in comparison with GoogleBAFE, respectively 82.6% and 68.9%).
Table 1 Economists with publications: Econlit, Google Scholar.
Full professors Associate
professors
Researchers Total
m f tot m f tot m f tot m f tot Econlit 572
93,5%
86 93,5%
658 93,5%
292 86,9%
113 90,4%
405 87,9%
175 70%
109 57,1%
284 64,4%
1039 86,7%
308 75,5%
1347 83,9%
GoogleBAFE 536 87,6%
83 90,2%
619 87,9%
276 82,1%
97 77,6%
373 80,9%
177 70,8%
101 52,9%
278 70,7%
989 82,6%
281 68,9%
1270 79,1%
Google SSH 572 93,5%
86 93,5%
658 93,5%
294 87,5%
112 89,6%
406 88,1%
196 78,4%
116 60,7%
312 63%
1062 88,6%
314 77,0%
1376 85,7%
Striking here is the high number of Italian economists without publications (see Table 2), ranging
between 259 and 336, or, in terms of percentages, between 16.1% and 20.9% of the universe,
according to the database used. On examination of the aggregates there would seem to be a
uniformity in the data supplied by Econlit and GoogleSSH, but actually the two databases capture
different names. The authors with zero records number only 192 (74.1%) in both Econlit and
GoogleBAFE alike; this figure falls to 172 if we take a broader area of studies into consideration
(SSH). The greatest degree of correspondence is found for the associate professors, no fewer than
44 (78.6%) names being the same whether GoogleBAFE or Econlit is consulted, but for the remaining
12 Econlit authors with zero publications the GoogleBAFE records range between 1 and 3, apart from
8
the exception of one author with 34 publications. On the other hand the names correspond for 40
authors using GoogleSSH. In the case of researchers a correspondence of 73.9% was found for the
GoogleBAFE names (116) and 66.9% for GoogleSSH (105). Although Table 2 shows perfect
correspondence between the Econlit and GoogleSSH data for full professors, the correspondence
actually applies to only 27 names (59%).
Table 2 Economists with no publications: Econlit, Google Scholar.
Full professors Associate
professors
Researchers Total
m f tot m f tot m f tot m f tot Econlit 40
6,5%
6 6,5%
46 6,5%
44 13,1%
12 9,6%
56 12,1%
75 30%
82 42,9%
157 35,6%
159 13,3%
100 24,5%
259 16,1%
GoogleBAFE 76 12,5%
9 9,8%
85 12,1%
60 17,9%
28 22,4%
88 19,1%
73 29,2%
90 47,1%
163 37%
209 17,4%
127 31,1%
336 20,9%
GoogleSSH 40 6,5%
6 6,5%
46 6,5%
42 12,5%
13 10,4%
55 11,9%
54 21,6%
75 39,3%
129 29,3%
136 11,4%
94 23,0%
230 14,3%
There are some cases in which Google Scholar fails to capture publications that are, however, to be
seen in Econlit; for example, 58 authors who appear to have had no publications on consulting
GoogleSSH, come up with between 1 and 4 records in Econlit. This group consists of 24 researchers,
15 associate professors and 19 ordinary professors; on analysing the publications appearing in
Econlit but not in Google Scholar, almost all the articles were found to have been published in
Italian journals; this applies to the associate professors for whom 50% (12 cases out of 24) of the
articles were published after 1990, all in Italian journals. For the full professors, too, in all cases
with three exceptions of books and one article, the publications that appear in Econlit but not in
Google are accounted for by articles published in Italian journals, mostly subsequent to 1990. It is
also interesting to consider the case of researchers who should have been favoured by use of Google
Scholar instead of the Econlit database: actually, there were as many as 24 researchers who, while
having a record registered in Econlit were not captured by the web. Here too the publications are
accounted for by articles in Italian journals, and in 30 cases out of 39 other recent publication,
between 1990 and 2007, including 18 published between 2000 and 2007.
And yet the contrary situation was also observed: in no fewer than 87 cases the authors showed at
least one record in GoogleSSH but zero in Econlit; as one might have expected, researchers
accounted for the overwhelming majority here (19 full professors, 16 associated professors and 52
researchers).
9
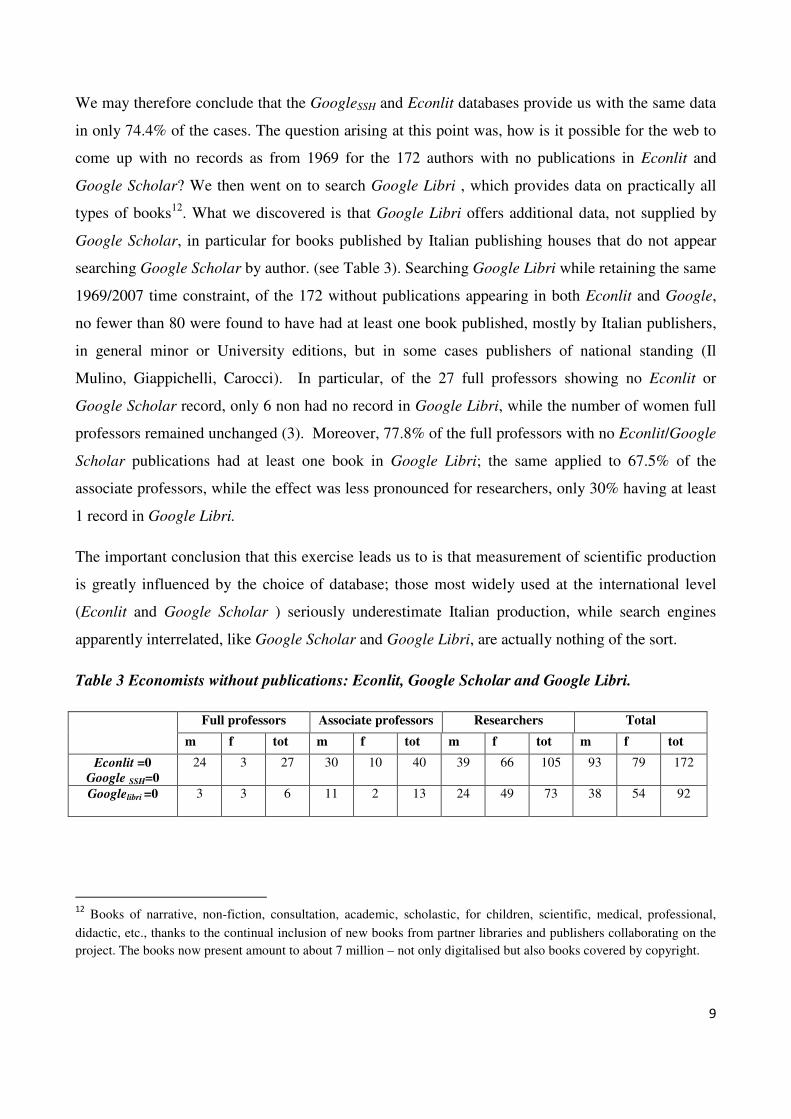
We may therefore conclude that the GoogleSSH and Econlit databases provide us with the same data
in only 74.4% of the cases. The question arising at this point was, how is it possible for the web to
come up with no records as from 1969 for the 172 authors with no publications in Econlit and
Google Scholar? We then went on to search Google Libri , which provides data on practically all
types of books12. What we discovered is that Google Libri offers additional data, not supplied by
Google Scholar, in particular for books published by Italian publishing houses that do not appear
searching Google Scholar by author. (see Table 3). Searching Google Libri while retaining the same
1969/2007 time constraint, of the 172 without publications appearing in both Econlit and Google,
no fewer than 80 were found to have had at least one book published, mostly by Italian publishers,
in general minor or University editions, but in some cases publishers of national standing (Il
Mulino, Giappichelli, Carocci). In particular, of the 27 full professors showing no Econlit or
Google Scholar record, only 6 non had no record in Google Libri, while the number of women full
professors remained unchanged (3). Moreover, 77.8% of the full professors with no Econlit/Google
Scholar publications had at least one book in Google Libri; the same applied to 67.5% of the
associate professors, while the effect was less pronounced for researchers, only 30% having at least
1 record in Google Libri.
The important conclusion that this exercise leads us to is that measurement of scientific production
is greatly influenced by the choice of database; those most widely used at the international level
(Econlit and Google Scholar ) seriously underestimate Italian production, while search engines
apparently interrelated, like Google Scholar and Google Libri, are actually nothing of the sort.
Table 3 Economists without publications: Econlit, Google Scholar and Google Libri.
Full professors Associate professors Researchers Total
m f tot m f tot m f tot m f tot
Econlit =0
Google SSH=0
24 3 27 30 10 40 39 66 105 93 79 172
Googlelibri =0 3
3
6
11
2
13
24
49
73
38
54
92
12
Books of narrative, non-fiction, consultation, academic, scholastic, for children, scientific, medical, professional,
didactic, etc., thanks to the continual inclusion of new books from partner libraries and publishers collaborating on the project. The books now present amount to about 7 million – not only digitalised but also books covered by copyright.
10
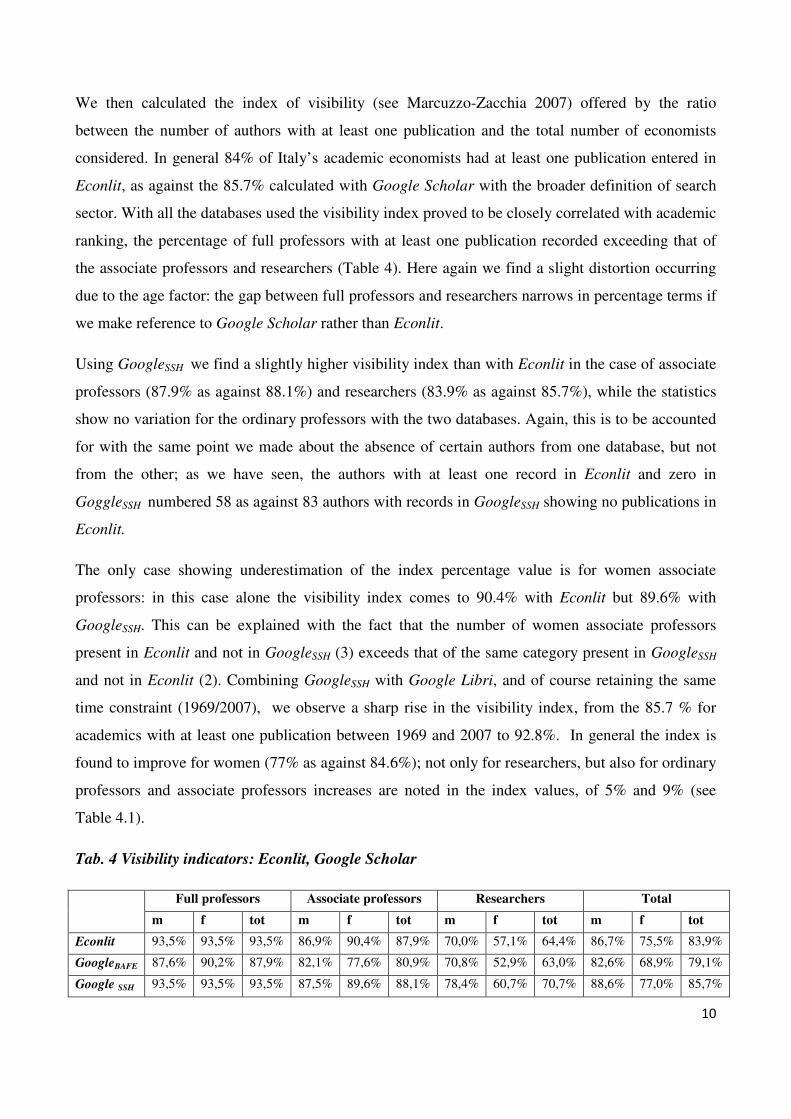
We then calculated the index of visibility (see Marcuzzo-Zacchia 2007) offered by the ratio
between the number of authors with at least one publication and the total number of economists
considered. In general 84% of Italy’s academic economists had at least one publication entered in
Econlit, as against the 85.7% calculated with Google Scholar with the broader definition of search
sector. With all the databases used the visibility index proved to be closely correlated with academic
ranking, the percentage of full professors with at least one publication recorded exceeding that of
the associate professors and researchers (Table 4). Here again we find a slight distortion occurring
due to the age factor: the gap between full professors and researchers narrows in percentage terms if
we make reference to Google Scholar rather than Econlit.
Using GoogleSSH we find a slightly higher visibility index than with Econlit in the case of associate
professors (87.9% as against 88.1%) and researchers (83.9% as against 85.7%), while the statistics
show no variation for the ordinary professors with the two databases. Again, this is to be accounted
for with the same point we made about the absence of certain authors from one database, but not
from the other; as we have seen, the authors with at least one record in Econlit and zero in
GoggleSSH numbered 58 as against 83 authors with records in GoogleSSH showing no publications in
Econlit.
The only case showing underestimation of the index percentage value is for women associate
professors: in this case alone the visibility index comes to 90.4% with Econlit but 89.6% with
GoogleSSH. This can be explained with the fact that the number of women associate professors
present in Econlit and not in GoogleSSH (3) exceeds that of the same category present in GoogleSSH
and not in Econlit (2). Combining GoogleSSH with Google Libri, and of course retaining the same
time constraint (1969/2007), we observe a sharp rise in the visibility index, from the 85.7 % for
academics with at least one publication between 1969 and 2007 to 92.8%. In general the index is
found to improve for women (77% as against 84.6%); not only for researchers, but also for ordinary
professors and associate professors increases are noted in the index values, of 5% and 9% (see
Table 4.1).
Tab. 4 Visibility indicators: Econlit, Google Scholar
Full professors Associate professors Researchers Total
m f tot m f tot m f tot m f tot
Econlit 93,5% 93,5% 93,5% 86,9% 90,4% 87,9% 70,0% 57,1% 64,4% 86,7% 75,5% 83,9%
GoogleBAFE 87,6% 90,2% 87,9% 82,1% 77,6% 80,9% 70,8% 52,9% 63,0% 82,6% 68,9% 79,1%
Google SSH 93,5% 93,5% 93,5% 87,5% 89,6% 88,1% 78,4% 60,7% 70,7% 88,6% 77,0% 85,7%
11
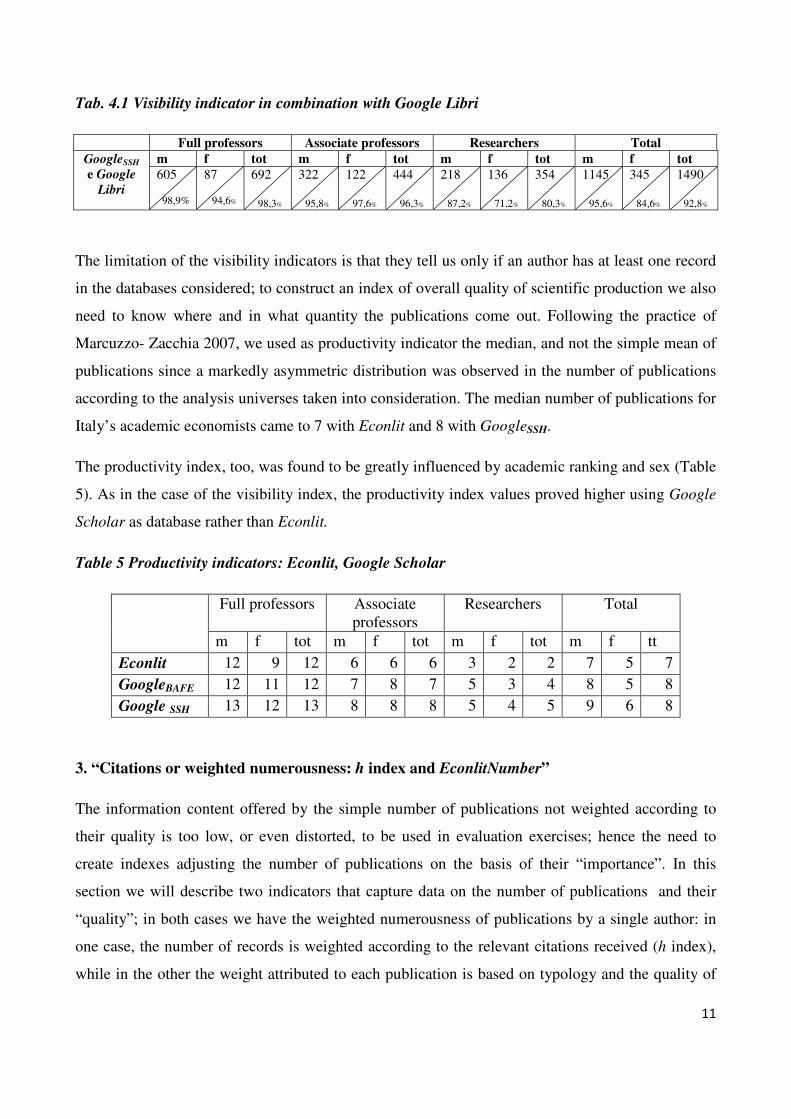
Tab. 4.1 Visibility indicator in combination with Google Libri
Full professors Associate professors Researchers Total
GoogleSSH
e Google
Libri
m f tot m f tot m f tot m f tot
605 98,9%
87 94,6%
692 98,3%
322 95,8%
122 97,6%
444 96,3%
218 87,2%
136 71,2%
354 80,3%
1145 95,6%
345 84,6%
1490 92,8%
The limitation of the visibility indicators is that they tell us only if an author has at least one record
in the databases considered; to construct an index of overall quality of scientific production we also
need to know where and in what quantity the publications come out. Following the practice of
Marcuzzo- Zacchia 2007, we used as productivity indicator the median, and not the simple mean of
publications since a markedly asymmetric distribution was observed in the number of publications
according to the analysis universes taken into consideration. The median number of publications for
Italy’s academic economists came to 7 with Econlit and 8 with GoogleSSH.
The productivity index, too, was found to be greatly influenced by academic ranking and sex (Table
5). As in the case of the visibility index, the productivity index values proved higher using Google
Scholar as database rather than Econlit.
Table 5 Productivity indicators: Econlit, Google Scholar
Full professors Associate professors
Researchers Total
m f tot m f tot m f tot m f tt Econlit 12 9 12 6 6 6 3 2 2 7 5 7 GoogleBAFE 12 11 12 7 8 7 5 3 4 8 5 8 Google SSH 13 12 13 8 8 8 5 4 5 9 6 8
3. “Citations or weighted numerousness: h index and EconlitNumber”
The information content offered by the simple number of publications not weighted according to
their quality is too low, or even distorted, to be used in evaluation exercises; hence the need to
create indexes adjusting the number of publications on the basis of their “importance”. In this
section we will describe two indicators that capture data on the number of publications and their
“quality”; in both cases we have the weighted numerousness of publications by a single author: in
one case, the number of records is weighted according to the relevant citations received (h index),
while in the other the weight attributed to each publication is based on typology and the quality of
12
the journal/ publishing house where the publications appeared (EconlitNumber). Let us begin with a
brief description of the two indexes so that the positive and negative aspects of each may be
apparent.
The h index
The h index, created by Jorge E. Hirsh (2005), is defined thus: a researcher has an h index if
amongst all her/her papers published, amounting to N, there are h that have at least h citations each,
while the remaining papers, N-h, have at the most h citations each.13 This index is rapidly gaining
ground in the scientific world, to the extent that the ISI Web of Science recently included it among
the significant parameters in the Citation Report which the Web of Science provides by author, and
also in Scopus, which calculates the h index of each author. With the Publish or Perish program,
which we made use of in the previous section the this paper, it is possible to calculate the h index of
authors and number of citations of single publications in just a few seconds. Today the h index is
the bibliometric index most simply and rapidly calculated with a free software program.
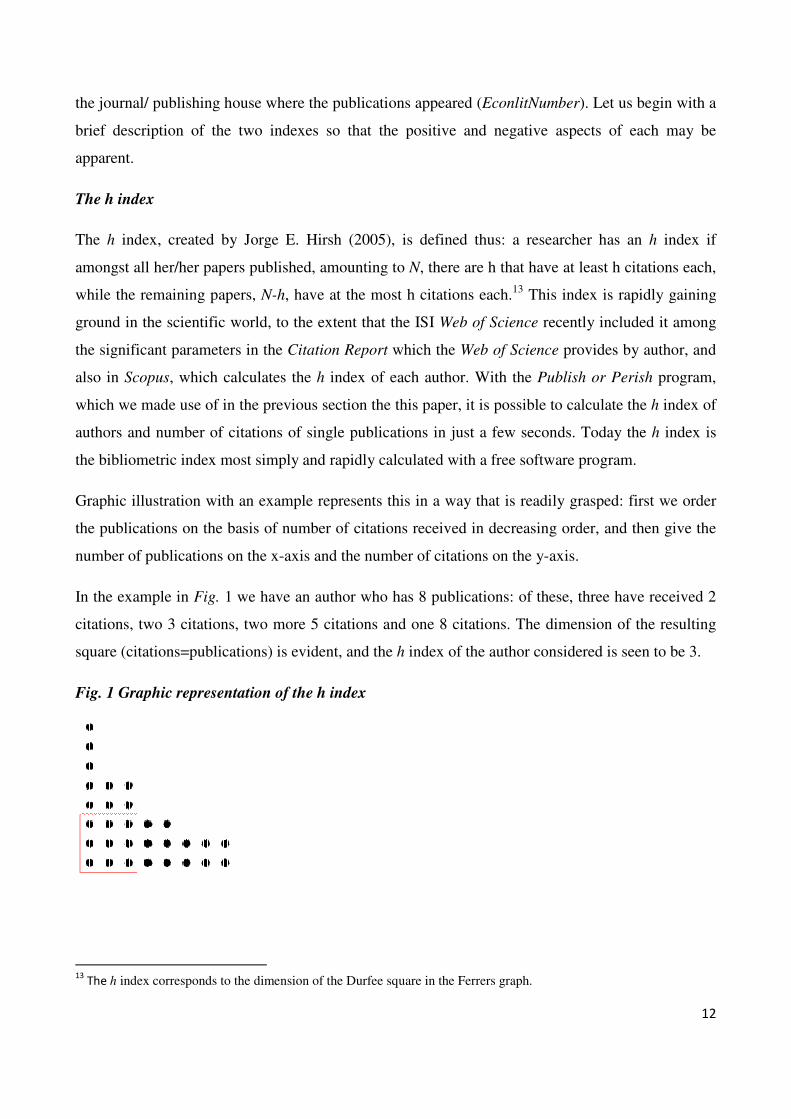
Graphic illustration with an example represents this in a way that is readily grasped: first we order
the publications on the basis of number of citations received in decreasing order, and then give the
number of publications on the x-axis and the number of citations on the y-axis.
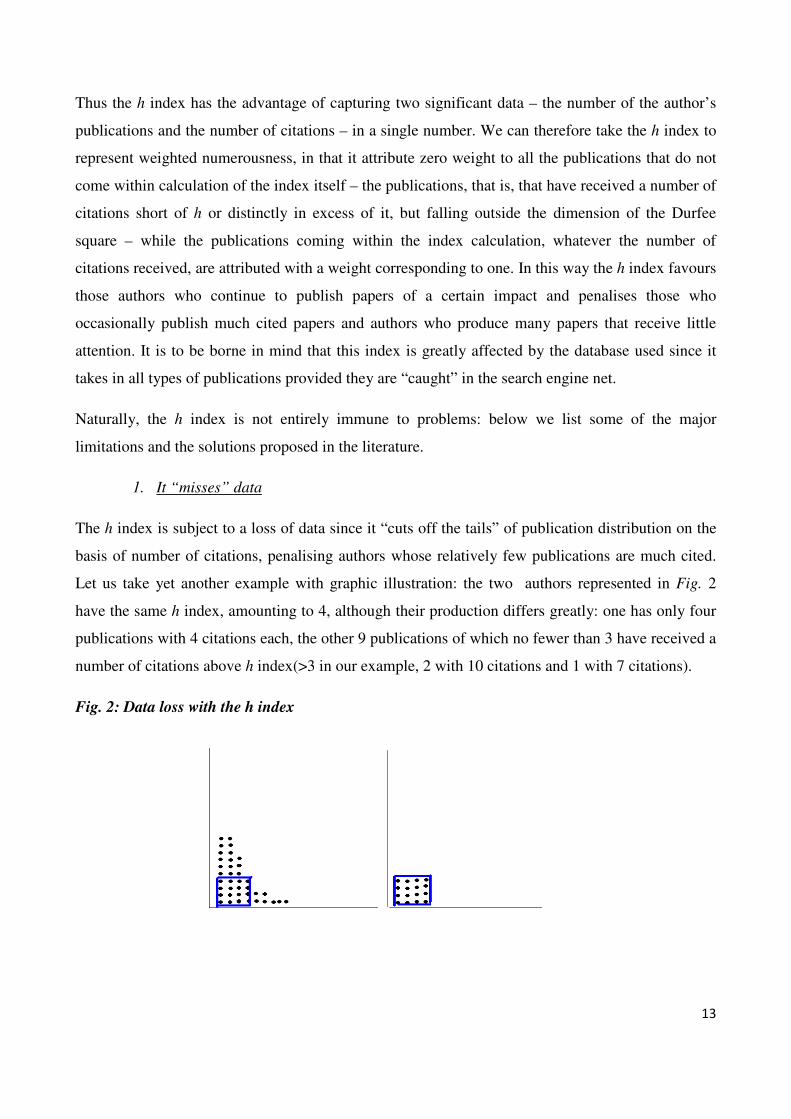
In the example in Fig. 1 we have an author who has 8 publications: of these, three have received 2
citations, two 3 citations, two more 5 citations and one 8 citations. The dimension of the resulting
square (citations=publications) is evident, and the h index of the author considered is seen to be 3.
Fig. 1 Graphic representation of the h index
13
The h index corresponds to the dimension of the Durfee square in the Ferrers graph.
13
Thus the h index has the advantage of capturing two significant data – the number of the author’s
publications and the number of citations – in a single number. We can therefore take the h index to
represent weighted numerousness, in that it attribute zero weight to all the publications that do not
come within calculation of the index itself – the publications, that is, that have received a number of
citations short of h or distinctly in excess of it, but falling outside the dimension of the Durfee
square – while the publications coming within the index calculation, whatever the number of
citations received, are attributed with a weight corresponding to one. In this way the h index favours
those authors who continue to publish papers of a certain impact and penalises those who
occasionally publish much cited papers and authors who produce many papers that receive little
attention. It is to be borne in mind that this index is greatly affected by the database used since it
takes in all types of publications provided they are “caught” in the search engine net.
Naturally, the h index is not entirely immune to problems: below we list some of the major
limitations and the solutions proposed in the literature.
1. It “misses” data
The h index is subject to a loss of data since it “cuts off the tails” of publication distribution on the
basis of number of citations, penalising authors whose relatively few publications are much cited.
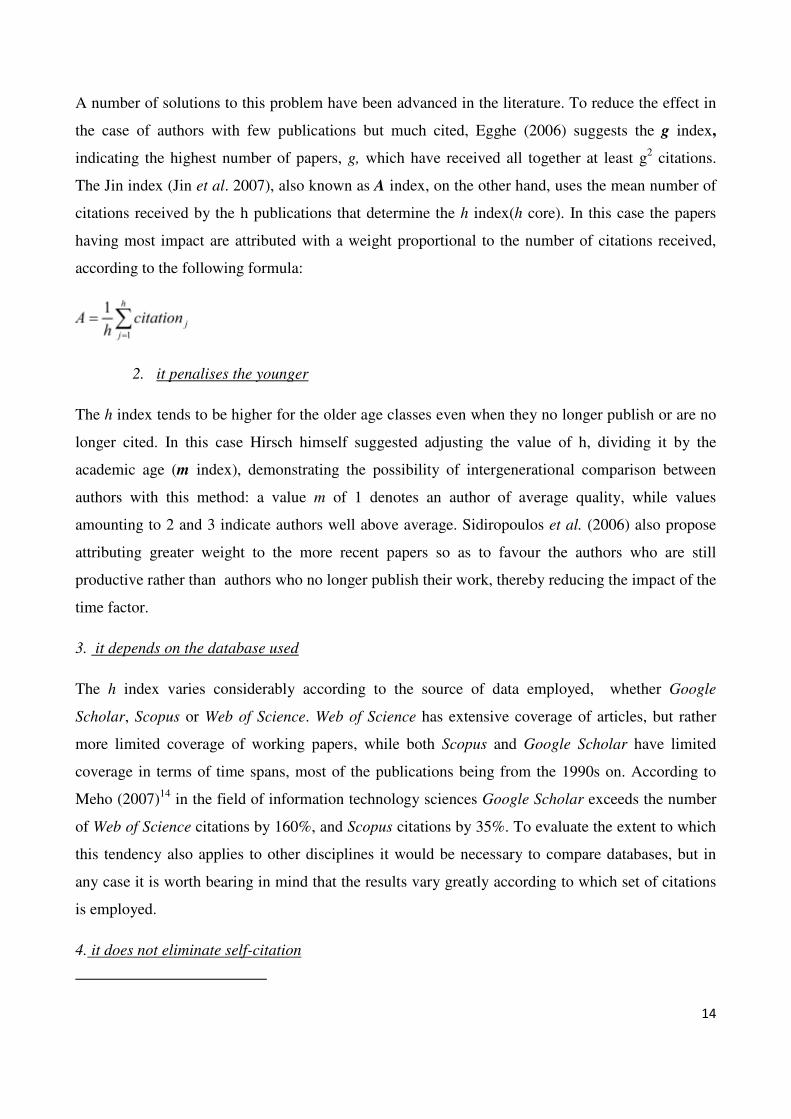
Let us take yet another example with graphic illustration: the two authors represented in Fig. 2
have the same h index, amounting to 4, although their production differs greatly: one has only four
publications with 4 citations each, the other 9 publications of which no fewer than 3 have received a
number of citations above h index(>3 in our example, 2 with 10 citations and 1 with 7 citations).
Fig. 2: Data loss with the h index
14
A number of solutions to this problem have been advanced in the literature. To reduce the effect in
the case of authors with few publications but much cited, Egghe (2006) suggests the g index,
indicating the highest number of papers, g, which have received all together at least g2 citations.
The Jin index (Jin et al. 2007), also known as A index, on the other hand, uses the mean number of
citations received by the h publications that determine the h index(h core). In this case the papers
having most impact are attributed with a weight proportional to the number of citations received,
according to the following formula:
2. it penalises the younger
The h index tends to be higher for the older age classes even when they no longer publish or are no
longer cited. In this case Hirsch himself suggested adjusting the value of h, dividing it by the
academic age (m index), demonstrating the possibility of intergenerational comparison between
authors with this method: a value m of 1 denotes an author of average quality, while values
amounting to 2 and 3 indicate authors well above average. Sidiropoulos et al. (2006) also propose
attributing greater weight to the more recent papers so as to favour the authors who are still
productive rather than authors who no longer publish their work, thereby reducing the impact of the
time factor.
3. it depends on the database used
The h index varies considerably according to the source of data employed, whether Google
Scholar, Scopus or Web of Science. Web of Science has extensive coverage of articles, but rather
more limited coverage of working papers, while both Scopus and Google Scholar have limited
coverage in terms of time spans, most of the publications being from the 1990s on. According to
Meho (2007)14 in the field of information technology sciences Google Scholar exceeds the number
of Web of Science citations by 160%, and Scopus citations by 35%. To evaluate the extent to which
this tendency also applies to other disciplines it would be necessary to compare databases, but in
any case it is worth bearing in mind that the results vary greatly according to which set of citations
is employed.
4. it does not eliminate self-citation
15
In calculating the h index citations of national paper are take into consideration regardless of
whether they are self-citations or negative citations, the criterion being “so long as they are talked
about”. However, Meho (2007) has calculated the h index for information technology sciences with
and without self-citation, finding that in most cases the index value shows no difference.
5. it does not take co-authors into account
Since self-citations are included in calculation of the h index, co-authors have a greater advantage
than authors who publish alone. For example, Persson et al. (2008) found a significant correlation
between the number of researcher’s co-authors and the mean number of citations per year. One
solution has been advanced by Batista et al. (2005),who divide the h index by the mean number of
authors of the h publications that determine it.
6. it does not lend itself to comparison between different areas of disciplines
Given the very considerable difference between the average numbers of publications in the
individual areas of disciplines, interdisciplinary comparison of h indexes is not significant, unless
the values are normalised to reflect the average numerousness of citations in the various disciplines
(see van Raan 2005 and Podlubny 2005).
Thus the h index has the advantage of summing two such significant data as the number of
publications and a number of citations received, allowing for international comparison of the
scientific production of authors of various nationalities. Nevertheless, the identification between
quality and the number of citations gives rise to various problems – as listed above – and in
particular the h index can grow over the years not only because publications have been produced
but also because the citations have multiplied. For example, an author may no longer be publishing
but still seeing his/her h index increasing over the years because his/her “old” papers are cited.
Moreover, citations gradually accumulate in the course of time, and a certain period of time must
therefore go by as from the date of publication to be able to count them.
EconlitNumber
EconlitNumber is a weighted productivity index designed to adjust in terms of “quality” the simple
number of publications obtained searching the Econlit database by author. In this case “quality” is
not identified with the number of citations received, as in the case of the h index, and it has a
twofold connotation. On the one hand it takes into account the effort required for each type of
product, attributing different weights according to the publication typology: consequently books
16
will have a greater weight than articles, and articles in turn more weight than working papers. On
the other hand, the quality of the edition in which the publication appears is also taken into account,
measured on the basis of the rankings of journals and publishing houses produced in the literature
not with the use of bibliometric indexes alone, but combined with peer review.
In this way the EconlitNumber of each author would be calculated thus:
( ) ( ) ( )
⋅+
⋅⋅+
⋅⋅= ∑∑∑
i
i
gi
gig
ji
jij WPBAberEconlitNum βγβδβ,,
For each product i, whether an article (A), book (B) or working paper (WP), ββββ is the weight
attributed to each typology, δδδδ is the quality coefficient attributed to each journal j, and γγγγ is the
quality coefficient attributed to each publishing house g.
EconlitNumber provides in simple and summary form the data found for evaluation of the
quality/quantity of research in economics. The problem is to identify the numerical value to be
attributed to each of the single weights: here we offer some examples:
β = can sum three values according to the publication typology: 1.5 for a monographic study, 1/2 in
the case of a paper in a journal or volume of collected papers, 1/5 for working papers15.
γ = quality of the publishing house; for classification choice fell on the University of Utrecht
Classification Scheme – CERES Ranking of Publishers in Economics16; � can take on 6 values
according to the classification of the University of Utrecht, ranging from 1 in the case of a publisher
entered in class A to 1/6 for publishers not appearing in the list of publishing houses.
15 For the working papers it is not possible to weigh on the basis of the quality of the context in which published. However, we attribute a low weight to working papers in line with the choices of various Italian universities, as in the research evaluation exercise carried out by the faculty of economics of the University of Florence and of Ca’ Foscari. In the case of the EconlitNumber the weight of working papers amounts to the minimum value that the index can show in the case of a paper published in a journal absent from the CNRS 2008 ranking http://www.gate.cnrs.fr/spip.php?article198&lang=fr 16 http://www.keele.ac.uk/depts/ec/cer/documents/CERESlist.pdf Classification of the publishing houses covers 5 categories (from A to E) according as to whether the publishing house has a transparent referee mechanism; publishers having no such mechanism are given weight D in the case of publishers for academic readership, E for non-academic readership.
17
δ = following the model adopted by the French National Committee for Scientific Research (CNRS
2008) in classifying economics and management journals 17 we adopt not a ranking but a range of
journals18; δ �can therefore take on 6 values according to the CNRS classification, ranging from 1.5
(CNRS 1*) to 1/5 for all publications in journals not included in the CNRS list. Here we decided to
adopt a scale above the publishing house scale since we believe that an article published in a journal
considered among the most prestigious must have greater weight than an article appearing in a
volume of collected articles brought out by one of the best publishers.
The EconlitNumber has the advantage of summing with a single number various data that can
provide a multilateral definition of the “quality” of the publication, not limited to the number of
citations received but also taking into account the effort and the quality of the context in which the
work was published.
Non-identification of quality with the number of citations received also avoids the problem of the
temporal mismatch penalising the younger authors, who obviously have fewer citations: in
calculating the EconlitNumber all the publications are considered and weighed according to the
typology and quality of the edition in which they are published. This, in fact, is a further advantage,
since there is no data loss as in the case of the h index. Moreover, the EconlitNumber also registers
continuity of production over time, which makes it more appropriate for exercises to define the
minimum thresholds of scientific production.
Obviously, the EconlitNumber it is not immune to criticism either: here we list the major limitations
to be noted:
1. it summarises too many data
The virtue of being a multi-dimensional measure of scientific production is also its major defect:
summarising a quantity of data, the risk with the EconlitNumber is that the datum of measurement 17
Comité National de la Recherche Scientifique, Catégorisation des revues en Économie et en Gestion, has a classifications in 5 categories (from 1*, excellent, to 4) of economic and marketing journals in English and French (696 in total), on the basis of impact (and thus of bibliometric indexes), the judgement of experts in the disciplinary sector, and scientific reputation, on the basis of data provided by, for example, Econlit and the Social Citation Index. http://www.gate.cnrs.fr/spip.php?article198&lang=fr
18 In the CNRS report (CNRS - Classement des revues 2008) it is stressed that the work is not a ranking but subdivision of the journals into categories: “Dans l’interprétation de la liste, il importe de garder à l’esprit qu’au sein de chacune des quatre catégories ordonnées que nous avons distinguées il subsiste une certaine variabilité en terme de qualité. C’est pourquoi nous employons le mot «catégorisation » plutôt que classement”.
18
of “quality” in the strictest sense (here defined in terms of where the publication appears) may be
lost sight of.
2. highly dependent on weights
The index is greatly affected by the rankings of the journals and publishing houses used; there is
also the problem of weighing the journals/books with “temporally” compatible rankings: it would
be perfectly useless to weigh publications of the 1970s on the basis of rankings of recent
journals/publishing houses since the quality of journals/publishing houses can also change in the
course of time. It is therefore necessary to apply rankings adjusted to the date of publication of the
records.
3. it penalises writers of books mostly not in the English language
Since Econlit this is the standard database for calculation of the EconlitNumber, the authors of
books in Italian brought out by Italian publishing houses are penalised. However, the
EconlitNumber can easily be integrated with other databases like ESSPER19, the database provided
in portal OPAC, comprising mostly books in Italian and small monographic studies, and of course
Google Libri, which captures the production of Italian economists not surveyed by Econlit nor
indeed by Google Scholar20. By doing so we can construct an EconNumber for each economist for
the chosen time span that takes into account all the publications not appearing in Econlit.
3. it fails to take into account the number of co-authors:
Calculation of the Nel EconlitNumber fails to take into account the presence of co-authors, but this
datum can easily be added adjusting the EconlitNumber with a weight amounting to 1/n, n being the
number of co-authors.
4. It does not serve for comparison between different disciplinary areas
EconlitNumber is an index of academic production applied solely in economics, therefore allowing
for comparison only within the area of the economic sciences. However, the index is of use for
international comparison since the relevant database includes publications of various nationalities.
19 Launched in 1996, it contains articles from Italian journals.
20 An example of EconNumber construction can be seen in Marcuzzo- Zacchia (2007).
19
4. “Evaluating” Italy’s academic economists: h index and EconlitNumber compared
In this section we will use the EconlitNumber and h index (applied to the broader SSH area) to
“evaluate” Italian academic economists holding permanent positions as of 31/01/2007.
We calculated the two indexes taking reference from publications appearing between 2004 and
2006 for two reasons: firstly, to produce results that would be comparable with the first report on
evaluation of scientific research for the three-year period 2001-2003 drawn up by the Committee for
Evaluation of Research (CIVR), and secondly in order to be able to use rankings of journals and
publishing houses neither too “far” from those of the publications taken into consideration nor,
however, too “near”. In fact, for the purpose of our exercise in weighting publications produced
between 2004 and 2006 in the EconlitNumber we made use of the ranking of journals by the CNRS
drawn up in 2008 and, for the publishing houses, the 2007 University of Utrecht ranking produced
to evaluate university research activities.
For the h index, too, there were good reasons for choosing the three-year period 2004-2006 since
this index is greatly influenced by the year of publication given that the chances of being cited
increase over time; in fact, we chose to consider a period of between 5 and 3 years from the date of
publication (the h index was calculated in 2009), so as not to favour full professors while penalising
the younger economists.21
As we have seen, Google Scholar captured a greater number of publications in the 2004/2006 time
span than Econlit: on average, Google Scholar captured 4.95 publications per author while Econlit
detected less than half that number – only 1.99 publications per economist. Moreover, Google
Scholar succeeds better in capturing the publications of the younger economists; using Econlit
researchers are found to have 60.96% fewer publications than full professors, while the gap narrows
to 42.55% using Google Scholar as database.
On average, the h index for academic economists for the period 2004/2006 comes to 1.68, which
means that between 2004 and 2006 each author on average had more than one publication cited at
least once. The average EconlitNumber comes to 0.43; this value is compatible with a combination
of different publications: with 3 papers in the low range of the CNRS ranking and 1 working paper,
for example, or 3 papers, two of which in a journal in the middle range and 1 in a journal of the low
21
According to the calculations by Checchi and Jappelli (2008), the “h index tends to be one point higher every eight years of scientific activity”.
20
range, or, again, 1 book brought out by a middle-range publisher and 2 papers, 1 in a middle-range
journal and 1 in a low range.
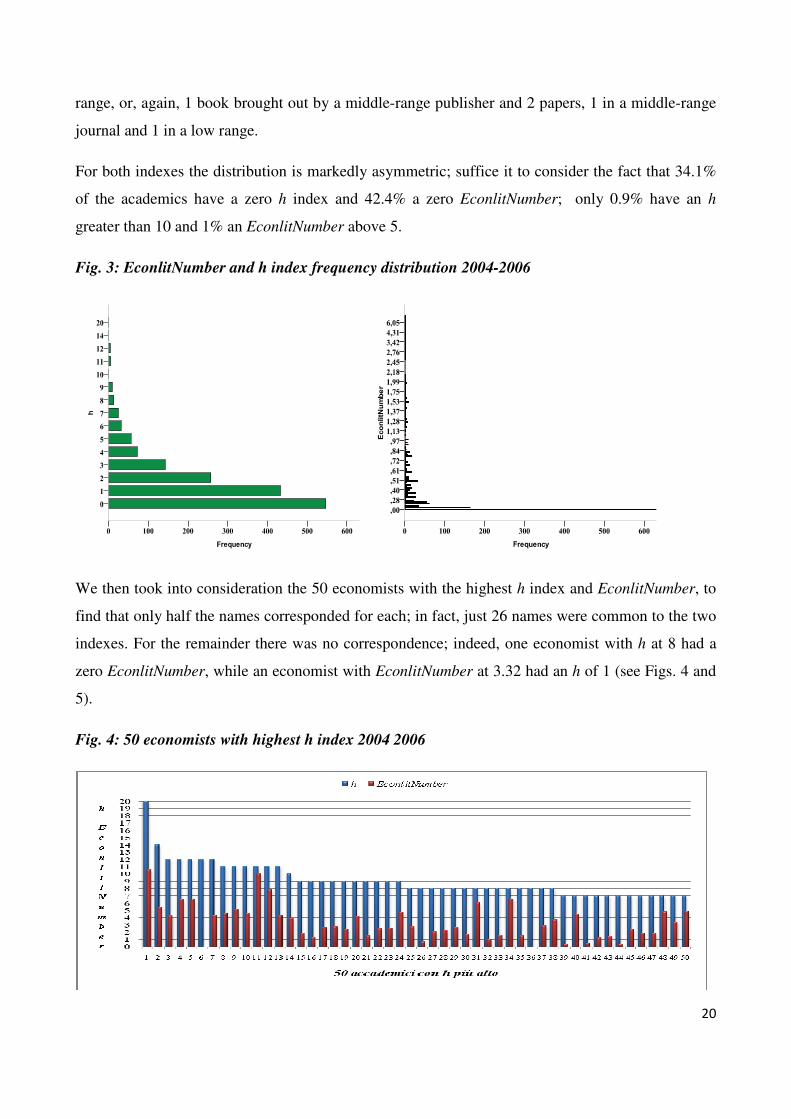
For both indexes the distribution is markedly asymmetric; suffice it to consider the fact that 34.1%
of the academics have a zero h index and 42.4% a zero EconlitNumber; only 0.9% have an h
greater than 10 and 1% an EconlitNumber above 5.
Fig. 3: EconlitNumber and h index frequency distribution 2004-2006
We then took into consideration the 50 economists with the highest h index and EconlitNumber, to
find that only half the names corresponded for each; in fact, just 26 names were common to the two
indexes. For the remainder there was no correspondence; indeed, one economist with h at 8 had a
zero EconlitNumber, while an economist with EconlitNumber at 3.32 had an h of 1 (see Figs. 4 and
5).
Fig. 4: 50 economists with highest h index 2004 2006
21
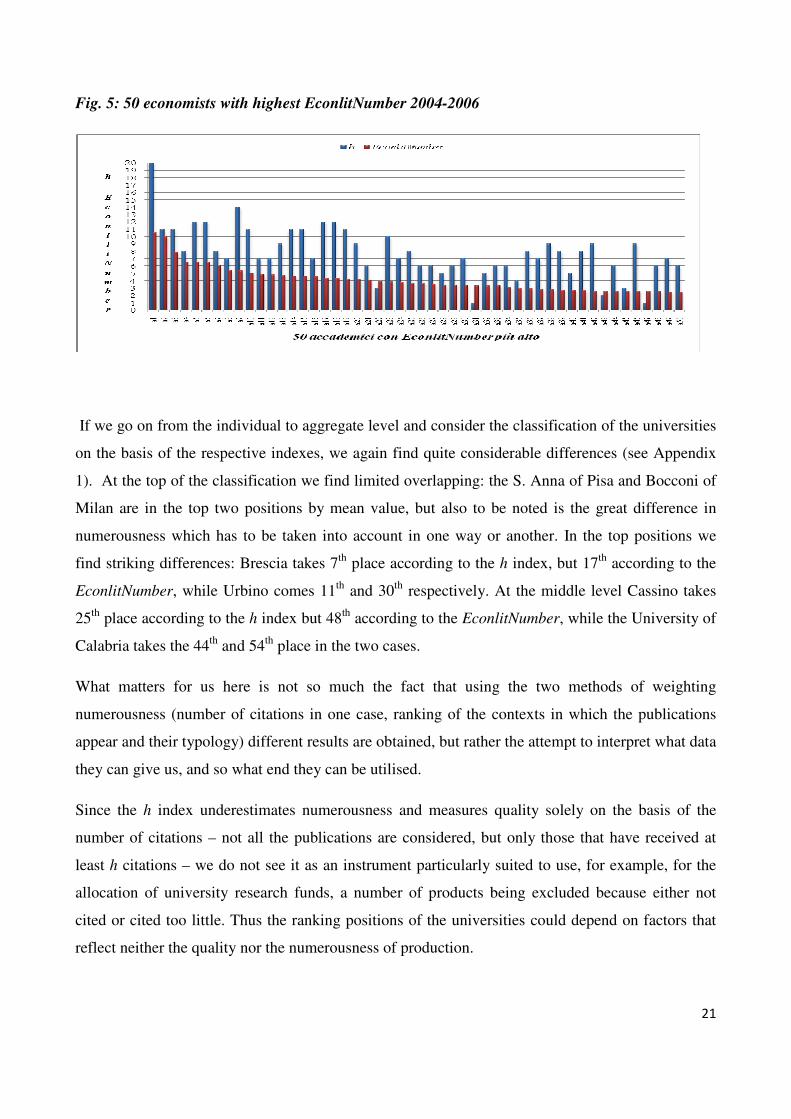
Fig. 5: 50 economists with highest EconlitNumber 2004-2006
If we go on from the individual to aggregate level and consider the classification of the universities
on the basis of the respective indexes, we again find quite considerable differences (see Appendix
1). At the top of the classification we find limited overlapping: the S. Anna of Pisa and Bocconi of
Milan are in the top two positions by mean value, but also to be noted is the great difference in
numerousness which has to be taken into account in one way or another. In the top positions we
find striking differences: Brescia takes 7th place according to the h index, but 17th according to the
EconlitNumber, while Urbino comes 11th and 30th respectively. At the middle level Cassino takes
25th place according to the h index but 48th according to the EconlitNumber, while the University of
Calabria takes the 44th and 54th place in the two cases.
What matters for us here is not so much the fact that using the two methods of weighting
numerousness (number of citations in one case, ranking of the contexts in which the publications
appear and their typology) different results are obtained, but rather the attempt to interpret what data
they can give us, and so what end they can be utilised.
Since the h index underestimates numerousness and measures quality solely on the basis of the
number of citations – not all the publications are considered, but only those that have received at
least h citations – we do not see it as an instrument particularly suited to use, for example, for the
allocation of university research funds, a number of products being excluded because either not
cited or cited too little. Thus the ranking positions of the universities could depend on factors that
reflect neither the quality nor the numerousness of production.
22
EconlitNumber shows a certain arbitrariness in the choice of weights, but proves better suited for
use in allocation of resources and definition of “minimum requisites” for individuals or
Departments, even simply in terms of differences from a mean value for facilities of equal
dimensions.
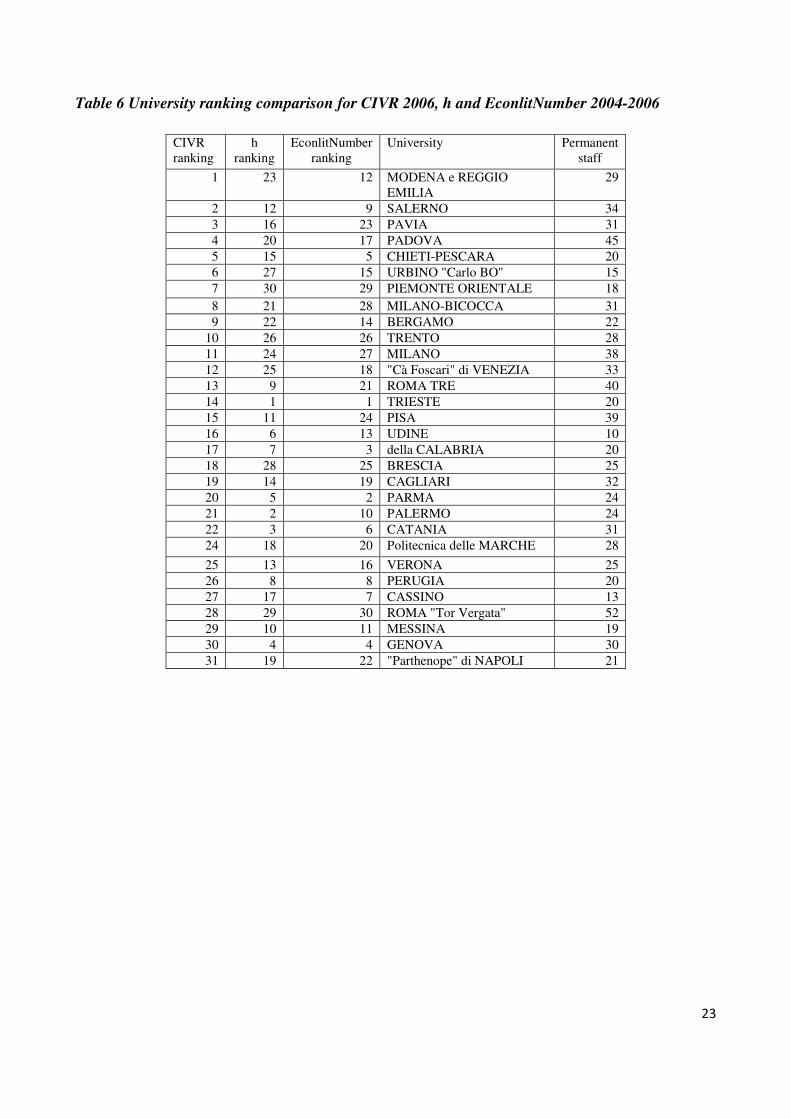
To evaluate the usefulness of these two indexes in constructing facility classifications, we attempted
comparison with the CIVR ranking for area 13. Despite the different methodology used and the
different time span for the publications considered, if we reallocate the individual universities in the
CIVR categories (mega, a large, medium and small dimensions) we can attempt to compare the
rankings. To offer but one example, considering the top of the CIVR classification of middle-sized
universities (between 10 and 24 products), Modena and Reggio Emilia, among the 31 universities of
its class, drops to 23rd place for h, and 12th for EconlitNumber (see Table 6).
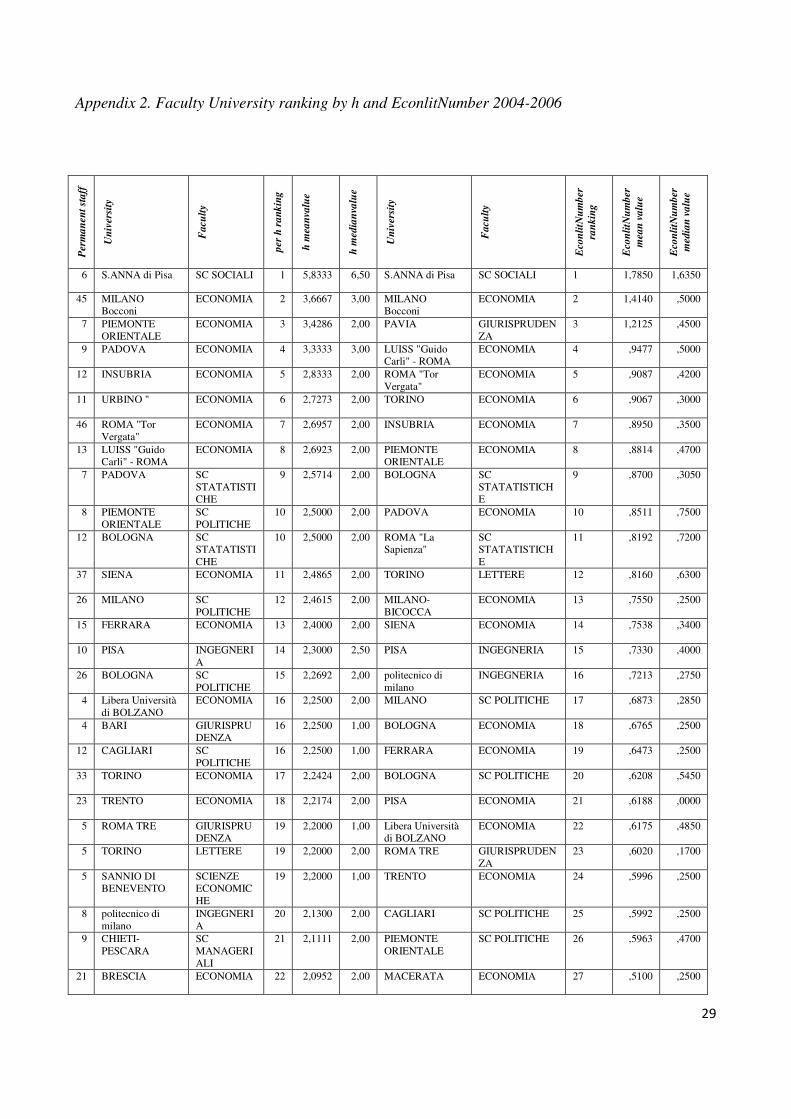
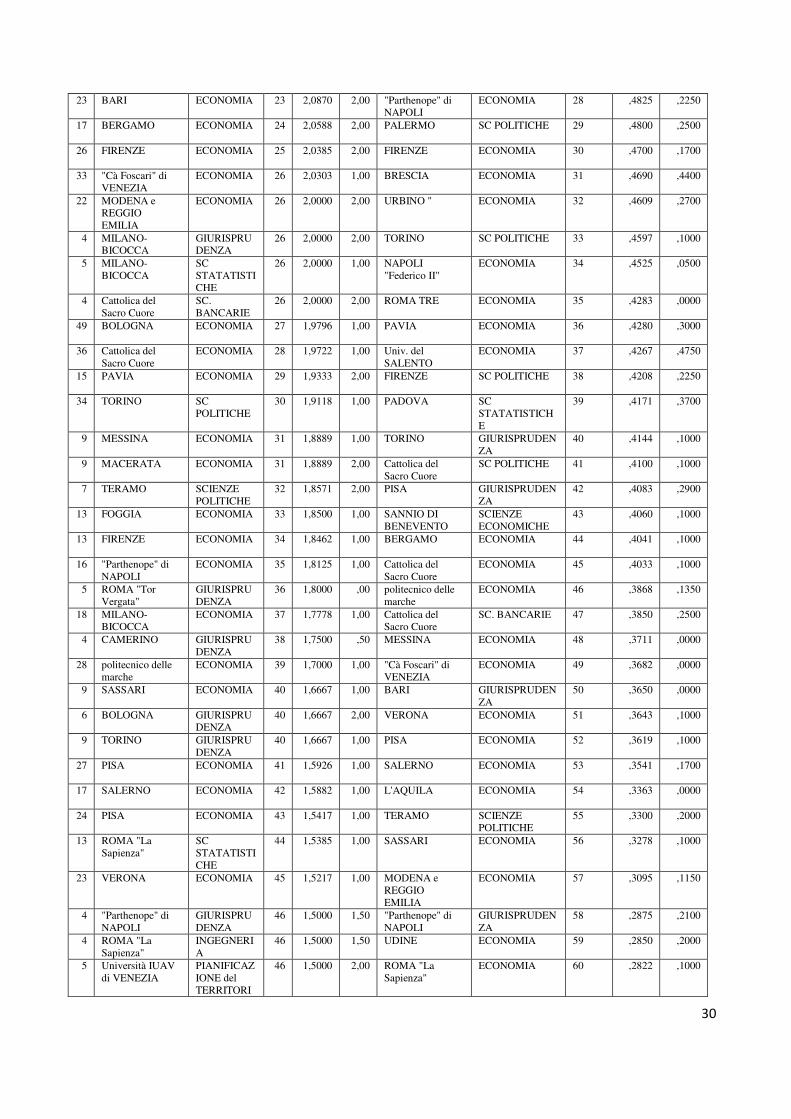
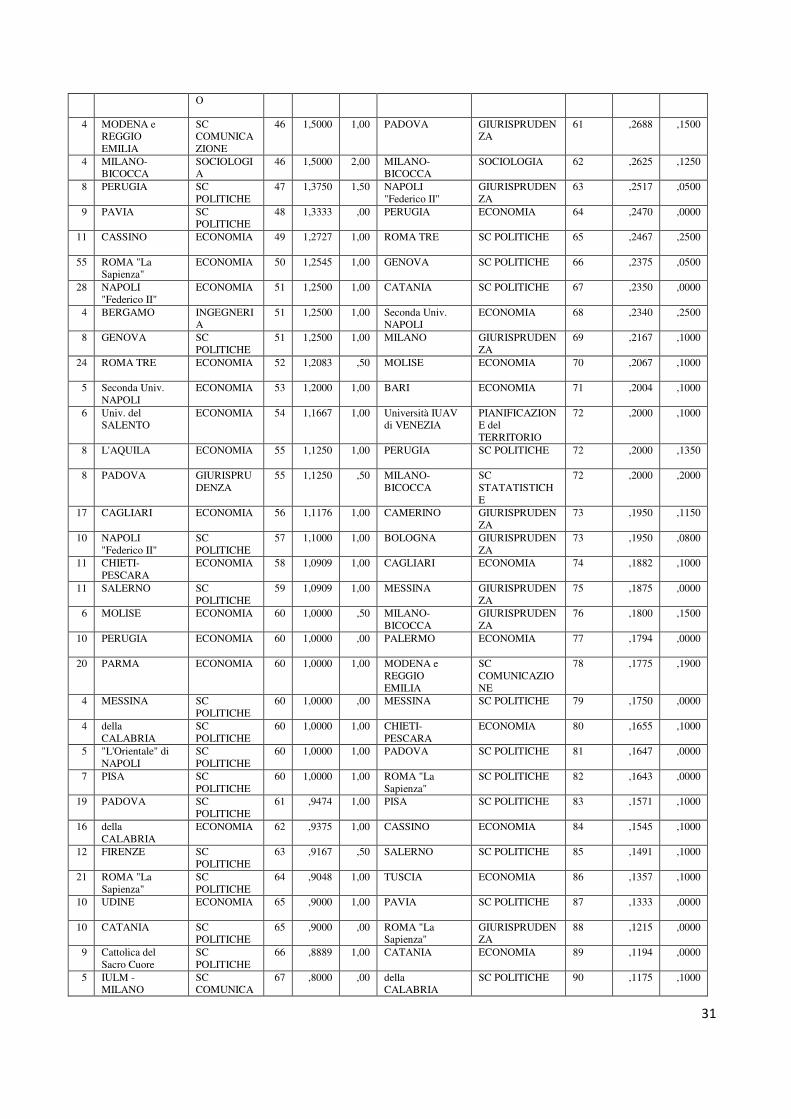
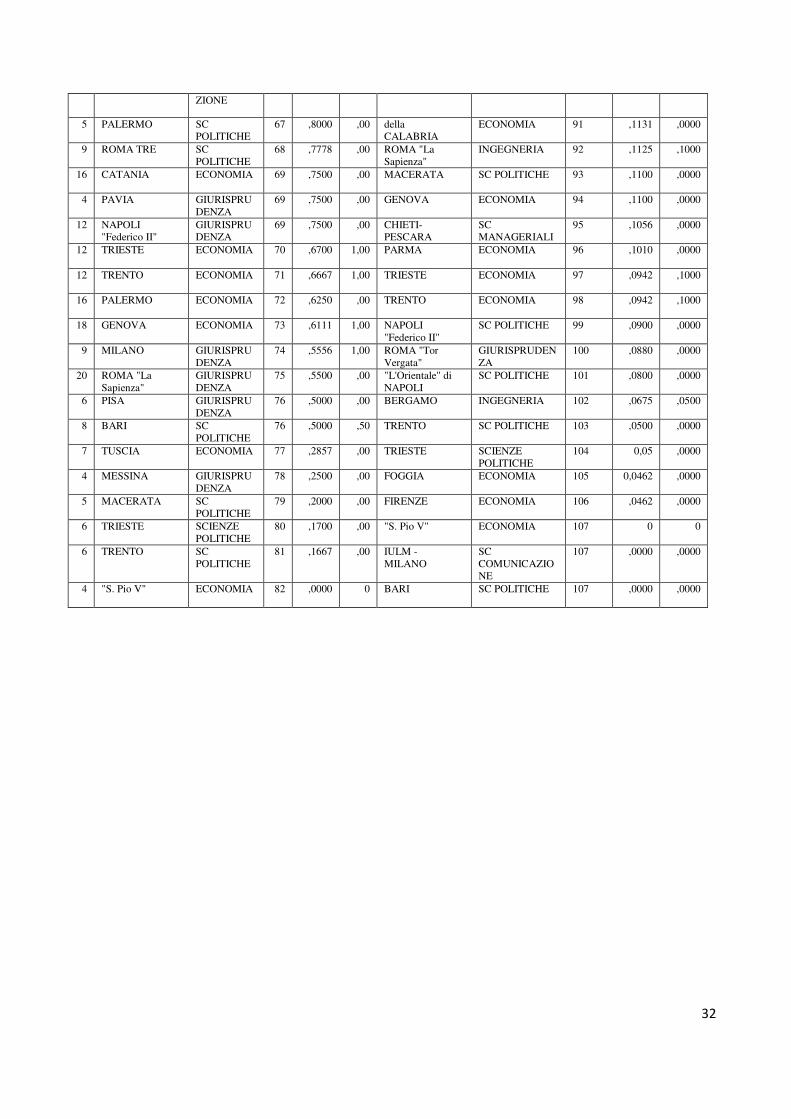
Another interesting aspect is the ranking for faculties rather than universities. Here again the non-
correspondence of the two index orders is confirmed. Statistical Sciences at the Rome University
“Sapienza” holds 11th position for EconLitNumber and 44th for the h index; Economics at Modena
and Reggio Emilia comes 26th for the h index but 57th for EconLitNumber; Economics at Urbino
holds the 6th position for h and the 32nd for EconlitNumber .
If we compare our results with those of Checchi-Jappelli (2008), regarding the publications of full
professors alone (696) on the permanent staff in 2008 with no time constraint, the faculty order
again shows considerable differences apart from the first two places (Social Sciences at Sant’Anna
and Economics at Bocconi). This is further confirmation of the extent to which these classifications
depend on the year of consultation and the relevant population, calling for considerable caution in
interpretation.
23
Table 6 University ranking comparison for CIVR 2006, h and EconlitNumber 2004-2006
CIVR ranking
h ranking
EconlitNumber ranking
University Permanent staff
1 23 12 MODENA e REGGIO EMILIA
29
2 12 9 SALERNO 34 3 16 23 PAVIA 31 4 20 17 PADOVA 45 5 15 5 CHIETI-PESCARA 20 6 27 15 URBINO "Carlo BO" 15 7 30 29 PIEMONTE ORIENTALE 18 8 21 28 MILANO-BICOCCA 31 9 22 14 BERGAMO 22
10 26 26 TRENTO 28 11 24 27 MILANO 38 12 25 18 "Cà Foscari" di VENEZIA 33 13 9 21 ROMA TRE 40 14 1 1 TRIESTE 20 15 11 24 PISA 39 16 6 13 UDINE 10 17 7 3 della CALABRIA 20 18 28 25 BRESCIA 25 19 14 19 CAGLIARI 32 20 5 2 PARMA 24 21 2 10 PALERMO 24 22 3 6 CATANIA 31 24 18 20 Politecnica delle MARCHE 28
25 13 16 VERONA 25 26 8 8 PERUGIA 20 27 17 7 CASSINO 13 28 29 30 ROMA "Tor Vergata" 52 29 10 11 MESSINA 19 30 4 4 GENOVA 30 31 19 22 "Parthenope" di NAPOLI 21
24
5. Some brief conclusions
Numerousness of citations as proxy for the quality of a publication is an extremely limiting
criterion, and the h index, as we have sought to show in its application to Italy’s academic
economists, is not always a reliable bibliometric index. The simplicity of calculation – due to the
availability of free, user-friendly software – should not be an incentive to use it in evaluation
exercises. A simple algorithm recalculating the publications in the MIUR-Cineca file of academics,
attributing the necessary weights, would prove an equally rapid and simple way of obtaining a
broad indicator of the production we wish to evaluate. This weighted numerousness index –
supposing the scientific community is able to come to agreement in general terms on the weight to
attribute to typology and context of publication – would certainly be preferable. In this paper we
have suggested that the EconlitNumber or EconNumber could have more suitable requisites as
bibliometric indicators to use in rankings of Universities, Faculties or Departments.
In future developments in Italy the use of bibliometric indicators for purposes of resource allocation
– human and otherwise – to the university on the basis of research quality is inevitable, and
precisely for this reason it is important that they should be refined so as to prove more useful and
efficacious, and less distorted.
However, we may usefully conclude with an observation by two authors of a recent study: “All
measurements of research quality should be taken with a grain of salt; it is certainly not possible to
describe a scientist’s contributions to a given research field with mere numerical values. As Albert
Einstein famously noted: ‘[n]ot everything that counts is countable, and not everything that’s
countable counts.” (Bornmann et al., 2009. p. 6).
25
Bibliography
Baccini, A. (2010), Valutare la ricerca scientifica. Uso e abuso degli indicatori bibliometrici,
Bologna: Il Mulino.
Batista, P.D., M. Guimaraes Campiteli, O. Kinouchi e Souto Martinez A. (2005), Universal
Behavior of a Research Productivity Index, arXiv:physics/0510142v1 [physics.soc-ph].
Bornmann, L. e H.D. Daniel (2009), The state of h index research. Is the h index the ideal way to
measure research performance? EMBO Reports, pp. 1-6.
Checchi, D. e T. Jappelli (2008), Ricerca per indice H, La voce, 16.12.2008.
Corsi, M., C. D’Ippoliti e F. Lucidi (2010), Pluralism at Risk? Heterodox Economic Approaches
and the Evaluation of Economic Research in Italy, American Journal of Economic and Sociology
forthcoming.
Egghe, L. (2006), An improvement of the H-index: the G-index. ISSI Newsletter, n. 2(1), pp. 8-9.
(https://wiki-sop.inria.fr/wiki/pub/Ce/IndicateurEvaluation/animprovement.pdf ).
Hirsch, J.E. (2005), An Index to Quantify an Individual’s Scientific Research Output. Proceedings
of the National Academy of Sciences, n. 102, pp. 16569-72.
Jin, B. H., L. Liang, R. Rousseau e L. Egghe, (2007), The R- and AR- indices: Complementing the
h-index, Chinese Science Bulletin, n. 52, pp. 855-863 http://dx.doi.org/10.1007/s11434-007-0145-9
Marcuzzo M. C. e G. Zacchia (2007), L' Econlit e gli strumenti per la valutazione della ricerca
economica in Italia, Rivista Italiana degli Economisti, n. 12, pp. 279-310.
Meho, L.I. (2007). The Rise and Rise of Citation Analysis. Physics World, 29(1), 32-36.
(http://dlist.sir.arizona.edu/1703/ )
Noruzi, A. (2005) , Google Scholar: The New Generation of Citation Indexes, Libri, n. 55, pp. 170-
180.
26
Persson, O., Glänzel, W. and Danell, R. (2008). Inflationary Bibliometric Values: The Role of
Scientometric Collaboration and the Need for Relative Indicators in Evaluative Studies.
Scientometrics http://dx.doi.org/10.1023/B:SCIE.0000034384.35498.7d
Podlubny, I. (2005), Comparison of Scientific Impact Expressed by the Number of Citations,
Scientometrics, n. 64, pp. 95-99.
Sidiropoulos, D., A. Katsaros e Y. Manolopoulos (2006), Generalized h-index for Disclosing
Latent Facts in Citation Networks, Scientometrics, n. 72(2), pp. 253-280.
(http://dx.doi.org/10.1007/s11192-007-1722-z )
Van Raan, A.J. (2005), Measurement of Central Aspects of Scientific Research: Performance,
Interdisciplinary, Structure, Measurement, Interdisciplinary Research and Perspectives, n. 3(1),
pp. 1-19.
27
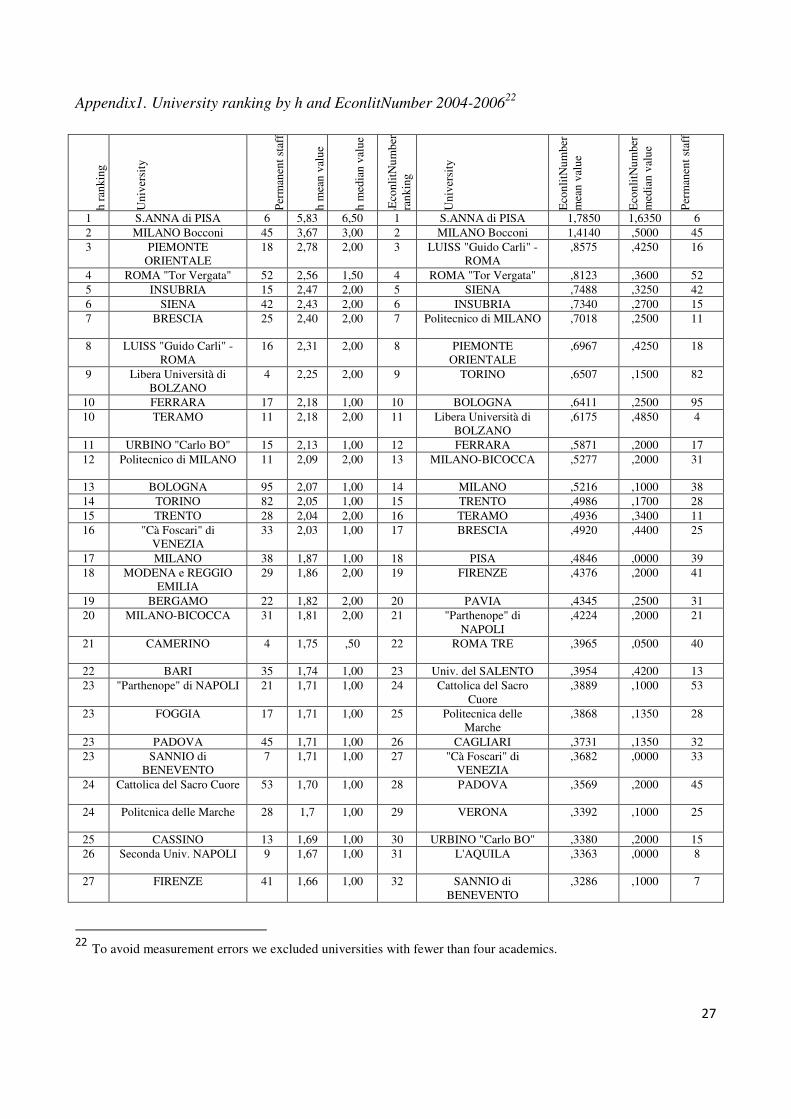
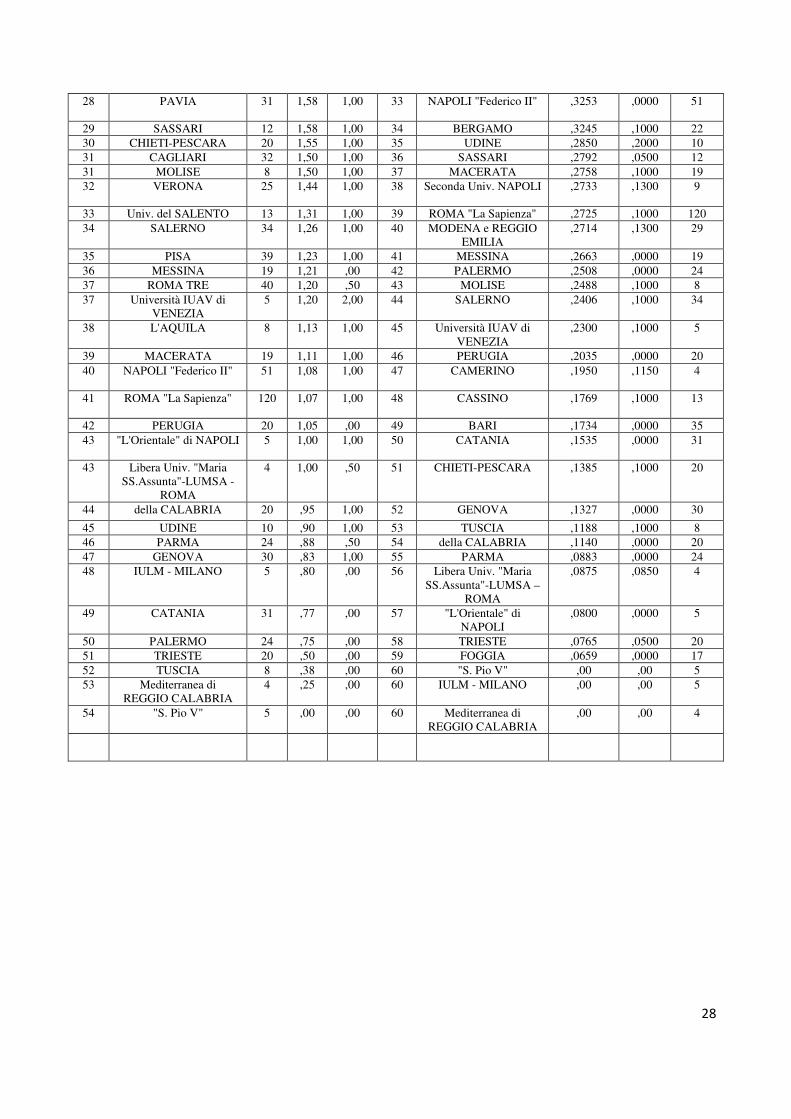
Appendix1. University ranking by h and EconlitNumber 2004-200622
h
rank
ing
Uni
vers
ity
Per
man
ent s
taff
h m
ean
valu
e
h m
edia
n va
lue
rEco
nlit
Num
ber
rank
ing
Uni
vers
ity
Eco
nlit
Num
ber
mea
n va
lue
Eco
nlit
Num
ber
med
ian
valu
e
Per
man
ent s
taff
1 S.ANNA di PISA 6 5,83 6,50 1 S.ANNA di PISA 1,7850 1,6350 6 2 MILANO Bocconi 45 3,67 3,00 2 MILANO Bocconi 1,4140 ,5000 45 3 PIEMONTE
ORIENTALE 18 2,78 2,00 3 LUISS "Guido Carli" -
ROMA ,8575 ,4250 16
4 ROMA "Tor Vergata" 52 2,56 1,50 4 ROMA "Tor Vergata" ,8123 ,3600 52 5 INSUBRIA 15 2,47 2,00 5 SIENA ,7488 ,3250 42 6 SIENA 42 2,43 2,00 6 INSUBRIA ,7340 ,2700 15 7 BRESCIA 25 2,40 2,00 7 Politecnico di MILANO ,7018 ,2500 11
8 LUISS "Guido Carli" - ROMA
16 2,31 2,00 8 PIEMONTE ORIENTALE
,6967 ,4250 18
9 Libera Università di BOLZANO
4 2,25 2,00 9 TORINO ,6507 ,1500 82
10 FERRARA 17 2,18 1,00 10 BOLOGNA ,6411 ,2500 95 10 TERAMO 11 2,18 2,00 11 Libera Università di
BOLZANO ,6175 ,4850 4
11 URBINO "Carlo BO" 15 2,13 1,00 12 FERRARA ,5871 ,2000 17 12 Politecnico di MILANO 11 2,09 2,00 13 MILANO-BICOCCA ,5277 ,2000 31
13 BOLOGNA 95 2,07 1,00 14 MILANO ,5216 ,1000 38 14 TORINO 82 2,05 1,00 15 TRENTO ,4986 ,1700 28 15 TRENTO 28 2,04 2,00 16 TERAMO ,4936 ,3400 11 16 "Cà Foscari" di
VENEZIA 33 2,03 1,00 17 BRESCIA ,4920 ,4400 25
17 MILANO 38 1,87 1,00 18 PISA ,4846 ,0000 39 18 MODENA e REGGIO
EMILIA 29 1,86 2,00 19 FIRENZE ,4376 ,2000 41
19 BERGAMO 22 1,82 2,00 20 PAVIA ,4345 ,2500 31 20 MILANO-BICOCCA 31 1,81 2,00 21 "Parthenope" di
NAPOLI ,4224 ,2000 21
21 CAMERINO 4 1,75 ,50 22 ROMA TRE ,3965 ,0500 40
22 BARI 35 1,74 1,00 23 Univ. del SALENTO ,3954 ,4200 13 23 "Parthenope" di NAPOLI 21 1,71 1,00 24 Cattolica del Sacro
Cuore ,3889 ,1000 53
23 FOGGIA 17 1,71 1,00 25 Politecnica delle Marche
,3868 ,1350 28
23 PADOVA 45 1,71 1,00 26 CAGLIARI ,3731 ,1350 32 23 SANNIO di
BENEVENTO 7 1,71 1,00 27 "Cà Foscari" di
VENEZIA ,3682 ,0000 33
24 Cattolica del Sacro Cuore 53 1,70 1,00 28 PADOVA ,3569 ,2000 45
24 Politcnica delle Marche 28 1,7 1,00 29 VERONA ,3392 ,1000 25
25 CASSINO 13 1,69 1,00 30 URBINO "Carlo BO" ,3380 ,2000 15 26 Seconda Univ. NAPOLI 9 1,67 1,00 31 L'AQUILA ,3363 ,0000 8
27 FIRENZE 41 1,66 1,00 32 SANNIO di BENEVENTO
,3286 ,1000 7
22 To avoid measurement errors we excluded universities with fewer than four academics.
28
28 PAVIA 31 1,58 1,00 33 NAPOLI "Federico II" ,3253 ,0000 51
29 SASSARI 12 1,58 1,00 34 BERGAMO ,3245 ,1000 22 30 CHIETI-PESCARA 20 1,55 1,00 35 UDINE ,2850 ,2000 10 31 CAGLIARI 32 1,50 1,00 36 SASSARI ,2792 ,0500 12 31 MOLISE 8 1,50 1,00 37 MACERATA ,2758 ,1000 19 32 VERONA 25 1,44 1,00 38 Seconda Univ. NAPOLI ,2733 ,1300 9
33 Univ. del SALENTO 13 1,31 1,00 39 ROMA "La Sapienza" ,2725 ,1000 120 34 SALERNO 34 1,26 1,00 40 MODENA e REGGIO
EMILIA ,2714 ,1300 29
35 PISA 39 1,23 1,00 41 MESSINA ,2663 ,0000 19 36 MESSINA 19 1,21 ,00 42 PALERMO ,2508 ,0000 24 37 ROMA TRE 40 1,20 ,50 43 MOLISE ,2488 ,1000 8 37 Università IUAV di
VENEZIA 5 1,20 2,00 44 SALERNO ,2406 ,1000 34
38 L'AQUILA 8 1,13 1,00 45 Università IUAV di VENEZIA
,2300 ,1000 5
39 MACERATA 19 1,11 1,00 46 PERUGIA ,2035 ,0000 20 40 NAPOLI "Federico II" 51 1,08 1,00 47 CAMERINO ,1950 ,1150 4
41 ROMA "La Sapienza" 120 1,07 1,00 48 CASSINO ,1769 ,1000 13
42 PERUGIA 20 1,05 ,00 49 BARI ,1734 ,0000 35 43 "L'Orientale" di NAPOLI 5 1,00 1,00 50 CATANIA ,1535 ,0000 31
43 Libera Univ. "Maria SS.Assunta"-LUMSA -
ROMA
4 1,00 ,50 51 CHIETI-PESCARA ,1385 ,1000 20
44 della CALABRIA 20 ,95 1,00 52 GENOVA ,1327 ,0000 30
45 UDINE 10 ,90 1,00 53 TUSCIA ,1188 ,1000 8 46 PARMA 24 ,88 ,50 54 della CALABRIA ,1140 ,0000 20 47 GENOVA 30 ,83 1,00 55 PARMA ,0883 ,0000 24 48 IULM - MILANO 5 ,80 ,00 56 Libera Univ. "Maria
SS.Assunta"-LUMSA – ROMA
,0875 ,0850 4
49 CATANIA 31 ,77 ,00 57 "L'Orientale" di NAPOLI
,0800 ,0000 5
50 PALERMO 24 ,75 ,00 58 TRIESTE ,0765 ,0500 20 51 TRIESTE 20 ,50 ,00 59 FOGGIA ,0659 ,0000 17 52 TUSCIA 8 ,38 ,00 60 "S. Pio V" ,00 ,00 5 53 Mediterranea di
REGGIO CALABRIA 4 ,25 ,00 60 IULM - MILANO ,00 ,00 5
54 "S. Pio V" 5 ,00 ,00 60 Mediterranea di REGGIO CALABRIA
,00 ,00 4
29
Appendix 2. Faculty University ranking by h and EconlitNumber 2004-2006
Per
ma
nen
t st
aff
Un
iver
sity
Facu
lty
per
h r
an
kin
g
h m
ean
valu
e
h m
edia
nva
lue
Un
iver
sity
Facu
lty
Eco
nli
tNu
mb
er
ran
kin
g
Eco
nli
tNu
mb
er
mea
n v
alu
e
Eco
nli
tNu
mb
er
med
ian
va
lue
6 S.ANNA di Pisa SC SOCIALI 1 5,8333 6,50 S.ANNA di Pisa SC SOCIALI 1 1,7850 1,6350
45 MILANO Bocconi
ECONOMIA
2 3,6667 3,00 MILANO Bocconi
ECONOMIA 2 1,4140 ,5000
7 PIEMONTE ORIENTALE
ECONOMIA
3 3,4286 2,00 PAVIA GIURISPRUDENZA
3 1,2125 ,4500
9 PADOVA ECONOMIA
4 3,3333 3,00 LUISS "Guido Carli" - ROMA
ECONOMIA 4 ,9477 ,5000
12 INSUBRIA ECONOMIA
5 2,8333 2,00 ROMA "Tor Vergata"
ECONOMIA 5 ,9087 ,4200
11 URBINO " ECONOMIA
6 2,7273 2,00 TORINO ECONOMIA 6 ,9067 ,3000
46 ROMA "Tor Vergata"
ECONOMIA
7 2,6957 2,00 INSUBRIA ECONOMIA 7 ,8950 ,3500
13 LUISS "Guido Carli" - ROMA
ECONOMIA
8 2,6923 2,00 PIEMONTE ORIENTALE
ECONOMIA 8 ,8814 ,4700
7 PADOVA SC STATATISTICHE
9 2,5714 2,00 BOLOGNA SC STATATISTICHE
9 ,8700 ,3050
8 PIEMONTE ORIENTALE
SC POLITICHE
10 2,5000 2,00 PADOVA ECONOMIA 10 ,8511 ,7500
12 BOLOGNA SC STATATISTICHE
10 2,5000 2,00 ROMA "La Sapienza"
SC STATATISTICHE
11 ,8192 ,7200
37 SIENA ECONOMIA
11 2,4865 2,00 TORINO LETTERE 12 ,8160 ,6300
26 MILANO SC POLITICHE
12 2,4615 2,00 MILANO-BICOCCA
ECONOMIA 13 ,7550 ,2500
15 FERRARA ECONOMIA
13 2,4000 2,00 SIENA ECONOMIA 14 ,7538 ,3400
10 PISA INGEGNERIA
14 2,3000 2,50 PISA INGEGNERIA 15 ,7330 ,4000
26 BOLOGNA SC POLITICHE
15 2,2692 2,00 politecnico di milano
INGEGNERIA 16 ,7213 ,2750
4 Libera Università di BOLZANO
ECONOMIA
16 2,2500 2,00 MILANO SC POLITICHE 17 ,6873 ,2850
4 BARI GIURISPRUDENZA
16 2,2500 1,00 BOLOGNA ECONOMIA 18 ,6765 ,2500
12 CAGLIARI SC POLITICHE
16 2,2500 1,00 FERRARA ECONOMIA 19 ,6473 ,2500
33 TORINO ECONOMIA
17 2,2424 2,00 BOLOGNA SC POLITICHE 20 ,6208 ,5450
23 TRENTO ECONOMIA
18 2,2174 2,00 PISA ECONOMIA 21 ,6188 ,0000
5 ROMA TRE GIURISPRUDENZA
19 2,2000 1,00 Libera Università di BOLZANO
ECONOMIA 22 ,6175 ,4850
5 TORINO LETTERE 19 2,2000 2,00 ROMA TRE GIURISPRUDENZA
23 ,6020 ,1700
5 SANNIO DI BENEVENTO
SCIENZE ECONOMICHE
19 2,2000 1,00 TRENTO ECONOMIA 24 ,5996 ,2500
8 politecnico di milano
INGEGNERIA
20 2,1300 2,00 CAGLIARI SC POLITICHE 25 ,5992 ,2500
9 CHIETI-PESCARA
SC MANAGERIALI
21 2,1111 2,00 PIEMONTE ORIENTALE
SC POLITICHE 26 ,5963 ,4700
21 BRESCIA ECONOMIA
22 2,0952 2,00 MACERATA ECONOMIA 27 ,5100 ,2500
30
23 BARI ECONOMIA
23 2,0870 2,00 "Parthenope" di NAPOLI
ECONOMIA 28 ,4825 ,2250
17 BERGAMO ECONOMIA
24 2,0588 2,00 PALERMO SC POLITICHE 29 ,4800 ,2500
26 FIRENZE ECONOMIA
25 2,0385 2,00 FIRENZE ECONOMIA 30 ,4700 ,1700
33 "Cà Foscari" di VENEZIA
ECONOMIA
26 2,0303 1,00 BRESCIA ECONOMIA 31 ,4690 ,4400
22 MODENA e REGGIO EMILIA
ECONOMIA
26 2,0000 2,00 URBINO " ECONOMIA 32 ,4609 ,2700
4 MILANO-BICOCCA
GIURISPRUDENZA
26 2,0000 2,00 TORINO SC POLITICHE 33 ,4597 ,1000
5 MILANO-BICOCCA
SC STATATISTICHE
26 2,0000 1,00 NAPOLI "Federico II"
ECONOMIA 34 ,4525 ,0500
4 Cattolica del Sacro Cuore
SC. BANCARIE
26 2,0000 2,00 ROMA TRE ECONOMIA 35 ,4283 ,0000
49 BOLOGNA ECONOMIA
27 1,9796 1,00 PAVIA ECONOMIA 36 ,4280 ,3000
36 Cattolica del Sacro Cuore
ECONOMIA
28 1,9722 1,00 Univ. del SALENTO
ECONOMIA 37 ,4267 ,4750
15 PAVIA ECONOMIA
29 1,9333 2,00 FIRENZE SC POLITICHE 38 ,4208 ,2250
34 TORINO SC POLITICHE
30 1,9118 1,00 PADOVA SC STATATISTICHE
39 ,4171 ,3700
9 MESSINA ECONOMIA
31 1,8889 1,00 TORINO GIURISPRUDENZA
40 ,4144 ,1000
9 MACERATA ECONOMIA
31 1,8889 2,00 Cattolica del Sacro Cuore
SC POLITICHE 41 ,4100 ,1000
7 TERAMO SCIENZE POLITICHE
32 1,8571 2,00 PISA GIURISPRUDENZA
42 ,4083 ,2900
13 FOGGIA ECONOMIA
33 1,8500 1,00 SANNIO DI BENEVENTO
SCIENZE ECONOMICHE
43 ,4060 ,1000
13 FIRENZE ECONOMIA
34 1,8462 1,00 BERGAMO ECONOMIA 44 ,4041 ,1000
16 "Parthenope" di NAPOLI
ECONOMIA
35 1,8125 1,00 Cattolica del Sacro Cuore
ECONOMIA 45 ,4033 ,1000
5 ROMA "Tor Vergata"
GIURISPRUDENZA
36 1,8000 ,00 politecnico delle marche
ECONOMIA 46 ,3868 ,1350
18 MILANO-BICOCCA
ECONOMIA
37 1,7778 1,00 Cattolica del Sacro Cuore
SC. BANCARIE 47 ,3850 ,2500
4 CAMERINO GIURISPRUDENZA
38 1,7500 ,50 MESSINA ECONOMIA 48 ,3711 ,0000
28 politecnico delle marche
ECONOMIA
39 1,7000 1,00 "Cà Foscari" di VENEZIA
ECONOMIA 49 ,3682 ,0000
9 SASSARI ECONOMIA
40 1,6667 1,00 BARI GIURISPRUDENZA
50 ,3650 ,0000
6 BOLOGNA GIURISPRUDENZA
40 1,6667 2,00 VERONA ECONOMIA 51 ,3643 ,1000
9 TORINO GIURISPRUDENZA
40 1,6667 1,00 PISA ECONOMIA 52 ,3619 ,1000
27 PISA ECONOMIA
41 1,5926 1,00 SALERNO ECONOMIA 53 ,3541 ,1700
17 SALERNO ECONOMIA
42 1,5882 1,00 L'AQUILA ECONOMIA 54 ,3363 ,0000
24 PISA ECONOMIA
43 1,5417 1,00 TERAMO SCIENZE POLITICHE
55 ,3300 ,2000
13 ROMA "La Sapienza"
SC STATATISTICHE
44 1,5385 1,00 SASSARI ECONOMIA 56 ,3278 ,1000
23 VERONA ECONOMIA
45 1,5217 1,00 MODENA e REGGIO EMILIA
ECONOMIA 57 ,3095 ,1150
4 "Parthenope" di NAPOLI
GIURISPRUDENZA
46 1,5000 1,50 "Parthenope" di NAPOLI
GIURISPRUDENZA
58 ,2875 ,2100
4 ROMA "La Sapienza"
INGEGNERIA
46 1,5000 1,50 UDINE ECONOMIA 59 ,2850 ,2000
5 Università IUAV di VENEZIA
PIANIFICAZIONE del TERRITORI
46 1,5000 2,00 ROMA "La Sapienza"
ECONOMIA 60 ,2822 ,1000
31
O
4 MODENA e REGGIO EMILIA
SC COMUNICAZIONE
46 1,5000 1,00 PADOVA GIURISPRUDENZA
61 ,2688 ,1500
4 MILANO-BICOCCA
SOCIOLOGIA
46 1,5000 2,00 MILANO-BICOCCA
SOCIOLOGIA 62 ,2625 ,1250
8 PERUGIA SC POLITICHE
47 1,3750 1,50 NAPOLI "Federico II"
GIURISPRUDENZA
63 ,2517 ,0500
9 PAVIA SC POLITICHE
48 1,3333 ,00 PERUGIA ECONOMIA 64 ,2470 ,0000
11 CASSINO ECONOMIA
49 1,2727 1,00 ROMA TRE SC POLITICHE 65 ,2467 ,2500
55 ROMA "La Sapienza"
ECONOMIA
50 1,2545 1,00 GENOVA SC POLITICHE 66 ,2375 ,0500
28 NAPOLI "Federico II"
ECONOMIA
51 1,2500 1,00 CATANIA SC POLITICHE 67 ,2350 ,0000
4 BERGAMO INGEGNERIA
51 1,2500 1,00 Seconda Univ. NAPOLI
ECONOMIA 68 ,2340 ,2500
8 GENOVA SC POLITICHE
51 1,2500 1,00 MILANO GIURISPRUDENZA
69 ,2167 ,1000
24 ROMA TRE ECONOMIA
52 1,2083 ,50 MOLISE ECONOMIA 70 ,2067 ,1000
5 Seconda Univ. NAPOLI
ECONOMIA
53 1,2000 1,00 BARI ECONOMIA 71 ,2004 ,1000
6 Univ. del SALENTO
ECONOMIA
54 1,1667 1,00 Università IUAV di VENEZIA
PIANIFICAZIONE del TERRITORIO
72 ,2000 ,1000
8 L'AQUILA ECONOMIA
55 1,1250 1,00 PERUGIA SC POLITICHE 72 ,2000 ,1350
8 PADOVA GIURISPRUDENZA
55 1,1250 ,50 MILANO-BICOCCA
SC STATATISTICHE
72 ,2000 ,2000
17 CAGLIARI ECONOMIA
56 1,1176 1,00 CAMERINO GIURISPRUDENZA
73 ,1950 ,1150
10 NAPOLI "Federico II"
SC POLITICHE
57 1,1000 1,00 BOLOGNA GIURISPRUDENZA
73 ,1950 ,0800
11 CHIETI-PESCARA
ECONOMIA
58 1,0909 1,00 CAGLIARI ECONOMIA 74 ,1882 ,1000
11 SALERNO SC POLITICHE
59 1,0909 1,00 MESSINA GIURISPRUDENZA
75 ,1875 ,0000
6 MOLISE ECONOMIA
60 1,0000 ,50 MILANO-BICOCCA
GIURISPRUDENZA
76 ,1800 ,1500
10 PERUGIA ECONOMIA
60 1,0000 ,00 PALERMO ECONOMIA 77 ,1794 ,0000
20 PARMA ECONOMIA
60 1,0000 1,00 MODENA e REGGIO EMILIA
SC COMUNICAZIONE
78 ,1775 ,1900
4 MESSINA SC POLITICHE
60 1,0000 ,00 MESSINA SC POLITICHE 79 ,1750 ,0000
4 della CALABRIA
SC POLITICHE
60 1,0000 1,00 CHIETI-PESCARA
ECONOMIA 80 ,1655 ,1000
5 "L'Orientale" di NAPOLI
SC POLITICHE
60 1,0000 1,00 PADOVA SC POLITICHE 81 ,1647 ,0000
7 PISA SC POLITICHE
60 1,0000 1,00 ROMA "La Sapienza"
SC POLITICHE 82 ,1643 ,0000
19 PADOVA SC POLITICHE
61 ,9474 1,00 PISA SC POLITICHE 83 ,1571 ,1000
16 della CALABRIA
ECONOMIA
62 ,9375 1,00 CASSINO ECONOMIA 84 ,1545 ,1000
12 FIRENZE SC POLITICHE
63 ,9167 ,50 SALERNO SC POLITICHE 85 ,1491 ,1000
21 ROMA "La Sapienza"
SC POLITICHE
64 ,9048 1,00 TUSCIA ECONOMIA 86 ,1357 ,1000
10 UDINE ECONOMIA
65 ,9000 1,00 PAVIA SC POLITICHE 87 ,1333 ,0000
10 CATANIA SC POLITICHE
65 ,9000 ,00 ROMA "La Sapienza"
GIURISPRUDENZA
88 ,1215 ,0000
9 Cattolica del Sacro Cuore
SC POLITICHE
66 ,8889 1,00 CATANIA ECONOMIA 89 ,1194 ,0000
5 IULM - MILANO
SC COMUNICA
67 ,8000 ,00 della CALABRIA
SC POLITICHE 90 ,1175 ,1000
32
ZIONE
5 PALERMO SC POLITICHE
67 ,8000 ,00 della CALABRIA
ECONOMIA 91 ,1131 ,0000
9 ROMA TRE SC POLITICHE
68 ,7778 ,00 ROMA "La Sapienza"
INGEGNERIA 92 ,1125 ,1000
16 CATANIA ECONOMIA
69 ,7500 ,00 MACERATA SC POLITICHE 93 ,1100 ,0000
4 PAVIA GIURISPRUDENZA
69 ,7500 ,00 GENOVA ECONOMIA 94 ,1100 ,0000
12 NAPOLI "Federico II"
GIURISPRUDENZA
69 ,7500 ,00 CHIETI-PESCARA
SC MANAGERIALI
95 ,1056 ,0000
12 TRIESTE ECONOMIA
70 ,6700 1,00 PARMA ECONOMIA 96 ,1010 ,0000
12 TRENTO ECONOMIA
71 ,6667 1,00 TRIESTE ECONOMIA 97 ,0942 ,1000
16 PALERMO ECONOMIA
72 ,6250 ,00 TRENTO ECONOMIA 98 ,0942 ,1000
18 GENOVA ECONOMIA
73 ,6111 1,00 NAPOLI "Federico II"
SC POLITICHE 99 ,0900 ,0000
9 MILANO GIURISPRUDENZA
74 ,5556 1,00 ROMA "Tor Vergata"
GIURISPRUDENZA
100 ,0880 ,0000
20 ROMA "La Sapienza"
GIURISPRUDENZA
75 ,5500 ,00 "L'Orientale" di NAPOLI
SC POLITICHE 101 ,0800 ,0000
6 PISA GIURISPRUDENZA
76 ,5000 ,00 BERGAMO INGEGNERIA 102 ,0675 ,0500
8 BARI SC POLITICHE
76 ,5000 ,50 TRENTO SC POLITICHE 103 ,0500 ,0000
7 TUSCIA ECONOMIA
77 ,2857 ,00 TRIESTE SCIENZE POLITICHE
104 0,05 ,0000
4 MESSINA GIURISPRUDENZA
78 ,2500 ,00 FOGGIA ECONOMIA 105 0,0462 ,0000
5 MACERATA SC POLITICHE
79 ,2000 ,00 FIRENZE ECONOMIA 106 ,0462 ,0000
6 TRIESTE SCIENZE POLITICHE
80 ,1700 ,00 "S. Pio V" ECONOMIA 107 0 0
6 TRENTO SC POLITICHE
81 ,1667 ,00 IULM - MILANO
SC COMUNICAZIONE
107 ,0000 ,0000
4 "S. Pio V" ECONOMIA
82 ,0000 0 BARI SC POLITICHE 107 ,0000 ,0000