Mardie Project - Hydrodynamic Modelling Report
61
Mardie Project Hydrodynamic Modelling Report 12 March 2020 | 12979.101.R1.Rev2
Transcript of Mardie Project - Hydrodynamic Modelling Report

Mardie Project Hydrodynamic Modelling Report
12 March 2020 | 12979.101.R1.Rev2

Mardie Project Hydrodynamic Modelling Report
© 2020 Baird Australia Pty Ltd as Trustee for the Baird Australia Unit Trust (Baird) All Rights Reserved. Copyright in the whole and every part of this document, including any data sets or outputs that accompany this report, belongs to Baird and may not be used, sold, transferred, copied or reproduced in whole or in part in any manner or form or in or on any media to any person without the prior written consent of Baird.
This document was prepared by Baird Australia Pty Ltd as Trustee for the Baird Australia Unit Trust for BCI Minerals. The outputs from this document are designated only for application to the intended purpose, as specified in the document, and should not be used for any other site or project. The material in it reflects the judgment of Baird in light of the information available to them at the time of preparation. Any use that a Third Party makes of this document, or any reliance on decisions to be made based on it, are the responsibility of such Third Parties. Baird accepts no responsibility for damages, if any, suffered by any Third Party as a result of decisions made or actions based on this document.
12979.101.R1.Rev2 Page i
Prepared for: Prepared by:
BCI Minerals Level 2 1 Altona Street West Perth, WA, 6005
Baird Australia Pty Ltd as Trustee for the Baird Australia Unit Trust ACN 161 683 889 | ABN 92 798 128 010 For further information, please contact Jim Churchill at +61 8 6255 5080 [email protected] www.baird.com
12979.101.R1.Rev2
Z:\Shared With Me\QMS\2020\Reports_2020\12979.101.R1.Rev2_MardieProject_HydrodynamicModellingReport.docx
Revision Date Status Comments Prepared Reviewed Approved
A 29/04/2019 Draft Issued For Client Review JC / RW DT JC
0 16/05/2019 Final Updated With Review Comments JC / RW DT JC
1 21/02/2020 Final Updated With New Data and Concept RW DT JC
2 12/03/2020 Final Updated with Review Comments RW DT JC

Mardie Project Hydrodynamic Modelling Report
12979.101.R1.Rev2 Page ii
Executive Summary
The Mardie Project, is a greenfield high-quality salt project proposed in the Pilbara region of Western Australia. Baird Australia Pty Limited (Baird) has been engaged by Mardie Minerals to develop a hydrodynamic modelling program to support the environmental approvals process to assess: • Modelling of dredge plumes associated with the initial dredging of the port facility and marine precinct
for the preparation of a Dredging and Spoil Disposal Management Plan (DSDMP); and • Modelling of mixing and dilution of the planned bitterns discharge into the marine environment for
preparation of an Environmental Quality Plan (EQP).
A summary of the metocean conditions for the Mardie project has been completed incorporating background studies, analysis of climate data from a Bureau of Meteorology site at Mardie Station and measured data from metocean instruments deployed at inshore (4km from land) and offshore locations (16km offshore) for the project in 2018-2019.
The metocean summary has informed the development of the hydrodynamic model for the project, which will be the platform for the delivery of the dredge plume and bitterns outfall modelling scopes. A range of bathymetric and topographic data sets including multibeam bathymetry captured through the general marine precinct for the project were utilised to establish the model. The National Tide Centre (NTC) defined site specific tidal planes for the Mardie project location which were adopted into the model datum.
The hydrodynamic model has been developed using the Delft3D modelling system (Deltares 2018). A regional scale model extending across the full extent of the north west shelf is used to define boundary conditions for a local scale hydrodynamic model established over the Mardie area in a domain decomposition grid arrangement with increasing resolution from offshore to the port area and transhipment channel. A coupled wave model over the local scale domain updates the wave conditions in the simulations every two hours (Delft3D FLOW-WAVE-FLOW). The model has been setup and validated for 2D (depth-averaged) and 3D sigma-layer model configurations. A 3D z-layer model has also been adopted to model density-driven flows in the dredged channel and basin as part of the modelling of mixing and dilution of the planned bitterns discharge into the marine environment for the preparation of the previously defined Environmental Quality Plan (EQP).
The validation of the hydrodynamic model for representative four-week periods in the Wet Season and the Dry season against the measured data shows good validation metrics for water level, depth averaged current velocity and direction. The validation of the hydrodynamic model system confirms it is accurately reproducing the general hydrodynamic conditions for the Mardie project area and provides confidence the model can be applied in the dredge plume analysis (Baird, 2020a) and in the bitterns outfall modelling (Baird, 2020b) studies that accompany this report.

Mardie Project Hydrodynamic Modelling Report
12979.101.R1.Rev2 Page iii
Table of Contents
1. Introduction ............................................................................................................................. 1
1.1 Background 1
1.2 Project Overview 1
1.3 Hydrodynamic Modelling Scope 2
2. Background Information ........................................................................................................ 4
2.1 Key Reports 4
2.1.1 Site Specific Reports Prepared for the Mardie Project 4
2.1.2 WAMSI Dredging Science Node 4
2.1.3 Key EPA Documents 4
2.1.4 Other Policy and Guidance 5
2.2 Measured Data Sources 5
2.2.1 Data Summary – Site Specific Data 5
2.2.2 Bureau of Meteorology Data 6
3. Hydrodynamic Processes ..................................................................................................... 8
3.1 Bathymetric Features 8
3.2 Oceanographic Influences on Hydrodynamics 9
3.2.1 Tides 9
3.2.2 Water Level 10
3.2.3 Waves 10
3.2.4 Currents 11
3.2.5 Cyclones 15
3.3 Meteorological Data 15
3.3.1 Winds 15
3.3.2 Rainfall 18
3.4 Water Quality Processes Overview 18
4. Hydrodynamic Model Setup ............................................................................................... 20
Mardie Project Hydrodynamic Modelling Report
12979.101.R1.Rev2 Page iv
4.1 Model System 20
4.2 Model Domain 20
4.2.1 Regional Scale Model 20
4.2.2 Local Scale Model 22
4.3 Model Setup 23
4.3.1 Bathymetry 23
4.3.2 Boundary Conditions 25
4.3.3 Winds 26
4.3.4 Waves 26
4.4 Model Settings 27
4.5 Representative Seasonal Scenarios Modelled 27
4.5.1 Dry Season 27
4.5.2 Wet Season 28
4.5.3 Transition Cases 28
5. Hydrodynamic Model Validation ........................................................................................ 29
5.1 Validation of Regional Model 29
5.2 Validation of Local Model 30
5.2.1 Hydrodynamic Model Validation 30
5.2.2 Model Metrics -Statistical Descriptions 35
5.2.2.1 Model Skill 35
5.2.2.2 Bias 35
5.2.2.3 RMS Error 35
5.2.2.4 Scatter index 35
5.2.3 Model Validation – Water Levels and Currents 36
5.2.4 Model Validation – Waves 37
5.2.5 Spatial Current Fields 38
5.2.6 2D and 3D Model Comparisons 41
6. Conclusions ......................................................................................................................... 43

Mardie Project Hydrodynamic Modelling Report
12979.101.R1.Rev2 Page v
7. References ............................................................................................................................ 46
Bathymetry Data Sources
Tables Table 2.1: Data Summary - Metocean Data ....................................................................................................... 5
Table 2.2: Data Summary - Site Specific Data ................................................................................................... 6
Table 3.1: Mardi Tidal Planes (location 21.03572 S, 115.92766 E, National Tide Centre) ........................... 10
Table 3.2: Exceedance Table – Mardie Offshore (depth average current speed and direction) .................. 13
Table 3.3: Exceedance Table – Mardie Inshore (depth average current speed and direction) .................... 14
Table 3.4: Mardie Mean Rainfall Data (BoM) .................................................................................................... 18
Table 3.5: Salinity Statistics – Analysis of Inshore Location (O2 Marine, 2019) ............................................ 18
Table 3.6: Temperature Statistics – Analysis of Inshore Location (O2 Marine, 2019) ................................... 19
Table 4.1: Delft Flow Model setup summary ..................................................................................................... 22
Table 4.2: Delft3D Flow-Wave-Flow Settings ................................................................................................... 27
Table 5.1: Model Metrics for water level, depth-averaged current velocity and direction .............................. 36
Table 6.1: Model Metrics for water level, depth-averaged current velocity and direction. ............................. 45
Figures Figure 2.1: Measured Data Locations ................................................................................................................. 7
Figure 3.1: Mardie Project Footprint (underlain by Hydrographic Chart AUS743) ........................................... 8
Figure 3.2: Wave conditions offshore of the Mardie project location for Dry Season months (left) and Wet Season Months (right) based on measured data from offshore ADCP. ......................................................... 11
Figure 3.3: Measured Data from Inshore Aquadopp, November 2018. Time series water level, depth averaged current velocity and direction. ............................................................................................................ 12
Figure 3.4: Current Speed Rose Plot - Offshore Location (ADCP) ................................................................. 13
Figure 3.5: Current Speed Rose Plot - Aquadopp location Inshore ................................................................ 14

Mardie Project Hydrodynamic Modelling Report
12979.101.R1.Rev2 Page vi
Figure 3.6: Tracks of notable cyclones impacting Karratha (left) and Onslow (right) from BOM. ................. 15
Figure 3.7: Wind Rose plots by month based on 8 years analysis of the measured data from Mardie (2011-2018) .................................................................................................................................................................... 16
Figure 3.8: Wind Rose for Dry Season (left) and Wet Season (Right) based on analysis of Mardie BoM data (2011-2018) ................................................................................................................................................. 17
Figure 3.9: Wind Rose for Dry Season transition (left) and Wet Season transition (Right) based on analysis of Mardie BoM data (2011-2018) ....................................................................................................................... 17
Figure 4.1: Regional Delft-FM model grid Extent and bathymetry. ................................................................. 21
Figure 4.2: Local Hydrodynamic Model - Domain Decomposition Grid setup ................................................ 23
Figure 4.3: Bathymetry Grid for Local Scale Model (Datum mMSL Mardie 2018) ......................................... 24
Figure 4.4: Bathymetry Grid – Developed Case Port Precinct (Datum mMSL Mardie 2018) ....................... 25
Figure 4.5: Local Model Domain (Yellow Boundaries) nested inside Regional Model Domain Flexible Mesh Grid (shown in Blue) ............................................................................................................................................ 26
Figure 5.1: Regional Model Tidal Validation at nearby Port locations ............................................................. 29
Figure 5.2: Comparison of Offshore Location Measured vs Modelled Data for Water level and Depth Averaged Current. Wet Season Validation Period, 18 December 2018 – 15 January 2019. ....................... 31
Figure 5.3: Comparison of Inshore Location Measured vs Modelled Data for Water level and Depth Averaged Current. Wet Season Validation Period, 18 December 2018 – 15 January 2019. ....................... 32
Figure 5.4: Comparison of Offshore Location Measured vs Modelled Data for Water level and Depth Averaged Current. Dry Season Validation Period, 1 June 2019 – 1 July 2019. ............................................. 33
Figure 5.5: Comparison of Inshore Location Measured vs Modelled Data for Water level and Depth Averaged Current. Dry Season Validation Period, 1 June 2019 – 1 July 2019. ............................................. 34
Figure 5.6: Wet Season Validation Case - Comparison of Wave Data Measured vs Modelled at the offshore location .................................................................................................................................................. 37
Figure 5.7: Dry Season Validation Case - Comparison of Wave Data Measured vs Modelled at the offshore location ................................................................................................................................................................. 38
Figure 5.8: Local Model Grid – Ebb Tide for Large Spring Tide Case (25 Dec 2018 2100UTC) ................. 39
Figure 5.9: Local Model Grid – Flood Tide for Large Spring Tide Case (26 Dec 2018 0400UTC) ............... 39
Figure 5.10: Modelled Ebb Tide Currents in large spring tide for port precinct (25/12/2018 2100 UTC) ..... 40
Figure 5.11: Modelled Flood Currents in large spring tide for port precinct (26/12/2018 0400 UTC) ........... 40
Figure 5.12: Comparison of modelled 2D and 3D current speed timeseries data from inshore Aquadopp location. ................................................................................................................................................................ 41

Mardie Project Hydrodynamic Modelling Report
12979.101.R1.Rev2 Page vii
Figure 5.13: Comparison of 2D and 3D current speed and direction modelled and measured data from the Aquadopp location (inshore) .............................................................................................................................. 42

Mardie Project Hydrodynamic Modelling Report
12979.101.R1.Rev2 Page 1
1. Introduction
1.1 Background
Mardie Minerals Pty Ltd (Mardie Minerals), a wholly owned subsidiary of BCI Minerals Limited, seeks to develop the Mardie Project (the proposal), a greenfields high-quality salt project in the Pilbara region of Western Australia. Baird Australia Pty Limited (Baird) has been engaged by Mardie Minerals to address two study scopes associated with the Definitive Feasibility Study (DFS) and environmental approvals for the Mardie Project. The two study scopes are: • Modelling of dredge plumes and the preparation of a Dredging and Spoil Disposal Management Plan
(DSDMP); and • Modelling of mixing and dilution of bitterns discharge into the marine environment and prepare of an
Environmental Quality Plan (EQP). This study phase includes the concept design of a bitterns discharge outfall for the purposes of the EQP.
The following report presents the details on the setup, validation and simulations for the hydrodynamic model which is a key component of both study scopes that Baird has been engaged on. The calibrated model presented in this report has been adopted in the subsequent dredge plume and bitterns dilutions studies.
Details on the Mardie Project and Baird’s scope of engagement are presented in the following sections.
1.2 Project Overview
The proposal is a solar salt project that utilises seawater and evaporation to produce raw salts as a feedstock for dedicated processing facilities that will produce a high purity salt, industrial grade fertiliser products, and other commercial by-products. Production rates of 4.0 Million tonnes per annum (Mtpa) of salt (NaCl), 100 kilo tonnes per annum (ktpa) of Sulphate of Potash (SoP), and up to 300 ktpa of other salt products are being targeted, sourced from a 150 Gigalitre per annum (GLpa) seawater intake. To meet this production, the following infrastructure will be developed: • Seawater intake, pump station and pipeline; • Concentrator ponds; • Drainage channels; • Crystalliser ponds; • Trestle jetty and transhipment berth/channel; • Bitterns disposal pipeline and diffuser; • Processing facilities and stockpiles; • Administration buildings; • Accommodation village; • Access / haul roads; • Desalination plant for freshwater production, with brine discharged to the evaporation ponds; and • Associated infrastructure such as power supply, communications, workshop, laydown, landfill facility,
sewage treatment plant, etc.
Seawater for the process will be pumped from a large tidal creek into the concentrator ponds. All pumps will be triple-screened and operated accordingly to minimise entrapment of marine fauna and any reductions in water levels in the tidal creek.

Mardie Project Hydrodynamic Modelling Report
12979.101.R1.Rev2 Page 2
Concentrator and crystalliser ponds will be developed behind low permeability walls engineered from local clays and soils and rock armoured to protect against erosion. The height of the walls varies across the project and is matched to the flood risk for the area.
Potable water will be required for the production plants and the village. The water supply will be sourced from a desalination plant which will provide the water required to support the Project. The high salinity output from the plant will be directed to a concentrator pond with the corresponding salinity.
A trestle jetty will be constructed to convey salt (NaCl) from the salt production stockpile to the transhipment berth pocket. The jetty will traverse the intertidal zone before extending into the ocean to the berth pocket. The jetty will not impede coastal water or sediment movement, thus ensuring coastal processes are maintained.
Dredging of up to 800,000 m3 will be required to ensure sufficient depth for the transhipper berth pocket at the end of the trestle jetty, as well as along a 4 km long channel out to deeper water. The dredge spoil is inert and will be transported to shore for use within the development.
The production process will produce a high-salinity bittern that, prior to its discharge through a diffuser at the far end of the trestle jetty, will be diluted with seawater to bring its salinity closer to that of the receiving environment.
The Project was referred to DWER – EPA Services and the Level of Assessment (LOA) was set at Public Environmental Review (PER). The EPA determined on 13 June 2018 that there were seven preliminary key environmental factors related to the Project, with Benthic Communities and Habitat (BCH) and Marine Environmental Quality (MEQ) being relevant to this Scope of Works (SOW). BCI are currently finalising the Environmental Review Document (ERD) with the DWER and DoTEE, with potential BCH and MEQ impacts and risks associated with the SOW being: • Bitterns disposal (salinity) at discharge location; • Localised reduction in water quality around the bitterns outfall location; • Direct disturbance / removal of benthic communities and habitat; • Direct loss and degradation of marine fauna habitat; • Marine fauna injury or fatality as a result of vessel strike or contact with dredge equipment; • Changes to water quality due to subtidal dredging including:
• Increased sedimentation resulting in settlement and smothering of habitat.
Baird has been engaged by Mardie Minerals to deliver a numerical modelling study which will provide the basis to support the environmental approvals for the Mardie project.
1.3 Hydrodynamic Modelling Scope
Baird was engaged by Mardie Minerals to develop a hydrodynamic model of the Mardie region around the project site. The model system will be applied in studies to follow which will analyse the impacts from the dredge plumes associated with the projects initial dredging requirements and water quality and marine impacts from the bitterns outfall respectively.
The hydrodynamic model establishment and validation is outlined in this report. The tasks for the hydrodynamic model detailed in Baird’s scope for Mardie Minerals are as follows: 1. A summary of input data will be prepared, which will draw on the Metocean summary and review of
relevant reports and documentation. A summary of the metocean, water quality and bathymetric data will be prepared.
2. Hydrodynamic model establishment (2D), inclusive of tidal flows and wind conditions. • Validation of model against measured water levels, current velocity and direction

Mardie Project Hydrodynamic Modelling Report
12979.101.R1.Rev2 Page 3
• Establish representative seasonal periods of four weeks model duration to describe the typical hydrodynamics occurring in representative periods nominally for: ο dry season
ο dry to wet transition
ο wet season
ο wet to dry transition • Reporting of key metocean characteristics at the site over the spring – neap tide cycle would be
documented from the model for each seasonal period. Output to be shown as time series, graphical plots, rose plots, exceedance tables.
3. Wave model • Establish local scale SWAN wave model within Baird’s Wavewatch-III/SWAN NWS wave model
system. • Modelling of two seasonal wave periods (summer and winter) and reporting of bed shear stress
and orbital velocities.

Mardie Project Hydrodynamic Modelling Report
12979.101.R1.Rev2 Page 4
2. Background Information
2.1 Key Reports The background reports referenced in the development of the hydrodynamic model and application in the numerical modelling program are outlined in this section.
2.1.1 Site Specific Reports Prepared for the Mardie Project • O2Marine 2018, Mardie Project Progress Report #1 for Metocean Data Collection, REPORT No.:
R1800106, ISSUE DATE: 22 Oct 2018 • O2Marine 2019, Mardie Project Progress Report for Metocean Data Collection, R1800132 ISSUE
DATE: 15th January 2019 • EGS Survey 2019, Mardie Salt Project Geophysical Survey - BCI Minerals SURVEY REPORT, EGS
PROJECT REF: AU025918, Prepared for O2Marine 21 January 2019 • RPS 2017, MARDIE SALT PROJECT, PRELIMINARY STORM SURGE STUDY, Prepared for BCI
2.1.2 WAMSI Dredging Science Node • Fisher R, Jones R, Bessell-Browne P, (2019). Effects of dredging and dredging related activities on
water quality: Impacts on coral mortality and threshold development Report of Theme 4 - Project 4.9, prepared for the Dredging Science Node, Western Australian Marine Science Institution, Perth, Western Australia, 94 pp.
• Kemps H and Masini R (2017) Estimating dredge source terms – a review of contemporary practice in the context of Environmental Impact Assessment in Western Australia. Report of Theme 2 – Project 2.2, prepared for the Dredging Science Node, Western Australian Marine Science Institution (WAMSI). Perth, Western Australia, 29pp.
• Mills D (2019) Predicting and measuring the characteristics of sediments generated by dredging. Synthesis Report of Theme 2 – prepared for the Dredging Science Node, Western Australian Marine Science Institution, Perth, Western Australia, 12 pp.
• Sun C, Shimizu K, Symonds G (2016) Numerical modelling of dredge plumes: a review. Report of Theme 3 - Project 3.1.3, prepared for the Dredging Science Node, Western Australian Marine Science Institution, Perth, Western Australia, 55 pp
• Sun C, Lowe R, Fearns P, Ghisalberti M, Branson P (2019), WAMSI Dredging Science Node Theme 3 I Synthesis Report: Characterisation and prediction of dredge-generated sediment plume dynamics and fate, prepared for the Dredging Science Node, Western Australian Marine Science Institution, Perth, Western Australia,
2.1.3 Key EPA Documents • EPA 2016a, Statement of Environmental Principles, Factors and Objectives, EPA, Western Australia; • EPA 2016b, Environmental Impact Assessment (Part IV Divisions 1 and 2) Administrative Procedures
2016; • EPA 2018a, Environmental Impact Assessment (Part IV Divisions 1 and 2) Procedures Manual, EPA,
Western Australia; • EPA, 2016c, Environmental Factor Guideline – Marine Environmental Quality, EPA, Western Australia; • EPA, 2016d, Environmental Factor Guideline – Benthic Communities and habitat, EPA, Western
Australia; • EPA, 2016e, Environmental Factor Guideline – Marine Fauna, EPA, Western Australia;

Mardie Project Hydrodynamic Modelling Report
12979.101.R1.Rev2 Page 5
• EPA, 2018b, Instructions on how to prepare Environmental Protection Act Part IV Environmental Management Plans;
• EPA, 2016f, Technical Guidance – Protecting the Quality of Western Australia’s Marine Environment, EPA, Western Australia; and
• EPA, 2016g, Technical Guidance - Environmental Impact Assessment of Marine Dredging Proposals, EPA, Western Australia.
2.1.4 Other Policy and Guidance • DoE, 2006, Pilbara Coastal Water Quality Consultation Outcomes – Environmental Values and
Environmental Quality Objectives, Department of Environment (DoE), Government of Western Australia, Marine Series Report No. 1;
• ANZECC & ARMCANZ 2000, Australian and New Zealand Guidelines for Fresh and Marine Water Quality (Australian and New Zealand Environment and Conservation Council (ANZECC) & Agriculture and Resource Management Council of Australia and New Zealand (ARMCANZ);
2.2 Measured Data Sources
The measured data sources available to the project which have been applied in the setup of the numerical model system are outlined in this section.
2.2.1 Data Summary – Site Specific Data
Table 2.1: Data Summary - Metocean Data
Dataset Description
Bathymetry Ordered Highest to lowest priority
In August 2019 a high-resolution bathymetric survey using a Multibeam Echosounder was completed to define the seabed level of the revised channel infill, transhipment route and proposed cyclone mooring site. In November 2018 a Class A survey was completed to define the seabed level for the proposed access channel route and berth pocket in high resolution. Bathymetry was provided in a Digital Elevation Model (DEM) as reported in EGS 2019. In September 2018 low resolution bathymetry survey was collected by O2Marine and provided as DEM covering the proposed dredge corridor and surrounds. Hydrographic Charts (soundings and contours) • AUS742 - Australia - North West Coast - Western Australia - Rosemary
Island to Barrow Island • AUS743 - Australia - North West Coast - Western Australia - Barrow
Island to Onslow
Topography Tidal Flats topography was provided as 0.25m contours describing the majority of the project landside extent
Sediment Description Sediment sampling results collected by O2Marine were provided across the proposed dredging footprint offshore reporting Particle Size Distribution (PSD)
Baseline Metocean Data
Offshore ADCP • Approximately 16km offshore in 11.2m depth (MGA50 391,362
7,685,272)
Mardie Project Hydrodynamic Modelling Report
12979.101.R1.Rev2 Page 6
Dataset Description
• 8 Deployments covering the period 5 April 2018 – 9 July 2019 • Wave height and direction, Current speed and direction, Water Level Inshore Aquadopp • Approximately 4km offshore in 5.9m depth (MGA50 388,514
7,673,522) • 4 Deployments covering period 8 November 2018 – 8 July 2019
(deployment in 2018 dry season had instrument failure). • Current speed and direction, Water Level
Baseline Water Quality
• Offshore (ADCP) Location: • Light, Temperature, turbidity (TDS)
• Inshore (Aquadopp) Location: • Temperature, pH, salinity (EC), Dissolved oxygen (DO)
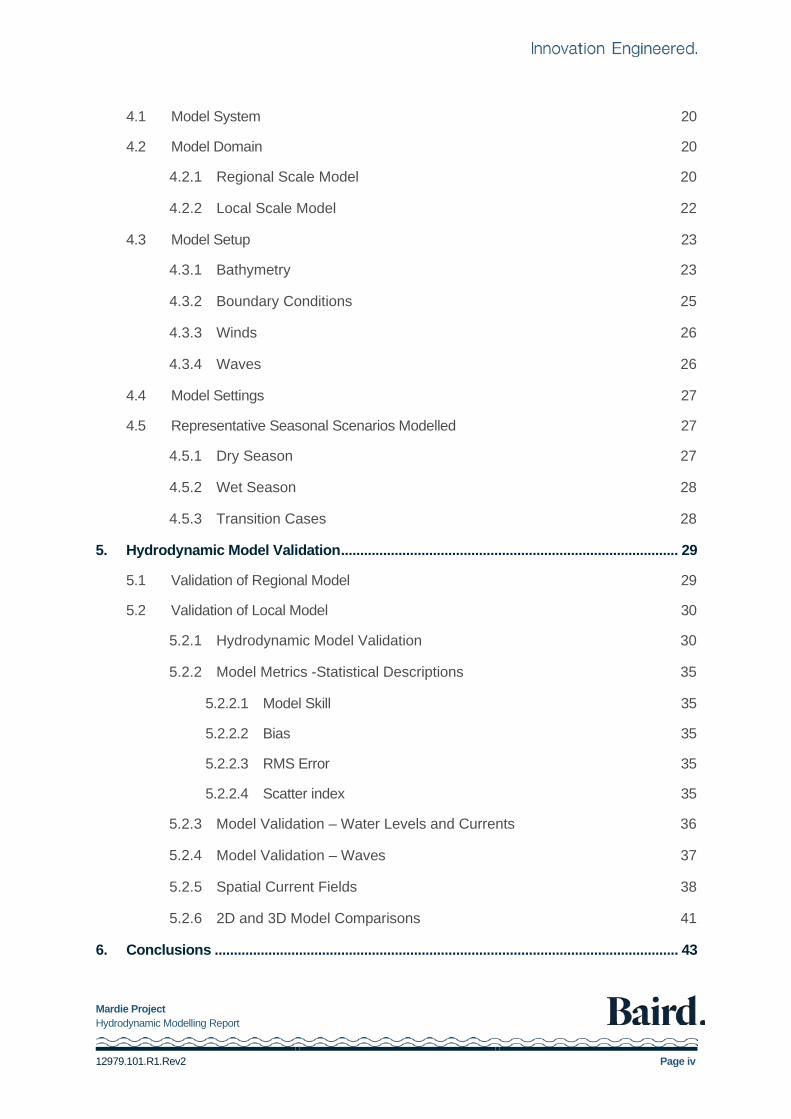
2.2.2 Bureau of Meteorology Data
Table 2.2: Data Summary - Site Specific Data
Dataset Description
Measured Wind Data from Mardie Station (BOM)
Data for the period 27/10/2010 to 17/1/2019 from the Mardie Station location on the Eastern Boundary of the project • Wind Speed / Direction data • Pressure (hPa) 1-minute data converted to 10-minute average at 10m height
The locations of the measured metocean data is shown in Figure 2.1.

Mardie Project Hydrodynamic Modelling Report
12979.101.R1.Rev2 Page 7
Figure 2.1: Measured Data Locations
Mardie Project Hydrodynamic Modelling Report
12979.101.R1.Rev2 Page 8
3. Hydrodynamic Processes
3.1 Bathymetric Features
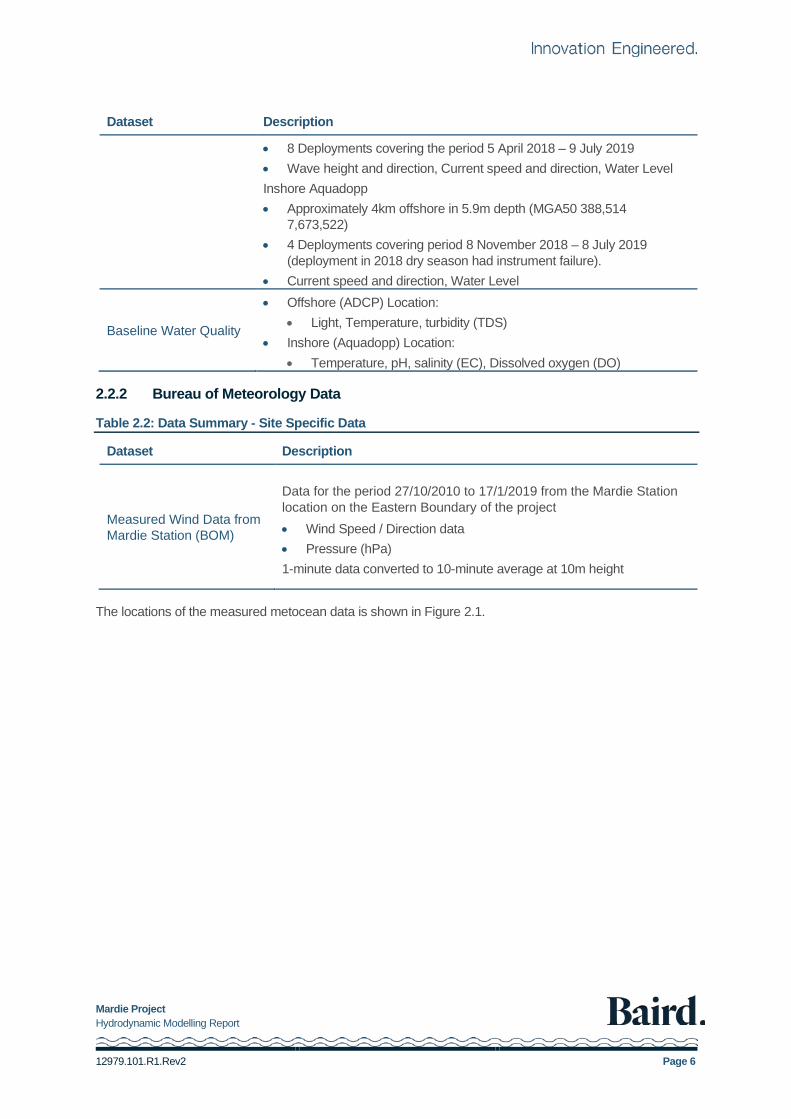
The project footprint extends across the tidal flats at Mardie with the settling ponds approximately 5km inland and the port facility (berth pocket, loader, trestle jetty) located approximately 3.5km offshore as shown in Figure 3.1.
Figure 3.1: Mardie Project Footprint (underlain by Hydrographic Chart AUS743)
The tidal flat area is extremely flat with a network of mangrove lined tidal creeks that connect through the intertidal area to the shoreline. In large spring tides the tide is directed through the creeks and propagates over the tidal flats and can reach inland as far as 10km, however outside of these times the tide is generally contained within the tidal creeks.
The inner shelf region is very wide along this section of the coast, and consequently the near shore bathymetry is very shallow, with water depth of approximately 5m (below LAT) at a distance of 10km offshore. A series of offshore islands and reefs are located immediately offshore of the Mardie coast (Passage Islands). Due to the alignment of the island and reef features of the Passage Islands (refer Figure 3.1) the majority of incoming tidal flow on the flood tide is directed through the gap between Scholl Island and Mardie Island to the north of the project site. At this offshore location between the islands the tidal flow is directed along a general north-south axis based on measured data from the site (refer Figure 3.4). Closer inshore at the project marine facility location, the tidal flows align along a northeast-southwest axis in the ebb and flood tide (Figure 3.5). The exchange from the open ocean to the inshore region in the vicinity of the project marine facility is influenced by this constraint of flows around the Passage Islands,

Mardie Project Hydrodynamic Modelling Report
12979.101.R1.Rev2 Page 9
which likely affects the rate of mixing with the open ocean. Further investigations to characterise the flows through the region to confirm their role in ocean mixing over seasonal periods would be of interest in future studies that cover a region larger than is focused on for this study.
The islands and reefs of the Passage Islands also provide natural protection from ambient swell conditions and during extreme events (e.g. Tropical Cyclones) for the project marine location and inshore coastline areas. Further offshore the Montebello Islands, Barrow Island and the Barrow shoals provide significant protection against extreme waves associated with the passage of a tropical cyclone. Any swell wave energy that reaches the site must refract around these islands and this greatly reduces the long period swell energy that reaches the Mardie coast.
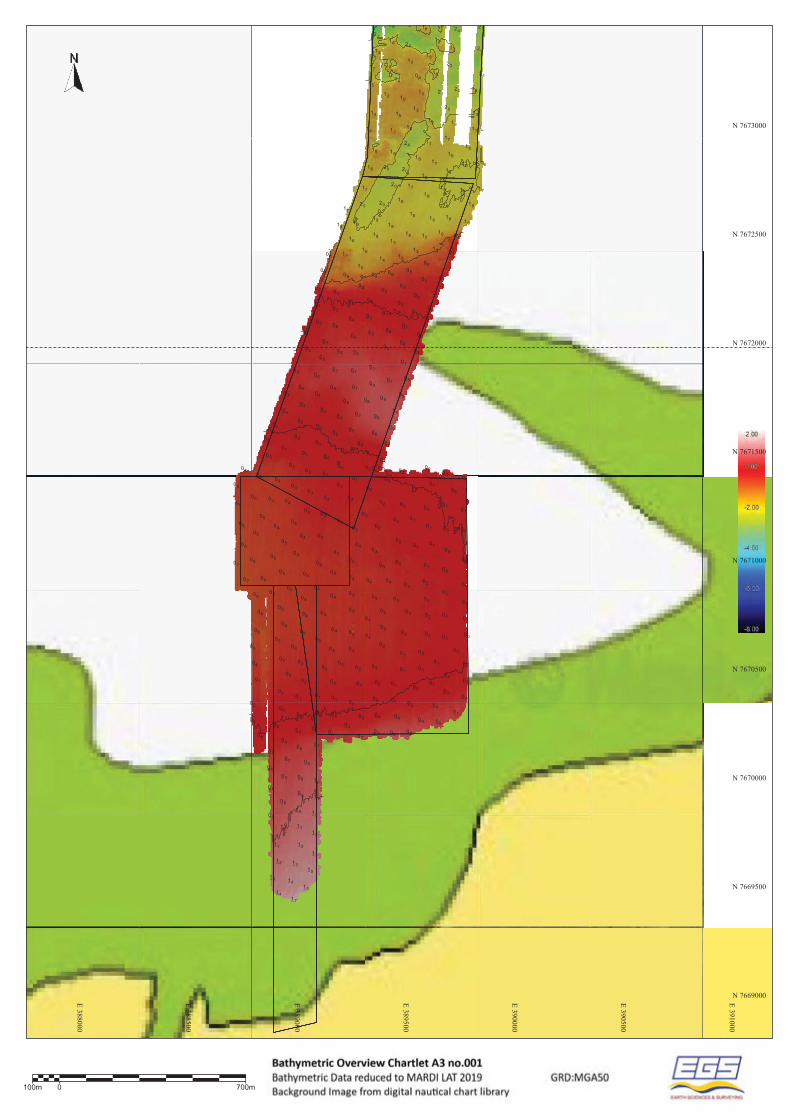
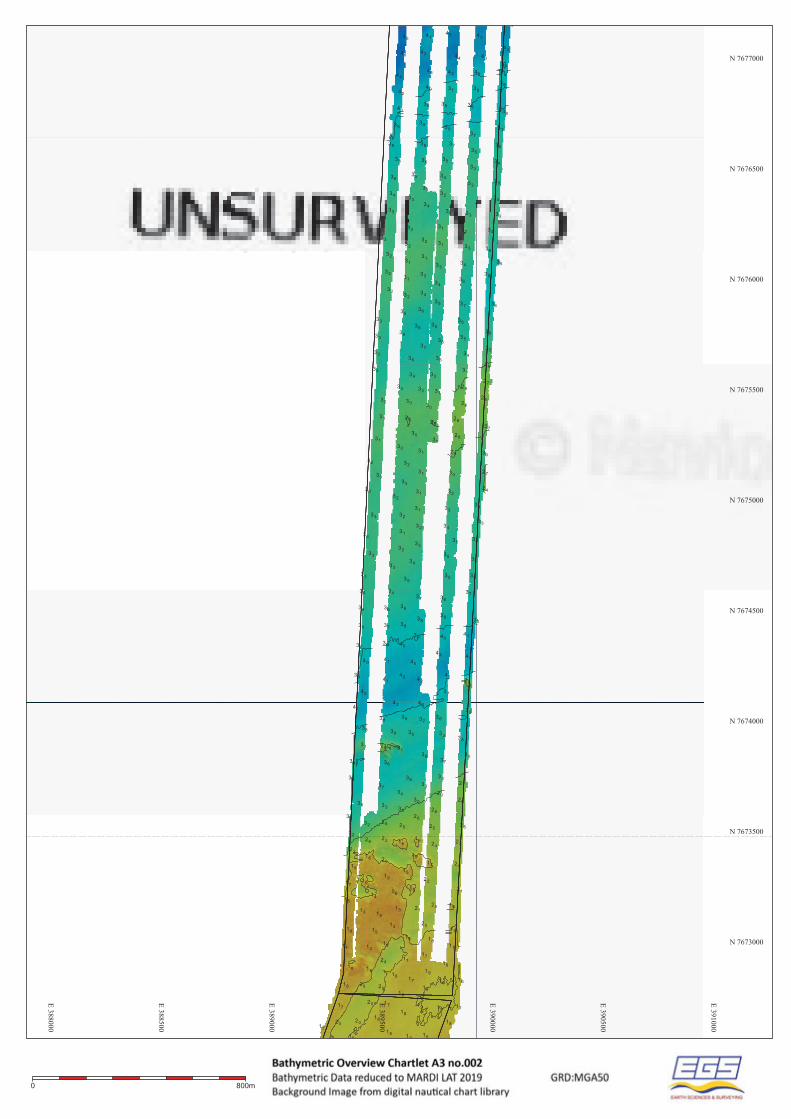
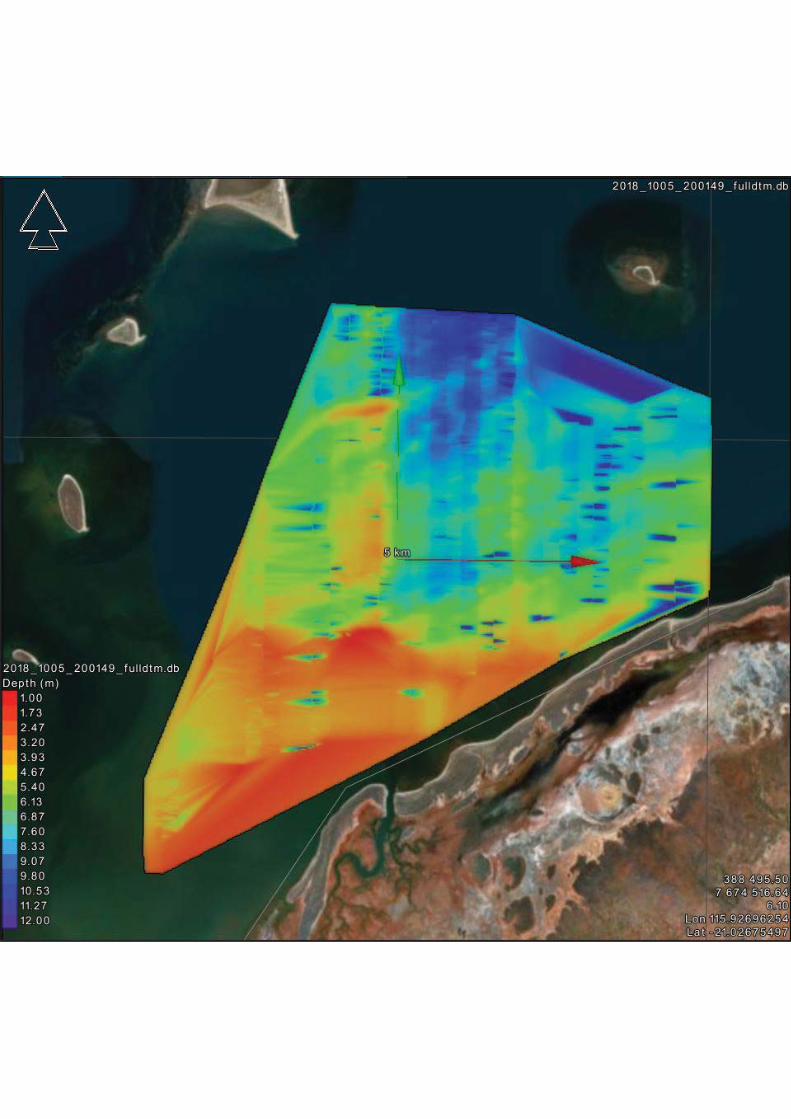
The hydrographic Charts AUS742 and AUS743 have been used in this study to define offshore areas and island and reef features. However, the key inshore region where the port facility and navigation channel will be located are situated in an unsurveyed region of Chart AUS743 (Figure 3.1). Three bathymetric surveys were completed to define the nearshore region in detail: 1. Class A hydrographic survey using a Multibeam Echosounder of the transhipment area, channel, berth
pocket, jetty and nearshore areas completed in November 2018 (EGS survey 2019); 2. Low resolution bathymetric survey completed by O2 Marine in September 2018; and 3. High resolution bathymetric survey using a Multibeam Echosounder of the revised channel infill,
transhipment route and proposed cyclone mooring site completed in August 2019 (TAMS 2019). The coverage of these three survey data sets is shown in Appendix A. The data was used in defining the bathymetry in the numerical model (refer Section 4.3.1).
3.2 Oceanographic Influences on Hydrodynamics
3.2.1 Tides
The astronomical tide is the periodic rise and fall of the sea surface caused by the combination of the gravitational force exerted by the moon and the Sun upon the Earth and the centrifugal force due to rotations of the Earth and moon, and the Earth and the Sun around their common centre of gravity. Tides are subject to spatial variability due to hydrodynamic, hydrographic and topographic influences. At the study area, the tides are characterised by amplification of tidal range due to the shallow bathymetry over the North West Shelf and complex hydrographic and topographic features.
The Mardie project location experiences a semi-diurnal tide (two highs and two lows a day) and the tidal planes have been defined by the National Tide Centre (NTC) based on field measurements from the offshore ADCP location (EGS Survey 2019). The Mardi Gauge (MardiLAT18) datum definition completed by the NTC shows that the offset between LAT and MSL is 2.75 m and the total tidal range is 5.185 m with tidal planes shown in Table 3.1. The mean tide range is 3.6m in springs and 1m in neaps.
It is noted that the calculated tidal planes for Mardie are larger than for the nearest tidal data stations at Steamboat Island, Barrow Island Tanker Mooring and North Sandy Island likely as a result of the closer inshore location (EGS Survey 2019).

Mardie Project Hydrodynamic Modelling Report
12979.101.R1.Rev2 Page 10
Table 3.1: Mardi Tidal Planes (location 21.03572 S, 115.92766 E, National Tide Centre)
Tidal Planes Elevation (m LAT)
HAT 5.185
MHWS 4.557
MHWN 3.226
MSL 2.75
MLWN 2.275
MLWS 0.943
ISLW 0.528
LAT 0
3.2.2 Water Level There were two instruments deployed for the project to measure the water level in the inshore and offshore locations (refer Figure 2.1). • Offshore ADCP
• Approximately 16km offshore in 11.2m MSL depth (MGA50 391,362 7,685,272) • 8 Deployments covering the period 5 April 2018 – 9 July 2019 • Data collected included: Wave height, period and direction, Current speed and direction, Water
Level. • Inshore Aquadopp
• Approximately 4km offshore in 5.9m MSL depth (MGA50 388,514 7,673,522) • 4 Deployments covering period 8 November 2018 – 8 July 2019 • Data collected included: Current speed and direction, Water Level.
3.2.3 Waves
The northwest shelf of Western Australia experiences waves generated from three primary sources: Indian Ocean swell, locally generated wind-waves and tropical cyclone waves. Along the Mardie shoreline the ambient (non-cyclonic) wave climate is generally mild. The prevailing season wave conditions are as follows: - • In dry season months low amplitude swell originating in the Indian Ocean propagates to the site and
occurs in conjunction with locally generated sea waves of short period derived from the prevailing wind direction of east / southeast (morning) and north-westerly (afternoon).
• In the wet season the wave climate is locally generated sea waves resulting from the prevailing wind direction coming from west.
In general, the significant wave height is dominated by locally generated sea conditions within the range of 0.5m to 1m at short wave periods (Tp< 5 s). The measured data from the ADCP instrument deployed

Mardie Project Hydrodynamic Modelling Report
12979.101.R1.Rev2 Page 11
offshore for the project has been analysed to characterise the wave conditions in the wet and dry seasons as shown in Figure 3.2. It is noted that the offshore instrument is in a location where it is protected by reefs and islands on the eastern and western side. This influences the fetch over which local winds can generate waves from the east and west. The wave directions in the measured data are generally aligned on a north-east to south-west axis where the approach is unimpeded by bathymetric features.
3.2.4 Currents
Current speed and direction are measured from the offshore location using an ADCP instrument and from inshore close to the proposed port facility using an Aquadopp instrument.
The measured currents from the Aquadopp at the inshore location will be generally representative of the project port area and show the following: • Depth Averaged peak current speed of 0.3ms-1 - 0.5ms-1 in springs and 0.2ms-1 – 0.3ms-1 in neaps • Current Direction (direction to) Consistent in Ebb 40˚ - 70˚ and Flood 220˚ - 250˚ • The flood speeds are generally stronger than the ebb current speed
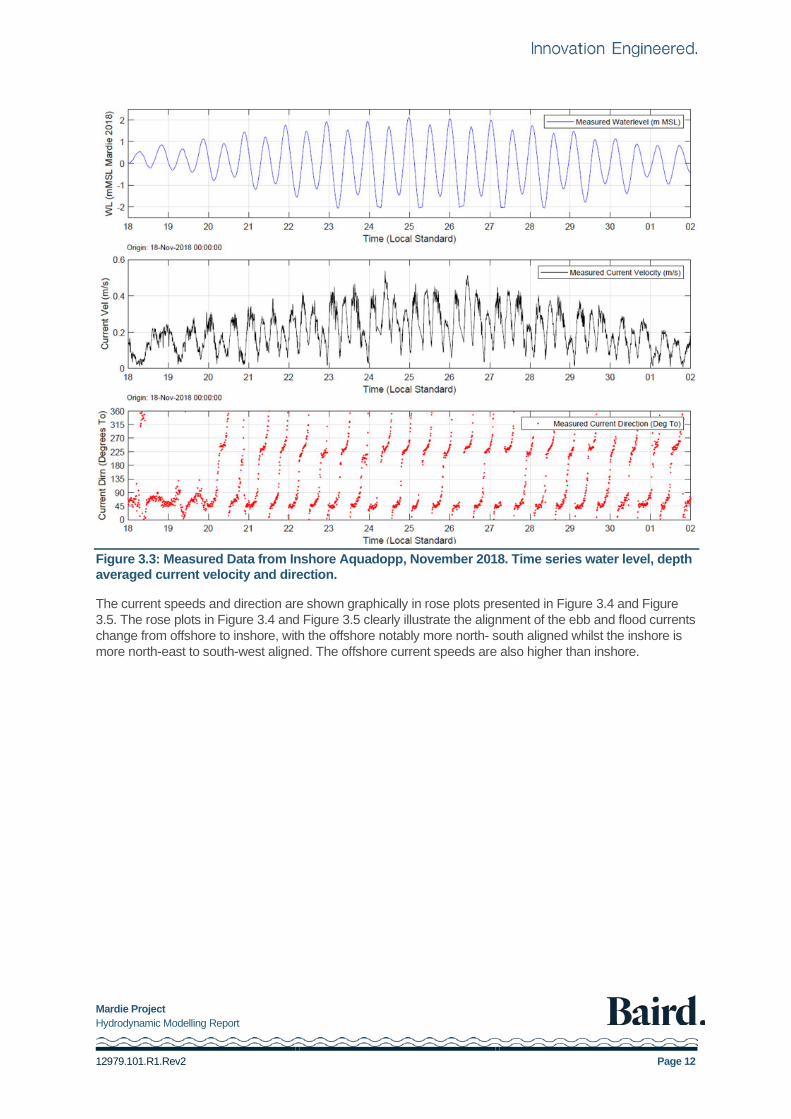
An example of the depth averaged time series data from the last 2 weeks of November 2018 measured by the inshore Aquadopp is shown in Figure 3.3.
Figure 3.2: Wave conditions offshore of the Mardie project location for Dry Season months (left) and Wet Season Months (right) based on measured data from offshore ADCP.
Mardie Project Hydrodynamic Modelling Report
12979.101.R1.Rev2 Page 12
Figure 3.3: Measured Data from Inshore Aquadopp, November 2018. Time series water level, depth averaged current velocity and direction.
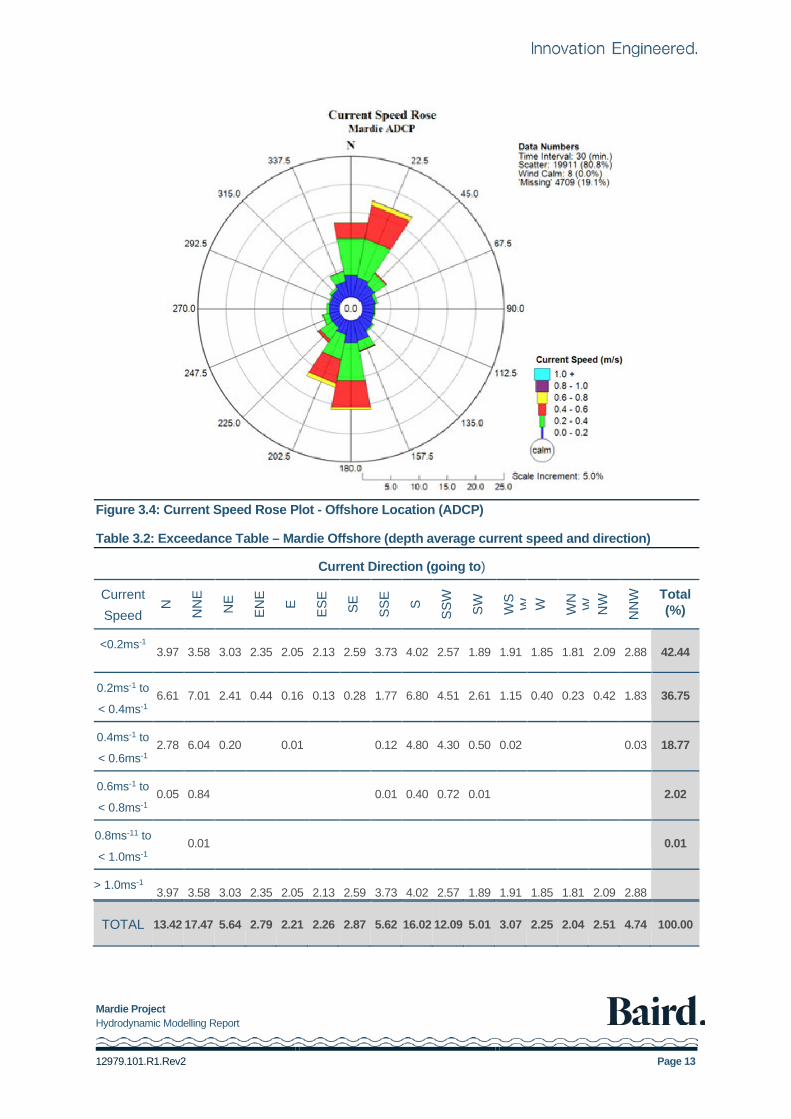
The current speeds and direction are shown graphically in rose plots presented in Figure 3.4 and Figure 3.5. The rose plots in Figure 3.4 and Figure 3.5 clearly illustrate the alignment of the ebb and flood currents change from offshore to inshore, with the offshore notably more north- south aligned whilst the inshore is more north-east to south-west aligned. The offshore current speeds are also higher than inshore.
Mardie Project Hydrodynamic Modelling Report
12979.101.R1.Rev2 Page 13
Figure 3.4: Current Speed Rose Plot - Offshore Location (ADCP)
Table 3.2: Exceedance Table – Mardie Offshore (depth average current speed and direction)
Current Direction (going to)
Current Speed
N
NN
E
NE
ENE
E ESE
SE
SSE
S
SSW
SW
WS W
W
WN W
NW
NN
W
Total (%)
<0.2ms-1 3.97 3.58 3.03 2.35 2.05 2.13 2.59 3.73 4.02 2.57 1.89 1.91 1.85 1.81 2.09 2.88 42.44
0.2ms-1 to
< 0.4ms-1 6.61 7.01 2.41 0.44 0.16 0.13 0.28 1.77 6.80 4.51 2.61 1.15 0.40 0.23 0.42 1.83 36.75
0.4ms-1 to
< 0.6ms-1 2.78 6.04 0.20 0.01 0.12 4.80 4.30 0.50 0.02
0.03 18.77
0.6ms-1 to
< 0.8ms-1 0.05 0.84 0.01 0.40 0.72 0.01 2.02
0.8ms-11 to
< 1.0ms-1 0.01
0.01
> 1.0ms-1 3.97 3.58 3.03 2.35 2.05 2.13 2.59 3.73 4.02 2.57 1.89 1.91 1.85 1.81 2.09 2.88
TOTAL 13.42 17.47 5.64 2.79 2.21 2.26 2.87 5.62 16.02 12.09 5.01 3.07 2.25 2.04 2.51 4.74 100.00

Mardie Project Hydrodynamic Modelling Report
12979.101.R1.Rev2 Page 14
Figure 3.5: Current Speed Rose Plot - Aquadopp location Inshore
Table 3.3: Exceedance Table – Mardie Inshore (depth average current speed and direction)
Current Direction (going to)
Current Speed N
NN
E
NE
ENE
E ESE
SE
SSE
S
SSW
SW
WSW
W
WN
W
NW
NN
W Total
(%)
<0.2ms-1 2.94 4.90 8.41 7.24 3.34 1.62 1.24 1.13 1.76 3.10 5.07 5.46 4.16 2.81 2.17 2.27 57.61
0.2ms-1 to
< 0.4ms-1 0.12 2.28 12.90 2.91 0.23 0.00 0.36 8.01 8.65 1.74 0.11 0.02 0.01 37.35
>0.4ms-1 0.03 0.29 0.02 3.00 1.69 0.01 5.04
TOTAL 3.06 7.21 21.60 10.17 3.57 1.62 1.24 1.13 1.76 3.46 16.08 15.80 5.91 2.92 2.18 2.28 100.00

Mardie Project Hydrodynamic Modelling Report
12979.101.R1.Rev2 Page 15
3.2.5 Cyclones
The Australian cyclone season extends from November through to April with an average of 10 cyclones per year, although not all make landfall. Tropical cyclone winds can generate extreme coastal water levels through storm surge and these systems are frequently associated with heavy rainfall that can cause significant flooding. The Pilbara region of Western Australia has a high exposure to tropical cyclone events, with a typical cyclone track recurving and making landfall in the coastline between Broome and Exmouth. The season typically runs from mid-December to April, peaking in February and March.
The Karratha to Onslow coastline is the most-cyclone prone of the Australian coast, typically experiencing one landfalling event every two years. The north-western coastline of Western Australia is highly vulnerable to the occurrence of storm surge. This is due to the frequency of tropical cyclones, the wide continental shelf and relatively shallow ocean floor over the North West Shelf, as well as the low-lying nature of much of the coastline. In addition, tropical cyclone events are strongly associated with flooding due to widespread heavy rainfall.
Historical events of significance impacting between Karratha and Onslow include: Trixie 1975, Chloe 1984, Orson 1989, Olivia 1996, John 1999, Monty 2004, Clare 2006 and Glenda 2006 (Figure 3.6). In late March 2019 the passage of TC Veronica tracked west over the region from offshore of Karratha losing intensity as it continued west offshore of Mardie as a tropical low system.
Figure 3.6: Tracks of notable cyclones impacting Karratha (left) and Onslow (right) from BOM.
3.3 Meteorological Data
The nearest Bureau of Meteorology (BoM) meteorological station for the project is located at Mardie Station on the eastern project boundary. The BoM records temperature, rainfall, wind speed and direction, daily solar exposure, relative humidity and cloud cover (BCIM 2018).
3.3.1 Winds
The southern Pilbara region has a tropical monsoon climate with distinct wet and dry seasons. • The dry season (generally May to October) is characterised by warm to hot temperatures, easterly to
south-easterly winds and clear and stable conditions derived from the subtropical high-pressure ridge. • In the wet season months (generally November to April) the wind climate is more active and
dominated by westerly and north-westerly winds.
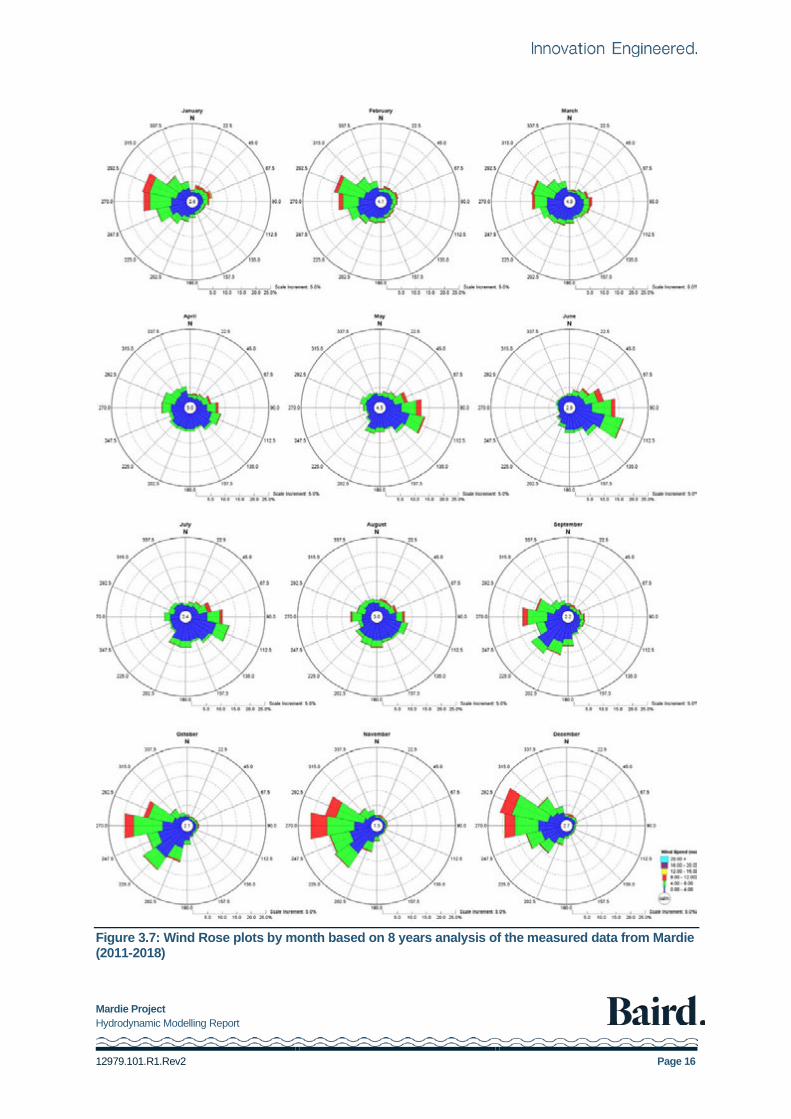
Wind rose plots for each respective month of measured data from Mardie across the 8-year measured dataset are shown in Figure 3.7.
Mardie Project Hydrodynamic Modelling Report
12979.101.R1.Rev2 Page 16
Figure 3.7: Wind Rose plots by month based on 8 years analysis of the measured data from Mardie (2011-2018)

Mardie Project Hydrodynamic Modelling Report
12979.101.R1.Rev2 Page 17
Based on analysis of the monthly wind data (Figure 3.7), the key periods for the wet season and dry season as well as transition periods between the seasons is summarised as follows: • Dry season – May to August • Wet season – November to February • Transition from wet to dry season – March and April • Transition from dry to wet season – September and October
Wind rose plots for the Dry Season months (May to August) and Wet Season months (November to February) are presented in Figure 3.8 based on analysis of the measured wind records from Mardie BoM Station over the period 2011 - 2018.
Figure 3.8: Wind Rose for Dry Season (left) and Wet Season (Right) based on analysis of Mardie BoM data (2011-2018)
The wind rose plots for the two transition periods are shown in Figure 3.9.
Figure 3.9: Wind Rose for Dry Season transition (left) and Wet Season transition (Right) based on analysis of Mardie BoM data (2011-2018)

Mardie Project Hydrodynamic Modelling Report
12979.101.R1.Rev2 Page 18
3.3.2 Rainfall
The Mardie regional climate is classed by the Bureau of Meteorology (BoM) as ‘Grassland’ characterised by year-round hot weather. Rains occur predominately in the first half of the year with summer rainfall related to tropical lows including cyclones and ex-tropical cyclones. Winter rains are typically the result of the northern extent of large southern fronts (BCIM 2018). Evaporation rates in the region are high, estimated to exceed by ten times the annual rainfall.
Table 3.4: Mardie Mean Rainfall Data (BoM)
Month J F M A M J J A S O N D Annual
Rainfall (mm)
38.3 62.7 49.2 19.3 37.1 37.6 14.0 7.1 1.3 0.8 1.5 8.9 277.8
3.4 Water Quality Processes Overview
Measured data from the Mardie inshore location analysed by O2Marine to produce salinity and temperature statistics for the Wet season, Dry season and transition periods is shown in Table 3.5 and Table 3.6 respectively. These datasets will be applied in the Bitterns outfall modelling cases.
Table 3.5: Salinity Statistics – Analysis of Inshore Location (O2 Marine, 2019)
Salinity (ppt)
Season Month Median Maximum Minimum 80th Percentile
95th percentile
May 37.49 38.04 37.29 37.67 37.68
Dry June 37.53 38.04 36.85 37.61 37.64
July 37.48 38.04 36.85 37.59 37.63
Aug 37.51 38.31 36.64 37.62 37.69
Dry Transition
Sept 37.50 37.89 36.91 37.55 37.58
Oct 37.51 38.31 36.64 37.63 37.70
Nov 37.48 37.70 37.32 37.53 37.56
Wet Dec 37.51 37.75 37.38 37.57 37.60
Jan 37.52 37.79 36.89 37.61 37.66
Feb 37.52 37.85 37.13 37.61 37.66
Wet Transition
Mar 37.54 38.31 37.01 37.66 37.90
Apr 37.44 38.03 36.64 37.62 37.70

Mardie Project Hydrodynamic Modelling Report
12979.101.R1.Rev2 Page 19
Salinity (ppt)
Season Median Maximum Minimum 80th Percentile
95th percentile
Dry Season Average 37.51 38.31 36.64 37.62 37.73
Dry Transition Average 37.51 38.31 36.64 37.63 37.85
Wet Season Average 37.51 37.85 36.89 37.59 37.69
Wet Transition Average 37.51 38.31 36.64 37.63 37.88
Table 3.6: Temperature Statistics – Analysis of Inshore Location (O2 Marine, 2019)
Water Temperature (˚C)
Season Month Median Maximum Minimum 80th Percentile
95th percentile
May 22.93 26.08 21.97 24.29 25.82
Dry June 21.63 23.89 17.70 23.23 23.67
July 20.50 21.52 18.01 21.05 21.31
Aug 20.47 23.96 18.35 21.06 22.24
Dry Transition
Sept 22.39 25.37 18.96 23.31 24.46
Oct 24.20 26.33 22.81 24.56 25.40
Nov 25.13 26.70 22.38 25.91 26.24
Wet Dec 26.50 29.35 23.68 28.06 28.92
Jan 29.87 31.81 28.66 30.78 31.33
Feb 29.91 31.25 28.41 30.40 30.84
Wet Transition
Mar 31.28 32.50 24.30 31.68 32.02
Apr 29.95 32.54 24.45 31.81 32.22
Season Median Maximum Minimum 80th Percentile
95th percentile
Dry Season Average 21.11 23.96 17.70 22.79 23.58
Dry Transition Average 23.48 26.33 18.96 24.34 24.91
Wet Season Average 29.52 31.81 23.68 30.37 31.15
Wet Transition Average 30.86 32.54 24.30 31.76 32.15
Mardie Project Hydrodynamic Modelling Report
12979.101.R1.Rev2 Page 20
4. Hydrodynamic Model Setup
4.1 Model System
The hydrodynamic model has been developed using the Delft3D modelling system (Deltares 2018). Delft3D is an integrated modelling suite, which simulates two-dimensional (in either the horizontal or a vertical plane) and three-dimensional flow, sediment transport and morphology, waves, water quality, and ecology and can handle the interactions between these processes.
The Delft3D system is built around modules that can be coupled to simulate specific processes. For the hydrodynamics, the FLOW module was used to simulate the flows with wave conditions added into the simulations using the WAVE module. For sediment transport modelling in the dredge plume analysis the morphology module MOR was activated. The model has been setup in 2D for validation of the hydrodynamics, with some initial 3D simulations reported. Both 2D and 3D simulations will be applied in the bitterns outfall and dredging project modelling investigations.
4.2 Model Domain
For this project Baird has utilised its existing regional scale hydrodynamic model for the north-west shelf to provide boundary inputs (water levels) to a local scale model at high resolution for the Mardie coast around the project site.
4.2.1 Regional Scale Model
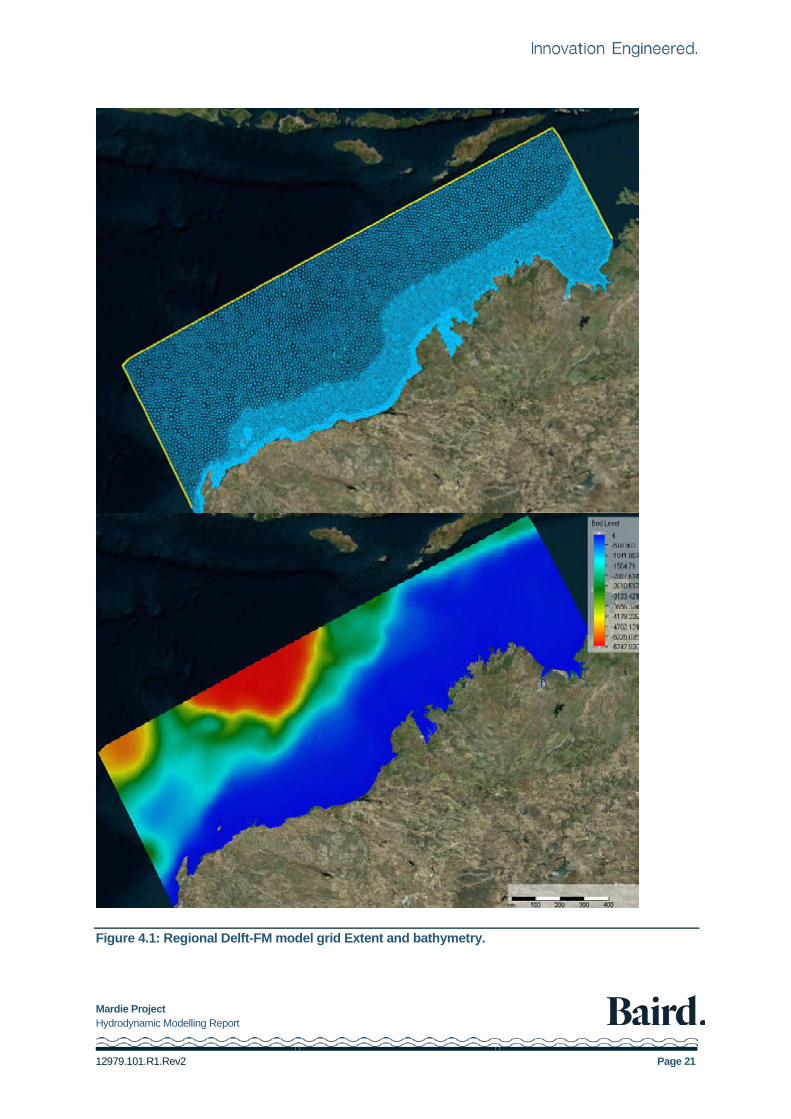
The regional scale model has adopted Baird’s existing Delft-Flow Flexible Mesh (D-Flow FM) model of northwest Australia. The model extent is shown in Figure 4.1 extending across the entire northern coast of Western Australia. The flexible mesh grid is triangular with increasing resolution shoreward and ranges from approximately 5km offshore to 500m along coastal areas. The model is driven by tidal constituents along its open boundaries with bathymetry defined from hydrographic chart data and local scale bathymetry sources where available.
For this project, winds and atmospheric pressure have been sourced from the NCEP Climate Forecast System (CFSR). The climatic conditions were then applied spatially in D-FLOW FM and updated hourly across the regional model in conjunction with the tides, so their influence was captured in the determination of hydrodynamic forces acting in the domain.
The local scale model boundary conditions have been defined from the regional scale model as present in Figure 4.5
Mardie Project Hydrodynamic Modelling Report
12979.101.R1.Rev2 Page 21
Figure 4.1: Regional Delft-FM model grid Extent and bathymetry.

Mardie Project Hydrodynamic Modelling Report
12979.101.R1.Rev2 Page 22
4.2.2 Local Scale Model
The local scale model is established over the Mardie area with boundary conditions defined by the Regional model. The local model is setup in a domain decomposition grid arrangement to optimise the efficiency of the model performance. The outer grid extends along the shoreline approximately 70km with a cross shore extent of approximately 45km. The outer grid is setup on a 200m grid size, and a smaller domain within sized at 40m extends around the marine precinct of the port and channel area. Two smaller grids sized at 8m are focussed over the key region of interest encompassing the port area and transhipment channel.
An overview of the model is shown in Figure 4.2, with the key characteristics of the model specified in Table 4.1. The local model is able to be run in 2D (depth-averaged) and 3D in sigma-layer or Z-layer mode. The specifications for the 2D and 3D modes are presented in Table 4.1.
Table 4.1: Delft Flow Model setup summary
Feature Description
Grid size / type Domain Decomposition (DD) - Regular Grids at 200m, 40m and 8m.
Grid Extent Outer Grid: 45km x 70km
3D sigma layer model1 5-vertical sigma layers with layer thicknesses of 20% all the way through the water column.
3D z-layer model1
13-vertical layer fixed model with layer thicknesses (top to bottom). For the berth pocket (8.65m MSL) this is equivalent to the lower layer at a depth below mean sea level of 1.2m, 1.7m, 2.2m, 2.5m, 2.8m, 3.0m, 3.3m, 3.5m, 3.8m, 4.5m, 5.1m, 6.3m and 8.7m
Vertical Datum Mean Sea Level (m MSL) which is approximately Australian Height Datum (AHD)
Horizontal eddy diffusivity coefficient Across the DDGrids 200m / 40m / 8m: 25 / 5 / 1 m2/s
Horizontal eddy viscosity coefficient Across the DDGrids 200m / 40m / 8m: 25 / 5 / 1 m2/s
Vertical eddy viscosity / diffusivity k-ε turbulence closure model
Time step (2D model) 0.25 mins (15 secs)
Time step (3D z-layer) 0.1 mins (6 secs)
Time step (3D sigma-layer) 0.1 mins (6 secs)
Bed friction Chezy 55m1/2/s
1. Validation of the hydrodynamics is primarily completed in this report executing the model in 2D, which uses depth averaging. Preliminary model simulations in full 3D using a 10 layer sigma model are reported to provide comparison of flow characteristics through the water column against the 2D cases.

Mardie Project Hydrodynamic Modelling Report
12979.101.R1.Rev2 Page 23
Figure 4.2: Local Hydrodynamic Model - Domain Decomposition Grid setup
4.3 Model Setup
4.3.1 Bathymetry
The existing case bathymetry has been compiled from the available data sources around the Mardie project location with all data converted to mean sea level (MSL) according to the Mardie 2018 tidal planes in the numerical model (refer Table 3.1).
The bathymetry and survey data sources are as follows in order of preference (highest to lowest): 1. High resolution multibeam survey of the revised channel infill, transhipment route and proposed
cyclone mooring site completed in August 2019 (TAMS 2019) 2. Class A hydrographic survey of the approach channel, berth pocket and nearshore areas (EGS survey
2019); 3. Low resolution bathymetric survey completed by O2 Marine in September 2018; 4. Land elements defined across the tidal flats (0.25m contours); and 5. Hydrographic Chart data (AUS742 and 743).
The compiled bathymetry grid is shown in Figure 4.3.
For the developed case bathymetry, Mardie Minerals supplied digital elevation data files detailing the berth pocket, dredge channel and batter slopes which were converted to the Mardie 2018 MSL datum for incorporation into the existing model domain (Figure 4.4).
200m Grid
8m Grid 40m Grid

Mardie Project Hydrodynamic Modelling Report
12979.101.R1.Rev2 Page 24
Figure 4.3: Bathymetry Grid for Local Scale Model (Datum mMSL Mardie 2018)

Mardie Project Hydrodynamic Modelling Report
12979.101.R1.Rev2 Page 25
Figure 4.4: Bathymetry Grid – Developed Case Port Precinct (Datum mMSL Mardie 2018)
4.3.2 Boundary Conditions
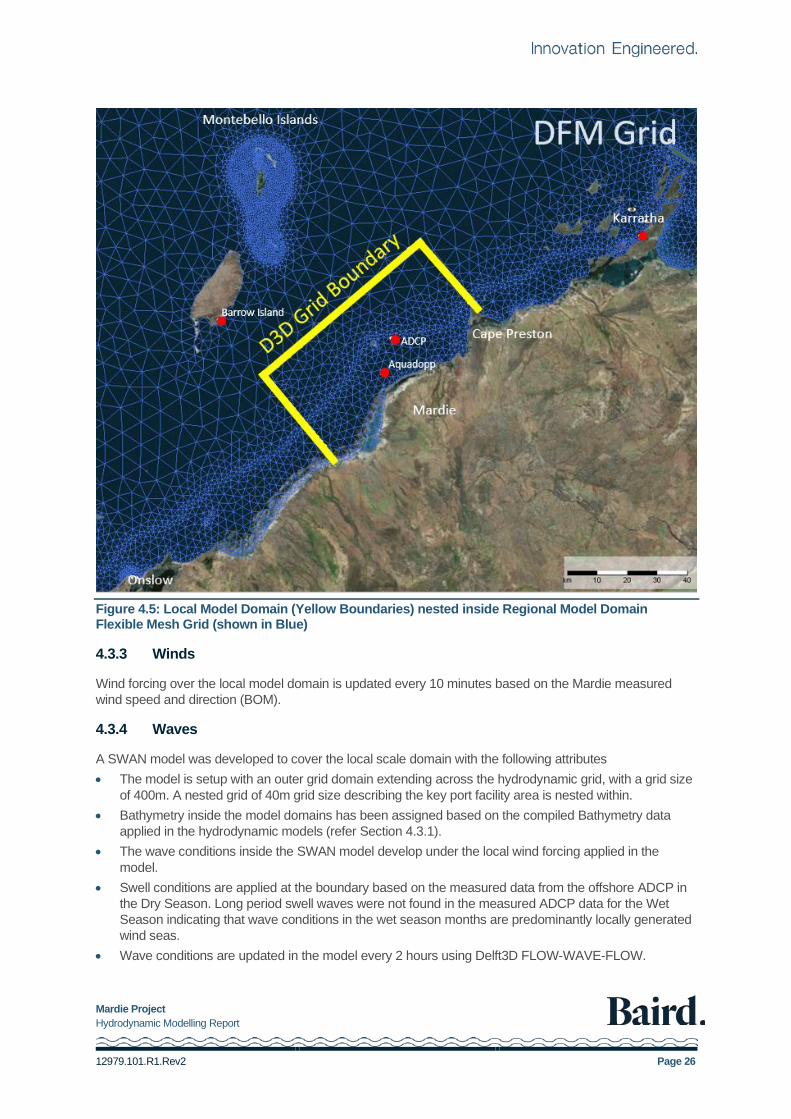
The local model is driven by three offshore water level boundaries with the conditions defined from the regional scale model as shown in Figure 4.5. The eastern, western and northern boundaries are water level boundaries with conditions defined from the Regional Model. For the local model, water level is updated every 10 minutes at the boundary.
Mardie Project Hydrodynamic Modelling Report
12979.101.R1.Rev2 Page 26
Figure 4.5: Local Model Domain (Yellow Boundaries) nested inside Regional Model Domain Flexible Mesh Grid (shown in Blue)
4.3.3 Winds
Wind forcing over the local model domain is updated every 10 minutes based on the Mardie measured wind speed and direction (BOM).
4.3.4 Waves
A SWAN model was developed to cover the local scale domain with the following attributes • The model is setup with an outer grid domain extending across the hydrodynamic grid, with a grid size
of 400m. A nested grid of 40m grid size describing the key port facility area is nested within. • Bathymetry inside the model domains has been assigned based on the compiled Bathymetry data
applied in the hydrodynamic models (refer Section 4.3.1). • The wave conditions inside the SWAN model develop under the local wind forcing applied in the
model. • Swell conditions are applied at the boundary based on the measured data from the offshore ADCP in
the Dry Season. Long period swell waves were not found in the measured ADCP data for the Wet Season indicating that wave conditions in the wet season months are predominantly locally generated wind seas.
• Wave conditions are updated in the model every 2 hours using Delft3D FLOW-WAVE-FLOW.

Mardie Project Hydrodynamic Modelling Report
12979.101.R1.Rev2 Page 27
4.4 Model Settings
A summary of the model settings is provided in Table 4.2.
Table 4.2: Delft3D Flow-Wave-Flow Settings
Feature Description
Boundary Conditions (Water Level) Water Level updated at 10-minute timestep along the west, east and north boundary. Conditions extracted from Regional scale model
Wind Conditions Wind Speed and Direction applied over the local model domain. Updated every 10-mins based on the Mardie weather station data (BoM)
Wave Conditions
A SWAN model domain extends across the full region of the hydrodynamic model.
• The wave conditions inside the SWAN model are developed based on the wind forcing in the model domain (developing short period wind-sea).
• Low amplitude long period Swell waves are input at the boundary based on measured data from the offshore ADCP location.
• The local model is run using the Delft3D FLOW-WAVE-FLOW configuration. The wave conditions are updated every 2 hours and applied to the hydrodynamic model.
4.5 Representative Seasonal Scenarios Modelled
The modelling program for the Bitterns Outfall modelling and the Dredge Plume Modelling phases of this study are based on scenario modelling. The scenario modelling approach has been adopted to optimise the model run times, as continuous modelling of environmental conditions over the full year would be impractical due to the long run times of the model system.
In developing the scenario approach, modelling cases of four weeks duration have been selected that are representative of the dry season and wet season at Mardie. It is noted that the periods selected correspond with times where model validation is presented as detailed in the next section.
4.5.1 Dry Season
The period selected as representative of the dry season period was 4 July – 1 August 2018. The month of July was selected based on the following: 1. The winds in July from the measured data (3.3.1) represent generally the key wind directions over the
Dry season months May, June July and August (Figure 3.7). Analysis of the measured data indicates the wind speed characteristics in July is generally descriptive of the average of the dry season months.
2. The wave conditions in July are representative of the wave height experienced in dry season months on average. Hindcast wave data from the ERA5 Global Hindcast reanalysis dataset at an open water location offshore of Mardie (NW of Barrow Island) was analysed over the period 2008 to 2018. The mean significant wave height for the 10 years of data for the dry season months was 2.6m (June, July, August) with wave conditions governed by swells. The hindcast data for July 2018 indicated a mean significant wave height of 2.4m and was selected as representative of an average year.
Mardie Project Hydrodynamic Modelling Report
12979.101.R1.Rev2 Page 28
4.5.2 Wet Season
The period selected as representative of the wet season period was 18 December 2018 – 15 January 2019. The month of December 2018 was selected based on the following: 1. The winds in December from the measured data (3.3.1) represent generally the key wind directions
over the Wet season months November, December, January and February (Figure 3.7). Analysis of the measured data indicates the wind speed characteristics in the mid-December to mid-January period selected is generally descriptive of the average of the wet season months.
2. The wave conditions in December are representative of the wave height experienced in wet season months on average. Hindcast wave data from the ERA5 Global Hindcast reanalysis dataset was analysed over the period 2008 to 2018. The mean significant wave height for the 10 years of data for the wet season months was 2.1m (November, December, January) with wave conditions governed by wind-sea. The mean significant wave height for December 2018 also indicated a mean significant wave height of 2.1m.
4.5.3 Transition Cases
Transition months are those that occur between the adopted wet and dry season periods. Metocean conditions exhibit a mixture of the seasonal wind and wave conditions. For the study the following is considered as transitional with representative cases to be applied in the bitterns outfall modelling: • Wet season to dry season transition – March to April; and • Dry Season to wet season transition – September and October.
A similar examination of the winds in the transitional months against the full wind dataset showed that the periods 12 March – 9 April 2018 and 3 September – 1 October 2018 were representative of the environmental conditions of the respective transition periods over the full dataset.
Mardie Project Hydrodynamic Modelling Report
12979.101.R1.Rev2 Page 29
5. Hydrodynamic Model Validation
5.1 Validation of Regional Model
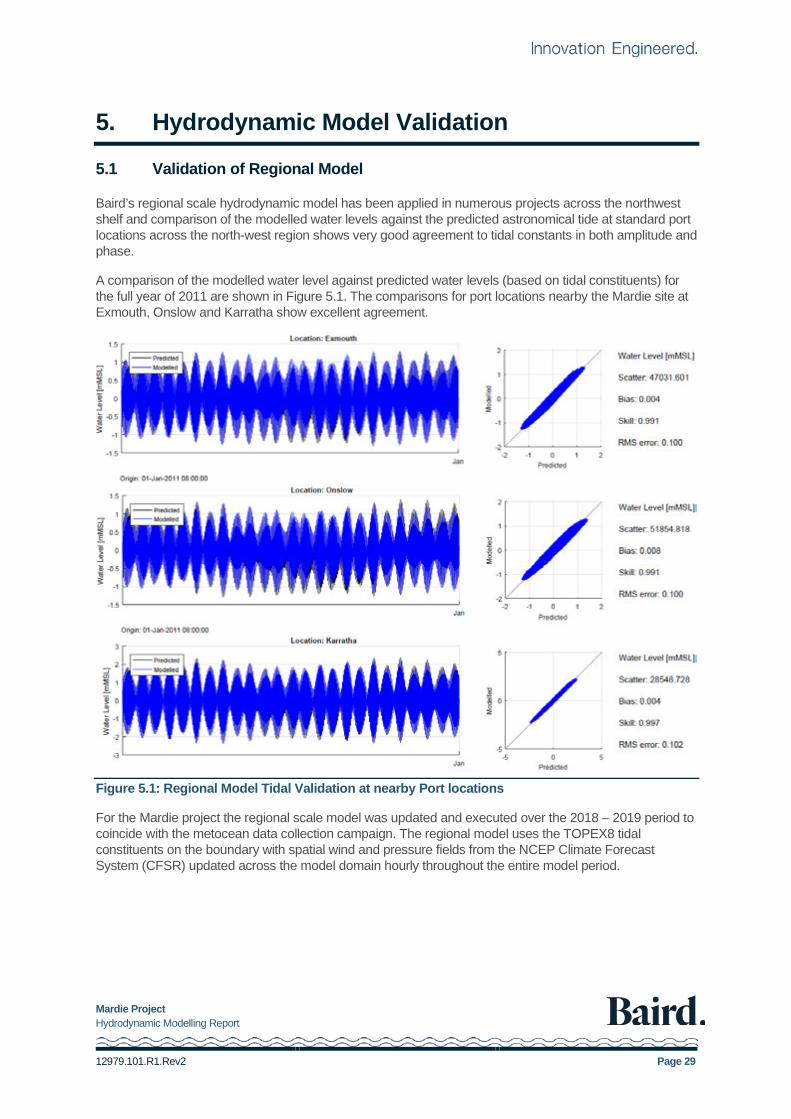
Baird’s regional scale hydrodynamic model has been applied in numerous projects across the northwest shelf and comparison of the modelled water levels against the predicted astronomical tide at standard port locations across the north-west region shows very good agreement to tidal constants in both amplitude and phase.
A comparison of the modelled water level against predicted water levels (based on tidal constituents) for the full year of 2011 are shown in Figure 5.1. The comparisons for port locations nearby the Mardie site at Exmouth, Onslow and Karratha show excellent agreement.
Figure 5.1: Regional Model Tidal Validation at nearby Port locations
For the Mardie project the regional scale model was updated and executed over the 2018 – 2019 period to coincide with the metocean data collection campaign. The regional model uses the TOPEX8 tidal constituents on the boundary with spatial wind and pressure fields from the NCEP Climate Forecast System (CFSR) updated across the model domain hourly throughout the entire model period.

Mardie Project Hydrodynamic Modelling Report
12979.101.R1.Rev2 Page 30
5.2 Validation of Local Model
5.2.1 Hydrodynamic Model Validation
The validation for the hydrodynamic model has been undertaken over a 4-week period in the Wet Season and Dry season respectively where contemporaneous data was available from both the offshore and inshore locations (ADCP and Aquadopp instruments). The adopted periods were: • Wet Season: 18 December 2018 – 15 January 2019 with model warm-up period of 2 days prior; and • Dry Season: 3 June 2019 – 1 July 2019 with model warm-up period of 2 days prior.
The metocean data collection, detailed in Section 2.2, provides measured winds, waves, currents and water levels covering the two validated model periods. The selected date range for the both modelled season validation periods corresponds with a time where metocean data is available from both inshore and offshore sites (Figure 2.1) and where two full spring tides and two full neap tide cycles are completed through the duration.
For the validation of the model, the modelled and measured data is presented as graphical times series in the sections to follow. The detailed statistical analysis of the performance of the model is summarised in Section 5.2.2 thereafter.
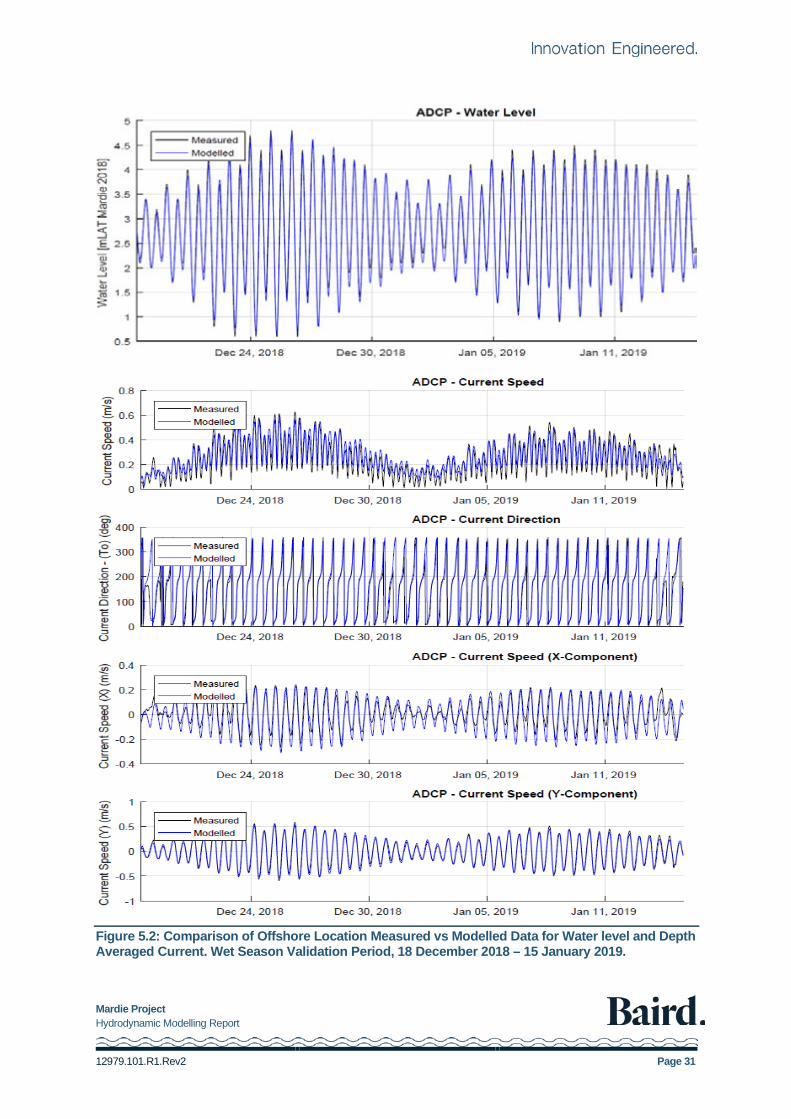
The time series plots are presented as follows for the validation: • The comparison of the modelled data against the measured data for the water level, current speed
(depth averaged) and direction is shown in Figure 5.2 (Wet Season) and Figure 5.4 (Dry Season) for the offshore location – ADCP. The current velocity has been separated into the X and Y components for the analysis shown in Figure 5.2 and Figure 5.4.
• The comparison of the modelled data against the measured data for the water level, current speed (depth averaged) and direction is shown in Figure 5.3 (Wet Season) and Figure 5.5 (Dry Season) for the inshore location. The current velocity has been separated into the X and Y components for the analysis shown in Figure 5.3 and Figure 5.5.
Mardie Project Hydrodynamic Modelling Report
12979.101.R1.Rev2 Page 31
Figure 5.2: Comparison of Offshore Location Measured vs Modelled Data for Water level and Depth Averaged Current. Wet Season Validation Period, 18 December 2018 – 15 January 2019.

Mardie Project Hydrodynamic Modelling Report
12979.101.R1.Rev2 Page 32
Figure 5.3: Comparison of Inshore Location Measured vs Modelled Data for Water level and Depth Averaged Current. Wet Season Validation Period, 18 December 2018 – 15 January 2019.

Mardie Project Hydrodynamic Modelling Report
12979.101.R1.Rev2 Page 33
Figure 5.4: Comparison of Offshore Location Measured vs Modelled Data for Water level and Depth Averaged Current. Dry Season Validation Period, 1 June 2019 – 1 July 2019.

Mardie Project Hydrodynamic Modelling Report
12979.101.R1.Rev2 Page 34
Figure 5.5: Comparison of Inshore Location Measured vs Modelled Data for Water level and Depth Averaged Current. Dry Season Validation Period, 1 June 2019 – 1 July 2019.

Mardie Project Hydrodynamic Modelling Report
12979.101.R1.Rev2 Page 35
5.2.2 Model Metrics -Statistical Descriptions
The model performance has been analysed by comparing the model predictions against the measured data using the statistical descriptions 1. Model skill 2. Bias 3. RMS Error 4. Scatter Index
The derivation of the parameters is outlined in brief in the following sections.
5.2.2.1 Model Skill
The model skill at simulating the measured conditions is given by Equation 5.1. This produces 0 in cases of no agreement and 1 for perfect agreement between the modelled and measured data.
𝑀𝑀𝑀𝑀𝑀𝑀𝑀𝑀𝑀𝑀𝑀𝑀𝑀𝑀𝑀𝑀𝑀𝑀𝑀𝑀 = 1 − ∑ [𝑀𝑀𝑖𝑖−𝑂𝑂𝑖𝑖]2𝑁𝑁𝑖𝑖=1
∑ ([𝑀𝑀𝑖𝑖−𝑂𝑂�𝑖𝑖]+ [𝑂𝑂𝑖𝑖−𝑂𝑂�𝑖𝑖])2𝑁𝑁𝑖𝑖=1
(5.1)
where:- • Oi observed, or measured data (m/s for wind speed) - Seawinds in this case • Mi modelled data (m/s for wind speed) – CFSR, CORDEX and NARCliM scenarios
5.2.2.2 Bias
The bias is a measure of the difference between the expected value and the true value of a parameter and is calculated using Equation 5.2. An unbiased model has a zero bias. Otherwise the model is said to be positively or negatively biased, an indication as to whether the model is persistently over or under-predicting the physical conditions, respectively.
𝐵𝐵𝑀𝑀𝐵𝐵𝐵𝐵 = 1𝑁𝑁∑ 𝑀𝑀𝑖𝑖 − 𝑂𝑂𝑖𝑖𝑁𝑁𝑖𝑖=1 (5.2)
5.2.2.3 RMS Error
The RMS error, Equation 5.3, is also a measure of the difference between the expected value and the true value of a parameter. It provides a measure of the magnitude of the difference between the modelled and measured values.
𝑅𝑅𝑀𝑀𝑀𝑀 = �1𝑁𝑁∑ [𝑀𝑀𝑖𝑖 − 𝑂𝑂𝑖𝑖]2𝑁𝑁𝑖𝑖=1 (5.3)
5.2.2.4 Scatter index
The scatter index is the RMS error normalised by the mean of the observations – see Equation 5.4. It provides an indication of the scatter of the data about the mean.
𝑀𝑀𝑆𝑆 = �1𝑁𝑁∑ ([𝑀𝑀𝑖𝑖−𝑀𝑀�]−[𝑂𝑂𝑖𝑖−𝑂𝑂�])2𝑁𝑁
𝑖𝑖=1
𝑂𝑂� (5.4)

Mardie Project Hydrodynamic Modelling Report
12979.101.R1.Rev2 Page 36
5.2.3 Model Validation – Water Levels and Currents
The model metrics have been calculated for the water level, current speed and direction components (X and Y directionality) against the measured data in the model cases presented in Figure 5.2 to Figure 5.4,. The metrics are presented in Table 5.1.
Table 5.1: Model Metrics for water level, depth-averaged current velocity and direction
Location Component Skill Bias Scatter RMS Error
Offshore Location ADCP WET SEASON
Water level 0.99 -0.03 0.06 0.17
Current Speed 0.95 0.02 0.21 0.05
Current x axis (E-W) 0.94 -0.02 0.19 0.05
Current y axis (N-S) 0.99 -0.02 0.07 0.04
Inshore Location, Aquadopp WET SEASON
Water level 0.99 0.04 0.06 0.15
Current Speed 0.88 0.03 0.35 0.07
Current x axis (E-W) 0.96 -0.01 0.16 0.07
Current y axis (N-S) 0.91 -0.03 0.32 0.07
Offshore Location ADCP DRY SEASON
Water Level 0.99 0.02 0.05 0.14
Current Speed 0.95 0.00 0.22 0.05
Current x axis (E-W) 0.93 0.01 0.16 0.06
Current y axis (N-S) 0.99 -0.01 0.08 0.05
Inshore Location Aquadopp DRY SEASON
Water Level 1.00 -0.04 0.05 0.13
Current Speed 0.88 0.04 0.41 0.07
Current x axis (E-W) 0.95 0.01 0.16 0.07
Current y axis (N-S) 0.97 -0.01 0.15 0.05
The validation metrics are good for all parameters with good model skill and low bias and error metrics. General comments on the Model metrics in Table 5.1 are provided as follows: • The water level at the offshore location in the model is very closely matched to the measured data with
a model skill value of 0.99 in both the wet season and dry season cases. The modelled offshore water level bias is -0.03m and 0.02m for the wet season and dry season respectively with very low scatter and RMS error.
• The water level at the inshore location has a model skill value of 0.99 in wet season and 1.00 in dry season, with biases of +0.04m and -0.04 respectively, compared to the measured data. The scatter and RMS error values are low indicating the water level in the model is consistent with the measured data through the time series.
• At the offshore location in the model the current magnitude has a model skill of 0.95 in the wet and dry season, confirming the model is representing the current magnitude very well. The directionality of the currents at the ADCP is described in the x-axis and y-axis components of the current and in Table 5.1.
Mardie Project Hydrodynamic Modelling Report
12979.101.R1.Rev2 Page 37
The skill is very high for the y component at 0.99 in both seasons, while for the x component the skill is high at 0.94 and 0.93 respectively for the wet and dry season cases. The bias values are below ±0.03ms-1 for the current directionality confirming the model is representing the current magnitude and direction well at the offshore ADCP location.
• For the inshore location the model skill at simulating the measured current magnitude is 0.88 for wet season and dry season, which shows a good description of the overall current magnitudes through the four-week simulation periods, with biases of 0.03ms-1 and 0.04ms-1. The individual components of current in the x-axis and y-axis achieve model skill metrics of 0.96 and 0.91 in wet season, and 0.95 and 0.97 in dry season, indicating the model is representing the current direction components well. The bias of the y-axis component is 0.03ms-1 in wet season, and the influence can be seen in Figure 5.3 where modelled speeds are marginally higher in the south direction against the measured data.
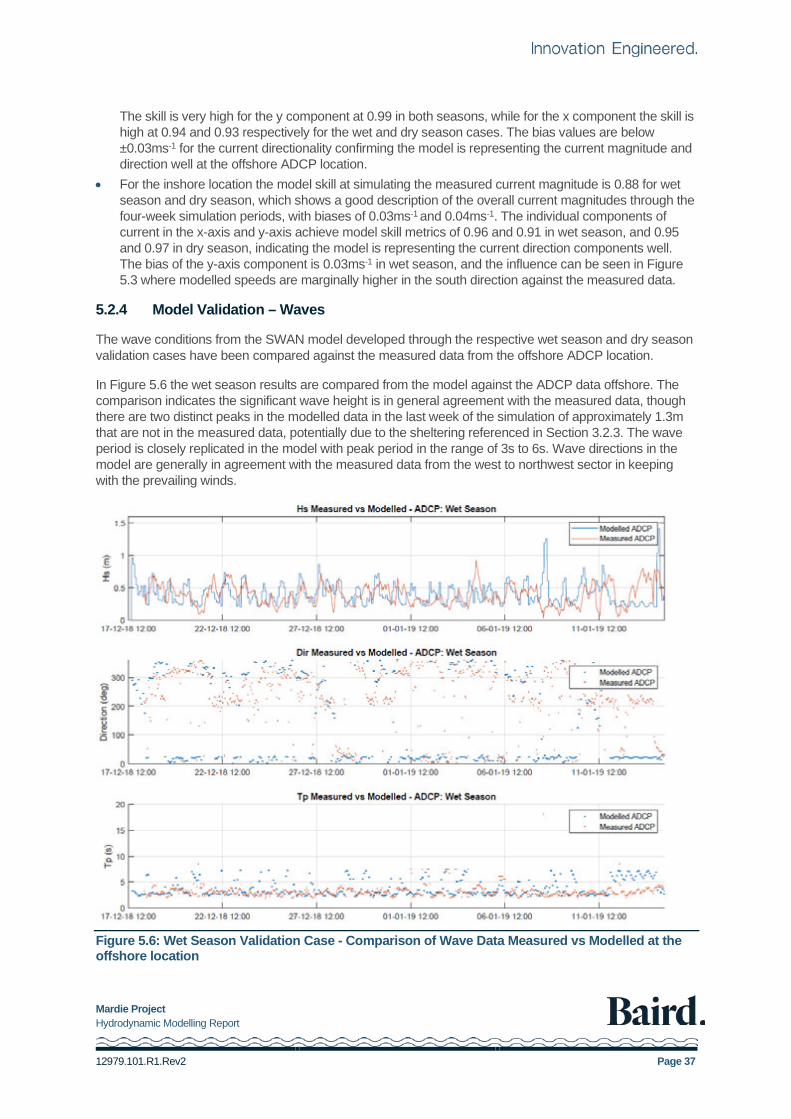
5.2.4 Model Validation – Waves
The wave conditions from the SWAN model developed through the respective wet season and dry season validation cases have been compared against the measured data from the offshore ADCP location.
In Figure 5.6 the wet season results are compared from the model against the ADCP data offshore. The comparison indicates the significant wave height is in general agreement with the measured data, though there are two distinct peaks in the modelled data in the last week of the simulation of approximately 1.3m that are not in the measured data, potentially due to the sheltering referenced in Section 3.2.3. The wave period is closely replicated in the model with peak period in the range of 3s to 6s. Wave directions in the model are generally in agreement with the measured data from the west to northwest sector in keeping with the prevailing winds.
Figure 5.6: Wet Season Validation Case - Comparison of Wave Data Measured vs Modelled at the offshore location

Mardie Project Hydrodynamic Modelling Report
12979.101.R1.Rev2 Page 38
In Figure 5.7 the dry season results are compared from the model against the ADCP data offshore. The comparison indicates the significant wave height is in good agreement with the measured data. The wave period is generally in the range of wind-sea in the first week of the month and then shifts to a mixture of wind-sea and longer period low amplitude swell in the remainder of the month. The measured wave periods are generally replicated in the model through the simulation. Wave directions in the model are generally in agreement with the range of directions in the measured data. For the purposes of including wave effects in hydrodynamic and sediment transport modelling required in Baird’s scope of work, the wave model validation is suitable.
Figure 5.7: Dry Season Validation Case - Comparison of Wave Data Measured vs Modelled at the offshore location
5.2.5 Spatial Current Fields
Spatial current fields from the local scale model are presented in Figure 5.10 for the ebb tide case during a large spring tide. The spatial current field for a large flood tide map is shown in Figure 5.9. At this scale the influence of the offshore islands and reefs to the east and west of the offshore and inshore measurement locations is clearly evident. At the offshore location the current field is directed in a generally north-south alignment through the peak of the ebb and flood cycle. In comparison the inshore location shows the current vectors are directed along a more northeast-southwest alignment in the flood and ebb cases shown in Figure 5.8 and Figure 5.9. The current speeds at the inshore location are lower than the current speed at the offshore location in the spatial maps. These modelled outcomes correspond with the analysis of the measured current data and rose plots in the metocean summary in Section 3.2.4.
For the port precinct, the modelled spatial current fields are shown in Figure 5.10 for the ebb tide case and in Figure 5.11 for the flood tide case. In Figure 5.10 the influence of the deep berth pocket is clearly evident

Mardie Project Hydrodynamic Modelling Report
12979.101.R1.Rev2 Page 39
on the current velocity, with a marked reduction of current speed in this area of the map. Of interest the current velocity is focussed inside the transhipment channel leading out of the berth area up through the channel in Figure 5.10.
Figure 5.8: Local Model Grid – Ebb Tide for Large Spring Tide Case (25 Dec 2018 2100UTC)
Figure 5.9: Local Model Grid – Flood Tide for Large Spring Tide Case (26 Dec 2018 0400UTC)

Mardie Project Hydrodynamic Modelling Report
12979.101.R1.Rev2 Page 40
Figure 5.10: Modelled Ebb Tide Currents in large spring tide for port precinct (25/12/2018 2100 UTC)
Figure 5.11: Modelled Flood Currents in large spring tide for port precinct (26/12/2018 1400 UTC)

Mardie Project Hydrodynamic Modelling Report
12979.101.R1.Rev2 Page 41
Similarly, for the flood currents presented in Figure 5.11 the current velocity is reduced around the dredged area of the berth pocket and the southern region of the port precinct due to the additional depth in this section compared to the existing seabed.
5.2.6 2D and 3D Model Comparisons
Analysis of the 2D and 3D current velocity and direction at the inshore location from the model results and the measured data (Aquadopp) to compare the characteristics of the flow through the water column was completed.
The depth averaged current velocity from the 2D model was compared against the modelled velocity at surface, mid-depth and near bed level in a 10 vertical layer 3D sigma-layer model. This comparison is shown in Figure 5.12 for a time of large spring tides over the 48-hour period 25 – 26 December 2018. The comparison of the 2D depth average and mid-depth current in the 3D simulation shows close agreement. The upper surface current velocity from the 3D simulation is approximately 10% higher than the mid-depth current speed and the bed layer currents show a reduction in velocity of approximately 30% compared with the mid-depth. The application of the 3D model will be important to resolve density driven flows in the bitterns outfall modelling.
Figure 5.12: Comparison of modelled 2D and 3D current speed timeseries data from inshore Aquadopp location.
The current velocity from the 3D model at the specific model layers at the surface, mid-depth and near bed level were compared against the measured data from the Aquadopp instrument. This comparison is shown in Figure 5.13 for a time of large spring tides over the 48-hour period 25 – 26 December 2018. The measured current velocity and current direction is reasonably reproduced in the model. The comparisons show the direction of the current is reasonably uniform through the water column. Overall, the 2D model is suitable to describing far field flow processes in the study area and the depth-averaged assumption is valid for period of validation and calibration data. The 2D and sigma-layer 3D model show good agreement in flow structure and conditions. Validation and outcomes from the z-layer 3D model will be presented in the bitterns modelling report (Baird, 2020).

Mardie Project Hydrodynamic Modelling Report
12979.101.R1.Rev2 Page 42
Figure 5.13: Comparison of 2D and 3D current speed and direction modelled and measured data from the Aquadopp location (inshore)

Mardie Project Hydrodynamic Modelling Report
12979.101.R1.Rev2 Page 43
6. Conclusions
The Mardie Project is a Greenfields high-quality salt project proposed in the Pilbara region of Western Australia. Baird Australia Pty Limited (Baird) has been engaged by Mardie Minerals to develop a hydrodynamic modelling program to support the environmental approvals process in the following studies: • Modelling of dredge plumes associated with the initial dredging of the port facility and marine precinct
and the preparation of a Dredging and Spoil Disposal Management Plan (DSDMP); and • Modelling of mixing and dilution of the planned bitterns discharge into the marine environment and
preparation of an Environmental Quality Plan (EQP).
O2 Marine have been engaged by Mardie Minerals to prepare the DSDMP and EQP.
To support the hydrodynamic modelling and impact assessments, metocean measurements have been collected from an inshore location nearby the planned marine precinct (approximately 4km offshore) and from an offshore location (approximately 16km offshore) by O2Marine. From these sites, data has been collected over the period April 2018 to present. • At the offshore location an ADCP is deployed providing water level, wave height and direction, current
speed and direction. Water Quality is also measured for Light, Temperature, turbidity (TDS). • Inshore the water level and current speed and direction is measured by an Aquadopp Instrument.
Water Quality is also measured for Temperature, pH, salinity (EC), Dissolved oxygen (DO).
These data sets have been compiled and a summary of the metocean conditions is presented for the Mardie project in Section 3. In general: • The current velocity is higher offshore compared to the inshore site and flood currents are higher than
ebb tide current velocity. The direction of the offshore currents is aligned generally a north-south axis, whilst for the inshore site, currents are on a north-east to south-west plane.
• Wave conditions from the offshore location indicate the wave climate at the location is benign and largely governed by wind-sea generated locally by the prevailing wind climate. Some low amplitude swell is present in the measured data in the dry season data, with no observed swell energy in the wet season.
Analysis of the measured climate data from a Bureau of Meteorology site at Mardie Station on the eastern boundary of the site confirms distinct wet and dry season conditions at the location: • The dry season (generally May to October) is characterised by warm to hot temperatures, easterly to
south-easterly winds and clear and stable conditions derived from the subtropical high-pressure ridge. • In the wet season months (generally November to April) the wind climate is more active and
dominated by westerly and north-westerly winds.
The regional and local scale model system was established for the project: 1. The regional scale hydrodynamic model has adopted Baird’s existing Delft-Flow Flexible Mesh (D-
Flow FM) model of northwest Australia. The flexible mesh grid is triangular with increasing resolution shoreward and ranges from approximately 5km offshore to 500m along coastal areas. The model is driven by tidal constituents along its open boundaries with bathymetry defined from hydrographic chart data and local scale bathymetry sources where available. For this project, winds and atmospheric pressure have been sourced from the NCEP Climate Forecast System (CFSR). The climatic conditions were then applied spatially in D-FLOW FM and updated hourly across the regional model in conjunction with the tides, so their influence was captured in the determination of hydrodynamic forces acting in the domain.
2. The local scale hydrodynamic model is established over the Mardie area with boundary conditions defined by the Regional model. The local model is setup in a domain decomposition grid arrangement

Mardie Project Hydrodynamic Modelling Report
12979.101.R1.Rev2 Page 44
to optimise the efficiency of the model performance. The outer grid extends along the shoreline approximately 70km with a cross shore extent of approximately 45km. The outer grid is setup on a 200m grid size, and a smaller domain within sized at 40m extends around the marine precinct of the port and channel area. A smaller grid sized at 8m is focused over the key region of interest encompassing the port area and transhipment channel.
3. A SWAN wave model was developed to cover the local scale domain with the following attributes • The model is setup with an outer grid domain extending across the hydrodynamic grid, with a grid
size of 400m. A nested grid of 40m grid size describing the key port facility area is nested within. • The wave conditions inside the SWAN model develop under the local wind forcing applied in the
model. Swell conditions are applied at the boundary based on the measured data from the offshore ADCP in the Dry Season.
• Wave conditions are updated in the local hydrodynamic model every 2 hours using Delft3D FLOW-WAVE-FLOW.
The validation for the hydrodynamic model has been undertaken over a 4-week period in the Wet Season and the Dry Season rspectively where contemporaneous data was available from both the offshore and inshore locations (ADCP and Aquadopp instruments) and where two full spring tides and two full neap tide cycles are completed through the duration.
For the validation of the hydrodynamic model, the modelled and measured data is presented as graphical times series in Section 5. Additionally, the model performance was compared against the available measured data using the statistical descriptions of Model skill, Bias, RMS Error and Scatter Index. The validation metrics calculated for water level, depth averaged current velocity and direction were good for all parameters with good model skill and low bias and error metrics as shown in Table 6.1 for wet and dry season conditions.
A comparison of the 2D depth average current velocity against through the water column currents from the 3D simulations (Delft3D sigma layer model) was made for the upper layer, mid depth and bed level. The analysis indicates the upper surface current velocity from the 3D simulation is approximately 10% higher than the mid-depth current speed and the bed layer currents show a reduction in velocity of approximately 30% compared with the mid-depth.
Examination of the measured through the water column current direction from the inshore location (Aquadopp) against the simulated 3D through the water column currents (Delft3D sigma layer model) shows that the current direction is generally uniform at all depths for the inshore location through the tide cycle. The outcome confirms the general flow characteristics of the study area can be described with a depth-averaged 2D model; however, the 3D model will be of key importance to resolve density driven flows in the bitterns outfall modelling (Baird, 2020).
In conclusion, the validation of the 2D and 3D hydrodynamic model system has confirmed it is accurately reproducing the general hydrodynamic forcing for the Mardie project area. The high validation metrics for the inshore and offshore locations (Table 6.1) provides confidence the model can be applied in the dredge plume analysis and in the bitterns outfall modelling studies to follow.

Mardie Project Hydrodynamic Modelling Report
12979.101.R1.Rev2 Page 45
Table 6.1: Model Metrics for water level, depth-averaged current velocity and direction.
Location Component Skill Bias Scatter RMS Error
Offshore Location ADCP WET SEASON
Water level 0.99 -0.03 0.06 0.17
Current Speed 0.95 0.02 0.21 0.05
Current x axis (E-W) 0.94 -0.02 0.19 0.05
Current y axis (N-S) 0.99 -0.02 0.07 0.04
Inshore Location, Aquadopp WET SEASON
Water level 0.99 0.04 0.06 0.15
Current Speed 0.88 0.03 0.35 0.07
Current x axis (E-W) 0.96 -0.01 0.16 0.07
Current y axis (N-S) 0.91 -0.03 0.32 0.07
Offshore Location ADCP DRY SEASON
Water Level 0.99 0.02 0.05 0.14
Current Speed 0.95 0.00 0.22 0.05
Current x axis (E-W) 0.93 0.01 0.16 0.06
Current y axis (N-S) 0.99 -0.01 0.08 0.05
Offshore Location Aquadopp DRY SEASON
Water Level 1.00 -0.04 0.05 0.13
Current Speed 0.88 0.04 0.41 0.07
Current x axis (E-W) 0.95 0.01 0.16 0.07
Current y axis (N-S) 0.97 -0.01 0.15 0.05
Mardie Project Hydrodynamic Modelling Report
12979.101.R1.Rev2 Page 46
7. References
ANZECC & ARMCANZ (2000). Australian and New Zealand Guidelines for Fresh and Marine Water Quality (Australian and New Zealand Environment and Conservation Council (ANZECC) & Agriculture and Resource Management Council of Australia and New Zealand (ARMCANZ).
Baird (2020a). Mardie Project – Dredge Plume Modelling Report. Prepared for BCI Minerals. Ref 12979.101.R4.Rev0.
Baird (2020b). Mardie Project – Bitterns Plume Dispersion Modelling Report. Prepared for BCI Minerals. Ref 12979.101.R5.Rev0.
BCIM (2018). MARDIE PROJECT Pre-Feasibility Study, May 2018.
Deltares (2018), Delft3D Model Model Overview, https://oss.deltares.nl/web/delft3d/about
DoE, (2006). Pilbara Coastal Water Quality Consultation Outcomes – Environmental Values and Environmental Quality Objectives, Department of Environment (DoE), Government of Western Australia, Marine Series Report No. 1.
EGS Survey (2019). Mardie Salt Project Geophysical Survey - BCI Minerals SURVEY REPORT, EGS PROJECT REF: AU025918, Prepared for O2Marine 21 January 2019
EPA (2016a). Statement of Environmental Principles, Factors and Objectives, EPA, Western Australia;
EPA (2016b). Environmental Impact Assessment (Part IV Divisions 1 and 2) Administrative Procedures 2016;
EPA (2018a). Environmental Impact Assessment (Part IV Divisions 1 and 2) Procedures Manual, EPA, Western Australia;
EPA, (2016c). Environmental Factor Guideline – Marine Environmental Quality, EPA, Western Australia;
EPA, (2016d). Environmental Factor Guideline – Benthic Communities and habitat, EPA, Western Australia;
EPA, (2016e). Environmental Factor Guideline – Marine Fauna, EPA, Western Australia;
EPA, 2018b). Instructions on how to prepare Environmental Protection Act Part IV Environmental Management Plans;
EPA, (2016f). Technical Guidance – Protecting the Quality of Western Australia’s Marine Environment, EPA, Western Australia; and
EPA, (2016g). Technical Guidance - Environmental Impact Assessment of Marine Dredging Proposals, EPA, Western Australia.
O2Marine (2018). Mardie Project Progress Report #1 for Metocean Data Collection, REPORT No.: R1800106, ISSUE DATE: 22 Oct 2018, Prepared for BCIM
O2Marine (2019). Mardie Project Progress Report for Metocean Data Collection, R1800132 ISSUE DATE: 15th January 2019, Prepared for BCIM

Mardie Project Hydrodynamic Modelling Report
12979.101.R1.Rev2 Page 47
RPS (2017), MARDIE SALT PROJECT, PRELIMINARY STORM SURGE STUDY, Prepared for BCIM.
Sun.C, Shimizu.K, Symonds.G, (2016). Numerical modelling of dredge plumes: a review, CSIRO Oceans and Atmosphere Flagship, Perth, Western Australia, Western Australian Marine Science Institution, Perth, Western Australia, Australia.
TAMS (2019) FORM: Dive Operations Field Report. REC_03_DIV_FOR_018_0091 & Appendices. Prepared for BCI Minerals 11th October 2019.

Mardie Project Hydrodynamic Modelling Report
12979.101.R1.Rev2 Appendix A
Bathymetry Data Sources