March 7, 2011 U.S. Lodging Industry Overview11Q4. YOY Employment Change. Source: Colliers PKF...
41
Accelerating success. March 7, 2011 March 7, 2011 U.S. Lodging Industry U.S. Lodging Industry Overview Overview Prepared for the Hunter Investment Hunter Investment Conference Conference R. Mark Woodworth PKF Hospitality Research
Transcript of March 7, 2011 U.S. Lodging Industry Overview11Q4. YOY Employment Change. Source: Colliers PKF...

Accelerating success.
March 7, 2011March 7, 2011U.S. Lodging Industry U.S. Lodging Industry
OverviewOverviewPrepared for the
Hunter Investment Hunter Investment ConferenceConference
R. Mark WoodworthPKF Hospitality Research

3. Profit growth expectations.3. Profit growth expectations.
2
2. Lodging forecast.2. Lodging forecast.
1. The economy.1. The economy.
4. Cap rates.4. Cap rates.
Good and Getting BetterGood and Getting Better
For a copy: [email protected] a copy: [email protected]

44--Quarter Moving Average Quarter Moving Average –– U.S. AllU.S. AllTotal Payroll Employment Change,Total Payroll Employment Change,Average Daily Room Night DemandAverage Daily Room Night Demand
Source: Colliers PKF Hospitality Research, Moody’s Analytics, Smith Travel Research3

U.S. Total Employment LevelsU.S. Total Employment Levels
8.3 Million Jobs Lost8.3 Million Jobs Lost
5+ Years From Peak5+ Years From Peak--toto--PeakPeak
Source: Moody’s Analytics, January 2011
12 Quarters
17 Quarters
22 Quarters
4
WeWe’’re Herere Here
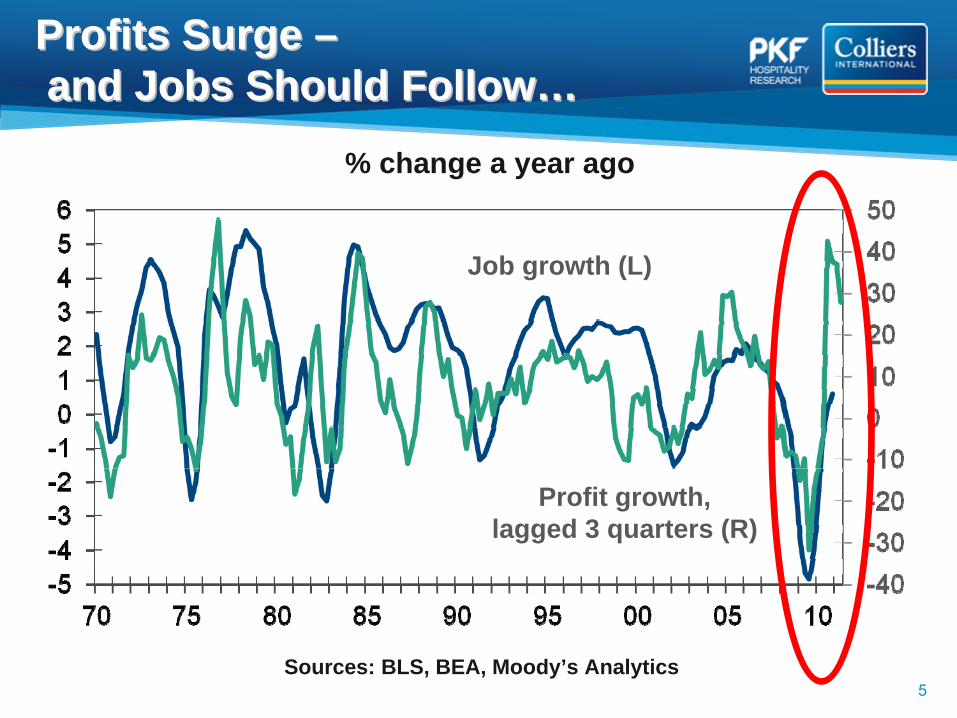
Profits Surge Profits Surge –– and Jobs Should Followand Jobs Should Follow……
Sources: BLS, BEA, Moody’s Analytics
Profit growth,lagged 3 quarters (R)
Job growth (L)
% change a year ago
5
Positive Change
No Change*
Negative Change
07Q1
07Q2
07Q3 07Q4 08Q1 08Q2 08Q3 08Q4 09Q1 09Q2 09Q3 09Q4
10Q110Q1 10Q2 10Q3 10Q4 11Q1 11Q2 11Q3 11Q4
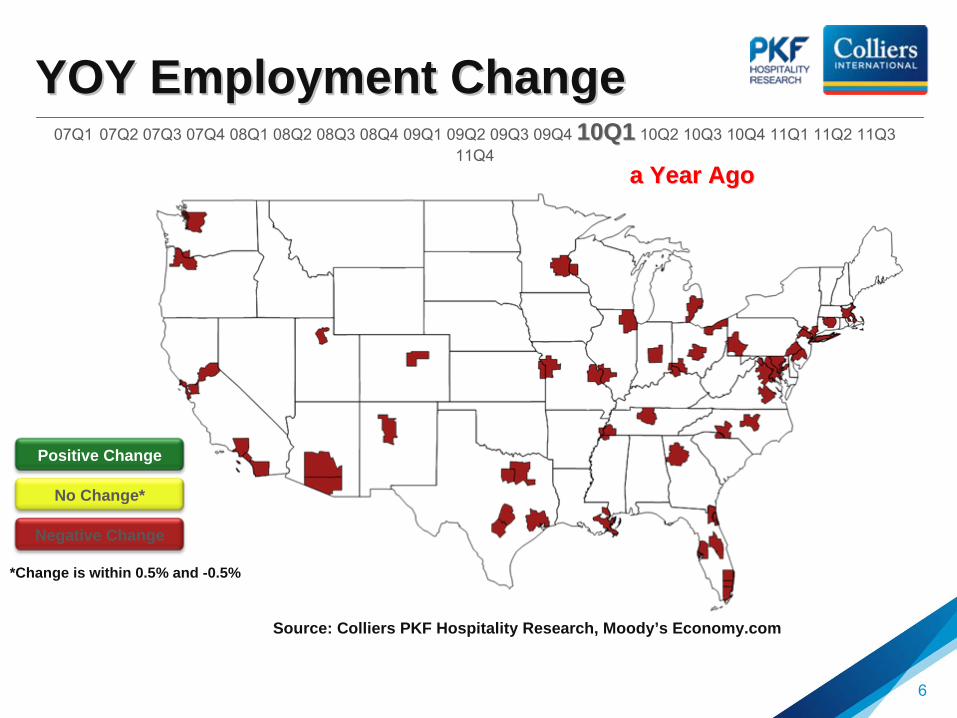
YOY Employment ChangeYOY Employment Change
Source: Colliers PKF Hospitality Research, Moody’s Economy.com
*Change is within 0.5% and -0.5%
6
a Year Agoa Year Ago
Positive Change
No Change*
Negative Change
07Q1
07Q2
07Q3 07Q4 08Q1 08Q2 08Q3 08Q4 09Q1 09Q2 09Q3 09Q4 10Q1 10Q2 10Q3
10Q4
11Q111Q1 11Q2 11Q3 11Q4
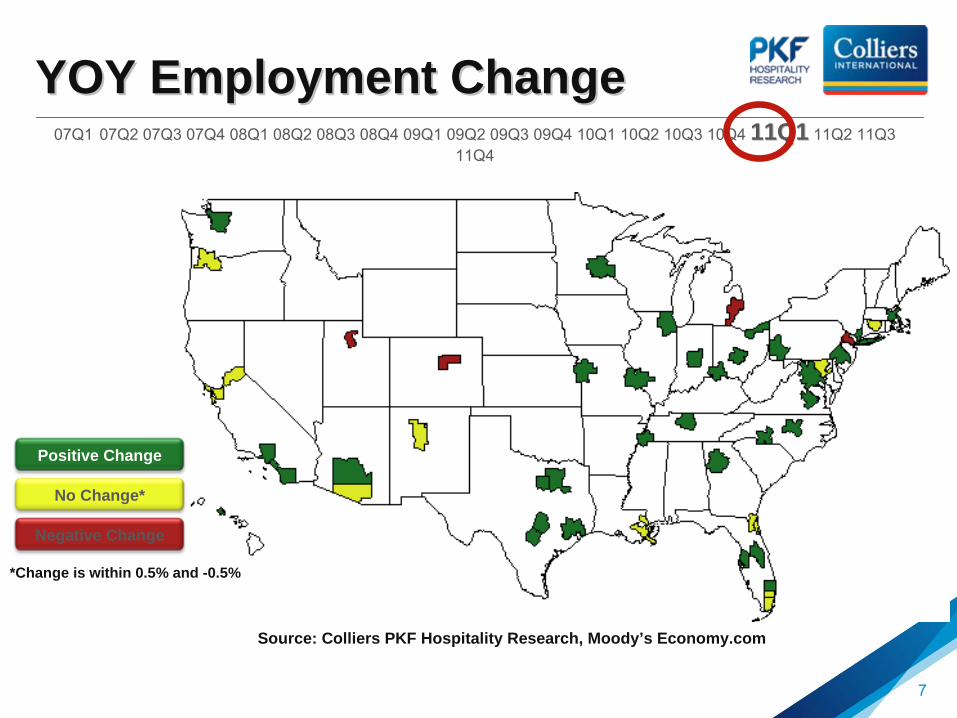
YOY Employment ChangeYOY Employment Change
Source: Colliers PKF Hospitality Research, Moody’s Economy.com
*Change is within 0.5% and -0.5%
7

Positive Change
No Change*
Negative Change
*Change is within 0.5% and -0.5%
07Q1
07Q2
07Q3 07Q4 08Q1 08Q2 08Q3 08Q4 09Q1 09Q2 09Q3 09Q4 10Q1 10Q2 10Q3
10Q4 11Q1 11Q2 11Q3
11Q411Q4
YOY Employment ChangeYOY Employment Change
Source: Colliers PKF Hospitality Research, Moody’s Economy.com
8

Employment Levels Return to Historical Employment Levels Return to Historical Maximum in YearMaximum in Year……
Source: Colliers PKF Hospitality Research –
March 2011 –
May 2011 Hotel Horizons®
Report, Smith Travel Research 9
The map below displays the year in which Employment levels are forecast to once again achieve their historical maximum: 2 in 2011, 5 markets in 2012, 8 markets in 2013, 21 markets in 2014, and 14 in 2015 or later.
20112012201320142015 & Beyond

Economic Assumptions Driving Economic Assumptions Driving Our Forecasts:Our Forecasts:
PayrollEmployment
Real Personal
IncomeReal GDP CPI (Inflation)
2009 ‐4.3% ‐4.3% ‐1.9% ‐2.0% ‐2.6% ‐2.4% ‐0.3% ‐0.3%
2010 ‐0.5% ‐0.7% 1.3% 0.6% 2.9% 2.3% 1.6% 1.5%
2011 1.7% 0.1% 4.0% 2.4% 3.9% 1.4% 1.5% 0.8%
2012 2.4% 1.9% 3.8% 3.6% 4.0% 3.8% 2.5% 2.8%
2013 2.5% 3.2% 4.6% 3.8% 3.7% 4.5% 3.2% 3.1%
L.R.A. 1.2% 2.7% 2.7% 2.9%
Source: Moody’s Analytics, January 2011 L.R.A. = Long Run Average(July 2010) 10

Exports Rally in South and WestExports Rally in South and West……
Exports of goods and commodities, value: 2008Q2=100
Source: Census

Trade Through Southern PortsTrade Through Southern Ports Is ImprovingIs Improving……
Source: Census, Federal Reserve
Savannah
Value of exports and imports by customs districts, $ billions
Miami
3-mo moving averages
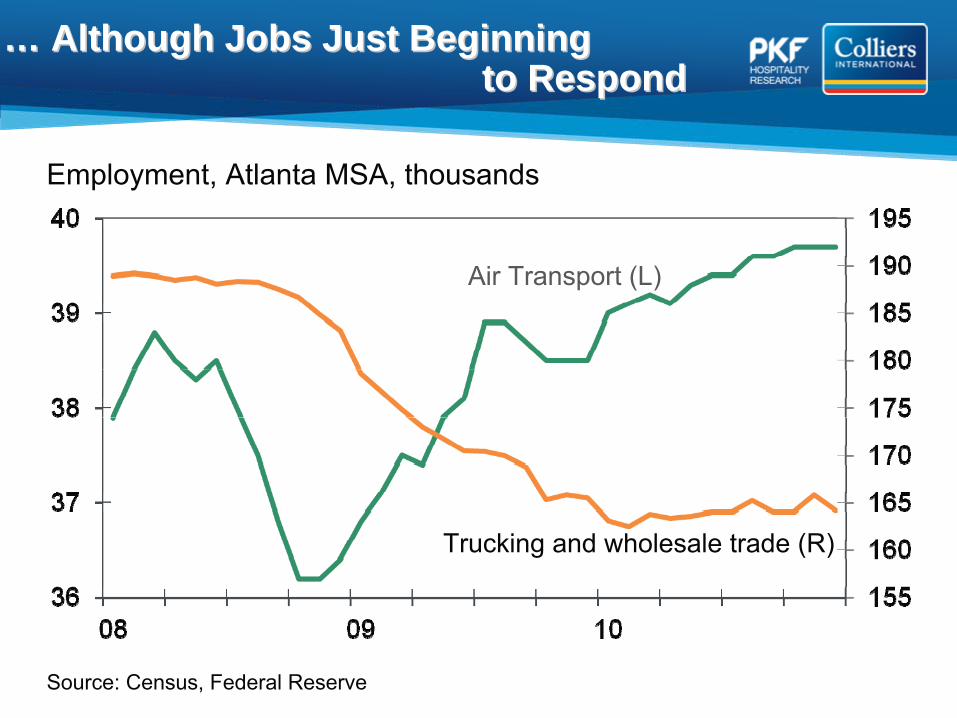
…… Although Jobs Just BeginningAlthough Jobs Just Beginning to Respond to Respond
Source: Census, Federal Reserve
Trucking and wholesale trade (R)
Employment, Atlanta MSA, thousands
Air Transport (L)
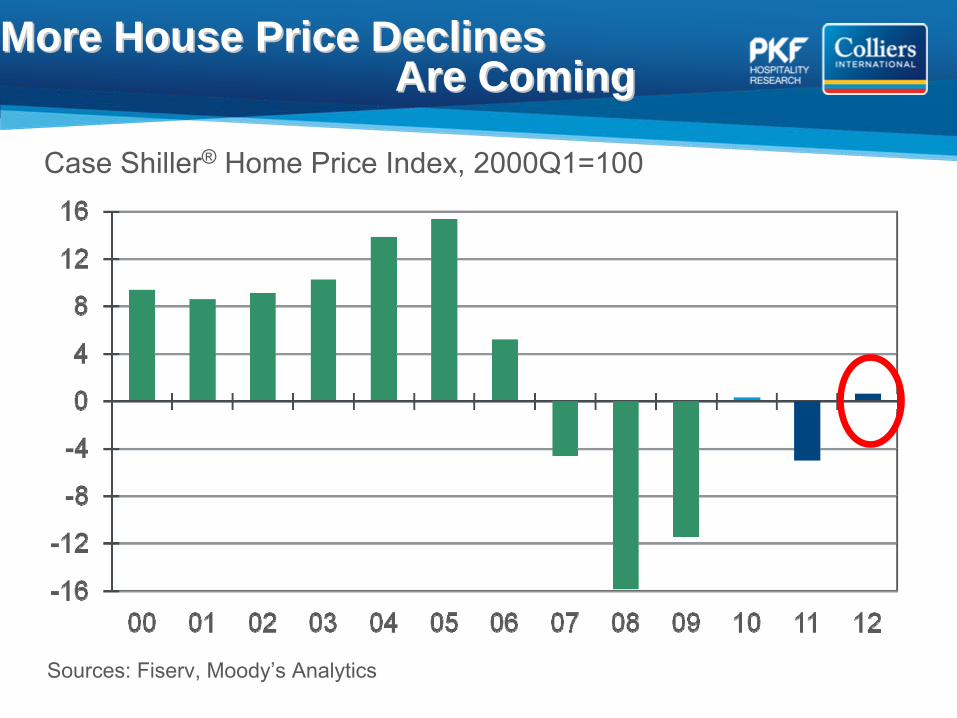
More House Price DeclinesMore House Price Declines Are ComingAre Coming
Sources: Fiserv, Moody’s Analytics
Case Shiller®
Home Price Index, 2000Q1=100

1. The Economy.
2. Lodging forecast.3.
Profit growth expectations.
4. Cap rate outlook.
1. The Economy.
2. Lodging forecast.3.
Profit growth expectations.
4. Cap rate outlook.
15
Good and Getting BetterGood and Getting Better

The Hotel Market CycleThe Hotel Market Cycle
16
Rapid Development
Occupancy Declines, ADR Follows
Development at Minimum
Levels
Lodging Decline, Leads Other Sectors
Occupancy Recovers
ADR and Margins Recover
Development Picks Up
Development Slows
Lodging Recovers, Lags Other Sectors
Long RunOccupancy
Rapid Development
Equilibrium ADR
U.S. is Here2011-2012
2013-2014
A Year Ago
Moving Along the Road to RecoveryMoving Along the Road to Recovery
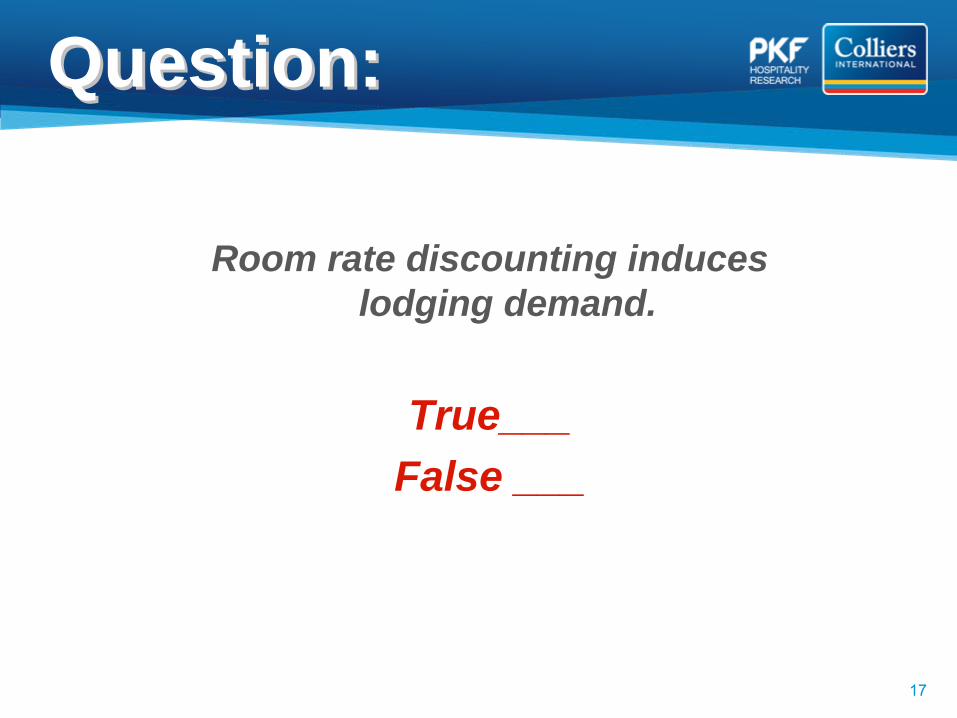
Room rate discounting induces lodging demand.
True___False ___
Question:Question:
17

A Review of theA Review of the Drivers of Demand ChangeDrivers of Demand Change
Demand = f (Income, Employment ∆, ADR)
Real Personal Income (RPI)-
Sluggish but not the problem or solution
Employment ∆-
Who lost their jobs?
ADR –
Plunged!
18

44--Quarter Moving Average Quarter Moving Average –– U.S. AllU.S. AllTotal Payroll Employment Change,Average Daily Room Night Demand
Source: Colliers PKF Hospitality Research, Moody’s Analytics, Smith Travel Research
ForecastForecast
19

Long Term
Average 2006 2007 2008 2009 2010 2011F 2012F
Supply 2.2% 0.2% 1.3% 2.5% 3.0% 2.0% 0.7% .06%
Demand 1.5% 0.5% 0.7% ‐2.5% ‐6.1% 7.7%7.7% 4.0%4.0% 3.4%3.4%
Occupancy 62.2% 63.1% 62.8% 59.8% 54.5% 57.5% 59.4% 61.0%
ADR 2.9% 7.6% 6.4% 2.9% ‐8.5% ‐0.1% 3.8% 6.0%
RevPAR 2.3% 7.9% 5.9% ‐‐2.1%2.1% ‐‐16.6%16.6% 5.5%5.5% 7.1%7.1% 8.9%8.9%
National HorizonNational Horizon-- Forecasts through 2012Forecasts through 2012
And a Quicker And a Quicker Demand Demand
TurnaroundTurnaroundFor a Record For a Record
DeclineDeclineSource: Colliers PKF Hospitality Research –
March-May 2011Horizons®
Report, Smith Travel Research 20
Severe Rate Severe Rate Discounting Set Discounting Set
the Stagethe Stage
Approaching Long Approaching Long Run AverageRun Average

When Supply Change Reaches U.S. When Supply Change Reaches U.S. Long Run AverageLong Run Average
Source: Colliers PKF Hospitality Research –
March –
May 2011 Hotel Horizons®
Report, Smith Travel Research 21
20112012201320142015Beyond 2015
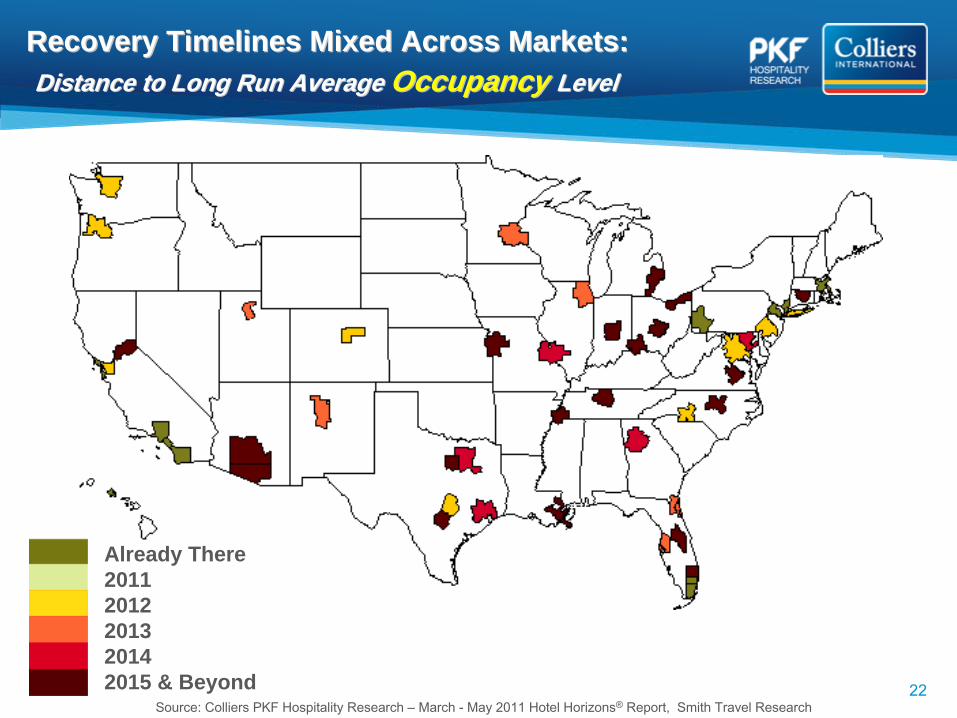
Recovery Timelines Mixed Across Markets: Recovery Timelines Mixed Across Markets: Distance to Long Run Average Distance to Long Run Average Occupancy Occupancy LevelLevel
22Source: Colliers PKF Hospitality Research –
March -
May 2011 Hotel Horizons®
Report, Smith Travel Research
Already There20112012201320142015 & Beyond

Recovery Timelines Mixed Across Markets: Recovery Timelines Mixed Across Markets: Year When Year When ADRADR Levels Return to Previous PeakLevels Return to Previous Peak
23Source: Colliers PKF Hospitality Research –
March –
May 2011 Hotel Horizons®
Report, Smith Travel Research
20112012201320142015 & Beyond

Nominal RevPAR Levels Return to Nominal RevPAR Levels Return to Historical Maximum in YearHistorical Maximum in Year……
Source: Colliers PKF Hospitality Research –
March -
May 2011 Hotel Horizons®
Report, Smith Travel Research 24
The map below displays the year in which nominal RevPAR levels are forecast to once again achieve their historical maximum: 1 market in 2010, 0 in 2011, 10 markets in 2012, 23 markets in 2013, 8 markets in 2014, and 8 markets in 2015 or later.
Already There20112012201320142015 & Beyond

25
2011 RevPAR Forecast By Chain-Scale
Source: Colliers PKF Hospitality Research, March –
May 2011 Hotel Horizons® report.
6.4%
7.4%
5.3%
6.0%
7.1%
9.6%
0% 4% 8% 12%
Economy
Midscale without F&B
Midscale with F&B
Upscale
Upper-Upscale
Luxury
Forecast Change 2010 to 2011
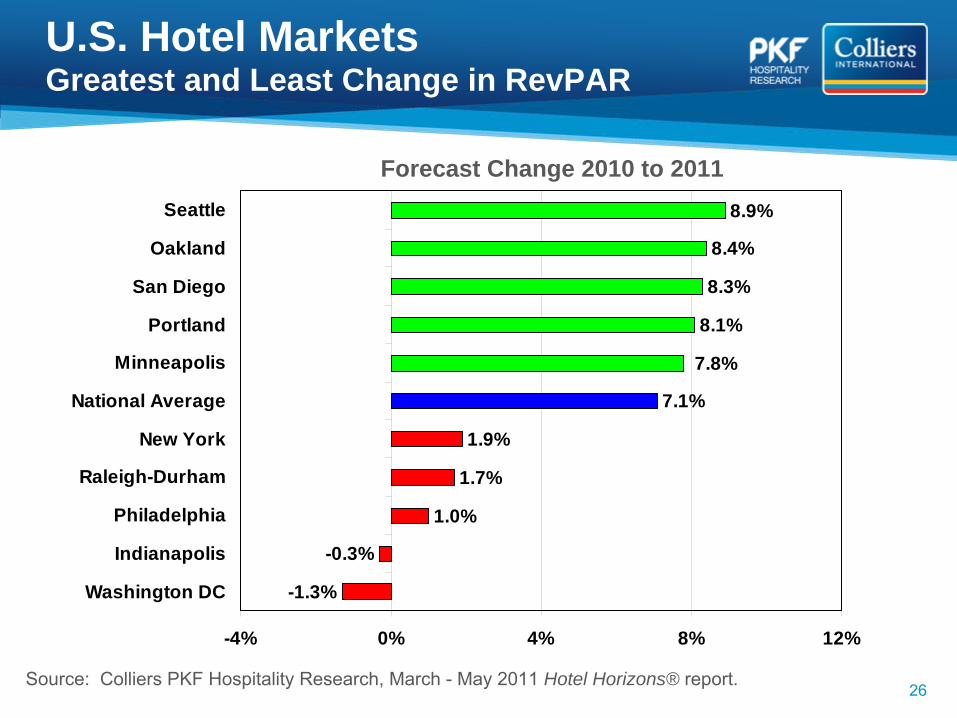
-1.3%
-0.3%
1.0%
1.7%
1.9%
7.1%
8.1%
8.3%
8.4%
8.9%
7.8%
-4% 0% 4% 8% 12%
Washington DC
Indianapolis
Philadelphia
Raleigh-Durham
New York
National Average
Minneapolis
Portland
San Diego
Oakland
Seattle
Source: Colliers PKF Hospitality Research, March -
May 2011 Hotel Horizons® report.
Forecast Change 2010 to 2011
U.S. Hotel Markets Greatest and Least Change in RevPAR
26
1. The Economy.
2. Lodging forecast.
3. Profit growth expectations.4.
Cap rate outlook.
1. The Economy.
2. Lodging forecast.
3. Profit growth expectations.4.
Cap rate outlook.
27
Good and Getting BetterGood and Getting Better

RevPAR Components and NOI* ChangeRevPAR Components and NOI* Change
NOI Change = -0.02 + 2.07 ADR + 1.38 Occupancy R2= .97
Note: * Before capital reserve, debt service, rent, income taxes, depreciation, amortization.
Source: Colliers PKF Hospitality Research’s Annual Trends Database
28
29
-40%
-20%
0%
20%
40%
60%
80%
1937 1942 1947 1952 1957 1962 1967 1972 1977 1982 1987 1992 1997 2002 2007 2012F
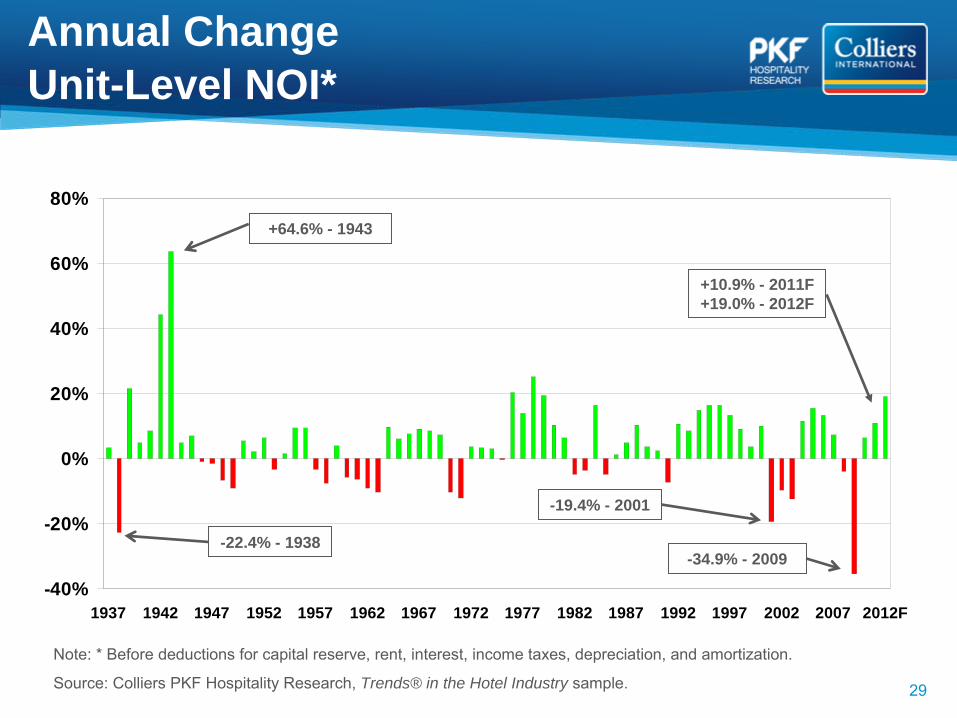
+64.6% - 1943
-22.4% - 1938
-19.4% - 2001
-34.9% - 2009
+10.9% - 2011F+19.0% - 2012F
Note: * Before deductions for capital reserve, rent, interest, income taxes, depreciation, and amortization.
Source: Colliers PKF Hospitality Research, Trends® in the Hotel Industry sample.
Annual Change Unit-Level NOI*
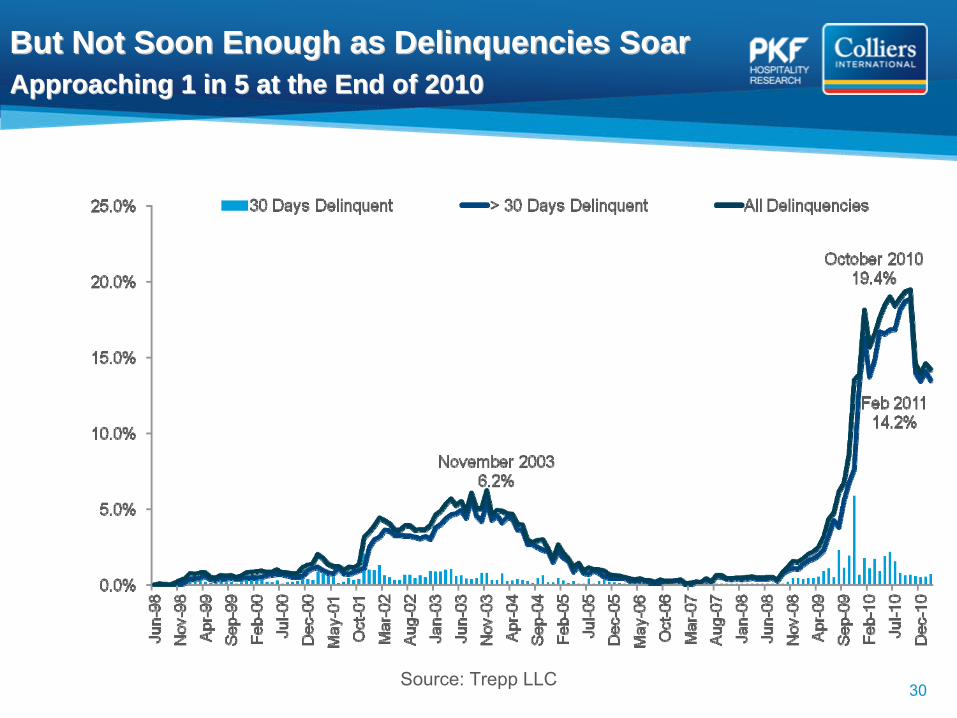
Source: Trepp LLC
But Not Soon Enough as Delinquencies SoarBut Not Soon Enough as Delinquencies Soar Approaching 1 in 5 at the End of 2010Approaching 1 in 5 at the End of 2010
30
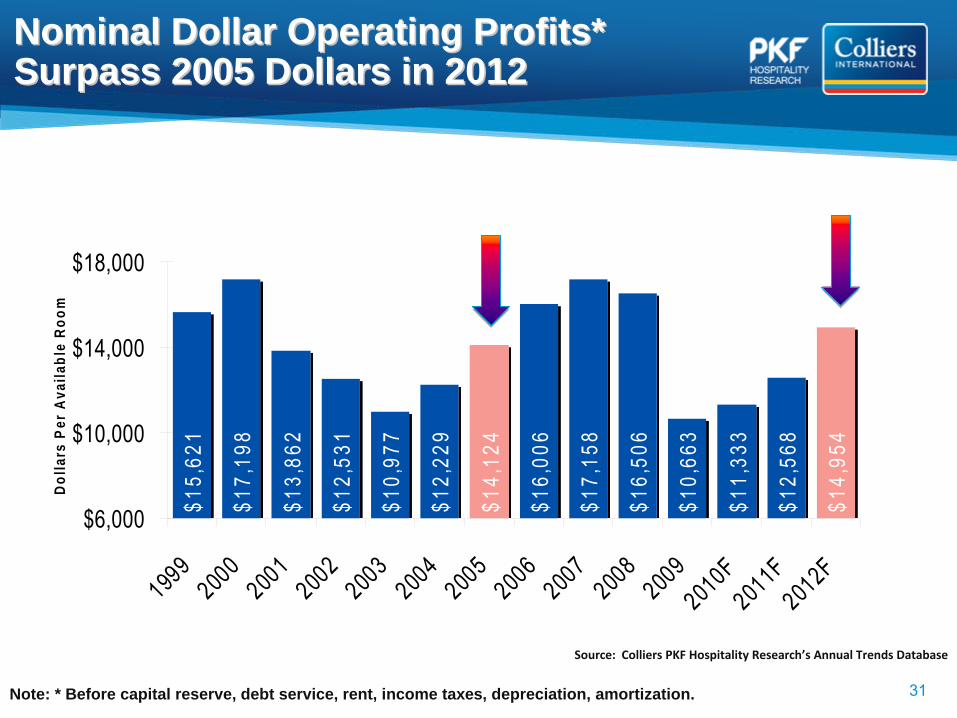
Nominal Dollar Operating Profits* Nominal Dollar Operating Profits* Surpass 2005 Dollars in 2012Surpass 2005 Dollars in 2012
$15,
621
$17,
198
$13,
862
$12,
531
$10,
977
$12,
229
$14,
124
$16,
006
$17,
158
$16,
506
$10,
663
$11,
333
$12,
568
$14,
954
$6,000
$10,000
$14,000
$18,000
1999
2000
2001
2002
2003
2004
2005
2006
2007
2008
2009
2010F
2011F
2012F
Dolla
rs P
er A
vaila
ble
Room
Note: * Before capital reserve, debt service, rent, income taxes, depreciation, amortization.
Source: Colliers PKF Hospitality Research’s Annual Trends Database
31
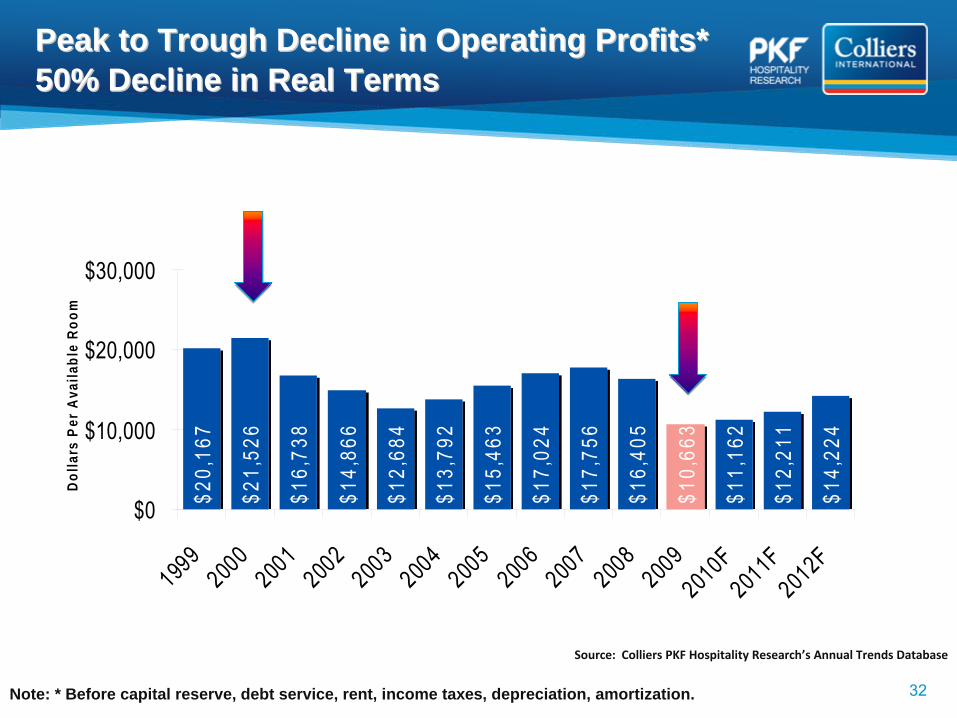
$20,
167
$21,
526
$16,
738
$14,
866
$12,
684
$13,
792
$15,
463
$17,
024
$17,
756
$16,
405
$10,
663
$11,
162
$12,
211
$14,
224
$0
$10,000
$20,000
$30,000
1999
2000
2001
2002
2003
2004
2005
2006
2007
2008
2009
2010F
2011F
2012F
Dolla
rs P
er A
vaila
ble
Room
Peak to Trough Decline in Operating Profits* Peak to Trough Decline in Operating Profits* 50% Decline in Real Terms50% Decline in Real Terms
Note: * Before capital reserve, debt service, rent, income taxes, depreciation, amortization.
Source: Colliers PKF Hospitality Research’s Annual Trends Database
32
1. The Economy.
2. Lodging forecast.
3. Profit growth expectations.
4. Cap rate outlook.
1. The Economy.
2. Lodging forecast.
3. Profit growth expectations.
4. Cap rate outlook.
33
Good and Getting BetterGood and Getting Better

Hotel Cap Rate Forecasting ModelHotel Cap Rate Forecasting Model
Accounting for Growth and Risk Accounting for Growth and Risk (Gordon Growth Model)(Gordon Growth Model)
34
10-Year Treasuries10-Year Treasuries Moody’s Baa Corp Bond
Moody’s Baa Corp Bond
Changes in Income
Changes in Income
Moody’s AnalyticsMoody’s Analytics
Hotel Cap Rate
Hotel Cap Rate
PKF Hotel Horizons/ STR
PKF Hotel Horizons/ STR
RERC Survey/ RCA
Trans.
RERC Survey/ RCA
Trans.
R HotelR Hotel ΔRevPARΔRevPAR Risk Free AlternativeT10
Risk Free AlternativeT10
Market RiskBaa -
T10
Market RiskBaa -
T10
Data
Variables
The equity riskapplied to
hotels
Change inincome
Risk freealternative to
any investment
Proxy for allother rated
debt
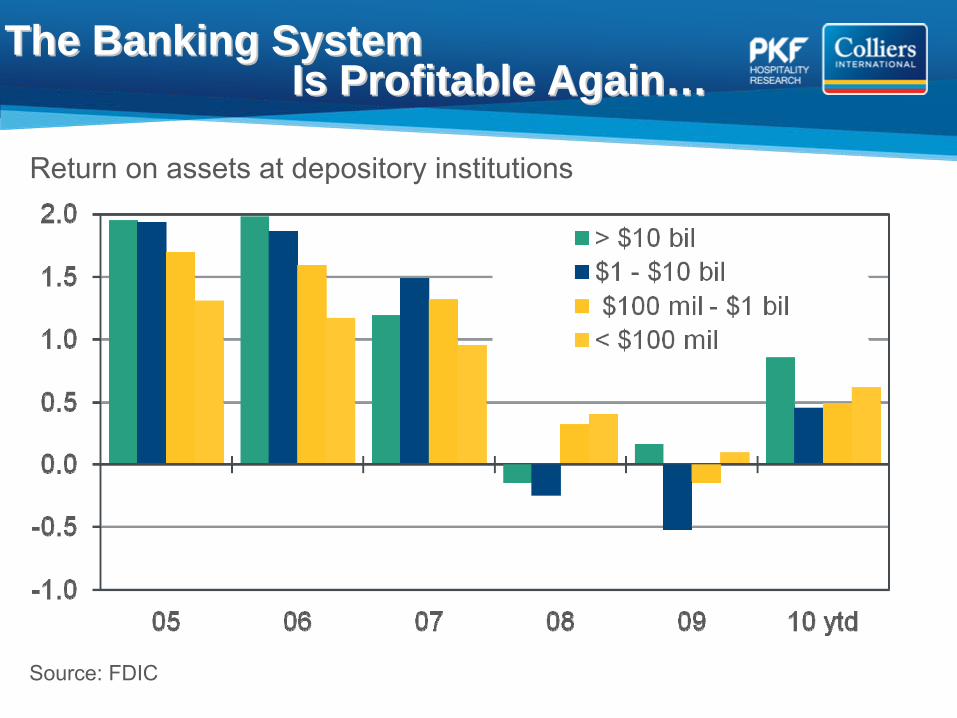
The Banking System The Banking System Is Profitable AgainIs Profitable Again……
Return on assets at depository institutions
Source: FDIC

……And the Credit Spigot Is Opening.And the Credit Spigot Is Opening.
Source: Federal Reserve Senior Loan Officer Survey
Net % of senior loan officers…
Willing to make a consumer loan (L)
Tightening standards for C&I loans to small businesses (R)

10.0
5.7
0
2
4
6
8
10
12
RERC Investor Survey Cap Rates
RCA Observed Transaction Cap Rates
Perceptions and Reality DivergePerceptions and Reality Diverge
37Source: RERC, RCA
Not Many Not Many BuyersBuyers

Forecasts of Return ComponentsForecasts of Return ComponentsLodging Risk Premium Stays Below L.R.A.Lodging Risk Premium Stays Below L.R.A.
10 Year Treasury Market Risk PremiumLodging Risk Premium Hotel Cap Rate
2005 4.3% 1.8% 2.8% 8.9%
2006 4.8% 1.7% 2.0% 8.5%
2007 4.6% 1.9% 1.5% 7.9%
2008 3.7% 3.8% 0.9% 8.4%
2009 3.3% 4.0% 2.0% 9.3%
2010 3.2% 2.8% 2.0% 7.9%
2011F 3.5% 2.4% 2.3% 8.2%
2012F 5.0% 2.0% 1.8% 8.8%
2013F 5.2% 1.7% 1.7% 8.6%
L.R.A. 5.3% 2.3% 2.7% 10.0%
Source: Colliers PKF Hospitality Research, RERC, RCA, Moody’s Analytics
Long Run Average (L.R.A.) = 1992-2010
38

The Cycle of Hotel Real Estate The Cycle of Hotel Real Estate EmotionsEmotions-- Relief and OptimismRelief and Optimism
2007
2004
2009-20102011
2008 – 1st
Half
2008 – 2nd Half
2011-12
39

SummarySummary
40
No Tailwinds Yet:No Tailwinds Yet:
* Persistent high levels of unemployment* Persistent high levels of unemployment
* Continued weakness in housing * Continued weakness in housing
* Higher inflation lifts appeal of hotels* Higher inflation lifts appeal of hotels
* Airline capacity constraints * Airline capacity constraints –– getting bettergetting better
Forecast bias = Forecast bias = veryvery slight positive.slight positive.


![Invariant Shape Features and Relevance Feedback for Weld ... · Sym [0 1] < 0.5 > 0.5 > 0.5 < 0.5 Sig [0 1] < 0.5 < 0.5 → 1 > 0.5 2.2 Generic Fourier descriptor](https://static.fdocuments.in/doc/165x107/5fb60fbe46489e03c70e3474/invariant-shape-features-and-relevance-feedback-for-weld-sym-0-1-05.jpg)