MARCH 3, 2020 AGENDA ITEM 3 INFORMATION ITEM … · 3/3/2020 · • Total nonfarm payroll...
60
Page 1 of 1 MARCH 3, 2020 AGENDA ITEM 3 INFORMATION ITEM CALIFORNIA ABLE ACT BOARD Review of CalABLE Investment Performance for Fourth Quarter 2019 Background The CalABLE Act Board and its investment consultant, Meketa Investment Group, Inc. (Meketa) monitor all portfolios in the CalABLE (Plan). In this item, CalABLE will review and “Investment Performance Report” (Exhibit A) for the Plan for fourth quarter 2019, provided by TIAA Tuition Financing, Inc. , and the “Investment Performance Status Report” (Exhibit B) for fourth quarter 2019, provided by Meketa. Exhibit B provides comparisons for each underlying fund allocated to the portfolios used in the Plan to applicable benchmark criteria and labels the current status of the funds as “positive,” ”acceptable,” “caution,” or “watch.” Attachments CalABLE Performance 4Q19 TFI CalABLE Performance Report 4Q19 Presenters Glenn Friedman, Manager, TIAA Tuition Financing Inc. Eric White, Principal, Meketa Investment Group, Inc.
Transcript of MARCH 3, 2020 AGENDA ITEM 3 INFORMATION ITEM … · 3/3/2020 · • Total nonfarm payroll...
Page 1 of 1
MARCH 3, 2020 AGENDA ITEM 3 INFORMATION ITEM CALIFORNIA ABLE ACT BOARD
Review of CalABLE Investment Performance for Fourth Quarter 2019 Background
The CalABLE Act Board and its investment consultant, Meketa Investment Group, Inc. (Meketa) monitor all portfolios in the CalABLE (Plan). In this item, CalABLE will review and “Investment Performance Report” (Exhibit A) for the Plan for fourth quarter 2019, provided by TIAA Tuition Financing, Inc. , and the “Investment Performance Status Report” (Exhibit B) for fourth quarter 2019, provided by Meketa. Exhibit B provides comparisons for each underlying fund allocated to the portfolios used in the Plan to applicable benchmark criteria and labels the current status of the funds as “positive,” ”acceptable,” “caution,” or “watch.” Attachments
CalABLE Performance 4Q19
TFI CalABLE Performance Report 4Q19 Presenters
Glenn Friedman, Manager, TIAA Tuition Financing Inc. Eric White, Principal, Meketa Investment Group, Inc.

Quarterly Investment Report
4th Quarter, 2019
For Institutional client use only. Not for distribution.Before investing in the California Achieving a Better Life Experience (CalABLE) Program, you should consider the investment
objectives, risks, charges, and expenses. The information contained in this report is subject to further change and amendments
over time. Some changes may occur due to the result of adjustments. For a prospectus containing this and other information, as
well as a Participant Agreement and Disclosure Statement, please call (833) 225-2253 or view it online at https://calable.ca.gov/.
Please read these documents carefully before investing.
TIAA-CREF Tuition Financing, Inc., Program Manager. TlAA-CREF Individual & Institutional Services, LLC, member FINRA and
SIPC, distributor and underwriter for the CalABLE plan.
Market Overview: Q4 2019
2
Key Themes
• The same economic and political themes that persisted much of the year
continued in the fourth quarter. We saw uneasy international relations and
uncertainty regarding international trade; however, there was optimism
around the potential for a Phase I trade deal with China.
Equities
• Ten of eleven U.S. equity sectors had positive results. Information
Technology had the highest returns, registering 14.40% for the quarter,
while Real Estate lagged, falling 0.54%. Non-U.S. developed and
emerging markets both had a strong showing, with EM outperforming most
other markets.
Fixed Income
• At the December FOMC meeting, the Federal Reserve Board maintained
the current level for its benchmark fed funds rate. The statement released
from Chair Powell struck a dovish tone by emphasizing that the Fed has
no plans to re-raise interest rates in the near term, stating that monetary
policy is “appropriate to sustain the current expansion.” Fixed income
yields rose for the quarter but had little reaction to this news.
Past performance is not indicative of future results. You can not invest directly in an
index. U.S. Equities – Russell 3000 Index; U.S. Growth Stocks – Russell 1000
Growth Index; U.S. Value Stocks – Russell 1000 Value Index; U.S. Mid Cap Stocks –
Russell Midcap Index; U.S. Small-Cap Stocks – Russell 2000 Index; International
Developed Markets – MSCI EAFE Index; Emerging Markets – MSCI Emerging
Markets Index; Real Estate Stocks – FTSE NAREIT All Equity REITS Index; U.S.
Investment Grade Bonds – Bloomberg Barclays U.S. Aggregate Bond Index; Long-
dated Bonds – Bloomberg Barclays U.S. Government/Credit Long Index; Inflation-
Linked Bonds – Bloomberg Barclays TIPS 1-10 Years Index; High Yield Bonds –
BofA Merrill Lynch BB/B Cash Pay Index; Commodities - Bloomberg Commodity
Index; Cash - Bloomberg Barclays U.S. 3 month Treasury Bellweathers IndexC34631
© 2019 TIAA-CREF Tuition Financing, Inc.
Asset Class 3 Month 1 Year 3 Year 5 Year
U.S. Equities 9.10 31.02 14.57 11.24
U.S. Growth Stocks 10.62 36.39 20.49 14.63
U.S. Value Stocks 7.41 26.54 9.68 8.29
U.S. Mid-Cap Stocks 7.06 30.54 12.06 9.33
U.S. Small-Cap Stocks 9.94 25.52 8.59 8.23
Int’l Developed Stocks 8.17 22.01 9.56 5.67
Emerging Markets Stocks 11.84 18.42 11.57 5.61
Real Estate Stocks 0.13 28.66 10.29 8.43
U.S. Investment Grade Bonds 0.18 8.72 4.03 3.05
Long-dated Bonds -1.12 19.59 8.07 5.42
Inflation-Linked Bonds 1.00 6.85 2.79 2.36
High Yield Bonds 2.57 15.09 6.44 6.11
Commodities 4.42 7.69 -0.94 -3.92
Cash 0.47 2.30 1.68 1.09
Annualized Tuition Inflation Ending as of 2019-2020 Academic Year* (%)
Educational Institution 1 Year 3 Year 5 Year
National Average Public 4-Year In-state 2.25 2.59 2.67
National Average Private Nonprofit 4-Year 3.36 3.26 3.35
Consumer Price Index, December 2019 2.29 2.10 1.82
*Data are for the entire academic year and are average total charges for full-time
attendance. Tuition and fees were enrollment weighted. SOURCES: CollegeBoard,
Trends in College Pricing 2019 and U.S. Department of Labor: Bureau of Labor
Statistics
FOR INSTITUTIONAL INVESTOR USE ONLY. NOT FOR DISTRIBUTION TO THE PUBLIC.

Assets by Portfolio as of Q4 2019Total Assets: $13.5M
FOR INSTITUTIONAL CLIENT USE ONLY. NOT FOR DISTRIBUTION. 3
Portfolio October November DecemberQuarter-End %
of Assets
FDIC-Insured Portfolio $3,452 $3,757 $4,531 34%
Aggressive Growth Portfolio $2,004 $2,293 $3,052 23%
Moderate Portfolio $2,104 $2,388 $3,056 23%
Conservative Portfolio $2,078 $2,317 $2,863 21%
Total Assets $9,637 $10,756 $13,502 100%
Assets (in thousands)

Assets by Underlying Fund as of Q4 2019
FOR INSTITUTIONAL CLIENT USE ONLY. NOT FOR DISTRIBUTION. 4
% of Assets ($K) % of Assets ($K)
FDIC-Insured TIAA Bank Account 34% $4,531 International Equity Index Fund 8% $1,032
Equity Index Fund 24% $3,294 TIAA Life Funding Agreement 6% $841
Bond Index Fund 21% $2,770 Inflation-Linked Bond Fund 5% $690
Emerging Markets Equity Index Fund 3% $344
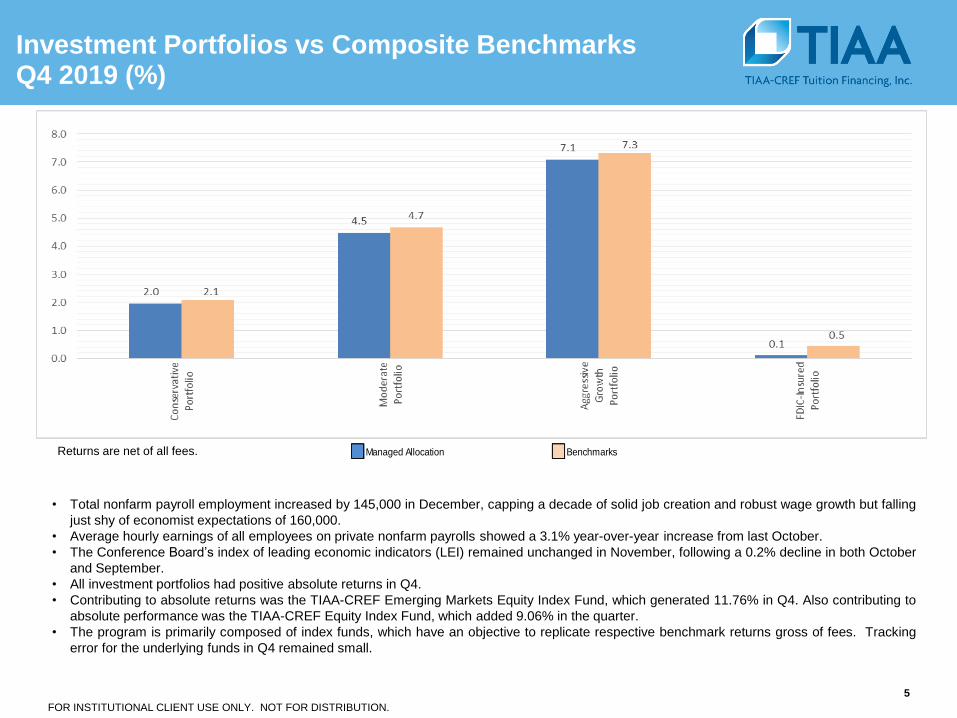
Investment Portfolios vs Composite BenchmarksQ4 2019 (%)
FOR INSTITUTIONAL CLIENT USE ONLY. NOT FOR DISTRIBUTION.
5
• Total nonfarm payroll employment increased by 145,000 in December, capping a decade of solid job creation and robust wage growth but falling
just shy of economist expectations of 160,000.
• Average hourly earnings of all employees on private nonfarm payrolls showed a 3.1% year-over-year increase from last October.
• The Conference Board’s index of leading economic indicators (LEI) remained unchanged in November, following a 0.2% decline in both October
and September.
• All investment portfolios had positive absolute returns in Q4.
• Contributing to absolute returns was the TIAA-CREF Emerging Markets Equity Index Fund, which generated 11.76% in Q4. Also contributing to
absolute performance was the TIAA-CREF Equity Index Fund, which added 9.06% in the quarter.
• The program is primarily composed of index funds, which have an objective to replicate respective benchmark returns gross of fees. Tracking
error for the underlying funds in Q4 remained small.
Managed Allocation BenchmarksReturns are net of all fees.

Investment Portfolios vs Composite Benchmarks
FOR INSTITUTIONAL CLIENT USE ONLY. NOT FOR DISTRIBUTION. 6
October November December 3 Month YTD 1 Year 3 Year Since Inception Inception Date
Managed Allocation Option
Conservative Portfolio 0.65% 0.55% 0.73% 1.95% 9.79% 9.79% - 9.52% 12/17/18
Blended Benchmark Returns 0.73% 0.60% 0.74% 2.09% 10.60% 10.60% - 10.32%
Difference -0.08% -0.05% -0.01% -0.14% -0.81% -0.81% - -0.80%
Moderate Portfolio 1.35% 1.50% 1.57% 4.48% 16.73% 16.73% - 15.84% 12/17/18
Blended Benchmark Returns 1.46% 1.44% 1.70% 4.67% 17.74% 17.74% - 16.60%
Difference -0.11% 0.06% -0.13% -0.19% -1.01% -1.01% - -0.76%
Aggressive Growth Portfolio 2.01% 2.31% 2.60% 7.08% 23.36% 23.36% - 21.59% 12/17/18
Blended Benchmark Returns 2.16% 2.32% 2.67% 7.32% 24.03% 24.03% - 21.89%
Difference -0.15% -0.01% -0.07% -0.24% -0.67% -0.67% - -0.30%
FDIC-Insured Portfolio 0.10% 0.00% 0.00% 0.10% 0.40% 0.40% - 0.39% 12/17/18
FTSE 3-Month T-Bill 0.17% 0.15% 0.14% 0.46% 2.25% 2.25% - 2.26%
Difference -0.07% -0.15% -0.14% -0.36% -1.85% -1.85% - -1.87%
Returns are net of all fees.
The crediting rate of 1.75% for the Funding Agreement in the Conservative Portfolio and Moderate Portfolio is guaranteed through 12/30/19.
Average Annual Total Return
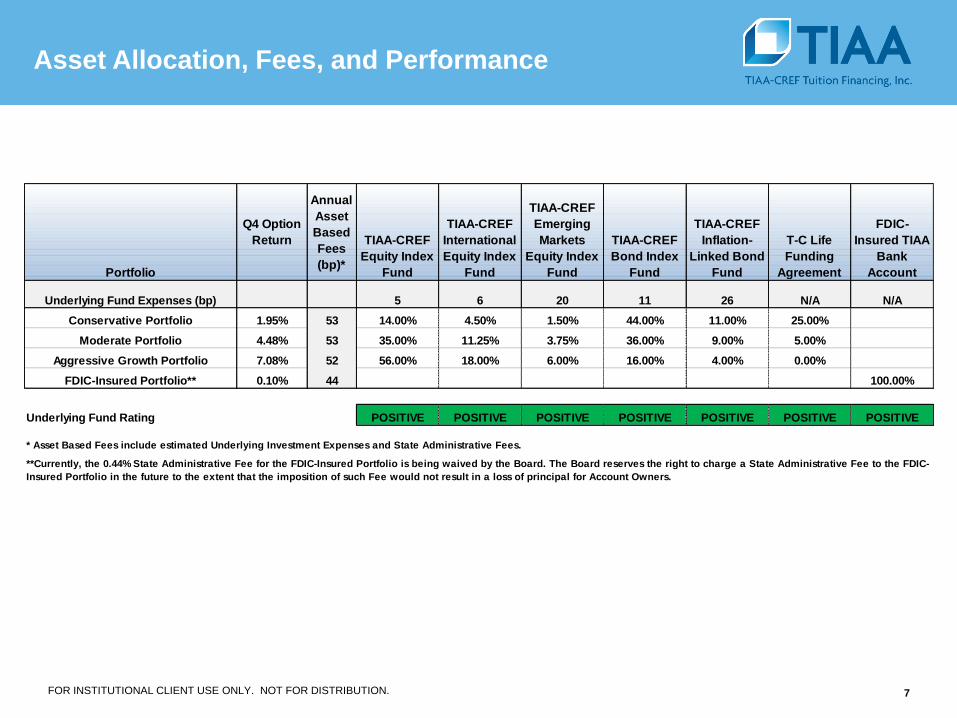
Asset Allocation, Fees, and Performance
FOR INSTITUTIONAL CLIENT USE ONLY. NOT FOR DISTRIBUTION. 7
Portfolio
Q4 Option
Return
Annual
Asset
Based
Fees
(bp)*
TIAA-CREF
Equity Index
Fund
TIAA-CREF
International
Equity Index
Fund
TIAA-CREF
Emerging
Markets
Equity Index
Fund
TIAA-CREF
Bond Index
Fund
TIAA-CREF
Inflation-
Linked Bond
Fund
T-C Life
Funding
Agreement
FDIC-
Insured TIAA
Bank
Account
Underlying Fund Expenses (bp) 5 6 20 11 26 N/A N/A
Conservative Portfolio 1.95% 53 14.00% 4.50% 1.50% 44.00% 11.00% 25.00%
Moderate Portfolio 4.48% 53 35.00% 11.25% 3.75% 36.00% 9.00% 5.00%
Aggressive Growth Portfolio 7.08% 52 56.00% 18.00% 6.00% 16.00% 4.00% 0.00%
FDIC-Insured Portfolio** 0.10% 44 100.00%
Underlying Fund Rating POSITIVE POSITIVE POSITIVE POSITIVE POSITIVE POSITIVE POSITIVE
* Asset Based Fees include estimated Underlying Investment Expenses and State Administrative Fees.
**Currently, the 0.44% State Administrative Fee for the FDIC-Insured Portfolio is being waived by the Board. The Board reserves the right to charge a State Administrative Fee to the FDIC-
Insured Portfolio in the future to the extent that the imposition of such Fee would not result in a loss of principal for Account Owners.
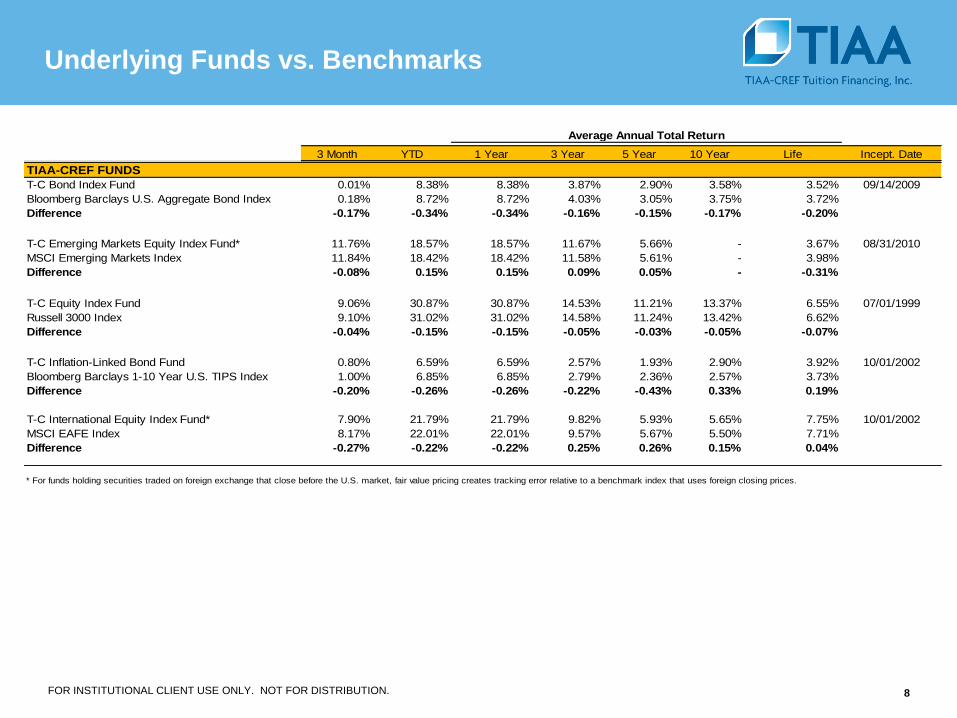
Underlying Funds vs. Benchmarks
FOR INSTITUTIONAL CLIENT USE ONLY. NOT FOR DISTRIBUTION. 8
3 Month YTD 1 Year 3 Year 5 Year 10 Year Life Incept. Date
TIAA-CREF FUNDS
T-C Bond Index Fund 0.01% 8.38% 8.38% 3.87% 2.90% 3.58% 3.52% 09/14/2009
Bloomberg Barclays U.S. Aggregate Bond Index 0.18% 8.72% 8.72% 4.03% 3.05% 3.75% 3.72%
Difference -0.17% -0.34% -0.34% -0.16% -0.15% -0.17% -0.20%
T-C Emerging Markets Equity Index Fund* 11.76% 18.57% 18.57% 11.67% 5.66% - 3.67% 08/31/2010
MSCI Emerging Markets Index 11.84% 18.42% 18.42% 11.58% 5.61% - 3.98%
Difference -0.08% 0.15% 0.15% 0.09% 0.05% - -0.31%
T-C Equity Index Fund 9.06% 30.87% 30.87% 14.53% 11.21% 13.37% 6.55% 07/01/1999
Russell 3000 Index 9.10% 31.02% 31.02% 14.58% 11.24% 13.42% 6.62%
Difference -0.04% -0.15% -0.15% -0.05% -0.03% -0.05% -0.07%
T-C Inflation-Linked Bond Fund 0.80% 6.59% 6.59% 2.57% 1.93% 2.90% 3.92% 10/01/2002
Bloomberg Barclays 1-10 Year U.S. TIPS Index 1.00% 6.85% 6.85% 2.79% 2.36% 2.57% 3.73%
Difference -0.20% -0.26% -0.26% -0.22% -0.43% 0.33% 0.19%
T-C International Equity Index Fund* 7.90% 21.79% 21.79% 9.82% 5.93% 5.65% 7.75% 10/01/2002
MSCI EAFE Index 8.17% 22.01% 22.01% 9.57% 5.67% 5.50% 7.71%
Difference -0.27% -0.22% -0.22% 0.25% 0.26% 0.15% 0.04%
* For funds holding securities traded on foreign exchange that close before the U.S. market, fair value pricing creates tracking error relative to a benchmark index that uses foreign closing prices.
Average Annual Total Return


BOSTON CHICAGO LONDON MIAMI NEW YORK PORTLAND SAN DIEGO MEKETA.COM
CalABLE Plans
March 3, 2020
4Q19 Performance & Evaluation Report

MEKETA INVESTMENT GROUP
1. The World Markets in the Fourth Quarter of 2019
2. Summary of Monitoring Status
3. CalABLE Portfolios Analysis
4. CalABLE Underlying Funds Analysis
5. Fee Schedule
CalABLE Plans
Agenda
Page 2 of 50
The World Markets
Fourth Quarter of 2019
Page 3 of 50

The World Markets Fourth Quarter of 2019
The World Markets1
Fourth Quarter of 2019
1 Source: InvestorForce.
-0.8%
0.2%
0.8%
2.5%
2.6%
4.4%
5.2%
8.2%
9.1%
9.1%
9.9%
11.8%
-5% 0% 5% 10% 15%
1
MSCI Emerging Markets
Russell 2000
S&P 500
Russell 3000
MSCI EAFE
JPM GBI-EM Global Diversified
Bloomberg Commodity Index
Bloomberg Barclays High Yield
HFRI Fund of Funds
Bloomberg Barclays US TIPS
Bloomberg Barclays Aggregate
FTSE NAREIT Equity
Page 4 of 50

The World Markets Fourth Quarter of 2019
Index Returns1
4Q19
(%)
1 YR
(%)
3 YR
(%)
5 YR
(%)
10 YR
(%)
Domestic Equity
S&P 500 9.1 31.5 15.3 11.7 13.6
Russell 3000 9.1 31.0 14.6 11.2 13.4
Russell 1000 9.0 31.4 15.0 11.5 13.5
Russell 1000 Growth 10.6 36.4 20.5 14.6 15.2
Russell 1000 Value 7.4 26.5 9.7 8.3 11.8
Russell MidCap 7.1 30.5 12.1 9.3 13.2
Russell MidCap Growth 8.2 35.5 17.4 11.6 14.2
Russell MidCap Value 6.4 27.1 8.1 7.6 12.4
Russell 2000 9.9 25.5 8.6 8.2 11.8
Russell 2000 Growth 11.4 28.5 12.5 9.3 13.0
Russell 2000 Value 8.5 22.4 4.8 7.0 10.6
Foreign Equity
MSCI ACWI (ex. US) 8.9 21.5 9.9 5.5 5.0
MSCI EAFE 8.2 22.0 9.6 5.7 5.5
MSCI EAFE (Local Currency) 5.2 21.7 7.7 6.7 7.2
MSCI EAFE Small Cap 11.5 25.0 10.9 8.9 8.7
MSCI Emerging Markets 11.8 18.4 11.6 5.6 3.7
MSCI Emerging Markets (Local Currency) 9.5 18.1 11.5 7.5 6.1
Fixed Income
Bloomberg Barclays Universal 0.5 9.3 4.3 3.4 4.1
Bloomberg Barclays Aggregate 0.2 8.7 4.0 3.0 3.7
Bloomberg Barclays US TIPS 0.8 8.4 3.3 2.6 3.4
Bloomberg Barclays High Yield 2.6 14.3 6.4 6.1 7.6
JPM GBI-EM Global Diversified 5.2 13.5 7.0 2.8 2.7
Other
FTSE NAREIT Equity -0.8 26.0 8.1 7.2 11.9
Bloomberg Commodity Index 4.4 7.7 -0.9 -3.9 -4.7
HFRI Fund of Funds 2.5 7.8 3.7 2.2 2.8
1 Source: InvestorForce.
Page 5 of 50
The World Markets Fourth Quarter of 2019
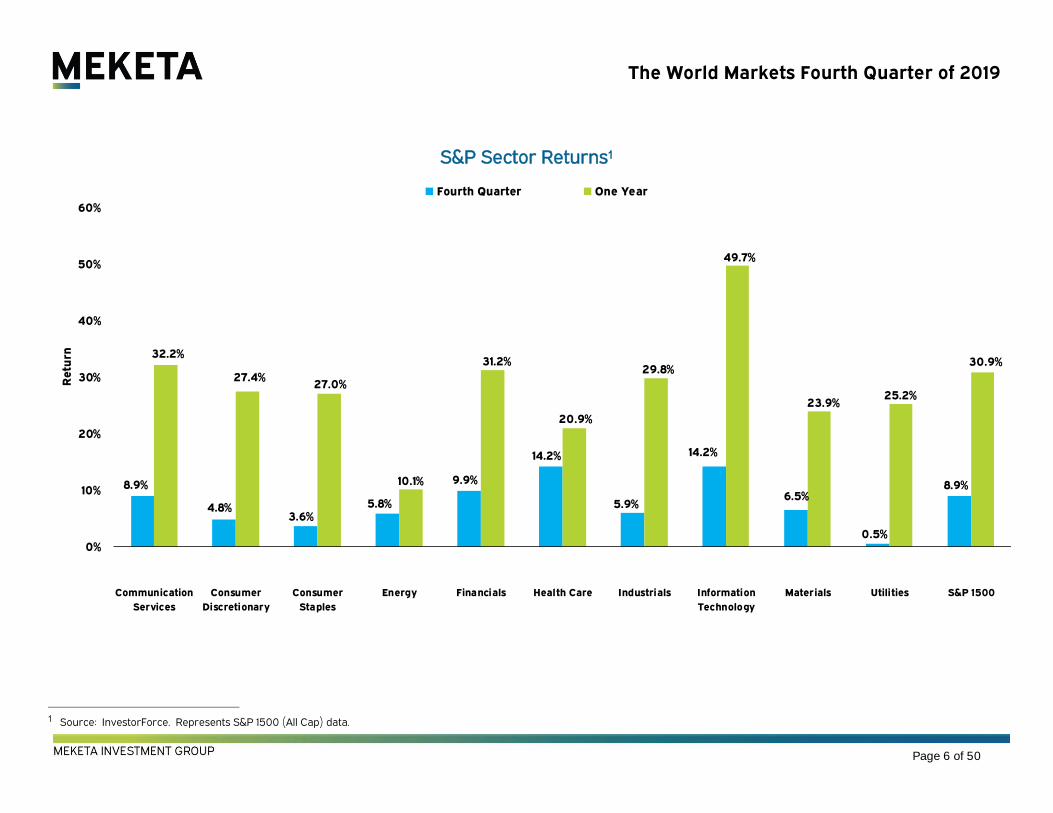
S&P Sector Returns1
1 Source: InvestorForce. Represents S&P 1500 (All Cap) data.
8.9%
4.8%3.6%
5.8%
9.9%
14.2%
5.9%
14.2%
6.5%
0.5%
8.9%
32.2%
27.4%27.0%
10.1%
31.2%
20.9%
29.8%
49.7%
23.9%25.2%
30.9%
0%
10%
20%
30%
40%
50%
60%
Communication
Services
Consumer
Discretionary
Consumer
Staples
Energy Financials Health Care Industrials Information
Technology
Materials Utilities S&P 1500
Re
turn
Fourth Quarter One Year
Page 6 of 50

The World Markets Fourth Quarter of 2019
US and Developed Market Foreign Equity Rolling Three-Year Returns1
1 Source: InvestorForce.
-30%
-20%
-10%
0%
10%
20%
30%
40%
1989 1992 1994 1996 1998 2001 2003 2005 2007 2010 2012 2014 2016 2019
Russell 3000 3-Year Return MSCI EAFE 3-Year Return
14.6%
9.6%
Page 7 of 50
The World Markets Fourth Quarter of 2019
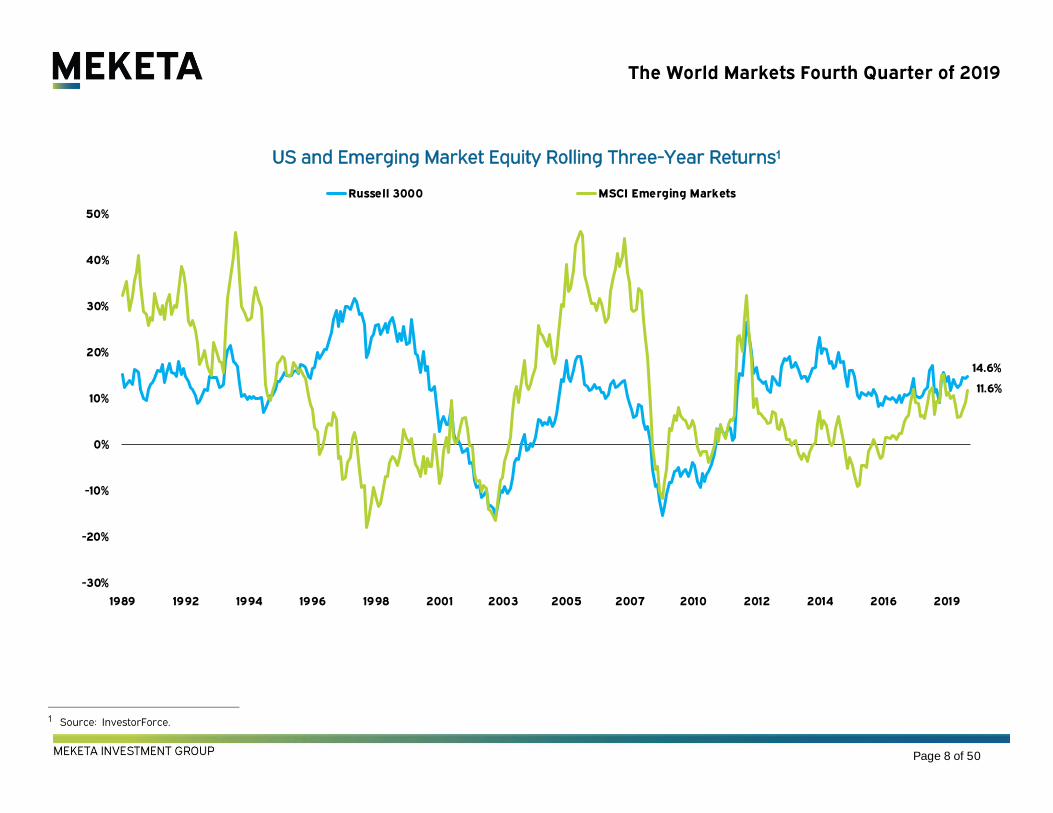
US and Emerging Market Equity Rolling Three-Year Returns1
1 Source: InvestorForce.
-30%
-20%
-10%
0%
10%
20%
30%
40%
50%
1989 1992 1994 1996 1998 2001 2003 2005 2007 2010 2012 2014 2016 2019
Russell 3000 MSCI Emerging Markets
14.6%
11.6%
Page 8 of 50

The World Markets Fourth Quarter of 2019
Rolling Ten-Year Returns: 65% Stocks and 35% Bonds1
1 Source: InvestorForce.
0%
2%
4%
6%
8%
10%
12%
14%
1999 2001 2003 2005 2007 2009 2011 2013 2015 2017 2019
65% Stocks (MSCI ACWI) / 35% Bonds (Bloomberg Barclays Aggregate) 10-Year Rolling Return
1998-2019 Average = 6.8%
7.2%
Page 9 of 50

The World Markets Fourth Quarter of 2019
Credit Spreads vs. US Treasury Bonds1, 2
1 Source: Barclays Live. Data represents the OAS. 2 The median high yield spread was 4.7% from 1997-2019.
0%
2%
4%
6%
8%
10%
12%
14%
16%
18%
20%
1998 2001 2004 2007 2010 2013 2016 2019
US High Yield US Investment Grade Corporates US Mortgage-Backed
18.3%
3.4%
High Yield Spread Average = 5.3%
0.9%0.4%
Page 10 of 50

The World Markets Fourth Quarter of 2019
US Real Gross Domestic Product (GDP) Growth1
1 Source: Bureau of Economic Analysis. Data is as of Q4 2019 and represents the first estimate.
-10%
-8%
-6%
-4%
-2%
0%
2%
4%
6%
8%
10%
1980 1982 1984 1986 1988 1990 1992 1994 1996 1998 2000 2002 2004 2006 2008 2010 2012 2014 2016 2018
Quarterly Real GDP (Annualized) 12-Month Trailing Real GDP
2.1%
(Annualized)
2.3%
(12-Month Trailing)
2019
Page 11 of 50

The World Markets Fourth Quarter of 2019
US Inflation (CPI)
Trailing Twelve Months1
1 Source: Bureau of Labor Statistics. Data is non-seasonally adjusted CPI, which may be volatile in the short-term. Data is as of December 31, 2019.
-3%
-2%
-1%
0%
1%
2%
3%
4%
5%
6%
7%
1989 1992 1994 1996 1998 2001 2003 2005 2007 2010 2012 2014 2016 2019
2.3%
1990-2019 Average = 2.5%
Page 12 of 50

The World Markets Fourth Quarter of 2019
US Unemployment1
1 Source: Bureau of Labor Statistics. Data is as of December 31, 2019.
0%
2%
4%
6%
8%
10%
12%
1980 1983 1986 1989 1992 1995 1998 2001 2004 2007 2010 2013 2016 2019
10.8%
3.5%
1980-2019 Average = 6.2%
4.4%
10.0%
Page 13 of 50

Summary of Monitoring Status
Page 14 of 50

MEKETA INVESTMENT GROUP
Underlying Fund SummaryAs of December 31, 2019
Underlying Funds Asset Class Ticker Active/Passive
TIAA-CREF Equity Index Fund Domestic Equity TIEIX Passive
TIAA-CREF Int’l Equity Index Fund International Equity TCIEX Passive
TIAA-CREF Emerging Markets Index Fund Emerging Markets TEQLX Passive
TIAA-CREF Bond Index Fund Fixed Income TBIIX Passive
TIAA-CREF Inflation Linked Bond Fund Fixed Income TIILX Active
TIAA- Life Funding Agreement Bank Deposit -- --
CalABLE Plans
Summary of Monitoring Status
Page 15 of 50

MEKETA INVESTMENT GROUP
Monitoring SummaryAs of December 31, 2019
PortfoliosTotal Fund Assets ($K)
% of TotalPrior QTR
StatusCurrent
QTR Status
Qualifies for
Watch?On Watch
Portfolios
Aggressive Growth Portfolio $3,052 23% --- --- --- ---
Moderate Portfolio $3,056 23% --- --- --- ---
Conservative Portfolio $2,863 21% --- --- --- ---
FDIC-Insured Portfolio $4,531 34% --- --- --- ---
Underlying Funds
TIAA-CREF Equity Index Fund $3,294 24% Positive Positive No No
TIAA-CREF Int’l Equity Index Fund* $1,032 8% Acceptable Positive No No
TIAA-CREF Emerging Markets Index Fund* $344 2% Positive Positive No No
TIAA-CREF Bond Index Fund $2,770 21% Positive Positive No No
TIAA-CREF Inflation Linked Bond Fund $690 5% Acceptable Acceptable No No
TIAA-Life Funding Agreement $841 6% Positive Positive No No
FDIC-Insured TIAA Bank Account $4,531 34% Positive Positive No No
Total $13,502 100% --- --- --- ---
Watch criteria summarized on Page 20.
*The TIAA-CREF International Equity and Emerging Markets Index funds’ returns have been adjusted to remove F/X and Fair Value impact for the purpose of monitoring.
CalABLE Plans
Summary of Monitoring Status
Page 16 of 50

MEKETA INVESTMENT GROUP
Fund Ticker Current PM Team Recent PM Departures*
TIAA-CREF Equity Index Fund TIEIX08/31/201005/30/201403/01/2019
Philip James CampagnaLei LiaoDarren Tran
-- --
TIAA-CREF Int’l Equity Index Fund TCIEX08/31/201005/30/201403/01/2019
Philip James CampagnaLei LiaoDarren Tran
-- --
TIAA-CREF Emerging Markets Index Fund
TEQLX08/31/201005/30/201403/01/2019
Philip James CampagnaLei LiaoDarren Tran
-- --
TIAA-CREF Bond Index Fund TBIIX12/31/200908/24/2011
Lijun (Kevin) ChenJames Tsang
-- --
TIAA-CREF Inflation Linked Bond Fund
TIILX08/21/200808/01/201608/01/2019
John Michael CerraNicholas TravaglinoChad Kemper
10/01/2011-08/01/2016 Stephen Liberatore
Portfolio Management ReviewAs of December 31, 2019
*Recent is defined as having occurred in the last three years.Source: MorningStar
• No portfolio management team changes were reported over the recent period.
CalABLE Plans
Summary of Monitoring Status
Page 17 of 50
MEKETA INVESTMENT GROUP
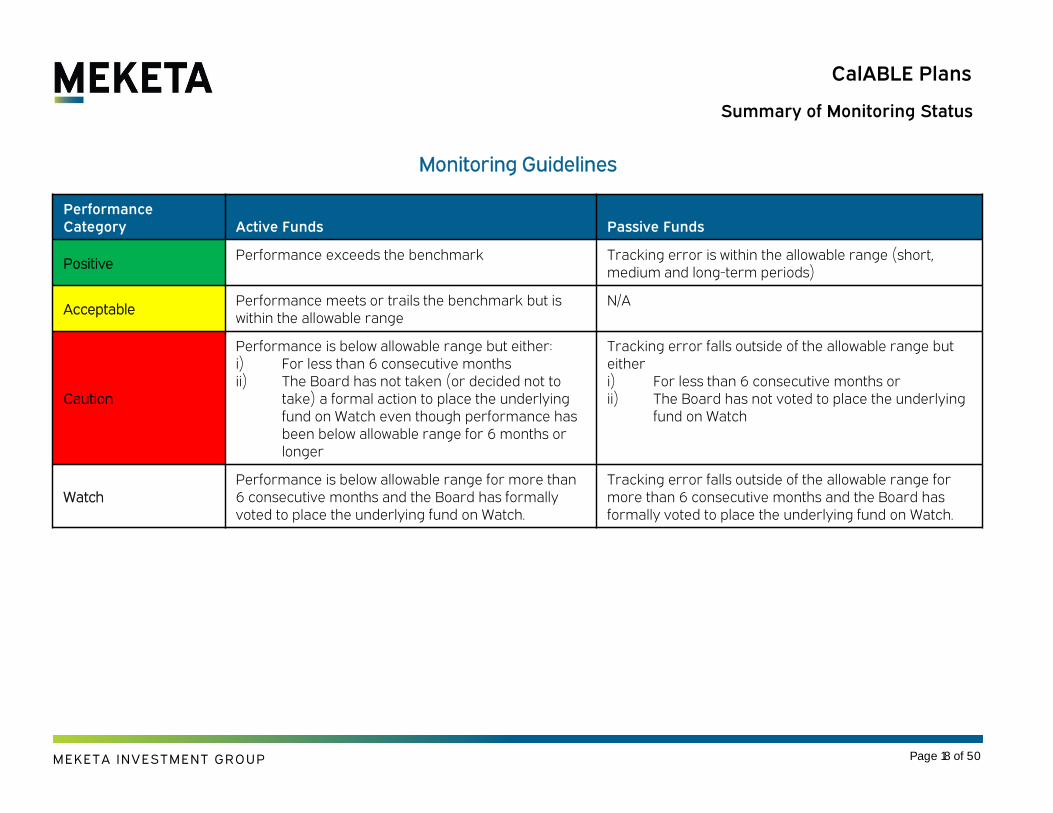
Monitoring Guidelines
Performance Category Active Funds Passive Funds
PositivePerformance exceeds the benchmark Tracking error is within the allowable range (short,
medium and long-term periods)
AcceptablePerformance meets or trails the benchmark but is within the allowable range
N/A
Caution
Performance is below allowable range but either:i) For less than 6 consecutive monthsii) The Board has not taken (or decided not to
take) a formal action to place the underlying fund on Watch even though performance has been below allowable range for 6 months or longer
Tracking error falls outside of the allowable range but eitheri) For less than 6 consecutive months orii) The Board has not voted to place the underlying
fund on Watch
WatchPerformance is below allowable range for more than 6 consecutive months and the Board has formally voted to place the underlying fund on Watch.
Tracking error falls outside of the allowable range for more than 6 consecutive months and the Board has formally voted to place the underlying fund on Watch.
CalABLE Plans
Summary of Monitoring Status
Page 18 of 50

MEKETA INVESTMENT GROUP
Asset ClassShorter-Term Performance(rolling 12-month periods)
Medium-Term Performance (rolling 36-month periods)
Long-Term(>60 months)
Actively Managed FundsFund return < Benchmark return
for 6 consecutive monthsFund return < Benchmark return
for 6 consecutive monthsVRR <
for 6 consecutive months
Fixed Income -1.0% -0.5% 0.98
CalABLE Plans
Summary of Monitoring Status
Passively Managed FundsTracking Error >
for 6 consecutive monthsTracking Error >
for 6 consecutive months
Fund annualized return < Benchmark annualized return for 6 consecutive
months
Domestic Equity 0.30% 0.25% -0.30%
International Equity 0.75% 0.70% -0.30%
Fixed Income 0.40% 0.55% -0.35%
FDIC Insured Deposit Portfolio
Asset Class FDIC-Insured Status Stability
Bank DepositBank continues with appropriate levels of insurance with the FDIC
No identifiable issues regarding changes in the bank’s financial stability
Asset Class Financial Strength Mortgage Portfolio Bond Portfolio Account Diversification
Funding Agreement(Stable Value)
Moody’s = AaaStandard & Poor’s = AAAA.M. Best = A+++Fitch = AAA
100% in Good StandingAt least 90% Investment Grade
Portfolio is diversified across asset classes and types
Monitoring GuidelinesAs of December 31, 2019
Page 19 of 50

MEKETA INVESTMENT GROUP
• Results fall in the Acceptable range.• Probationary Performance -1.00%
Benchmark: Bloomberg Barclays US TIPS 1-10 Year Index
• Results fall in the Acceptable range.• Probationary Performance -0.50%
Lo
ng
-Te
rm
• Results fall in the Acceptable range.• Probationary Performance <0.98
Monitoring Status
Acceptable
TIAA CREF Inflation-Linked Bond
CalABLE Plans
Summary of Monitoring Status
Rolling 36-Month Excess
(As of 12/31/19)
Me
diu
m-T
erm
Sh
ort
-Te
rm
Rolling 12-Month Excess
(As of 12/31/19)
VRR
(As of 12/31/19)
Page 20 of 50

MEKETA INVESTMENT GROUP
• Results fall in the Positive range.• Probationary Performance 0.30%
Benchmark: Russell 3000 Index
• Results fall in the Positive range.• Probationary Performance 0.25%
Lo
ng
-Te
rm
• Results fall in the Positive range.• Probationary Performance -0.30%
Monitoring Status
Positive
TIAA CREF Equity Index
CalABLE Plans
Summary of Monitoring Status
Rolling 36-Month Tracking Error
(As of 12/31/19)
Me
diu
m-T
erm
Sh
ort
-Te
rm
Rolling 12-Month Tracking Error
(As of 12/31/19)
5-YR Annualized Excess Return
(As of 12/31/19)
Page 21 of 50
MEKETA INVESTMENT GROUP
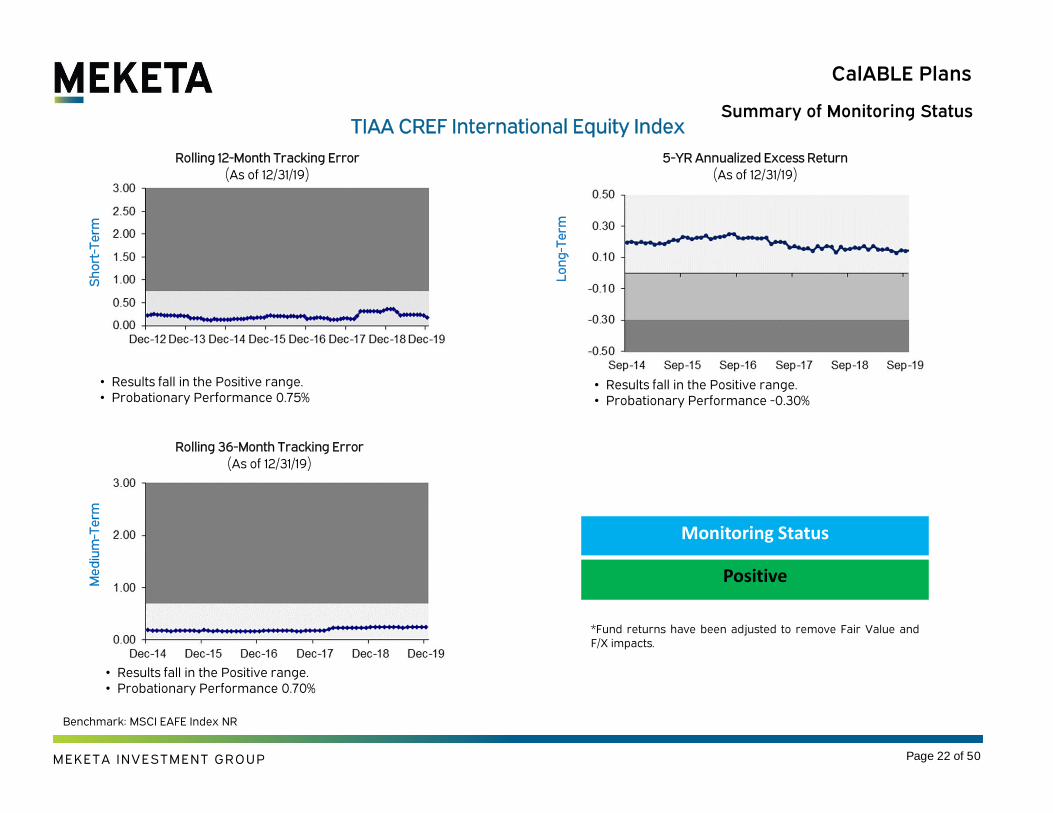
• Results fall in the Positive range.• Probationary Performance 0.75%
Benchmark: MSCI EAFE Index NR
• Results fall in the Positive range.• Probationary Performance 0.70%
Lo
ng
-Te
rm
• Results fall in the Positive range.• Probationary Performance -0.30%
Monitoring Status
Positive
TIAA CREF International Equity Index
CalABLE Plans
Summary of Monitoring StatusM
ed
ium
-Te
rmS
ho
rt-T
erm
Rolling 36-Month Tracking Error
(As of 12/31/19)
Rolling 12-Month Tracking Error
(As of 12/31/19)
5-YR Annualized Excess Return
(As of 12/31/19)
*Fund returns have been adjusted to remove Fair Value andF/X impacts.
Page 22 of 50
MEKETA INVESTMENT GROUP
• Results fall in the Positive range.• Probationary Performance 0.75%
Benchmark: MSCI Emerging Markets Index NR
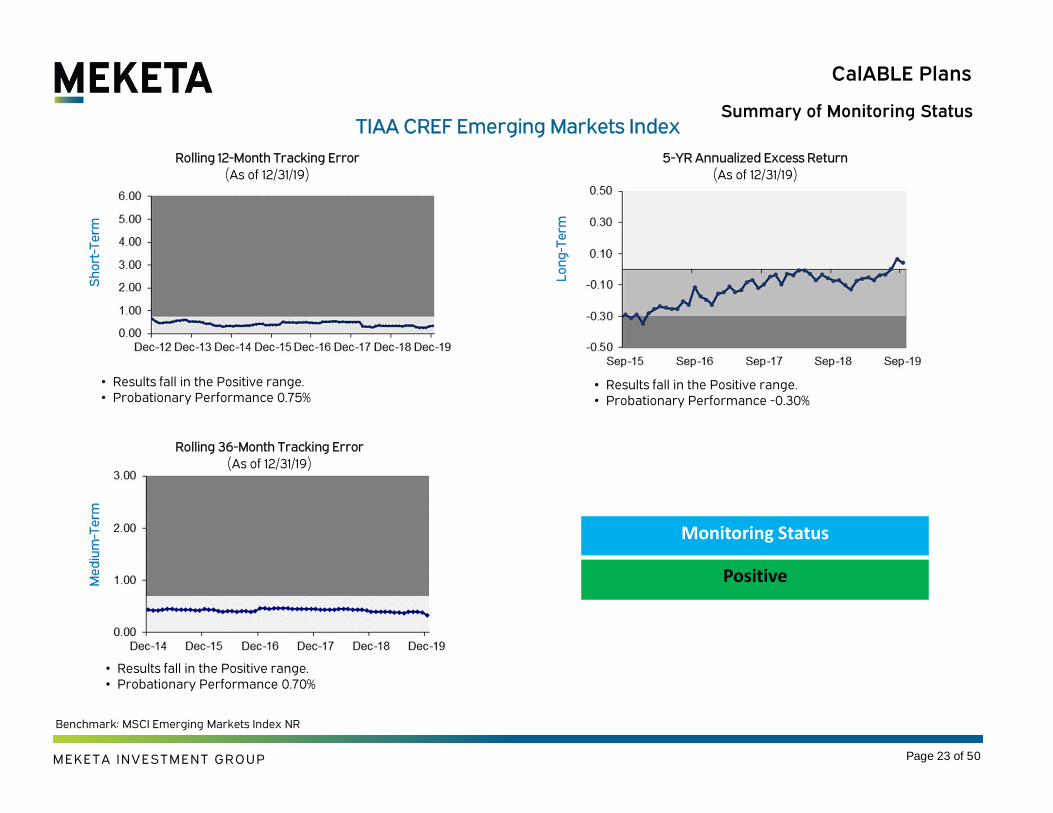
• Results fall in the Positive range.• Probationary Performance 0.70%
Lo
ng
-Te
rm
• Results fall in the Positive range.• Probationary Performance -0.30%
Monitoring Status
Positive
TIAA CREF Emerging Markets Index
CalABLE Plans
Summary of Monitoring StatusM
ed
ium
-Te
rmS
ho
rt-T
erm
Rolling 36-Month Tracking Error
(As of 12/31/19)
Rolling 12-Month Tracking Error
(As of 12/31/19)
5-YR Annualized Excess Return
(As of 12/31/19)
Page 23 of 50

MEKETA INVESTMENT GROUP
• Results fall in the Positive range.• Probationary Performance 0.40%
Benchmark: Bloomberg Barclays US Aggregate Index
• Results fall in the Positive range.• Probationary Performance 0.55%
Lo
ng
-Te
rm
• Results fall in the Positive range.• Probationary Performance -0.35%
Monitoring Status
Positive
TIAA CREF Bond Index
CalABLE Plans
Summary of Monitoring StatusM
ed
ium
-Te
rmS
ho
rt-T
erm
Rolling 36-Month Tracking Error
(As of 12/31/19)
Rolling 12-Month Tracking Error
(As of 12/31/19)
5-YR Annualized Excess Return
(As of 12/31/19)
Page 24 of 50

MEKETA INVESTMENT GROUP
Investment Grade Corp.
Bonds
73.9%
US Government-
Related Bonds
2.8%
Other Public Fixed Income
18.0%
Private Fixed Income
1.8%
Other3.5%
Monitoring Status
Positive
Criteria Status as of 12/31/2019
Financial Strength
Moody’s = Aa1Standard & Poor’s = AA+A.M. Best = A++Fitch = AAA
Mortgage Portfolio 100% in Good Standing 100% in Good Standing*
Bond Portfolio At least 90% Investment Grade 99.6% in Investment Grade
Account DiversificationPortfolio is diversified across asset classes and types
Portfolio is diversified across asset classes and types (see chart above)
*Portfolio did not contain any commercial mortgages.Source: TIAA-CREF
T-C Life Funding Agreement
CalABLE Plans
Summary of Monitoring Status
Page 25 of 50
Fitch = AAAA.M. Best = A+++Standard & Poor’s = AAA Moody’s = Aaa

CalABLE Portfolios Analysis
Page 26 of 50

CalABLE
Aggressive Growth Portfolio | As of December 31, 2019
Underlying Investment Trailing Performance
1 Mo(%)
3 Mo(%)
YTD(%)
1 Yr(%)
3 Yrs(%)
5 Yrs(%)
_
Aggressive Growth Portfolio
TIAA-CREF Bond Index Fund -0.1 0.0 8.4 8.4 3.9 2.9
BBgBarc US Aggregate TR -0.1 0.2 8.7 8.7 4.0 3.0
TIAA-CREF Inflation Linked Bond Fund 0.6 0.8 6.6 6.6 2.6 1.9
BBgBarc US TIPS 1-10 Yr TR 0.7 1.0 6.9 6.9 2.8 2.4
TIAA-CREF Emerging Markets Index Fund 7.3 11.8 18.6 18.6 11.7 5.7
MSCI Emerging Markets 7.5 11.8 18.4 18.4 11.6 5.6
TIAA-CREF Equity Index Fund 2.9 9.1 30.9 30.9 14.5 11.2
Russell 3000 2.9 9.1 31.0 31.0 14.6 11.2
TIAA-CREF Int'l Equity Index Fund 3.0 7.9 21.8 21.8 9.8 5.9
MSCI EAFE 3.2 8.2 22.0 22.0 9.6 5.7XXXXX
Page 27 of 50

Underlying Investment Trailing Performance
1 Mo(%)
3 Mo(%)
YTD(%)
1 Yr(%)
3 Yrs(%)
5 Yrs(%)
_
Moderate Portfolio
TIAA-CREF Bond Index Fund -0.1 0.0 8.4 8.4 3.9 2.9
BBgBarc US Aggregate TR -0.1 0.2 8.7 8.7 4.0 3.0
TIAA-CREF Inflation Linked Bond Fund 0.6 0.8 6.6 6.6 2.6 1.9
BBgBarc US TIPS 1-10 Yr TR 0.7 1.0 6.9 6.9 2.8 2.4
TIAA-CREF Emerging Markets Index Fund 7.3 11.8 18.6 18.6 11.7 5.7
MSCI Emerging Markets 7.5 11.8 18.4 18.4 11.6 5.6
TIAA-CREF Equity Index Fund 2.9 9.1 30.9 30.9 14.5 11.2
Russell 3000 2.9 9.1 31.0 31.0 14.6 11.2
TIAA-CREF Int'l Equity Index Fund 3.0 7.9 21.8 21.8 9.8 5.9
MSCI EAFE 3.2 8.2 22.0 22.0 9.6 5.7
TIAA - Life Funding Agreement XXXXX
CalABLE
Moderate Portfolio | As of December 31, 2019
Page 28 of 50
Underlying Investment Trailing Performance
1 Mo(%)
3 Mo(%)
YTD(%)
1 Yr(%)
3 Yrs(%)
5 Yrs(%)
_
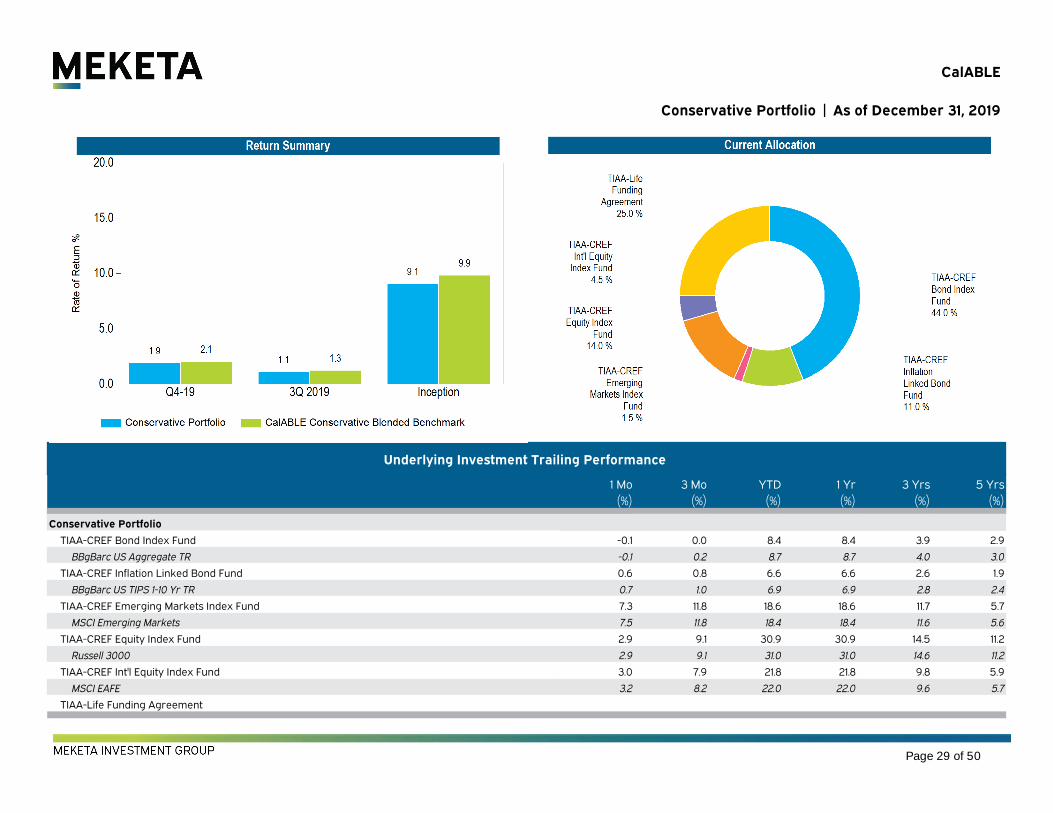
Conservative Portfolio
TIAA-CREF Bond Index Fund -0.1 0.0 8.4 8.4 3.9 2.9
BBgBarc US Aggregate TR -0.1 0.2 8.7 8.7 4.0 3.0
TIAA-CREF Inflation Linked Bond Fund 0.6 0.8 6.6 6.6 2.6 1.9
BBgBarc US TIPS 1-10 Yr TR 0.7 1.0 6.9 6.9 2.8 2.4
TIAA-CREF Emerging Markets Index Fund 7.3 11.8 18.6 18.6 11.7 5.7
MSCI Emerging Markets 7.5 11.8 18.4 18.4 11.6 5.6
TIAA-CREF Equity Index Fund 2.9 9.1 30.9 30.9 14.5 11.2
Russell 3000 2.9 9.1 31.0 31.0 14.6 11.2
TIAA-CREF Int'l Equity Index Fund 3.0 7.9 21.8 21.8 9.8 5.9
MSCI EAFE 3.2 8.2 22.0 22.0 9.6 5.7
TIAA-Life Funding Agreement XXXXX
CalABLE
Conservative Portfolio | As of December 31, 2019
Page 29 of 50

CalABLE
Managed Portfolios | As of December 31, 2019
Page 30 of 50

CalABLE Underlying Funds Analysis
Page 31 of 50
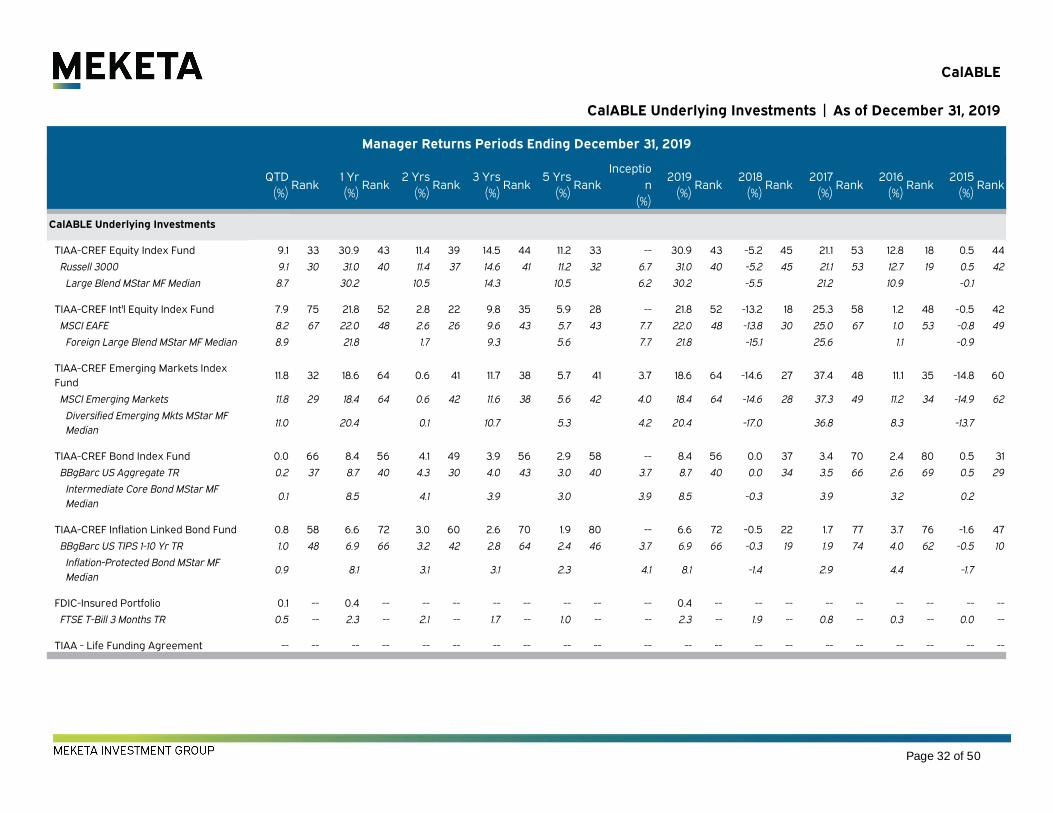
Manager Returns Periods Ending December 31, 2019
QTD(%)
Rank1 Yr(%)
Rank2 Yrs
(%)Rank
3 Yrs(%)
Rank5 Yrs
(%)Rank
Inception
(%)
2019(%)
Rank2018
(%)Rank
2017(%)
Rank2016
(%)Rank
2015(%)
Rank
_
CalABLE Underlying Investments
TIAA-CREF Equity Index Fund 9.1 33 30.9 43 11.4 39 14.5 44 11.2 33 -- 30.9 43 -5.2 45 21.1 53 12.8 18 0.5 44
Russell 3000 9.1 30 31.0 40 11.4 37 14.6 41 11.2 32 6.7 31.0 40 -5.2 45 21.1 53 12.7 19 0.5 42
Large Blend MStar MF Median 8.7 30.2 10.5 14.3 10.5 6.2 30.2 -5.5 21.2 10.9 -0.1
TIAA-CREF Int'l Equity Index Fund 7.9 75 21.8 52 2.8 22 9.8 35 5.9 28 -- 21.8 52 -13.2 18 25.3 58 1.2 48 -0.5 42
MSCI EAFE 8.2 67 22.0 48 2.6 26 9.6 43 5.7 43 7.7 22.0 48 -13.8 30 25.0 67 1.0 53 -0.8 49
Foreign Large Blend MStar MF Median 8.9 21.8 1.7 9.3 5.6 7.7 21.8 -15.1 25.6 1.1 -0.9
TIAA-CREF Emerging Markets IndexFund
11.8 32 18.6 64 0.6 41 11.7 38 5.7 41 3.7 18.6 64 -14.6 27 37.4 48 11.1 35 -14.8 60
MSCI Emerging Markets 11.8 29 18.4 64 0.6 42 11.6 38 5.6 42 4.0 18.4 64 -14.6 28 37.3 49 11.2 34 -14.9 62
Diversified Emerging Mkts MStar MFMedian
11.0 20.4 0.1 10.7 5.3 4.2 20.4 -17.0 36.8 8.3 -13.7
TIAA-CREF Bond Index Fund 0.0 66 8.4 56 4.1 49 3.9 56 2.9 58 -- 8.4 56 0.0 37 3.4 70 2.4 80 0.5 31
BBgBarc US Aggregate TR 0.2 37 8.7 40 4.3 30 4.0 43 3.0 40 3.7 8.7 40 0.0 34 3.5 66 2.6 69 0.5 29
Intermediate Core Bond MStar MFMedian
0.1 8.5 4.1 3.9 3.0 3.9 8.5 -0.3 3.9 3.2 0.2
TIAA-CREF Inflation Linked Bond Fund 0.8 58 6.6 72 3.0 60 2.6 70 1.9 80 -- 6.6 72 -0.5 22 1.7 77 3.7 76 -1.6 47
BBgBarc US TIPS 1-10 Yr TR 1.0 48 6.9 66 3.2 42 2.8 64 2.4 46 3.7 6.9 66 -0.3 19 1.9 74 4.0 62 -0.5 10
Inflation-Protected Bond MStar MFMedian
0.9 8.1 3.1 3.1 2.3 4.1 8.1 -1.4 2.9 4.4 -1.7
FDIC-Insured Portfolio 0.1 -- 0.4 -- -- -- -- -- -- -- -- 0.4 -- -- -- -- -- -- -- -- --
FTSE T-Bill 3 Months TR 0.5 -- 2.3 -- 2.1 -- 1.7 -- 1.0 -- -- 2.3 -- 1.9 -- 0.8 -- 0.3 -- 0.0 --
TIAA - Life Funding Agreement -- -- -- -- -- -- -- -- -- -- -- -- -- -- -- -- -- -- -- -- --XXXXX
CalABLE
CalABLE Underlying Investments | As of December 31, 2019
Page 32 of 50

CalABLE
TIAA-CREF Equity Index Fund
As of December 31, 2019
Portfolio Fund InformationTicker TIEIX
Morningstar Category Large Blend
Morningstar Rating (3 Year) 3 (stars)
Average Market Cap ($mm) 73,939.00
Net Assets ($mm) 9,641.83
% Assets in Top 10 Holdings 18.88
Total Number of Holdings 2,790
Manager NamePhilip James(Jim)
Campagna
Manager Tenure 14
Expense Ratio 0.05%
Closed to New Investors No
Sector Allocation as of December 31, 2019BASIC MATERIALS 2.51%
COMMUNICATION SERVICES 9.46%
CONSUMER CYCLICAL 9.89%
CONSUMER DEFENSIVE 6.80%
ENERGY 4.07%
FINANCIAL SERVICES 15.78%
HEALTHCARE 14.27%
INDUSTRIALS 10.09%
REAL ESTATE 4.28%
TECHNOLOGY 19.63%
UTILITIES 3.22%
Description:The investment seeks a favorable long-term total return, mainly through capital appreciation, by investing primarily in a portfolio of equity securities selected to track the overallU.S. equity markets based on a market index. Under normal circumstances, the fund invests at least 80% of its assets in equity securities of its benchmark index, the Russell 3000® Index. It buys most, but not necessarily all,of the stocks in its benchmark index, and the advisor will attempt to closely match the overall investment characteristics of its benchmark index.
Fund Characteristics Sharpe Ratio (3 Year) 1.04
Average Market Cap ($mm) 73,939.00
Price/Earnings 18.60
Price/Book 3.15
Price/Sales 2.10
Price/Cash Flow 9.77
Dividend Yield 1.82
Number of Equity Holdings 2,776
R-Squared (3 Year) 1.00
Alpha (3 Year) 0.00%
Top Holdings as of December 31, 2019APPLE INC 4.01%
MICROSOFT CORP 3.67%
AMAZON.COM INC 2.35%
FACEBOOK INC A 1.51%
BERKSHIRE HATHAWAY INC B 1.36%
JPMORGAN CHASE & CO 1.34%
ALPHABET INC A 1.23%
ALPHABET INC CLASS C 1.23%
JOHNSON & JOHNSON 1.19%
VISA INC CLASS A 0.99%
Top Countries as of December 31, 2019United States 99.09%
United Kingdom 0.42%
Switzerland 0.26%
China 0.12%
Puerto Rico 0.04%
Canada 0.02%
India 0.02%
Ghana 0.01%
Marshall Islands 0.01%
Taiwan 0.01%
Top Regions as of December 31, 2019UNITED STATES 99.08%
UNITED KINGDOM 0.41%
EUROPE EXEURO 0.27%
ASIA EMERGING 0.15%
LATIN AMERICA 0.04%
CalABLE
TIAA-CREF Equity Index Fund |As of December 31, 2019
CalABLE
TIAA-CREF Equity Index Fund | As of December 31, 2019
Page 33 of 50

QTD Rank 1 Yr Rank 2 Yrs Rank 3 Yrs Rank 5 Yrs Rank 2019 Rank 2018 Rank 2017 Rank 2016 Rank 2015 RankTIAA-CREF Equity Index Fund 9.1 33 30.9 43 11.4 39 14.5 44 11.2 33 30.9 43 -5.2 45 21.1 53 12.8 18 0.5 44
Russell 3000 9.1 30 31.0 40 11.4 37 14.6 41 11.2 32 31.0 40 -5.2 45 21.1 53 12.7 19 0.5 42
Universe Median 8.7 30.2 10.5 14.3 10.5 30.2 -5.5 21.2 10.9 -0.1
CalABLE
TIAA-CREF Equity Index Fund | As of December 31, 2019
Page 23 of 39Page 34 of 50

CalABLE
TIAA-CREF Equity Index Fund | As of December 31, 2019
Page 35 of 50
Portfolio Fund InformationTicker TCIEX
Morningstar Category Foreign Large Blend
Morningstar Rating (3 Year) 4 (stars)
Average Market Cap ($mm) 38,373.08
Net Assets ($mm) 8,280.47
% Assets in Top 10 Holdings 11.95
Total Number of Holdings 934
Manager NamePhilip James(Jim)
Campagna
Manager Tenure 15
Expense Ratio 0.06%
Closed to New Investors No
Sector Allocation as of December 31, 2019BASIC MATERIALS 7.04%
COMMUNICATION SERVICES 5.97%
CONSUMER CYCLICAL 10.23%
CONSUMER DEFENSIVE 11.24%
ENERGY 5.14%
FINANCIAL SERVICES 18.61%
HEALTHCARE 12.54%
INDUSTRIALS 14.90%
REAL ESTATE 3.44%
TECHNOLOGY 7.30%
UTILITIES 3.59%
Description:The investment seeks a favorable long-term total return, mainly through capital appreciation, by investing primarily in a portfolio of foreign equity investments based on amarket index. Under normal circumstances, the fund invests at least 80% of its assets in securities of its benchmark index, the MSCI EAFE Index. It buys most, but not necessarily all, of thestocks included in its benchmark index, and the advisor will attempt to closely match the overall investment characteristics of the fund's benchmark index.
Fund Characteristics Sharpe Ratio (3 Year) 0.74
Average Market Cap ($mm) 38,373.08
Price/Earnings 14.73
Price/Book 1.54
Price/Sales 1.17
Price/Cash Flow 7.42
Dividend Yield 3.40
Number of Equity Holdings 919
R-Squared (3 Year) 0.99
Alpha (3 Year) 0.02%
Top Holdings as of December 31, 2019NESTLE SA 2.10%
MSCI EAFE MAR20 IFUS 20200320 1.51%
ROCHE HOLDING AG DIVIDEND RIGHT CERT. 1.49%
NOVARTIS AG 1.33%
TOYOTA MOTOR CORP 1.05%
HSBC HOLDINGS PLC 1.03%
TOTAL SA 0.87%
ASTRAZENECA PLC 0.86%
SAP SE 0.86%
LVMH MOET HENNESSY LOUIS VUITTON SE 0.85%
Top Countries as of December 31, 2019Japan 24.40%
United Kingdom 16.20%
France 11.24%
Switzerland 9.62%
Germany 8.70%
Australia 6.77%
Netherlands 3.58%
Hong Kong 3.08%
Spain 2.85%
Sweden 2.46%
Top Regions as of December 31, 2019EUROZONE 31.10%
JAPAN 24.41%
UNITED KINGDOM 16.20%
EUROPE EXEURO 14.54%
AUSTRALIASIA 7.05%
CalABLE
TIAA-CREF Int'l Equity Index Fund | As of December 31, 2019
Page 36 of 50

QTD Rank 1 Yr Rank 2 Yrs Rank 3 Yrs Rank 5 Yrs Rank 2019 Rank 2018 Rank 2017 Rank 2016 Rank 2015 RankTIAA-CREF Int'l Equity IndexFund
7.9 75 21.8 52 2.8 22 9.8 35 5.9 28 21.8 52 -13.2 18 25.3 58 1.2 48 -0.5 42
MSCI EAFE 8.2 67 22.0 48 2.6 26 9.6 43 5.7 43 22.0 48 -13.8 30 25.0 67 1.0 53 -0.8 49
Universe Median 8.9 21.8 1.7 9.3 5.6 21.8 -15.1 25.6 1.1 -0.9
CalABLE
TIAA-CREF Int'l Equity Index Fund |As of December 31, 2019
Page 37 of 50

CalABLE
TIAA-CREF Int'l Equity Index Fund |As of December 31, 2019
Page 38 of 50

Portfolio Fund InformationTicker TEQLX
Morningstar CategoryDiversified Emerging
Mkts
Morningstar Rating (3 Year) 3 (stars)
Average Market Cap ($mm) 35,777.44
Net Assets ($mm) 876.50
% Assets in Top 10 Holdings 24.43
Total Number of Holdings 1,400
Manager NamePhilip James(Jim)
Campagna
Manager Tenure 9
Expense Ratio 0.20%
Closed to New Investors No
Sector Allocation as of December 31, 2019BASIC MATERIALS 7.28%
COMMUNICATION SERVICES 12.36%
CONSUMER CYCLICAL 12.47%
CONSUMER DEFENSIVE 6.46%
ENERGY 7.27%
FINANCIAL SERVICES 24.18%
HEALTHCARE 2.95%
INDUSTRIALS 5.49%
REAL ESTATE 3.13%
TECHNOLOGY 15.90%
UTILITIES 2.52%
Description:The investment seeks a favorable long-term total return, mainly through capital appreciation, by investing primarily in a portfolio of emerging market equity investments basedon a market index. Under normal circumstances, the fund invests at least 80% of its assets in equity securities that comprise its benchmark index, the MSCI Emerging Markets® Index ("MSCI EMIndex"), or in instruments with economic characteristics similar to all or a portion of the MSCI EM Index. It buys most, but not necessarily all, of the stocks in its benchmark index,and the advisor will attempt to closely match the overall investment attributes of the fund's benchmark index.
Fund Characteristics Sharpe Ratio (3 Year) 0.69
Average Market Cap ($mm) 35,777.44
Price/Earnings 12.74
Price/Book 1.54
Price/Sales 1.23
Price/Cash Flow 4.92
Dividend Yield 3.10
Number of Equity Holdings 1,385
R-Squared (3 Year) 0.99
Alpha (3 Year) 0.00%
Top Holdings as of December 31, 2019ALIBABA GROUP HOLDING LTD ADR 5.69%
TENCENT HOLDINGS LTD 4.38%
TAIWAN SEMICONDUCTOR MANUFACTURINGCO LTD
4.32%
SAMSUNG ELECTRONICS CO LTD 3.65%
CHINA CONSTRUCTION BANK CORP CLASS H 1.33%
NASPERS LTD CLASS N 1.14%
PING AN INSURANCE (GROUP) CO. OF CHINALTD CLASS H
1.05%
VANGUARD FTSE EMERGING MARKETS ETF 1.05%
RELIANCE INDUSTRIES LTD 0.96%
HOUSING DEVELOPMENT FINANCE CORP LTD 0.87%
Top Countries as of December 31, 2019China 33.37%
Taiwan 11.83%
South Korea 11.79%
India 8.59%
Brazil 7.47%
South Africa 4.67%
Russia 3.92%
Saudi Arabia 2.61%
Thailand 2.59%
Mexico 2.21%
Top Regions as of December 31, 2019ASIA EMERGING 49.31%
ASIA DEVELOPED 24.32%
LATIN AMERICA 11.03%
EUROPE EMERGING 5.74%
AFRICA 4.80%
CalABLE
TIAA-CREF Emerging Markets Index Fund |As of December 31, 2019
Page 39 of 50

QTD Rank 1 Yr Rank 2 Yrs Rank 3 Yrs Rank 5 Yrs Rank 2019 Rank 2018 Rank 2017 Rank 2016 Rank 2015 RankTIAA-CREF Emerging MarketsIndex Fund
11.8 32 18.6 64 0.6 41 11.7 38 5.7 41 18.6 64 -14.6 27 37.4 48 11.1 35 -14.8 60
MSCI Emerging Markets 11.8 29 18.4 64 0.6 42 11.6 38 5.6 42 18.4 64 -14.6 28 37.3 49 11.2 34 -14.9 62
Universe Median 11.0 20.4 0.1 10.7 5.3 20.4 -17.0 36.8 8.3 -13.7
CalABLE
TIAA-CREF Emerging Markets Index Fund |As of December 31, 2019
Page 40 of 50

CalABLE
TIAA-CREF Emerging Markets Index Fund |As of December 31, 2019
Page 41 of 50
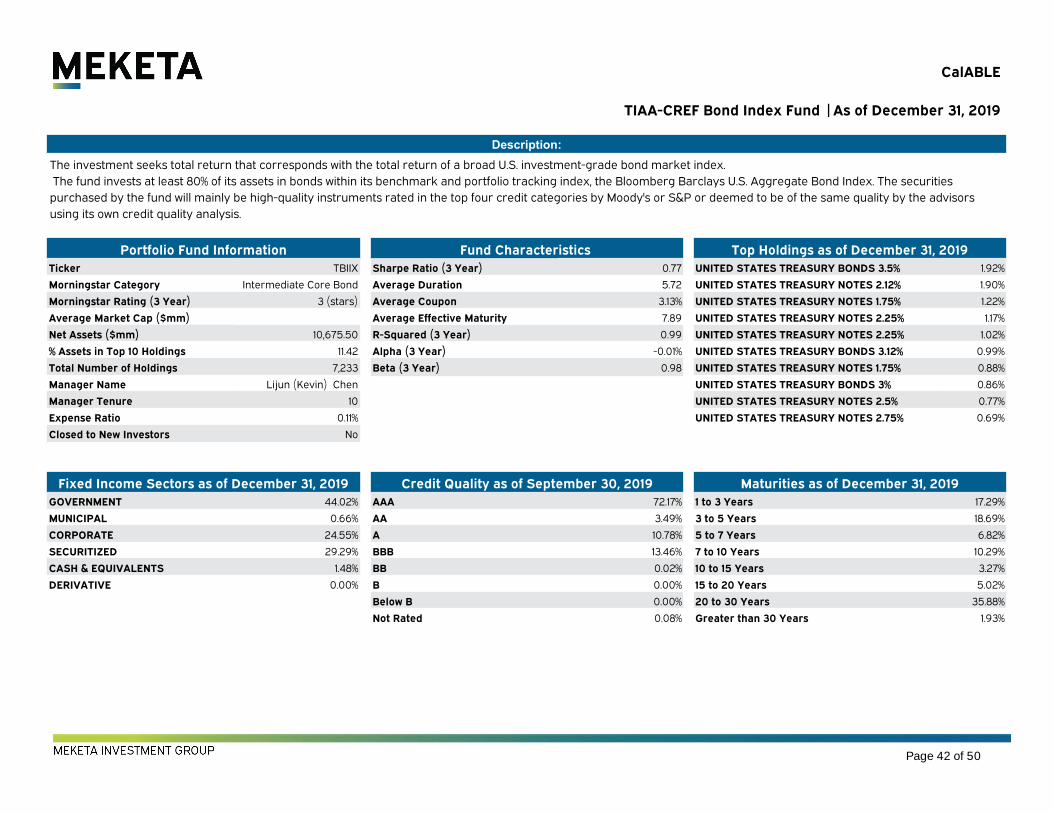
Portfolio Fund InformationTicker TBIIX
Morningstar Category Intermediate Core Bond
Morningstar Rating (3 Year) 3 (stars)
Average Market Cap ($mm)
Net Assets ($mm) 10,675.50
% Assets in Top 10 Holdings 11.42
Total Number of Holdings 7,233
Manager Name Lijun (Kevin) Chen
Manager Tenure 10
Expense Ratio 0.11%
Closed to New Investors No
Fixed Income Sectors as of December 31, 2019GOVERNMENT 44.02%
MUNICIPAL 0.66%
CORPORATE 24.55%
SECURITIZED 29.29%
CASH & EQUIVALENTS 1.48%
DERIVATIVE 0.00%
Description:The investment seeks total return that corresponds with the total return of a broad U.S. investment-grade bond market index. The fund invests at least 80% of its assets in bonds within its benchmark and portfolio tracking index, the Bloomberg Barclays U.S. Aggregate Bond Index. The securitiespurchased by the fund will mainly be high-quality instruments rated in the top four credit categories by Moody's or S&P or deemed to be of the same quality by the advisorsusing its own credit quality analysis.
Fund Characteristics Sharpe Ratio (3 Year) 0.77
Average Duration 5.72
Average Coupon 3.13%
Average Effective Maturity 7.89
R-Squared (3 Year) 0.99
Alpha (3 Year) -0.01%
Beta (3 Year) 0.98
Top Holdings as of December 31, 2019UNITED STATES TREASURY BONDS 3.5% 1.92%
UNITED STATES TREASURY NOTES 2.12% 1.90%
UNITED STATES TREASURY NOTES 1.75% 1.22%
UNITED STATES TREASURY NOTES 2.25% 1.17%
UNITED STATES TREASURY NOTES 2.25% 1.02%
UNITED STATES TREASURY BONDS 3.12% 0.99%
UNITED STATES TREASURY NOTES 1.75% 0.88%
UNITED STATES TREASURY BONDS 3% 0.86%
UNITED STATES TREASURY NOTES 2.5% 0.77%
UNITED STATES TREASURY NOTES 2.75% 0.69%
Credit Quality as of September 30, 2019AAA 72.17%
AA 3.49%
A 10.78%
BBB 13.46%
BB 0.02%
B 0.00%
Below B 0.00%
Not Rated 0.08%
Maturities as of December 31, 20191 to 3 Years 17.29%
3 to 5 Years 18.69%
5 to 7 Years 6.82%
7 to 10 Years 10.29%
10 to 15 Years 3.27%
15 to 20 Years 5.02%
20 to 30 Years 35.88%
Greater than 30 Years 1.93%
CalABLE
TIAA-CREF Bond Index Fund |As of December 31, 2019
Page 42 of 50
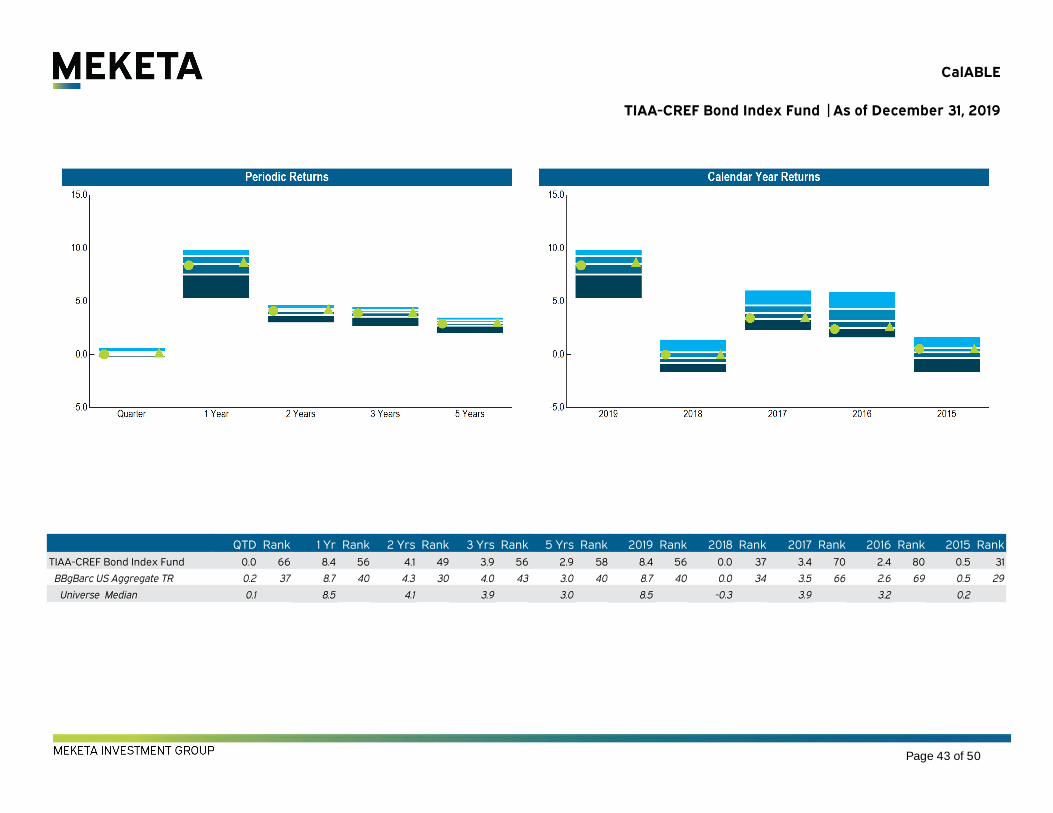
QTD Rank 1 Yr Rank 2 Yrs Rank 3 Yrs Rank 5 Yrs Rank 2019 Rank 2018 Rank 2017 Rank 2016 Rank 2015 RankTIAA-CREF Bond Index Fund 0.0 66 8.4 56 4.1 49 3.9 56 2.9 58 8.4 56 0.0 37 3.4 70 2.4 80 0.5 31
BBgBarc US Aggregate TR 0.2 37 8.7 40 4.3 30 4.0 43 3.0 40 8.7 40 0.0 34 3.5 66 2.6 69 0.5 29
Universe Median 0.1 8.5 4.1 3.9 3.0 8.5 -0.3 3.9 3.2 0.2
CalABLECalABLE
TIAA-CREF Bond Index Fund |As of December 31, 2019
Page 43 of 50

CalABLECalABLE
TIAA-CREF Bond Index Fund |As of December 31, 2019
Page 44 of 50

Portfolio Fund InformationTicker TIILX
Morningstar Category Inflation-Protected Bond
Morningstar Rating (3 Year) 3 (stars)
Average Market Cap ($mm)
Net Assets ($mm) 1,614.22
% Assets in Top 10 Holdings 42.73
Total Number of Holdings 49
Manager Name John Michael Cerra
Manager Tenure 11
Expense Ratio 0.26%
Closed to New Investors No
Fixed Income Sectors as of December 31, 2019GOVERNMENT 97.22%
MUNICIPAL 0.00%
CORPORATE 0.51%
SECURITIZED 1.60%
CASH & EQUIVALENTS 0.67%
DERIVATIVE 0.00%
Description:The investment seeks to provide inflation protection and income, primarily through investment in inflation-linked bonds. The fund invests at least 80% of its assets in fixed-income securities whose principal value increases or decreases based on changes in the Consumer Price Index for All UrbanConsumers ("CPI-U"), over the life of the security. Typically, it will invest in U.S. Treasury Inflation-Indexed Securities ("TIIS"). Under most circumstances, the fund's investments ininflation-linked bonds of foreign issuers are generally less than 20% of its assets.
Fund Characteristics Sharpe Ratio (3 Year) 0.44
Average Duration 5.06
Average Coupon 0.87%
Average Effective Maturity 5.34
R-Squared (3 Year) 0.98
Alpha (3 Year) -0.01%
Beta (3 Year) 0.99
Top Holdings as of December 31, 2019UNITED STATES TREASURY NOTES 0.12% 4.88%
UNITED STATES TREASURY NOTES 0.25% 4.47%
UNITED STATES TREASURY BONDS 3.88% 4.45%
UNITED STATES TREASURY NOTES 0.5% 4.32%
UNITED STATES TREASURY NOTES 0.12% 4.30%
UNITED STATES TREASURY NOTES 0.62% 4.27%
UNITED STATES TREASURY NOTES 0.12% 4.20%
UNITED STATES TREASURY NOTES 0.38% 4.05%
UNITED STATES TREASURY NOTES 0.12% 3.90%
UNITED STATES TREASURY NOTES 0.12% 3.89%
Credit Quality as of September 30, 2019AAA 99.58%
AA 0.00%
A 0.00%
BBB 0.00%
BB 0.00%
B 0.00%
Below B 0.00%
Not Rated 0.42%
Maturities as of December 31, 20191 to 3 Years 22.46%
3 to 5 Years 24.37%
5 to 7 Years 20.84%
7 to 10 Years 29.97%
10 to 15 Years 0.95%
15 to 20 Years 0.29%
20 to 30 Years 0.93%
Greater than 30 Years 0.00%
CalABLE
TIAA-CREF Inflation Linked Bond Fund |As of December 31, 2019
Page 45 of 50

QTD Rank 1 Yr Rank 2 Yrs Rank 3 Yrs Rank 5 Yrs Rank 2019 Rank 2018 Rank 2017 Rank 2016 Rank 2015 RankTIAA-CREF Inflation Linked BondFund
0.8 58 6.6 72 3.0 60 2.6 70 1.9 80 6.6 72 -0.5 22 1.7 77 3.7 76 -1.6 47
BBgBarc US TIPS 1-10 Yr TR 1.0 48 6.9 66 3.2 42 2.8 64 2.4 46 6.9 66 -0.3 19 1.9 74 4.0 62 -0.5 10
Universe Median 0.9 8.1 3.1 3.1 2.3 8.1 -1.4 2.9 4.4 -1.7
CalABLE
TIAA-CREF Inflation Linked Bond Fund |As of December 31, 2019
Page 46 of 50

CalABLE
TIAA-CREF Inflation Linked Bond Fund |As of December 31, 2019
Page 47 of 50
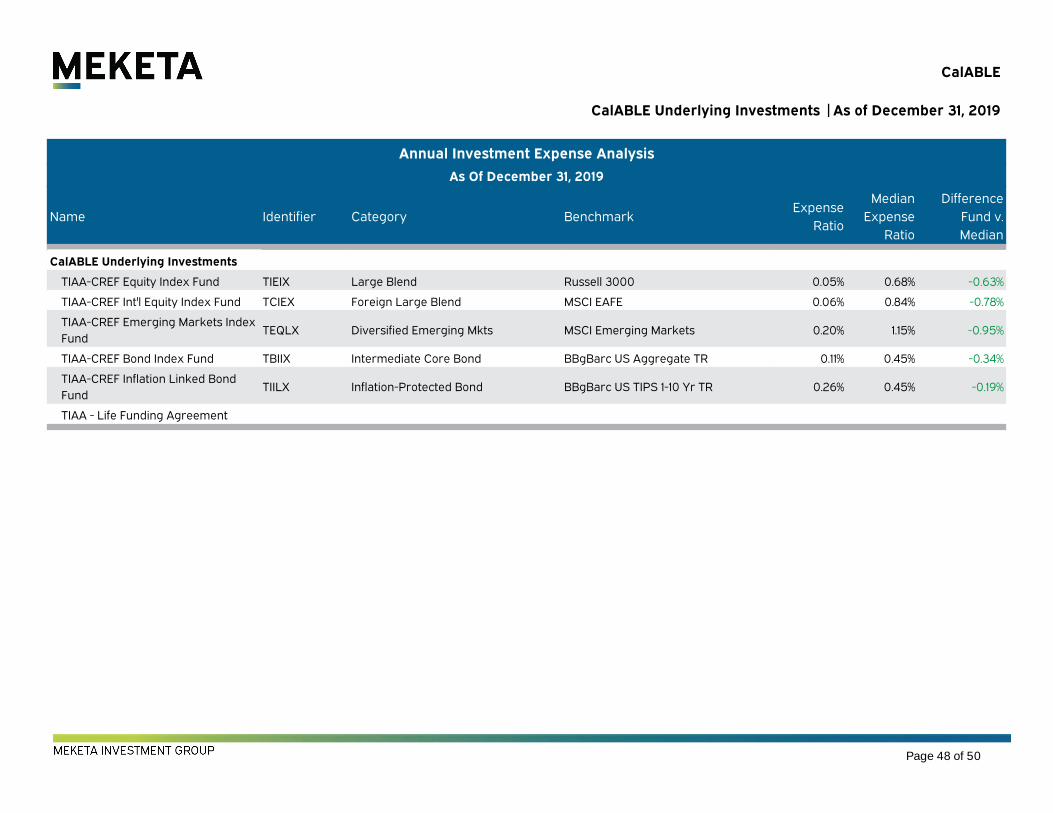
Annual Investment Expense Analysis
As Of December 31, 2019
Name Identifier Category BenchmarkExpense
Ratio
MedianExpense
Ratio
DifferenceFund v.Median
CalABLE Underlying Investments
TIAA-CREF Equity Index Fund TIEIX Large Blend Russell 3000 0.05% 0.68% -0.63%
TIAA-CREF Int'l Equity Index Fund TCIEX Foreign Large Blend MSCI EAFE 0.06% 0.84% -0.78%
TIAA-CREF Emerging Markets IndexFund
TEQLX Diversified Emerging Mkts MSCI Emerging Markets 0.20% 1.15% -0.95%
TIAA-CREF Bond Index Fund TBIIX Intermediate Core Bond BBgBarc US Aggregate TR 0.11% 0.45% -0.34%
TIAA-CREF Inflation Linked BondFund
TIILX Inflation-Protected Bond BBgBarc US TIPS 1-10 Yr TR 0.26% 0.45% -0.19%
TIAA - Life Funding AgreementXXXXX
CalABLE
CalABLE Underlying Investments |As of December 31, 2019
Page 48 of 50

Fee Schedule
Page 49 of 50

MEKETA INVESTMENT GROUP
Portfolio*
State Administrative Fee
(bps)
Estimated Underlying Investment Expenses
(bps)
Total Annual Asset-Based Fees and
Expenses
Aggressive Growth Portfolio 44 8 52
Moderate Portfolio 44 10 54
Conservative Portfolio 44 9 53
FDIC-Insured Portfolio** 44 N/A 44
Underlying Funds***Prospectus
Net ExpenseRatio (bps)
TIAA-CREF Equity Index Fund 5
TIAA-CREF Int’l Equity Index Fund 6
TIAA-CREF Emerging Markets Index Fund 20
TIAA-CREF Bond Index Fund 12
TIAA-CREF Inflation Linked Bond Fund 26
CalABLE Plans
Fee Schedule as of December 31, 2019
*Source: California’s 529A Qualified ABLE Program Disclosure Statement and Participation Agreement**Currently, the 0.44% State Administrative Fee for the FDIC-Insured Portfolio is being waived by the Board. The Board reserves the right to charge a State Administrative Fee to the FDIC-Insured Portfolio in the future to the extend that the imposition of such Fee would not result in a loss of principal for Account Owners.***Source: Morningstar, Inc.
Page 50 of 50