
March 2017 TPP - NSW Treasury · March 2017 TPP 17-03 Policy and Guidelines Paper NSW Government...
79
March 2017 TPP 17-03 Policy and Guidelines Paper NSW Government Guide to Cost-Benefit Analysis
Transcript of March 2017 TPP - NSW Treasury · March 2017 TPP 17-03 Policy and Guidelines Paper NSW Government...

March 2017
TPP 17-03
Policy and Guidelines Paper
NSW Government Guide to Cost-Benefit Analysis

NSW Government Guide to Cost-Benefit Analysis (TPP17-03) i
Preface The purpose of this Treasury policy and guidelines paper is to provide guidance and promote a consistent approach to appraisal and evaluation of public projects, programs and policies across the NSW Government. Agencies should use this NSW Government Guide to Cost-Benefit Analysis (Guide) when assessing all significant government projects, programs, policies and regulations. Cost-benefit analysis (CBA) is an evidence based method for systematically organising and presenting information to help government understand all the impacts of policies and projects, including economic, social and environmental impacts. CBA helps decision makers identify the best means to improve social welfare and assess competing proposals. This Guide provides an introductory explanation of CBA for analysts and advisors to government decision makers. The Appendices provide additional technical material and references. This Guide updates and supersedes the 2007 editions of the Treasury Policy and Guidelines Papers NSW Government Guidelines for Economic Appraisal (TPP07-5) and Economic Appraisal - Principles and Procedures Simplified (TPP07-6). Reflecting the advances made in the application of CBA, this Guide outlines many developments while retaining the underlying principles of the previous edition. To ensure its currency the Guide will be reviewed periodically. This Guide should be read in conjunction with other Treasury guidance regarding the development and submission of Business Cases, the NSW Gateway Policy, investor assurance processes and other relevant Government policy requirements. The principles of CBA are quite general and should be applied consistently. The scope of a CBA, however, will depend on the scale of the project or policy and issues may arise with individual applications. Where any such issues arise, agencies are encouraged to contact their Treasury analysts as early as possible. Agencies can also send CBA related queries to [email protected]. Caralee McLiesh Deputy Secretary NSW Treasury March 2017 Treasury Ref: TPP17-03
Note General inquiries concerning this document should be directed to your Treasury analyst in the first instance. CBA related queries can be sent to [email protected]. This publication can be accessed from the NSW Treasury website www.treasury.nsw.gov.au/
NSW Government Guide to Cost-Benefit Analysis (TPP17-03) ii
What’s new? This Treasury policy and guidelines paper updates and refreshes previous guidelines. This Guide retains the same established principles and technical approach to the appraisal and evaluation of initiatives through Cost-Benefit Analysis (CBA). The Guide, however, has been updated to reflect developments in analytical techniques that have increased in prominence over the last decade (such as non-market valuation). The Guide has also been restructured with a simplified and user friendly front section, and includes a series of technical appendices. Other changes from the previous guidelines are summarised below. CBA as the preferred method The term ‘cost-benefit analysis’ is used in this Guide and replaces what was previously referred to as ‘economic appraisal’ in the previous guidelines. The use of CBA clarifies the scope of the analysis, because a CBA should include environmental and social impacts as well as economic impacts on social welfare.
Cost-benefit analysis captures social, economic and environmental
impacts on social welfare and is the preferred method in this Guide.
This Guide also clarifies that ‘cost effectiveness analysis’ (CEA), (discussed in Appendix 8.1) should only be used as a supplementary approach to CBA because it does not assess the net impact on social welfare. CEA should be treated as a second-best option and does not substitute for CBA except in rare instances where it is not possible to estimate benefits. When to apply CBA This Guide clarifies that the CBA principles and framework apply to all Government policies and projects – not just capital expenditure. This Guide applies to any new or altered capital, recurrent or regulatory action for any policy, program, project, proposal or initiative. The terms above are used interchangeably as necessary throughout this Guide, but the overall premise is that this Guide applies to all significant Government actions and decisions.
This Guide applies to all Government actions including any new or
altered capital, recurrent or regulatory actions.
The Guide also clarifies that a CBA is required to be submitted as part of a Business Case for any new or significantly amending initiative. Submission thresholds are governed by the relevant guidelines (i.e. for capital and recurrent expenditure – the Business Case Guidelines and associated investor assurance frameworks, and for regulation – the Guide to Better Regulation). Generally, this Guide recommends that a CBA should be completed and submitted to Treasury where the following thresholds1 are met: Capital expenditure with an estimated total cost of $10 million or more, or Recurrent expenditure on a case by case basis in consultation with Treasury. A CBA is recommended for initiatives that are considered high-risk but where costs fall below the thresholds. CBA is also recommended as part of regulatory assessment processes and post-implementation evaluation. If agencies are unsure whether a CBA is required for an initiative, they should contact their Treasury analyst early for clarification.
1 Note the previous guidelines had a value threshold with an estimated total cost of $1 million.

NSW Government Guide to Cost-Benefit Analysis (TPP17-03) iii
Scope of analysis This Guide makes clear that, in terms of geographic scope, a CBA should focus on impacts (costs and benefits) to the NSW community (households, businesses, workers and/or governments).
The NSW community is the core referent group in this Guide.
To fully inform NSW decision-makers, the CBA can also include analysis of local and/or multi-jurisdictional impacts where relevant or required (for instance, by legislation). In cases where an initiative generates costs or benefits to neighbouring Australian jurisdictions, the CBA should report both: A central estimate showing costs and benefits to the NSW community, and Separate results showing any interstate costs and benefits. Discount rates The Guide now provides an explanation of the theoretical basis for the recommended social discount rate, along with empirical benchmarks to calibrate the social discount rate. The theoretical basis for the long term social discount rate in this Guide is the opportunity cost of capital. This recognises that any Government initiative can occur at the expense of other alternative public investment or private investment.
The theoretical basis for the long term social discount rate used in this
Guide is the opportunity cost of capital.
Distributional analysis This Guide provides advice on distributional analysis to help provide decision makers with information on the distributional consequences of different initiatives. The distribution of gains and losses is an important aspect of any new initiative, particularly in a reform context. The success of some reforms can hinge on having a robust understanding of the distributional impacts, as well as appropriate strategies to manage the distribution of gains and losses. Distributional analysis can be included as supplementary information in a CBA. Risk and uncertainty This Guide updates the discussion of risk and uncertainty, including drawing more explicitly the linkages between estimated benefits and costs, the identification and management of risks, and the development of scenarios and sensitivity testing. The section on risk and uncertainty also discusses some practices in aid of risk mitigation or risk management, and how these can be taken into account in a CBA. New analytical techniques This Guide acknowledges analytical approaches that are being increasingly used due to the availability of: Analytical aids (e.g. probabilistic estimation approaches such as Monte Carlo simulation), or New analytical techniques that may help to reflect the full range of costs or benefits (e.g.
application of willingness-to-pay measures to a broader range of project types). Because some analytical approaches are still evolving, this Guide provides a new appendix on validity tests of willingness to pay estimates, particularly for non-use value (Appendix 3B). The Guide also includes new appendices covering non-market valuation methods (such as benefit transfer estimates, see Appendix 3A) and practical issues in CBA (such as strategies to reduce estimation bias, see Appendix 7). Many of the other new appendices cover other aspects of analytical techniques.
NSW Government Guide to Cost-Benefit Analysis (TPP17-03) iv
Table of Contents
Preface ................................................................................................................................. i
What’s new? ........................................................................................................................ ii
1. Introduction ................................................................................................................ 1
1.1 Overview of CBA .............................................................................................. 1
1.2 Reasons for government action ........................................................................ 2
1.3 When CBA should be used ............................................................................... 3
1.4 How CBA can help decision makers ................................................................. 4
1.5 Limitations of CBA ............................................................................................ 4
1.6 How to manage CBA ........................................................................................ 4
1.7 Relationship to other guidelines ........................................................................ 5
1.8 Overview of the rest of this Guide ..................................................................... 6
2. Steps in cost-benefit analysis ..................................................................................... 7
2.1 Stating the objectives ....................................................................................... 8
2.2 Define the base case and develop options ........................................................ 9
2.3 Identify and forecast costs and benefits .......................................................... 11
2.4 Value the costs and benefits ........................................................................... 15
2.5 Identify qualitative factors and distributional impacts ....................................... 17
2.6 Assess risks and test sensitivities ................................................................... 17
2.7 Assess net benefits ........................................................................................ 18
2.8 Report the results ........................................................................................... 19
2.9 Undertake post evaluation .............................................................................. 20
Further assistance ............................................................................................................. 21
Appendix 1: Reasons for Government action ...................................................................... 22
1.1 Market failure ................................................................................................. 22
1.2 Equity objectives ............................................................................................ 26
Appendix 2: Forecasting methods and issues ..................................................................... 27
2.1 Importance of forecasting ............................................................................... 27
2.2 Forecasting methods ...................................................................................... 28
Appendix 3A: Valuation principles and methods ................................................................. 32
3.1 Valuation principles ........................................................................................ 32
3.2 Valuation methods .......................................................................................... 33
Appendix 3B: Validity tests for willingness to pay estimates ................................................ 36
3.3 Potential weaknesses of survey responses ..................................................... 36
3.4 Validity tests that should be applied ................................................................ 38
3.5 Importance of sampling and survey methodology ........................................... 40
3.6 Plausibility checks .......................................................................................... 41
NSW Government Guide to Cost-Benefit Analysis (TPP17-03) v
Appendix 4: Discount rates and decision rules .................................................................... 42
4.1 The concept of discounting ............................................................................. 42
4.2 Theoretical bases for social discount rates...................................................... 43
4.3 Empirical benchmarks to calibrate social discount rates .................................. 45
4.4 The recommended social discount rate........................................................... 45
4.5 Results and decision criteria ........................................................................... 46
Appendix 5: Dealing with risk and uncertainty ..................................................................... 48
5.1 Concepts of risk and uncertainty ..................................................................... 48
5.2 Assessing risk and uncertainty ....................................................................... 48
5.3 Considering and addressing risk in CBA ......................................................... 48
Appendix 6: Social welfare and distributional analysis ........................................................ 52
6.1 Social welfare ................................................................................................. 52
6.2 Distributional (incidence) analysis ................................................................... 53
Appendix 7: Practical issues in CBA ................................................................................... 55
7.1 Analysis period ............................................................................................... 55
7.2 Treatment of standard costs ........................................................................... 56
7.3 Treatment of willingness to pay estimates in CBA ........................................... 57
7.4 Practical valuation issues ............................................................................... 59
7.5 Items that should be excluded from a CBA ..................................................... 62
7.6 Valuation pitfalls ............................................................................................. 62
Appendix 8: Other economic appraisal methods ................................................................. 64
8.1 Cost-Effectiveness Analysis............................................................................ 64
8.2 Input-Output (Multiplier) Analysis .................................................................... 65
8.3 Computable General Equilibrium (CGE) Modelling.......................................... 66
8.4 Multi-Criteria Analysis ..................................................................................... 67
Appendix 9: Differences between CBA and Financial Appraisal .......................................... 68
9.1 Scope of a Financial Appraisal ....................................................................... 68
9.2 Differences between CBA and Financial Appraisal.......................................... 68
Appendix 10: Other Sector-Specific CBA Guidance ............................................................ 70
Glossary ............................................................................................................................ 71

NSW Government Guide to Cost-Benefit Analysis (TPP17-03) 1
1. Introduction
This Treasury policy and guidelines paper provides guidance and promotes a consistent approach to the appraisal and evaluation of projects, programs and policies across the NSW Government. Agencies should use this Guide when assessing all significant government projects, programs, policies and regulations. The terms above are used interchangeably as necessary throughout this Guide, but the overall premise is that this Guide applies to all Government actions and decisions.
1.1 Overview of CBA Cost-benefit analysis (CBA) is an appraisal and evaluation technique that estimates the economic, social and environmental costs and benefits of a project or program in monetary terms. The aim of a CBA is to measure the full impacts of any government decision or action on the households and firms in a specified community. The full impacts include any impacts on human welfare. CBA measures the change attributable to a government action, relative to a situation without the proposed action. The impacts of a government decision will typically include both costs and benefits to some members of the community. In this NSW Government CBA Guide, the referent group (i.e. reference community) is normally defined as the State of NSW. The referent group is composed of NSW firms and households, as well as the NSW Government itself. However, there may be circumstances where the relevant community could be smaller or larger in scope. To compare costs and benefits, CBA uses a monetary (dollar) metric as the most commonly used standard measurement unit. This Guide describes how non-market impacts and market impacts can be identified and valued (see Section 2.3, Appendix 3A and Appendix 3B). An important issue that may emerge is that costs and benefits often occur over time. This raises the issue of how these costs and benefits can be compared. In a CBA, these costs and benefits are generally weighted by use of a discount rate, with more weight accorded to present and near-present impacts. This Guide describes why and how this is done – see Section 2.4 and Appendix 4. Another critical issue is the identification and forecasting of the impacts. As discussed in Appendix 2, this often involves work by specialists in various fields. In some cases it may be difficult to identify or forecast all of the impacts with confidence. In these cases the CBA should draw on the available information, describe and discuss the unquantified impacts, along with an outline of data limitations and all assumptions made. Even when impacts are difficult to quantify, CBA remains a systematic and valuable method for organising information. Sensitivity analysis is a necessary part of any CBA. This is the process of testing the results of the CBA by varying key assumptions underpinning the estimates of costs and benefits. In addition, the treatment of risk and uncertainty is often a critical part of a CBA (see Appendix 5 for more details). Overall, a CBA reports whether the benefits of a proposal are likely to exceed the costs, and which option among a range of options will result in the highest net social benefit. CBA can also indicate which groups bear costs or receive benefits (see Appendix 6 for details). On this basis CBA can be used to support Government in determining the projects, programs or policies that offer the best outcome for the community. Chapter 2 outlines the steps involved in undertaking a CBA.
This Guide to Cost-Benefit Analysis (CBA) describes the role and method of CBA. CBA is evidence based, systematic and comprehensive. CBA aims to measure the full impacts of government decisions on a specified community. All significant public decisions should be supported by a CBA, including capital, recurrent or
regulatory actions. CBA helps decision makers to maximise welfare for the community. The scale and detail of the CBA will vary with the scale and significance of the decision.

NSW Government Guide to Cost-Benefit Analysis (TPP17-03) 2
1.2 Reasons for government action The two main reasons for government action are:
1. Better allocation of resources where there is a market failure, and/or 2. Promotion of equity by considering the distribution of gains and losses. With these considerations a market failure or equity rationale should be established by agencies prior to consideration of a proposal. Market failure refers to a situation where the market fails to supply a socially optimal level of a good or service (see Appendix 1.1 for further detail). To determine the need for government action, an analyst should:
Describe the nature of the market failure or reason for action Understand the magnitude of the issue Identify the parties associated with the issue. Once the need for government action is confirmed, the analyst should specify possible options to address the problem and rectify the market failure. This involves describing:
The different options, including the intended outcome and resources required How, where and when these resources will be used How the intended outcome meets the needs of the community. While market failure is a reason for action, it is not a sufficient condition. Government action can be costly and may create market distortions (for example, see Appendix 7.4 on the burden of taxation). Therefore it is also important to assess whether the expected benefits outweigh the costs imposed by action (both direct and indirect). Establishing the minimum required level of activity helps to ensure that objectives are met at the lowest cost, and may involve consultation with the community and benchmarking against similar activities in other areas. The government should act only if there is a net improvement to social welfare2. In this Guide, social welfare refers to the wellbeing of the entire society or community (in this case the people of New South Wales). Importantly, the preferences of individuals and firms are taken to be the source of value. The aim in CBA is to value outcomes as they would be valued in monetary terms by the individuals or firms who experience them. A comprehensive definition of social welfare encompasses both material living standards and quality of life for individuals. Quality of life aspects can be difficult to quantify because they tend to be non-monetary in nature, but agencies should at least acknowledge these aspects qualitatively. At an individual level this can include the physical, emotional, psychological and spiritual aspects of life. At a societal level the social, material and natural environments surrounding each individual become part of overall wellbeing. There are four relevant groups3 of NSW residents that determine incremental4 change to social welfare in a CBA:
1. Consumers 2. Producers 3. Labour 4. Government.
See Section 2.3 and Appendix 6 for further discussion on estimating impacts on these groups.
2 As outlined in Chapter 2, this includes consideration of distributional impacts and assessment of risk.
3 Typically in welfare economics, labour is included with producers. Technically, producers combine the four
factors of production (land, labour, capital and enterprise) to produce output. This Guide has split out labour to highlight that CBA is a holistic exercise that does examine impacts on workers.
4 Incremental change is measured relative to what would have happened without the government action (see
Section 2.2 for further detail).

NSW Government Guide to Cost-Benefit Analysis (TPP17-03) 3
1.3 When CBA should be used CBA is widely used to identify welfare maximising policies subject to the resource constraints imposed on governments. When there are competing policy proposals, the policies that provide net benefits are ranked from most desirable to least desirable and progressively selected according to rank until the budget is exhausted. CBA may be undertaken before or after a policy’s implementation. When conducted before (ex-ante appraisal), it is used for deciding on programs, projects or other policy changes. When completed after (ex-post evaluation) it can be used to assess whether estimates are realised, as well as provide an evidence base and reference point for future economic appraisals and policy design. A CBA is required for: All new projects, programs and policy proposals or significant changes to existing projects,
programs or policies that meet specified value thresholds as per the Business Case Guidelines, and which are funded by Government, including capital or recurrent expenditure.
All significant new and amending regulatory proposals for which the NSW Guide to Better Regulation requires consideration of the costs and benefits of a range of options, and that may not affect Government funds but could affect costs or benefits for households or business.
Post evaluation on a case by case basis as a matter of good practice. Generally, this Guide recommends that a CBA should be completed and submitted to Treasury for any new programs or changes to existing programs that meet the following value thresholds: For capital expenditure: Estimated total capital cost of $10 million or more. For recurrent expenditure: Agencies should consult their Treasury analyst, as the threshold could
have different interpretations. For example, the annual cost of an ongoing program, or the total cost of a time-limited multi-year program.
For proposals whose cost falls below the thresholds but is considered high-risk, a CBA is recommended. CBA is also recommended as part of regulatory assessment processes and post-implementation evaluation. Agencies are encouraged to consult their Treasury analyst for advice on whether a CBA is required. As a general rule, CBA is the preferred approach in assessing government initiatives because it is the most comprehensive and evidence based evaluation method. Cost Effectiveness Analysis (CEA), which is discussed in Appendix 8, may be used in rare instances where it is impossible to estimate or monetise benefits. Table 1.1: General examples of applications of Cost-Benefit Analysis
Infrastructure Social programs Recurrent expenditure Policies and regulations
Transport:
Roads, railways,
ports and airports
Health care:
hospitals,
mental health care
Public health programs;
subsidies for medicines
Environmental
regulations
Utilities:
Water supply, Power
Vocational education and
training places
Determining class sizes Safety regulations:
pharmaceuticals, foods
Communications:
Telephone, Broadband
Early childhood programs Random breath testing
for vehicle drivers
Urban planning
Environment:
Renewable energy
Emergency services and
disaster assistance
Location of government
offices
Deregulation of airlines,
taxis

NSW Government Guide to Cost-Benefit Analysis (TPP17-03) 4
1.4 How CBA can help decision makers CBA can help decision makers by: Allowing systematic comparisons of the costs and benefits of different options to maximise social
welfare. Prioritising or ranking different options to meet an objective with constrained resources. Scoping and shortlisting options in the early policy development phase. Promoting consistency in decision making and the assessment of relative priorities. Enhancing transparency by using a consistent method that allows assumptions and different
scenarios to be tested. Helping to avoid or minimise project bias – i.e. the tendency to overstate benefits or
underestimate costs. CBA is an important consideration when deciding whether to proceed with a program, project or policy. As per the list above, CBA can also be used in a variety of other situations. For example, CBA can be useful as a reference during program design and implementation, to check against intended objectives and continuously improve. For CBA to inform decision making, it should be supported by robust evidence and consider a range of options to achieve an objective. This will lower the risk that the CBA is not reduced to a compliance tool or selects evidence to justify a particular program or project.
1.5 Limitations of CBA CBA aims to quantify all benefits and costs of the specified community in monetary terms. This includes social and environmental impacts as well as economic impacts. However, it is sometimes not possible to quantify all impacts and in these cases it is important that the CBA is clear about what can and cannot be reliably quantified and valued. The remaining impacts should then be described as fully as possible, along with an assessment of risks and sensitivity tests. Critics have also raised the issue that CBA ignores equity concerns and distributional impacts. To address this, analysts should clearly set out who is impacted and to which groups of people the benefits and costs accrue (see Appendix 6). This information will help decision makers to select options based on both efficiency and equity considerations. Sometimes CBA is criticised as being too onerous and expensive in its information requirements. The complexity of a CBA, however, should reflect the complexity of the proposal, the stage of the proposal, or the public choice involved. Lastly, CBA is based on a comparison of alternative scenarios containing forecasts of what is likely to happen in the future. As a result there is inherent uncertainty – but this is a limitation of all methods of evaluation. While acknowledging its limitations, CBA is widely used as the first-best and preferred method to assess the merits of proposed government policies and public expenditure. See Appendix 8 for a description of other appraisal methods and their relative strengths and weaknesses.
1.6 How to manage CBA Conducting a CBA can be a resource-intensive process. A CBA can, however, be done quickly and refined over time. Appraisals are often iterated a number of times before proposals are implemented (or not implemented, as may be the case). Therefore the steps set out in Chapter 2 may be repeated with later steps creating a potential feedback loop. In particular, as options are developed it will usually be important to review the impact of risks, uncertainties and inherent biases more than once. This information helps to provide a reasonable understanding of whether, in the light of changing circumstances, the proposal is likely to continue to be of net social benefit.

NSW Government Guide to Cost-Benefit Analysis (TPP17-03) 5
As the stages of an assessment progress, the data should be refined to be more specific and accurate. In general, the resources engaged should be proportionate to the funds involved and the outcomes at stake. Accordingly, in the early steps of identifying and appraising options, only summary data may be required. Later in the process and before significant funds are committed, the confidence required increases and additional detail should be included. Appraisals and evaluations should be carried out collaboratively between stakeholders. Completing assessments should not be regarded as a specialist activity and therefore sidelined. Instead, agencies should consider integrating appraisals and evaluations into decision making processes and governance structures. At the start of a CBA process consideration should be given to: Availability and cost of financial and specialist resources that may be needed Possible need for quality assurance, for example, by academic experts and service providers Possibility of deferring a proposal pending further research. Some possible information sources to help with the assessment task include: Consultation with those likely to be affected Experience in other jurisdictions Experience and data held by government departments Surveys – existing or commissioned Consultants and peer reviewers Academic literature National statistics on economic and indicators. Information is a valuable asset and to inform future work, agencies should aim to establish and maintaining a library of CBA related work – including post evaluations. This can assist in minimising the potential loss of knowledge over time by building up an evidence base which will assist in future policy development.
1.7 Relationship to other guidelines Agencies should refer to other current Treasury guidance documents for information on the broader Government processes or circumstances in which this Guide must be applied, including specific requirements for Cabinet review or approval processes. Where appropriate, this Guide should be applied in the context of other current policy, review or approval requirements, including: Business Case Guidelines, which require submission of a cost-benefit analysis as part of both a
preliminary or final business case NSW Gateway Policy NSW Government Program Evaluation Guidelines NSW Guide to Better Regulation Infrastructure Investor Assurance Framework (IIAF) administered by Infrastructure NSW, as well
as other relevant investor assurance frameworks Recurrent Investor Assurance Framework Benefit Realisation Management Framework Financial Appraisal Guidelines Financial Management Transformation policies, program budgeting and legislation Any guidelines pertaining to any aspect of asset management (e.g. Capital Investment Plans,
asset maintenance or disposal) Any related guidance on budget controls Policies and procedures relating to government procurement. These documents are available on the relevant agencies’ websites.
NSW Government Guide to Cost-Benefit Analysis (TPP17-03) 6
This Guide acknowledges that individual agencies have developed their own CBA guidelines5, often jointly with Treasury. Where those agencies’ CBA guidelines are consistent with the framework and principles in this document, this Guide is not intended to replace existing agency-specific guidance. Rather, the aim of this Guide is to apply a common analytical approach across the NSW Government that will enable comparison and evaluation of Government initiatives on a ‘like-with-like’ basis. Analysts are encouraged to consult Treasury on project or portfolio specific issues. Publicly available sector-specific guidelines are listed in Appendix 10. CBA and Business Cases A CBA is an essential part of both a preliminary business case and a final business case6. The CBA of a preliminary business case would typically contain broad options and high-level or indicative costs and benefits. In some cases a proposal could be sufficiently well developed for the preliminary CBA to indicate a preferred option. The CBA is expected to be updated at subsequent stages of development of the proposal as more information comes to hand. As part of the Business Case, agencies are typically required to submit a Financial Appraisal assessing the cash flows of a project or program (see Appendix 9 for a discussion on the differences between CBA and Financial Appraisal). As a program, project or policy proposal is developed further and its estimated impacts are refined, agencies are normally expected to provide a more detailed CBA as part of the Final Business Case. This could include: More accurate cost estimates resulting from additional detailed engineering work, more definitive
project specification and design, better information about conditions of planning approval, or more detailed project scoping.
More refined benefit estimates from detailed market or service demand studies, clearer definition of target beneficiaries and stakeholder consultation plans.
1.8 Overview of the rest of this Guide Chapter 2 of this Guide outlines the steps in undertaking a CBA. Technical appendices in this Guide provide further guidance and discussion on more complex issues in CBA methodology, including: Reasons for government action Forecasting methods and issues Valuation principles, methods and validity testing Discount rates and decision rules Risk and uncertainty Social welfare concepts and distributional analysis Common practical issues Other economic appraisal methods Differences between CBA and Financial Appraisal.
5 See for example NSW Health, Capital Projects Economic Appraisal, 2011; and Transport for NSW, Principles and
Guidelines for Economic Appraisal of Transport Investment and Initiatives, 2013. 6 See NSW Treasury’s Publications page for separate guidelines for Business Cases
(http://www.treasury.nsw.gov.au/Publications_Page).

NSW Government Guide to Cost-Benefit Analysis (TPP17-03) 7
2. Steps in cost-benefit analysis
Figure 2.1 below shows the steps involved in a Cost-Benefit Analysis (CBA), to estimate the net social benefit/cost of different options. These steps should be undertaken sequentially. There are, however, important feedback loops between different steps. For example, a lack of evidence to accurately value costs and benefits (step 4) will feed into the sensitivity tests undertaken (step 6). Similarly, evidence from post evaluation (step 9) will feed into future valuations of costs and benefits (step 4). This chapter discusses each of the steps in detail. Figure 2.1: Steps in undertaking a Cost-Benefit Analysis
Step 1: State the objectives (Section 2.1)
Step 2: Define the base case and develop options (Section 2.2)
Step 3: Identify and forecast costs and benefits (Section 2.3)
Step 4: Value the costs and benefits (Section 2.4)
Step 5: Identify qualitative factors and distributional impacts (Section 2.5)
Step 6: Assess risks and test sensitivities (Section 2.6)
Step 7: Assess the net benefit (Section 2.7)
Step 8: Report the results (Section 2.8)
Step 9: Undertake post evaluation (Section 2.9)
CBA estimates the net social benefit of different proposals or options. Net social benefit equals total benefits minus total costs to the community (in present value terms).
To undertake a CBA, analysts should complete the steps outlined in this chapter.
NSW Government Guide to Cost-Benefit Analysis (TPP17-03) 8
2.1 Stating the objectives Objectives of the proposal The starting point for a CBA is to define the problem and specify the intended objectives and outcomes of the proposal. The objectives of the project or program should be stated clearly in terms of welfare outcomes (e.g. improvement in the health of the people of NSW) and outputs (e.g. the provision of health services) respectively, and not in terms of the completion of a process (e.g. to build a hospital).
The first step of CBA is to define an objective in terms of an outcome .
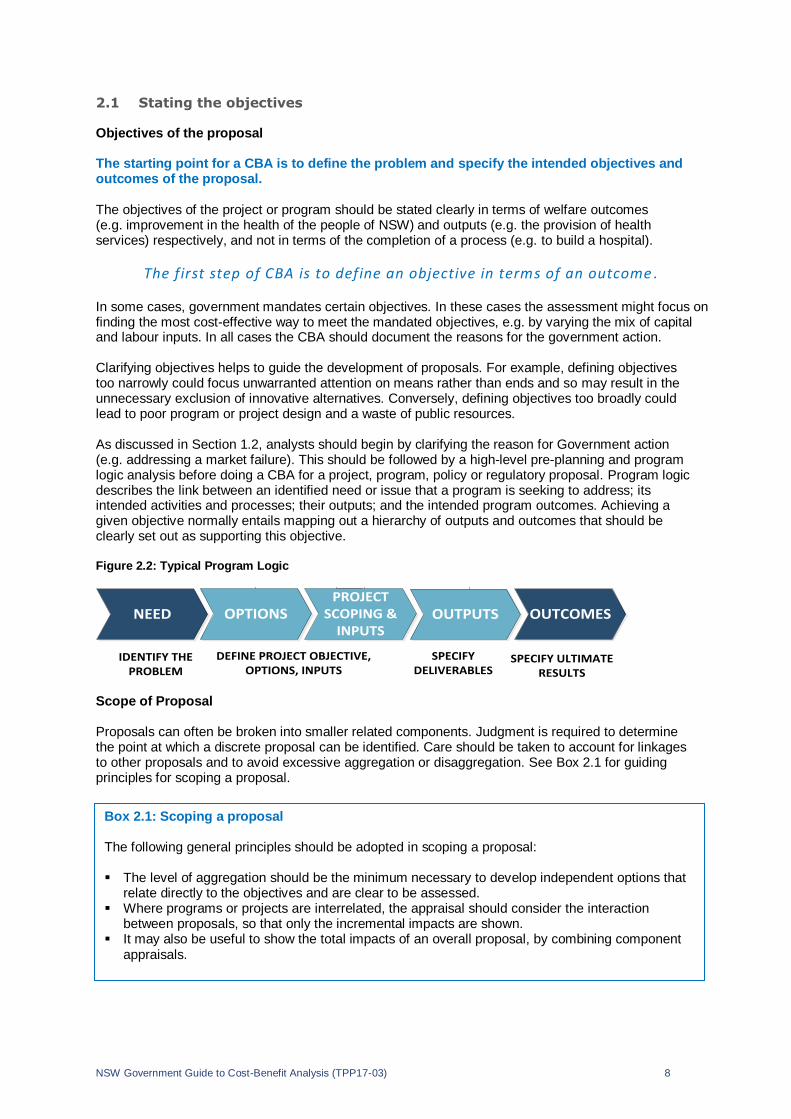
In some cases, government mandates certain objectives. In these cases the assessment might focus on finding the most cost-effective way to meet the mandated objectives, e.g. by varying the mix of capital and labour inputs. In all cases the CBA should document the reasons for the government action. Clarifying objectives helps to guide the development of proposals. For example, defining objectives too narrowly could focus unwarranted attention on means rather than ends and so may result in the unnecessary exclusion of innovative alternatives. Conversely, defining objectives too broadly could lead to poor program or project design and a waste of public resources. As discussed in Section 1.2, analysts should begin by clarifying the reason for Government action (e.g. addressing a market failure). This should be followed by a high-level pre-planning and program logic analysis before doing a CBA for a project, program, policy or regulatory proposal. Program logic describes the link between an identified need or issue that a program is seeking to address; its intended activities and processes; their outputs; and the intended program outcomes. Achieving a given objective normally entails mapping out a hierarchy of outputs and outcomes that should be clearly set out as supporting this objective. Figure 2.2: Typical Program Logic
NEED OPTIONSPROJECT
SCOPING & INPUTS
OUTPUTS OUTCOMES
IDENTIFY THE PROBLEM
DEFINE PROJECT OBJECTIVE, OPTIONS, INPUTS
SPECIFY DELIVERABLES
SPECIFY ULTIMATE RESULTS
Scope of Proposal Proposals can often be broken into smaller related components. Judgment is required to determine the point at which a discrete proposal can be identified. Care should be taken to account for linkages to other proposals and to avoid excessive aggregation or disaggregation. See Box 2.1 for guiding principles for scoping a proposal.
Box 2.1: Scoping a proposal The following general principles should be adopted in scoping a proposal: The level of aggregation should be the minimum necessary to develop independent options that
relate directly to the objectives and are clear to be assessed. Where programs or projects are interrelated, the appraisal should consider the interaction
between proposals, so that only the incremental impacts are shown. It may also be useful to show the total impacts of an overall proposal, by combining component
appraisals.
NSW Government Guide to Cost-Benefit Analysis (TPP17-03) 9
2.2 Define the base case and develop options Define the base case using the ‘with-without’ principle CBA should compare the state of the world with the proposed project, program or policy against the state of the world without the proposal. The base case is the projection of costs and benefits ‘without’ the project or program. This is different from a comparison of ‘before’ and ‘after’ conditions, which could mistakenly attribute the impact of all other pre-existing trends and external factors to the proposal. For example, a before and after comparison on the effect of a road safety campaign on crash outcomes would also capture the effect of other factors such as road network improvements. A with-without comparison would account for any road network improvements in the base case, so that CBA only considers the incremental impact of the road safety campaign. Consistent with the ‘with-without’ principle, a CBA should contain a base case to be used as a comparator to other options, as well as documentation of feasible options and a clear definition of the options assessed. The base case should be clearly defined, and is generally a ‘business as usual’ or ‘no policy change’ case, i.e. retain the status quo.
The benefits and costs of all other options are calculated relative to
the base case, i.e. the incremental change. If the costs of all options
exceed the benefits , the base case is the preferred approach.
Agencies should select a realistic base case and document the assumptions used. In general, the base case will be a ‘no policy change’ scenario (i.e. continuation of current quantity and quality of services such as planned maintenance and usage). In some cases the base case might be a ‘do nothing’ or ‘spend nothing’ scenario. In other cases the base case might entail minimum investment or effort designed to meet requirements (i.e. the ‘do minimum’ option). In the case of regulation, the base case usually assumes a no-regulation scenario, since most regulations have sunset clauses7. If agencies are unsure about how to define the base case, Treasury can provide advice. In the case of asset replacement decisions, the base case may involve deferral of replacement and continued maintenance and/or eventual replacement with a new asset of comparable standard to that being replaced. In the case of system augmentation or an expansion of policy or program activities, the base case would represent a continuation of the existing system or policies (including asset maintenance). In other cases, doing nothing (for example, continuing with a low maintenance program) may eventually result in significant cost increases, and one benefit of ‘doing something’ may be to avoid these costs. In the case of a regulatory proposal, the base case might be a continuation or a statutory termination of an existing regulation. In rare instances where the base case is highly uncertain and it is difficult to specify a plausible base case with various possible (uncertain) outcomes, it may be necessary to specify more than one base case. When defining the base case, analysts should take care to ensure that: All relevant costs are included in the base case Costs should be directly related to the current policy settings Evidence is provided for benchmarks, assumptions and forecasts that underpin the base case. See Appendix 7.1 for further discussion.
7 See Subordinate Legislation Act 1989 No 146 Schedule 2 Paragraph 1.

NSW Government Guide to Cost-Benefit Analysis (TPP17-03) 10
Where project scope has not been settled, it may be necessary to test alternative base cases in an iterative manner until a clear base case has been defined. Options Development A CBA should canvass a range of realistic options. It is not sufficient to assess only a single option. The challenge is to specify and shortlist a realistic set of alternative options to meet the policy objectives (see Box 2.2 below).
A CBA should consider a range of realistic options to achieve the
stated objective.
A range of realistic options should be identified at the earliest possible stage of the planning process. Appraisals should report on feasible options and explain cases where potential options may not have been evaluated. Where several options have been considered, the appraisal should document the process used to reduce the options to a short list. The options assessed should be carefully specified, including the scope of the proposal, implementation timetable, cross-agency impacts and capital or operational requirements, and key assumptions driving the costs and benefits. The preferred option is determined as a result of the CBA. Some examples of options include: Options for capital projects might include construction of a new asset, refurbishing existing facilities,
postponing or bringing forward an investment, demand management to reduce or avoid the capital expenditure, external maintenance, or leasing instead of owning an asset.
Options for recurrent programs might include service reduction, expansion or redesign. Options could entail different combinations of capital and labour inputs. Regulatory options could include encouraging or discouraging certain behaviours of households and
private businesses.
Where a Government proposal aims to provide goods or services on commercial terms, the CBA should provide supporting information on the options and address critical matters such as: The proposed pricing/revenue strategy – Irrespective of asset ownership (public or private), the
project or program sponsor should provide as much detail as possible on the strategy for pricing the services to be provided8.
A proposed commercial strategy to manage the asset – The CBA and the Business Case should demonstrate that the asset or facility will be used as efficiently as possible.
8 See NSW Treasury, TPP01-2: Guidelines for Pricing of User Charges, 2001 for further details.
Box 2.2: Generating options The following questions may be useful when generating options: Variations in scale or scope – could the operation be smaller, combined with other programs,
provide different service quality, use different materials, have a different design life, or entail a different method of procurement?
Demand-side measures – could existing services be better rationed using pricing or eligibility criteria?
Supply-side measures – would better training be effective? Site selection – what alternative locations are possible? Alternative time paths – could the operation be deferred or undertaken in discrete stages?
Delaying or bringing forward a project could alter the benefits and costs to the community, and alternative time paths could have different scope and delivery risks.

NSW Government Guide to Cost-Benefit Analysis (TPP17-03) 11
Iteration and Appraisal Repeated analyses will likely be needed to facilitate short listing, developing and refining possible options – especially for major expenditure proposals. In other cases staging or pilot testing prior to full roll-out of a program may be preferable. In these cases, an option could be trialled as a pilot based on a preliminary CBA, with subsequent roll-out being informed by a post evaluation of the pilot and an updated CBA of the full program. In general, the most promising groups of options may be selected initially from a range of alternatives using high level analysis, with these groups fine-tuned subsequently by further appraisal to select the best available options. Iterative analysis to refine options should take into consideration technical, legal and financial constraints. In some cases the approval process could be undertaken in stages over a long procurement period, where the CBA is progressively updated to ensure that projects are refined, and that it is still worthwhile for the project to proceed.
2.3 Identify and forecast costs and benefits
After the base case and options are established, the next step is to identify and forecast the incremental costs and benefits of each option over the life of the project relative to the base case. Ways to classify costs and benefits
To help analysts systematically identify impacts, the specific costs and benefits can be disaggregated into direct and indirect impacts, and into first and second-round impacts. Figure 2.3: Possible costs and benefits – classifying impacts
Direct impacts are primarily impacts on producers and consumers of goods or services associated with a proposed project or policy. Good and services could be a market good like electricity, or a non-market good like a public park. Producers, both public and private, bear the costs of most projects or policies. Producers may also obtain benefits from increased output or lower inputs, or both. For consumers, private use values are almost always the most important value. Use value is the amount that consumers are willing to pay for their own use of the good or service or amenity. Consumers may also attribute other values, namely option, altruistic or non-use values to certain goods or amenities. Option values occur when individuals value goods, such as hospital services, not just for their expected use but also for their possible use. Altruistic values occur when individuals are willing to pay for someone else’s use of a good or service, including use by future generations. Non-use values occur when people value a good, such as biodiversity, simply for its existence value independently of any use value. For workers, a proposed policy may impact their employment or wages. For government, direct impacts could include savings from avoided costs or revenue gains.
Direct impacts economic, social, environmental
Producers Consumers Workers Government
Indirect impacts economic, social, environmental
Third parties Related markets
Second round flow-on income and employment impacts

NSW Government Guide to Cost-Benefit Analysis (TPP17-03) 12
Indirect impacts are impacts on third parties (e.g. households or firms) not involved directly in the consumption or production of the primary good or service. There are two forms of indirect impacts. The first is impacts on third parties as a result of production or consumption usually in the primary market (see Appendix 1.1 for further discussion on externalities). For example, power generation may create damages for third parties in the form of air pollution and carbon emissions. Investment in education may create positive third party effects through reductions in crime and other anti-social behaviour. The second form of indirect impact occurs when a project or policy affects businesses in related markets. These may be complement and substitute markets of the goods and services involved in the project or program. For example, a coal mine may provide economic profits for firms supplying the mine (a complementary activity). On the other hand, investment in rail infrastructure may reduce demand for, and economic profits of, bus companies (a substitute market). An economic profit exists when revenue exceeds the opportunity costs of resources employed. Where economic profits or losses occur in a related market this is a real benefit or cost of a project or policy, which is captured in a CBA. Economic profit includes the opportunity costs associated with production and is therefore lower than accounting profit. For example, if a local business has annual revenue of $100,000, annual business costs of $50,000, and the owner could earn $50,000 from employment elsewhere in the labour market (i.e. the opportunity cost of the owner’s labour), the economic profit is zero whereas the accounting profit is $50,000. The second major distinction is between first and second-round effects. For example, a project creating benefits of $10 million of income, the expenditure of this income may in turn generate further employment and income which could be described as secondary benefits. As a general practice secondary benefits are not included in a CBA. The major reason is that the expenditure incurred to create this $10 million of income could have been spent on an alternative project or simply given away as a transfer payment. This counterfactual expenditure could also have created a flow-on impact on income. It would be incorrect to attribute a flow-on (multiplier) income benefit to the project and to ignore the possible flow-on effects of expenditure on an alternative project. The general valuation principle is that all first round impacts should be valued as changes relative to the base case regardless of whether the impacts are direct or indirect. The second-round flow-on or multiplier effects are generally not included in CBA. Table 2.1: Examples of costs and benefits in road and education projects
Roads Education
Costs Benefits Costs Benefits
Direct Impacts Construction costs
Maintenance costs
Savings in travel time, vehicle costs, and accidents by firms and households using the improved or new road
Costs to government of supplying education
Student costs: income forgone and out-of-pocket expenses
Benefits to students: productivity and future earnings
Indirect
Impacts
Noise, air pollution and lower amenity around new road
Savings in travel time, vehicle costs, and accidents on other roads
Lower noise and improved amenity around other roads
Displacement of existing workers
Benefits to employers (higher productivity)
Reductions in crime and other social costs
NSW Government Guide to Cost-Benefit Analysis (TPP17-03) 13
CBA should itemise major costs and benefits that can be identified and quantified. Where measurement is not possible, such effects could be described in qualitative terms.
Direct and indirect first round impacts should be identified and,
where possible, forecast in a CBA.
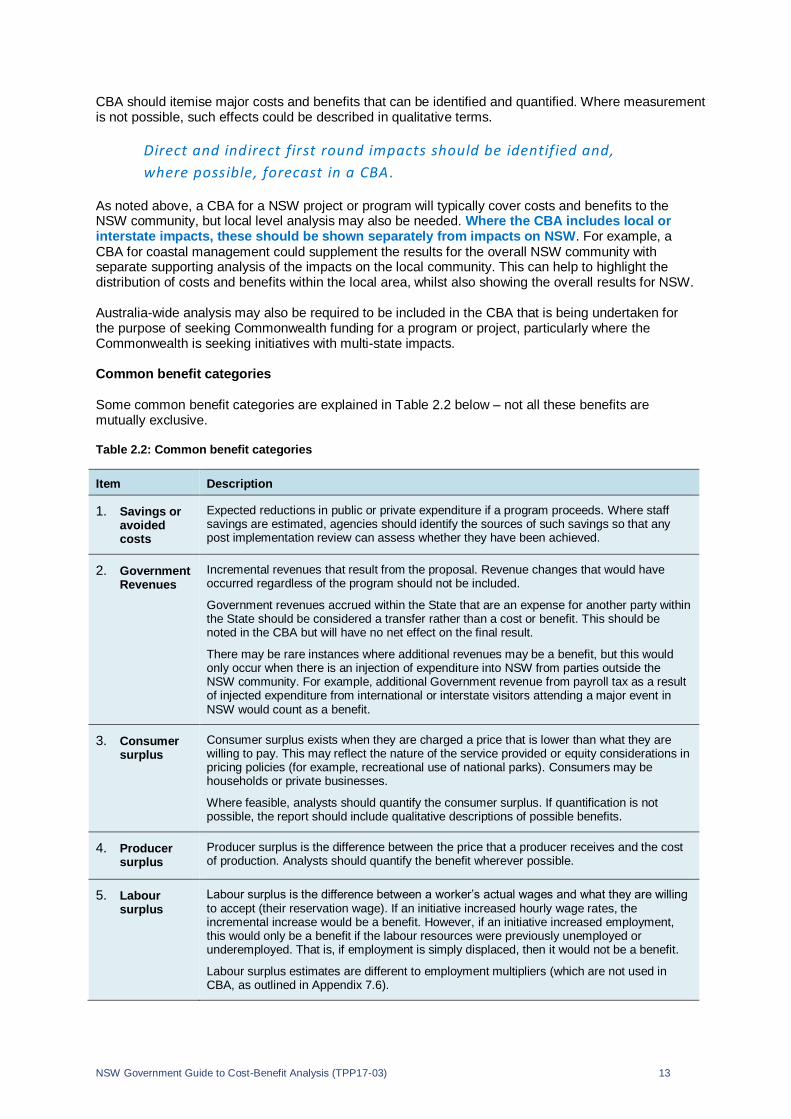
As noted above, a CBA for a NSW project or program will typically cover costs and benefits to the NSW community, but local level analysis may also be needed. Where the CBA includes local or interstate impacts, these should be shown separately from impacts on NSW. For example, a CBA for coastal management could supplement the results for the overall NSW community with separate supporting analysis of the impacts on the local community. This can help to highlight the distribution of costs and benefits within the local area, whilst also showing the overall results for NSW. Australia-wide analysis may also be required to be included in the CBA that is being undertaken for the purpose of seeking Commonwealth funding for a program or project, particularly where the Commonwealth is seeking initiatives with multi-state impacts. Common benefit categories Some common benefit categories are explained in Table 2.2 below – not all these benefits are mutually exclusive. Table 2.2: Common benefit categories
Item Description
1. Savings or avoided costs
Expected reductions in public or private expenditure if a program proceeds. Where staff savings are estimated, agencies should identify the sources of such savings so that any post implementation review can assess whether they have been achieved.
2. Government Revenues
Incremental revenues that result from the proposal. Revenue changes that would have occurred regardless of the program should not be included.
Government revenues accrued within the State that are an expense for another party within the State should be considered a transfer rather than a cost or benefit. This should be noted in the CBA but will have no net effect on the final result.
There may be rare instances where additional revenues may be a benefit, but this would only occur when there is an injection of expenditure into NSW from parties outside the NSW community. For example, additional Government revenue from payroll tax as a result of injected expenditure from international or interstate visitors attending a major event in NSW would count as a benefit.
3. Consumer surplus
Consumer surplus exists when they are charged a price that is lower than what they are willing to pay. This may reflect the nature of the service provided or equity considerations in pricing policies (for example, recreational use of national parks). Consumers may be households or private businesses.
Where feasible, analysts should quantify the consumer surplus. If quantification is not possible, the report should include qualitative descriptions of possible benefits.
4. Producer surplus
Producer surplus is the difference between the price that a producer receives and the cost of production. Analysts should quantify the benefit wherever possible.
5. Labour surplus
Labour surplus is the difference between a worker’s actual wages and what they are willing to accept (their reservation wage). If an initiative increased hourly wage rates, the incremental increase would be a benefit. However, if an initiative increased employment, this would only be a benefit if the labour resources were previously unemployed or underemployed. That is, if employment is simply displaced, then it would not be a benefit.
Labour surplus estimates are different to employment multipliers (which are not used in CBA, as outlined in Appendix 7.6).

NSW Government Guide to Cost-Benefit Analysis (TPP17-03) 14
6. Benefits to the broader community
Benefits of public services (such as police, health and education services) flow to the community as a whole as well as to individual consumers or private businesses. ‘Positive externalities’ refer to activities that may have beneficial third party effects on groups or industries other than the direct recipient of the service. (For example, urban public transport can generate lower pollution levels than private cars). Where the price charged for a public service does not reflect the benefits received, alternative means of valuing the benefits must be developed.
Where the government initiative relates to regulation, the benefits may include:
Improvements in product and service quality Improvements in public health and worker safety Improvements in environmental amenity Reductions in compliance costs for businesses, and/or Reductions in administrative costs for government. Common costs categories In a similar way to benefits, costs can be classified according to type of impact or stakeholder group.
Examples of capital costs include:
Capital costs on new assets Capital costs of asset replacements Major periodic maintenance or refurbishment costs. Examples of recurrent costs9 include:
Agency salaries and wages and labour on-costs Accommodation expenses Operating and maintenance costs, including subcontracted external labour or rented capital. Examples of costs of regulatory proposals include:
Administrative and compliance costs for regulated entities The cost to Government to administer the regulation Reduced consumer surplus from restrictions on competition Reduced choice of goods and services Restrictions on innovation The impact of delays. Examples of other costs include:
Negative externalities – Third party costs on the community or groups within it. Where this occurs, attempts should be made to identify and value these costs. Examples of third party (externality) costs include noise, congestion, pollution, and reduction in visual amenity.
Ancillary costs – This could include, for example, costs of remediation, relocation, temporary accommodation and other disruption costs which may not be part of the program or project itself, but will need to be incurred to enable the project to proceed.
Both benefits and costs should cover the life of the project, program or policy (see Box 2.3 below). For further guidance on evaluation periods, see Appendix 7.1.
9 See NSW Treasury,TPP07-3: Service Costing in General Government Sector Agencies, 2007 for further details on costings.

NSW Government Guide to Cost-Benefit Analysis (TPP17-03) 15
Forecasting impacts When estimating costs and benefits, a clear distinction should be drawn between: Forecasting volume impacts – For instance, change in the number of passenger trips, social
housing tenants, working age population and so on, who benefit from (or bear the costs of) a proposal.
Placing a dollar value per unit of volume on the costs or benefits of the proposal (see Section 2.4 following).
Volume impacts can be forecast using a variety of techniques and approaches depending upon the data available and the unique characteristics of the proposal (see Appendix 2 for further discussion on forecasting methods and issues). For example, estimates of costs for infrastructure projects require forecasts of the quantities of resources involved such as land, labour, material and capital. Similarly, forecasts of operating costs will be a function of the scale of operations. In principle these forecasts are quite straightforward. However, capital and operating cost estimates are often sensitive to project design and technology which may change as the project matures, and to physical conditions encountered. Additional technical expertise may be required to forecast project outcomes and behaviour changes, for example, a potential reduction in water quality or increased usage of a toll road. This work is often undertaken by subject specialists including epidemiologists, criminologists, environmental experts or traffic modellers. An independent peer review is highly recommended given the specialist nature of this work.
2.4 Value the costs and benefits The starting point for valuation is establishing a standard unit of measure. The most commonly used measure is a unit of local currency in present day prices (known as “real prices”). Increases in prices due to inflation or other sources of cost escalation should not be included in the values of future benefits and costs. The present values of the cost and benefit streams should then be calculated. This is calculated using a real discount rate of 7 per cent. Further information on discount rates is provided in Appendix 4.
The stream of costs and benefits expressed in real terms should be
discounted by a real discount rate of 7 per cent.
In some cases real costs and benefits can be adjusted for changes in relative values where a specific input or output price is expected to move at a rate significantly different from the general inflation rate. In such cases the CBA should document the assumptions used.
Box 2.3: Period of analysis
The following questions may be useful when generating options:
For capital expenditure, such as roads and bridges, this will vary with the economic life of the asset (typically ten years or more, depending on the type of asset), and the associated recurrent costs should be included using life cycle costing principles for the overall assessment.
For mainly recurrent expenditure, such as schools and hospitals, this could be (a) the life of the program, if the program has a termination date; or (b) the annual cost, if the program is ongoing, with any related capital costs to be included.
For externalities, such as pollution and knowledge spill-overs, this will be the duration of the analysis period.
For regulation, such as environmental and sanitary regulations, this may be the time until legislation is next reviewed (generally five to ten years), or longer depending on the proposal.
NSW Government Guide to Cost-Benefit Analysis (TPP17-03) 16
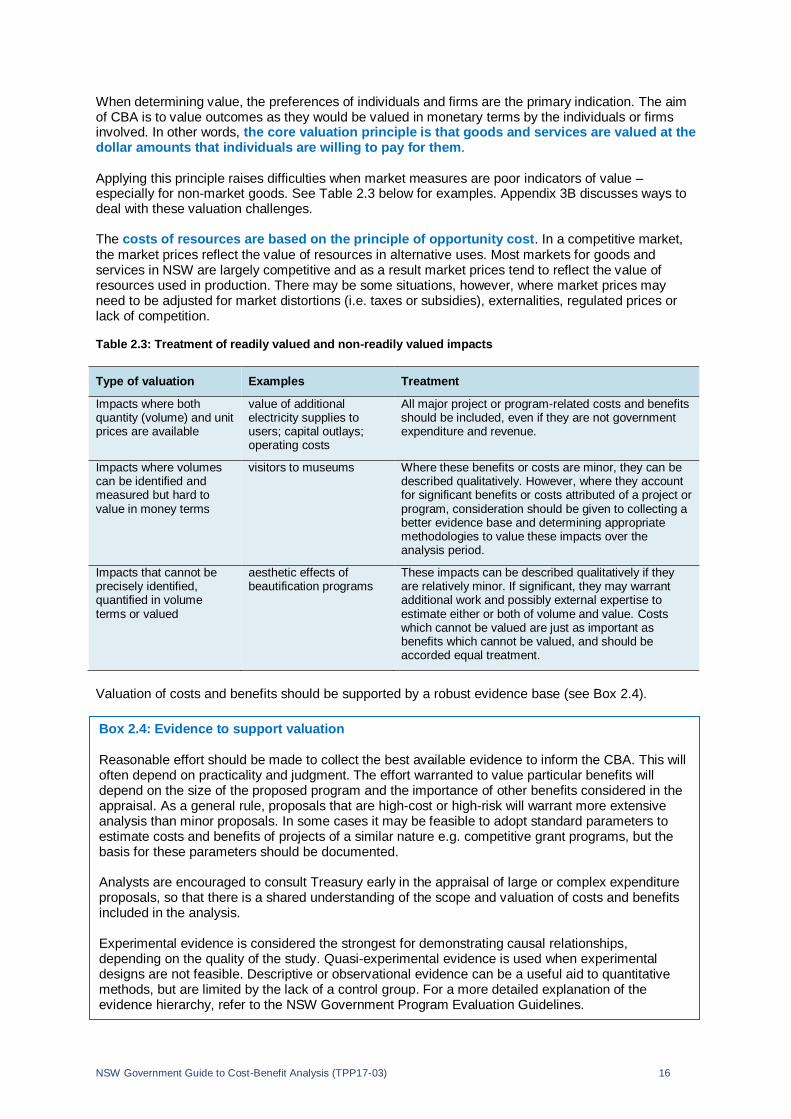
When determining value, the preferences of individuals and firms are the primary indication. The aim of CBA is to value outcomes as they would be valued in monetary terms by the individuals or firms involved. In other words, the core valuation principle is that goods and services are valued at the dollar amounts that individuals are willing to pay for them. Applying this principle raises difficulties when market measures are poor indicators of value – especially for non-market goods. See Table 2.3 below for examples. Appendix 3B discusses ways to deal with these valuation challenges. The costs of resources are based on the principle of opportunity cost. In a competitive market, the market prices reflect the value of resources in alternative uses. Most markets for goods and services in NSW are largely competitive and as a result market prices tend to reflect the value of resources used in production. There may be some situations, however, where market prices may need to be adjusted for market distortions (i.e. taxes or subsidies), externalities, regulated prices or lack of competition. Table 2.3: Treatment of readily valued and non-readily valued impacts
Type of valuation Examples Treatment
Impacts where both quantity (volume) and unit prices are available
value of additional electricity supplies to users; capital outlays; operating costs
All major project or program-related costs and benefits should be included, even if they are not government expenditure and revenue.
Impacts where volumes can be identified and measured but hard to value in money terms
visitors to museums Where these benefits or costs are minor, they can be described qualitatively. However, where they account for significant benefits or costs attributed of a project or program, consideration should be given to collecting a better evidence base and determining appropriate methodologies to value these impacts over the analysis period.
Impacts that cannot be precisely identified, quantified in volume terms or valued
aesthetic effects of beautification programs
These impacts can be described qualitatively if they are relatively minor. If significant, they may warrant additional work and possibly external expertise to estimate either or both of volume and value. Costs which cannot be valued are just as important as benefits which cannot be valued, and should be accorded equal treatment.
Valuation of costs and benefits should be supported by a robust evidence base (see Box 2.4).
Box 2.4: Evidence to support valuation Reasonable effort should be made to collect the best available evidence to inform the CBA. This will often depend on practicality and judgment. The effort warranted to value particular benefits will depend on the size of the proposed program and the importance of other benefits considered in the appraisal. As a general rule, proposals that are high-cost or high-risk will warrant more extensive analysis than minor proposals. In some cases it may be feasible to adopt standard parameters to estimate costs and benefits of projects of a similar nature e.g. competitive grant programs, but the basis for these parameters should be documented. Analysts are encouraged to consult Treasury early in the appraisal of large or complex expenditure proposals, so that there is a shared understanding of the scope and valuation of costs and benefits included in the analysis. Experimental evidence is considered the strongest for demonstrating causal relationships, depending on the quality of the study. Quasi-experimental evidence is used when experimental designs are not feasible. Descriptive or observational evidence can be a useful aid to quantitative methods, but are limited by the lack of a control group. For a more detailed explanation of the evidence hierarchy, refer to the NSW Government Program Evaluation Guidelines.

NSW Government Guide to Cost-Benefit Analysis (TPP17-03) 17
2.5 Identify qualitative factors and distributional impacts The quantifiable costs and benefits are the main part of a CBA but in some cases quantification may not be practical. Impacts that cannot be quantified should be accounted for qualitatively. A list of qualitative factors may be included in the CBA to inform decision makers (such as the direction of impact, likely significance and so on). These factors should be presented without subjective formal weightings. The distribution of gains and losses is an important aspect of any new initiative, particularly in a reform context. The success of some reforms can hinge on having a robust understanding of the distributional impacts, as well as appropriate strategies to manage the distribution of gains and losses. Distributional analysis can be included as supplementary information in a CBA. Box 2.5 provides an example of how distributional analysis can help to promote equity by highlighting gains and losses. Appendix 6 provides further information.
Analysis of impacts by stakeholder groups (e.g. by high or low income group) can help assessment of distributional impacts, provided that offsetting benefits (costs) between groups are clearly identified and netted off in calculating net present value or benefit-cost ratios. Any data limitations should be outlined.
To be holistic, a CBA should present qualitative factors and
systematic distributional analysis.
Wherever relevant, distributional impacts should be included in a CBA. It is particularly important that distributional analysis is undertaken in a systematic way and presented with any relevant limitations being fully acknowledged. The distribution of benefits among beneficiaries can inform many decisions, such as determining who should pay the costs of the project, program or regulation. Where distributional impacts are reported, transfers between groups of beneficiaries should be taken into account to avoid double-counting.
2.6 Assess risks and test sensitivities It is possible to plan for risks and reduce or manage them. Risks can be identified and managed by: Mapping the steps in project delivery and the chain of project or program impacts leading to the
generation of certain costs and benefits Identifying and valuing salient risks Undertaking post implementation evaluations or using studies from similar projects Applying risk management techniques in the design and development of the project or program. Mapping impacts can help identify and value risks more accurately; inform the selection of project options and the identification and valuation of costs and benefits in the CBA, including the choice of sensitivity tests; and help the agency to develop relevant risk management strategies.
Box 2.5: Distributional impacts The introduction of a real-time road-pricing regime could potentially reduce congestion on the roads network, the costs and benefits of which can be measured using CBA. Given the varying travel requirements of individual households and businesses, the benefits of a road pricing regime may not be evenly distributed. Although most road users would be likely to benefit from faster travel times, households with less flexible travel requirements might incur greater relative costs. These distributional impacts, despite being transfers from one NSW party to another, can be usefully highlighted in CBA. Even if the project has a positive NPV, the costs imposed on low income groups may highlight the need for mechanisms that manage the distribution of gains and losses more equitably (such as concessions). Appendix 6 provides further detail on the main steps in conducting distributional analysis.

NSW Government Guide to Cost-Benefit Analysis (TPP17-03) 18
The degree of detail in identifying and assessing risks will depend on the nature of the government action, including the variety of stakeholders involved. For example, smaller-scale initiatives may require testing against a sufficient contingency allowance, based on costs incurred in previous similar programs. At the other extreme, large complex projects may require significant investment in legal, commercial or technical engineering work to identify and value risks and provide adequate risk mitigation strategies. In recent years probabilistic modelling techniques have been developed that enable the modelling of complex or interrelated (e.g. sequential or conditional) risks which would be appropriate for high-value high-risk investments (see Appendix 5 for more details on dealing with risk and uncertainty). Sensitivity Testing CBA should always test the sensitivity of results to key risks or changes in key assumptions or parameters. Analysts should assess possible outcomes of a CBA under alternative scenarios and present these based on expected mean (average) costs and benefits. The purpose of sensitivity testing is to assess the robustness of the proposal to movements (up/down or positive/negative) in the variables that determine its viability, such as demand or population growth forecasts. Sensitivity testing should be informed by the key risks identified and how these affect the costs and benefits of the proposal. This should include identifying key dependencies between different elements of an initiative to help construct realistic upside and downside scenarios. One option might produce the highest Net Present Value (NPV) or Benefit Cost Ratio (BCR) under certain assumptions but produce poor results under other assumptions. Another option may produce satisfactory results under all sets of assumptions and could be considered the preferred solution. Where proposals offer various rates of return and risks and there is a trade-off between possible higher net benefits and higher risk, decision makers can decide how much risk to accept. Analysts should specify a realistic range of possible values for the major cost or benefit variables that could most significantly affect the project or program outcome.
Sensitivity testing should be undertaken on assumptions and inputs.
Tests should be linked to key risks and scenarios.
Lastly, key assumptions and inputs may not necessarily move in isolation. Sensitivity analysis can be done on key variables moving at the same time. For some projects or programs, sensitivity testing could include scenarios using alternative valuation methods. As a general rule, analysts should select and report on those assumptions for sensitivity testing that are plausible and that are designed to help identify and manage the most important risks for the project or program or regulation.
2.7 Assess net benefits The aim of CBA is to summarise the full impacts of a project or policy. To achieve this, costs and benefits for all individuals or businesses within the specified community are aggregated into an overall measure of net social benefit. To allow for costs and benefits occurring at different times, CBA uses the concept of present value – where future costs and benefits are discounted. As detailed in Appendix 4, discounting reflects the view that a dollar received in the future is worth less than a dollar today. Present values allow for decisions to be made in the present about initiatives that have costs and benefits in the future. At a minimum, the following measures should be calculated for each option in the CBA report: NPV – The difference between the present value of benefits and the present value of costs. BCR – The ratio of the present value of total benefits to the present value of total costs.

NSW Government Guide to Cost-Benefit Analysis (TPP17-03) 19
The NPV and BCR both show, for a given discount rate, when the benefits exceed the costs of an initiative. An initiative is potentially worthwhile if the NPV is positive or the BCR is greater than 1.00. This is because the present value of benefits is greater than the present value of costs, indicating that the initiative is increasing overall welfare. Whether an initiative is worthwhile, however, will also depend on how it compares against the costs and benefits of other initiatives. Appendix 4 provides further detail about the NPV and BCR, including how to use the results to rank different initiatives.
A CBA shows the social benefit of an init iative is shown through the
NPV and BCR.
The results of other decision criteria may also be reported in the CBA if they are of interest to some agencies or decision makers, but these do not substitute for the NPV and BCR.
2.8 Report the results A CBA report should include the following key information: The preferred measures of the net social benefit of a project or program:
NPV
BCR. The central value of these two measures, as well as the range of these measures based on key sensitivities, should be reported.
A clear and concise summary of the base case, the options assessed and the main results of the sensitivity tests. The summary should focus on major differences between the options.
A summary table showing key categories of benefits and costs in the base case, the options assessed, and the dollar values and percentage contribution of each benefit (cost) to total benefits (costs) in each option, relative to the base case.
All critical assumptions should be made explicit and be supported by evidence. This includes
transparency of the key drivers, inputs, risks and assumptions used in constructing the base case and the options considered. Examples of key assumptions include demand growth and its components (e.g. population growth, any changes in usage of the service).
The NPV and BCR should be reported upfront for each of the options
assessed alongside the key cost and benefit categories, key
assumptions, sensitivity tests and distributional impacts.
In most cases benefits will focus on use benefits (derived from the provision of a Government asset or service). This Guide specifies the circumstances under which non-use benefits should be included in the central estimate. In all cases the benefit estimates, particularly non-use benefits, should be subject to appropriate validity and reliability tests that are documented in the CBA.
In general, impacts in the state of NSW should comprise the central estimate. Separate scenarios
can show any local impacts and interstate impacts, respectively (see Box 2.6). For example, in cases where a Government proposal generates costs or benefits affecting neighbouring Australian jurisdictions, the central estimate should only include impacts to the NSW community and a separate scenario can include the impacts on neighbouring jurisdictions.
Sensitivity analysis based on key dependencies identified should be conducted on the key
assumptions and inputs. For example, there might be some uncertainty around usage forecasts (such as those from traffic modelling), highlighting the importance of testing the sensitivity of results to different usage assumptions. This may also include separate upside and downside scenarios. For example, wider economic impacts and land value uplift estimates should be excluded from the central estimate and treated as an upside scenario.

NSW Government Guide to Cost-Benefit Analysis (TPP17-03) 20
Where possible, the distribution of benefits or costs among different groups should be presented to decision makers in a systematic way. This should include a summary of the distributional impacts noting any transfers between different groups.
The CBA report should be transparent, verifiable and comprehensive, but not excessively long.
2.9 Undertake post evaluation In line with NSW Government Program Evaluation Guidelines
10, major programs undertaken by
NSW government agencies are expected to be evaluated at an appropriate point in their life cycle. The most comprehensive form of evaluation includes process, outcome and economic evaluation. Cost benefit analysis is the preferred approach for economic evaluation. Ex-post economic evaluation of projects and programs should be conducted when an outcome evaluation has been completed. Economic evaluation should be undertaken to:
Assess the ex-post benefits and costs. Where an ex-ante economic appraisal has been completed, it is important to assess whether the associated assumptions and estimated costs and benefits are realised in practice. There should be an ongoing feedback process between the findings of the economic evaluation and the assumptions and approach used for new program proposals and policy development. Where no ex-ante economic appraisal has been completed, outcome data will inform the benefit analysis and cost data will need to be collected. The assumptions for the CBA will need to be developed and clearly defined.
Post evaluation yields a more rigorous evidence base as a reference for future CBAs. A post evaluation identifies and quantifies benefits and costs over a certain period of program operation to assess whether the anticipated benefits were realised, whether the forecast costs were accurate, and the reasons for any deviations.
Inform the ongoing management of assets and continuous program improvement.
Agencies should examine the project or program design and implementation through a process evaluation to assess the scope for improvement, particularly if the outcome evaluation identifies gaps in the achievement of outcomes. In addition, economic evaluation should be used to ensure that the program still delivers the highest net social benefit compared with other alternatives to achieve the same outcomes.
Post evaluation is crucial to build the evidence base for future CBAs .
For capital projects or programs, a clear distinction should be drawn between broad strategic asset management reviews and in-depth post implementation evaluations of specific projects or programs. Major ongoing programs that involve a series of smaller projects should also be evaluated.
10
NSW Department of Premier and Cabinet, NSW Government Program Evaluation Guidelines. 2016,
http://www.dpc.nsw.gov.au/__data/assets/pdf_file/0009/155844/NSW_Government_Program_Evaluation_Guidelines.pdf
Box 2.6: Cross-border costs and benefits In cases where a Government proposal generates costs or benefits affecting neighbouring Australian jurisdictions, the CBA should report both: A central estimate showing costs and benefits to the NSW community, and Separate results showing interstate costs and benefits. Separately showing results with and without interstate users may be important to inform decisions. For example, transparent reporting of these results can assist in any decisions on cross-border charges for non-NSW users.

NSW Government Guide to Cost-Benefit Analysis (TPP17-03) 21
Timing of post evaluation A post evaluation should be undertaken once the project or program is fully operational and sufficient information is available to assess whether intended program outcomes have been achieved. Selection and ranking of evaluations should be guided by government priorities and take into account the need for evaluation information to inform policy development, program refinement and decision making. Practical constraints must be taken into account in the timing of evaluations. These constraints and challenges may include small sample sizes, difficulties attributing observed change to the program or project being evaluated, or limitations of available data to effectively measure change. Analysts should therefore aim to develop sound evaluation plans early in the program design, including provision of funding to undertake post implementation evaluation. This will help identify useful indicators that can be feasibly collected, both for periodic monitoring over the life of the program and for post evaluation at the end of the program. In other words, the capacity to collect information for post evaluation ideally should be built into the design of ongoing monitoring mechanisms for the program. Similarly, regulatory initiatives should be subject to review after they have been in operation for a sufficient number of years. Major pieces of legislation normally include a requirement for periodic review (usually five years) and evaluation timing could be aligned to this review timeframe. For large or complex programs, a detailed post evaluation may be needed to assess whether processes were followed, to examine whether program outcomes were met, and to recommend improvements to future programs. The evaluation of large complex or risky programs should be as rigorous as possible, applying full ex-post cost-benefit analysis and empirical measurement of program or project outcomes wherever feasible. These evaluations should aim to replicate the initial appraisal - applying actual values of costs or benefits as they were realised. This will allow comparisons of expected with actual costs and benefits. Post evaluation should ideally aim to measure marginal costs and benefits, and should aim to collect valid and reliable data to inform the measurement of outcomes. The decision about when to undertake post evaluation should also consider other assessment processes completed or underway. Review, audit and research are some of the types of assessments which might be conducted. These other assessment processes may reveal secondary data that could inform post evaluation CBA. The post implementation evaluation is best undertaken by someone with relevant technical and evaluation expertise, for example the economics or evaluation unit of an agency. Where possible and before finalisation, some form of peer review should be undertaken of the methodology and the completed CBA.
Further assistance Agencies are encouraged to contact their Treasury analysts early to work through any issues or queries. Agencies can also send CBA related queries to [email protected].

NSW Government Guide to Cost-Benefit Analysis (TPP17-03) 22
Appendix 1: Reasons for Government action
1.1 Market failure All markets feature a degree of imperfection. Market failure refers to a situation where the market does not deliver an efficient outcome which generally occurs in cases where private incentives are not aligned with the broader interests of society as a whole. There are four main types of market failure, which are discussed below and depicted in Figure A1.1.Understanding the cause of any given case of market failure is important for identifying effective responses and determining whether government action is warranted Pareto efficiency is achieved when nobody can be made better off without someone else being made worse off (see Appendix 6.1). Standard economic theory assumes that individuals always behave in their best interests, but in practice this is not always the case11. Figure A1.1: Market failure categories12
11 See for example, Kahneman, D, Thinking, Fast and Slow. New York, Farrar, Straus and Giroux, 2011.
12 Based on Appendix A of the forthcoming NSW Department of Industry, Skills and Regional Development’s Market Failure
Guide – A guide of categorising market failures for government policy development and evaluation.
Market failure Nature of the
good
Public good
Externalities
Nature of the market
Market power
Availability of information
Imperfect information
This appendix outlines the reasons for Government action: Analysts should consider the reasons for government action before conducting a CBA. The two main reasons for government action are when the market cannot deliver a socially
optimal outcome on its own and to support less well-off members of the community. The main types of market failure are public goods, externalities, market power and imperfect
information. Because government action has costs, action should only be taken if there is a net
improvement to social welfare i.e. an improvement in the wellbeing of the relevant community.
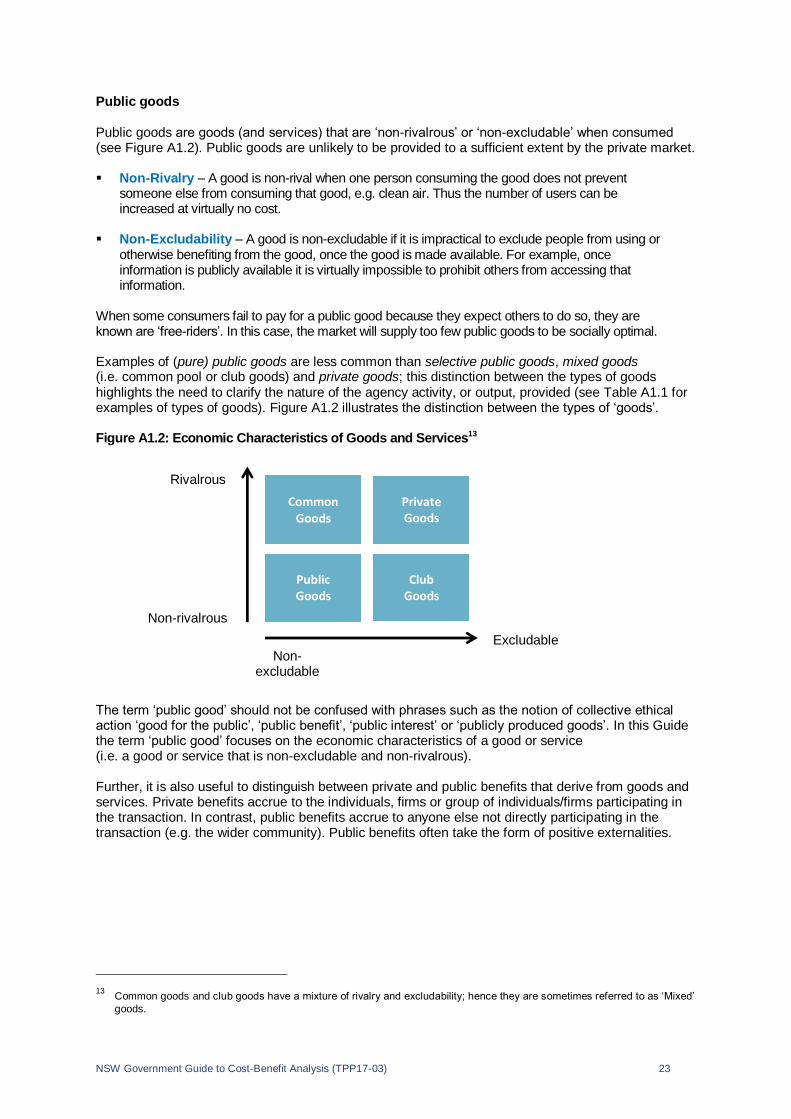
NSW Government Guide to Cost-Benefit Analysis (TPP17-03) 23
Public goods Public goods are goods (and services) that are ‘non-rivalrous’ or ‘non-excludable’ when consumed (see Figure A1.2). Public goods are unlikely to be provided to a sufficient extent by the private market. Non-Rivalry – A good is non-rival when one person consuming the good does not prevent
someone else from consuming that good, e.g. clean air. Thus the number of users can be increased at virtually no cost.
Non-Excludability – A good is non-excludable if it is impractical to exclude people from using or otherwise benefiting from the good, once the good is made available. For example, once information is publicly available it is virtually impossible to prohibit others from accessing that information.
When some consumers fail to pay for a public good because they expect others to do so, they are known are ‘free-riders’. In this case, the market will supply too few public goods to be socially optimal. Examples of (pure) public goods are less common than selective public goods, mixed goods (i.e. common pool or club goods) and private goods; this distinction between the types of goods highlights the need to clarify the nature of the agency activity, or output, provided (see Table A1.1 for examples of types of goods). Figure A1.2 illustrates the distinction between the types of ‘goods’. Figure A1.2: Economic Characteristics of Goods and Services13
The term ‘public good’ should not be confused with phrases such as the notion of collective ethical action ‘good for the public’, ‘public benefit’, ‘public interest’ or ‘publicly produced goods’. In this Guide the term ‘public good’ focuses on the economic characteristics of a good or service (i.e. a good or service that is non-excludable and non-rivalrous). Further, it is also useful to distinguish between private and public benefits that derive from goods and services. Private benefits accrue to the individuals, firms or group of individuals/firms participating in the transaction. In contrast, public benefits accrue to anyone else not directly participating in the transaction (e.g. the wider community). Public benefits often take the form of positive externalities.
13 Common goods and club goods have a mixture of rivalry and excludability; hence they are sometimes referred to as ‘Mixed’
goods.
Rivalrous
Non-rivalrous
Excludable
Non- excludable
Common Goods
Private Goods
Public Goods
Club Goods

NSW Government Guide to Cost-Benefit Analysis (TPP17-03) 24
Table A1.1: Types of goods and services
Description Examples
‘Pure’ public goods
Are non-rivalrous in consumption, which means any party can use the good without reducing another party’s enjoyment; and are non-excludable, which means it is not efficient to prevent access to the good once it is provided.
Some ‘selective’ public goods may only display these characteristics at a local level.
National defence.
Clean air.
Basic research.
Mixed goods (club goods and common goods):
Mixed goods are neither exclusively private nor public, but may have attributes of both, for example:
A good may be non-rivalrous in consumption but excludable in use, or
A good may be rivalrous in consumption but non-excludable in use.
Club goods can be used by anyone within a group (until congestion becomes an issue) without affecting anyone else’s use, but can be excluded to non-club members (at low cost). Examples include:
Cable television.
Toll roads.
Private schools.
National parks (where entrance fees can be charged).
Development research, i.e. commercialising existing research.
Common (pool) goods are rivalrous in use but non-excludable in consumption. These goods and services are commonly known to suffer from ‘the tragedy of the commons’ as no one has an incentive to look after common property. Examples include:
Open water fisheries.
Community gardens.
Private goods
Are rivalrous in consumption, and excludable, which means another party can be prevented from using them.
Restaurant meal.
Tickets to a concert.
Positive externalities Positive externalities are generated by the consumption of certain types of goods and services that deliver external benefits to unrelated third parties. Positive externalities may imply that less than the economically efficient level of a good or service is being produced or consumed. A common example is preventative healthcare, such as vaccination against infectious diseases. The individual that is vaccinated protects themselves from becoming ill, but this also has the positive effect of the individual not spreading disease to others in the community (see Table A1.2 for examples). Negative externalities Negative externalities occur when the consumption of certain types of goods and services imposes costs or harm to unrelated third parties, and this cost is not reflected in prices. Negative externalities may imply that too much of a good or service is being produced and consumed than is economically efficient. In general, government action to address externalities should be limited to actions with significant public benefits. Examples of negative externalities include pollution, congestion and environmental degradation.

NSW Government Guide to Cost-Benefit Analysis (TPP17-03) 25
Market power (failure of competition) A failure of competition occurs when a market is dominated by one or more large producers that exercise market power, often leading to inefficient pricing. Barriers to entry (such as high start-up costs, network effects, intellectual property and so on) can result in the exertion of market power, which may be exacerbated through organisations acting strategically to protect their position in the market. An example of this is when an organisation engages in a practice known as ‘predatory pricing’ where prices are set low (below the marginal cost of production) to drive out competitors and then increased once competitors have left the market. Market power is best addressed by an independent economic regulator rather than a general government agency. Where government regulation itself creates market power, this should be addressed by more rigorous assessment of the regulation through CBA in accordance with NSW Better Regulation Guidelines14. Imperfect information Information is needed for a market to operate efficiently. Buyers or sellers may have imperfect information about products, or withhold information when there is an advantage in doing so. This may result in these parties behaving in ways that are not in their best interests. For example, when buyers of insurance have better information than sellers, premiums are often set at the average price, which leads to over-subscription of high risk customers.
Therefore, in some circumstances governments may regulate to require information disclosure, provide certification, or provide the information directly.
Table A1.2: Examples of market failures
Description Examples
Positive externalities
Some goods provide unrelated third parties to a transaction with benefits that are not paid for. The market is likely to under-provide this type of activity.
Note: governments may also subsidise or provide merit goods. Merit goods have the property that the community desires a higher use of the good than would be likely if they were charged at full cost (e.g. education).
Vaccination.
Research and development.
Compulsory primary school education (common example of a merit good).
Negative externalities
Some goods impose costs on unrelated third parties to a transaction that are not paid for. The market is likely to over-provide this type of activity.
Governments may need to regulate certain activities to reduce the risk of harm that may occur to consumers, the whole community or the environment.
Pollution, congestion and spread of disease.
Information disclosure, restrictions on dangerous goods.
Market power
Market power exists when a single firm or group of firms have a large enough market share to set prices or quantities of goods and service in a market. Market power may make it difficult for new firms to enter the market.
Monopolies such as electricity networks.
Oligopolies such as airlines and banks.
14
This means that before a new regulation is approved and implemented, it must be demonstrated to generate net benefits for
the NSW economy (i.e. its benefits should exceed its costs). Or alternatively, before an existing regulation is renewed, a review and post-evaluation of the impacts of the regulation should be undertaken to demonstrate that it delivered net economic benefits.

NSW Government Guide to Cost-Benefit Analysis (TPP17-03) 26
Description Examples
Imperfect information
Information asymmetry occurs when one party to a transaction has more or better information than the other party, which can prevent consumers from making fully informed decisions.
Governments may need to regulate information disclosure to reduce the risk of harm to consumers, the whole community or the environment.
Health insurance.
Food labelling.
1.2 Equity objectives The government may also intervene to promote equity and support less well-off members of the community. For example, governments may provide energy rebates to assist low income earners to pay energy bills. Before an agency intervenes, an assessment should be made of the extent of the inequality to be redressed, and the reasons it exists. In such cases the CBA should explain the extent of the inequality to be redressed, the reasons why it exists and the role of the initiative in its mitigation. See Appendix 6 for further details on distributional analysis.
NSW Government Guide to Cost-Benefit Analysis (TPP17-03) 27
Appendix 2: Forecasting methods and issues
2.1 Importance of forecasting The forecasting of future outcomes is a key component of all CBAs and will help inform the costs and benefits of a proposal in relation to the base case. For some proposals, economists may employ econometric methods, to enable them to make the necessary forecasts. Many CBAs, however, will also require forecasts from relevant subject-matter experts. A critical first step is to identify the scope of the outcomes to be predicted. This is particularly important in considering third party and indirect market effects. In most cases, however, the key problem is identifying causes and effects in the primary market or activity and to what extent a project or policy will change behaviour and outcomes. A second consideration is the distinction that should be drawn between volume and price forecasts. Often, the classification and estimation of impacts will depend on assumptions made about unit costs or unit prices on the one hand, and quantity (volume) on the other. These assumptions underpin the forecasts that inform the base case and the estimated costs and benefits of each option assessed in a CBA and must be supported by evidence. Clarification of the timing and longevity of policy impacts must also be incorporated into relevant forecasts and supported by the best available evidence. Responses to some changes tend to grow over time as firms and households adjust their spending behaviour, such as price increases. In contrast, responses to other changes may decline over time as the information conveyed is eventually forgotten, such as advertising. The extrapolation of past findings to new situations involving other population groups with distinct social or demographic attributes should also be undertaken with a high degree of caution. These issues arise in many sectors but are especially important in CBA for social policy proposals. In cases where extrapolating from previous findings is necessary, it is advisable to validate findings by gathering as much information as possible, including evidence from numerous research studies. To account for risk and uncertainty, forecasts included in CBA should draw upon estimated full distributions where possible as well as estimated means of key variables. In each case the CBA should include some indication of the probabilities of higher or lower forecast outcomes. Finally, forecasts should always be interpreted conservatively to minimise optimism bias. As far as possible, the experts providing the forecasts should be independent of the agency promoting the project. Practical problems that arise when forecasting may include: Rapid technology development, for example in communications technology or renewable energy Probability of very low occurrence events (1 in 1,000 or 2,000 year events) such as extreme floods Effect of a program on outcomes when there are many possible causes of outcomes Changes in behaviour and the effects of these changes in behaviour Reliant on past events and behaviours and may have limited applicability to new policies aiming
to change existing patterns of behaviour Non-market outcomes Complex systems, such as traffic modelling across a complex transport network Interactions between ecological resources, such as quality groundwater, and production functions
for crop yields while controlling for the effects of unobserved characteristics such as climate and topography.
This appendix discusses practical problems for forecasting and common forecasting methods: Forecasting with natural data Experimental studies Other forecasting methods including meta-analysis, simulation models, market research, choice
modelling and expert advice.

NSW Government Guide to Cost-Benefit Analysis (TPP17-03) 28
Treasury can provide advice to assist where an analyst encounters difficulties with quantifying volume, valuing unit costs and prices or where the cost of quantifying benefits or costs is considered excessive relative to the project. In all cases, to ensure a shared understanding of the scope and valuation of costs and benefits in the analysis, analysts are encouraged to consult Treasury as early as possible in the appraisal of large or complex proposals.
2.2 Forecasting methods There are three main approaches to forecasting: using natural data, experimental approaches and surveying approach such as market research. Forecasting with Natural Data Much empirical work in the social and natural sciences is based on natural data. Natural data may consist of time series, cross-sectional or a combination of each. The data may be obtained via regular or specific one-off surveys, but natural data is distinguished from experimental data. Economists often draw on natural data when experimental studies are impractical or considered unethical. For example, unplanned differences or changes in situations are used to estimate behavioural responses, such as the impact of a change in income or price on demand (estimated income and price elasticities). These methods are generally guided by economic reasoning or theory. The imperative in each case is to identify causal relationships between the dependent and independent variables (i.e. the change in the dependent variable as the independent variable changes). A general problem with using natural data is the lack of randomness, which makes it difficult to identify causal relationships. This puts a lot of weight on econometric methods to determine cause and effect. Time series analysis typically draws on aggregate or average data over time. The use of averages may limit the inferences that can be drawn about individual behaviour. Cross-sectional data includes data across jurisdictions, community groups or individuals at a point in time. Cross-sectional studies based on individual data can greatly increase the number of observations. In this case it is important to sort out how characteristics of individuals may affect the outcomes. Combined time series and cross-sectional data may draw on aggregate comparisons between countries or between states within a country or on longitudinal data on individuals typically collected as panel data. In cross-country or cross-state studies the analyst explores the effects of national or state differences in the outcomes of comparable government initiatives. Differences in other economic or social factors, however, may also influence behaviour and be difficult to model precisely. With longitudinal panel data, the aim is to infer how changes in individual circumstances influence individual decisions. Given the need for extensive longitudinal data sets, there have been few such studies although their use has increased greatly over the last 10 years or so. The Melbourne University HILDA survey is well established and high quality Australian longitudinal survey. As with other approaches, care is needed to model all the critical factors and their interrelationships.

NSW Government Guide to Cost-Benefit Analysis (TPP17-03) 29
Experimental studies Experimental studies are studies based on data gathered from experiments. There are five main forms of such studies: 1. Random design experiments with baseline data 2. Random design experiments without baseline data 3. Non-random experiments with baseline data 4. Non-random experiments without baseline data, and 5. Before and after studies. The first two experimental designs are sometimes called true experiments because they include a treatment group and a control group and random assignment of study participants between the two groups. Ideally they will have baseline (pre-test) data as well as post-test data. The third and fourth, non-random, approaches are called quasi-experiments because they lack random assignment of study participants. This method has the potential to introduce selection bias into the data where outcomes depend in part on the individuals in each group rather than on the treatment under examination. This problem is avoided in experimental studies where individuals are randomly assigned to a treatment or a control group. In general, randomised experiments are preferred to non-randomised experiments and experiments with baseline data to those without baseline data. The optimum experiment, however, is not always feasible for various reasons, including cost, time and ethical considerations. Researchers conducting experiments may attempt to address non-random selection of treatment and control groups in quasi-experimental studies in various ways (e.g. by attempting to match treatment groups to like control groups or by controlling for these differences in analyses). Drawing on existing programs in place for specific population groups may allow extrapolations to other population groups. These existing programs can often provide a basis for estimating the resources required for a comparable initiative and some indication of the likely impacts. In each situation, however, there needs to be a comparison or control group. This could be the baseline, pre-program, outcome for the group now receiving the program services. Confidence in extrapolating would depend on the number of differences and their likely impacts. If extrapolating from one or two cases, judgement as well as statistical analysis may be needed. Other forecasting methods Other forecasting methods include meta-analysis or generic studies, expert simulation modelling, market research including choice modelling and reliance on expert advice. Meta-analysis draws on a pool of studies to obtain estimates on mean impacts and variations over the pool. Of course, many of these studies will themselves draw on either natural or experimental data. To conduct a meta-analysis, comparable studies have to be selected and, critically, a standardised measure of effect determined so that the findings can be compared. Simple meta-analyses find an average effect size and variance. More detailed studies use multivariate regression analysis to estimate an average effect size and variance controlling for quality of study, variations in the study populations, and other details in study implementation.15 Meta-analysis reduces the bias that can result from reliance on a single study – but the additional studies must be of high quality. Where possible the circumstances of the studies should be similar to those of the project or program under consideration. It is important to consider and possibly adjust for any differences between the socio-economic conditions of the research studies and the options assessed.
15
For examples, see Washington State Institute for Public Policy www.wsipp.wa.gov
NSW Government Guide to Cost-Benefit Analysis (TPP17-03) 30
Deriving generic income or price elasticities from multiple studies is a related form of meta-analysis. There are many publications of price elasticities of demand for goods, examples include water16, electricity17, public transport18 and petrol19. Care must again be taken in transferring any generic or average elasticity to the particular case study. In demand functions, critical factors include differences in demographic factors, income levels and the availability of substitute goods. Demand and supply elasticities may also change over time in unpredictable ways. All such factors should be considered if adopting generic price elasticity in a CBA for a specific project or program. Simulation models provide forecasts which are based on evidence collected and analysed over many years. Examples include computable general equilibrium (CGE) models, transport models, climate change and flood modelling. The first two examples are described briefly below. CGE models are complex models of an economy, which may be national, regional or international. They model household demand for goods and services through equations typically modelling a large number of industries. Household demands are a function of household types and income and price elasticities. The industry impacts are based on actual data usually from extensive input-output tables which show the inputs required to provide output in each industry. In CGE models, however, the outcomes are constrained by domestic resource availability and assumptions about capital movements and net immigration. Most CGE models assume competitive markets and market clearing, but they can allow for imperfect competition and pricing and non-market clearing. CGE models can show how an economy as a whole may react to changes in policy, technology or other exogenous factors. For example, CGE models are routinely used to forecast the impacts of tax policy, trade policy, climate change and changes in international prices on an economy. They can also show employment and income effects. However, the usefulness of CGE models depend on the quality and timing of the data available and assumptions about household and business behaviour (see Appendix 7 for further discussion on the uses and limitations of CGE). Urban transport models are another example of a highly complex model. Urban transport models typically involve four components: 1. Trip generation model of the number of trips per household by type of trip in multiple urban zones 2. Trip distribution model which predicts the combinations of origins and destinations 3. Modal split model 4. Route choice model that allows for tolls where appropriate. The model is typically run for a week-day morning peak for some future year, some 10 years or more in the future. This implies modelling a future unknown network in the base case, future service levels and factoring up the peak hour estimates to annual figures. While based on current observed survey data, behaviours may change over time and traffic forecasts can therefore be subject to a high degree of variance. Market research in the form of focus groups or more extensive quantitative surveys is widely used to forecast consumer demand in the private sector. It can also be used to forecast how people will respond to changes in public programs or policies. For example, before requiring packaging of tobacco products to depict various forms of serious diseases in 2005, the Australian Government commissioned extensive focus group research to determine whether tobacco smokers would change their smoking behaviour as a result of such pictures.
16 Dalhuisen, J, Florax, R, Groot, H, and Nijkamp, P, Price and Income Elasticities of Residential Water Demand: A Meta-
Analysis, Land Economics, 79, 2 (2003), pp. 292-308. 17 Espey, J, and Espey. M, Turning on the Lights: A Meta-Analysis of Residential Electricity Demand Elasticities, Journal of
Agricultural and Applied Economics, 36, 1 (2004), pp. 65-81. 18 Holmgren, J, Meta-Analysis of Public Transport Demand, Transportation Research Part A: Policy and Practice, 41A, 10
(2007), pp. 1021-1035. 19 Brons, M, Nijkamp, P, Pels, E, and Rietveld, P. A Meta-Analysis of Price Elasticity of Gasoline Demand: A SUR approach,
Energy Economics, 30, 5 (2008), pp. 2105-2122.

NSW Government Guide to Cost-Benefit Analysis (TPP17-03) 31
Choice modelling is another major forecasting tool (also see Appendix 3.2). For example, when major changes in the transport network are planned, complex modelling of trip choices may be required for various reasons. One is that commuters have differing values of travel time. Another is that the individual commuter may have multiple reasons for making trips and diverse preferences over trip attributes. Some people may be willing to stand in public transport rather than have a seat. Others will travel only if they can obtain a seat. Choice modelling provides a method for understanding and forecasting the decisions that individuals are likely to make when facing various trade-offs in their choices. Finally CBA may draw on expert advice. This umbrella term includes seeking advice from experts in a similar field to the proposed program. Although, the opinions of experts may in many instances be the best form of evidence available, a high degree of conservatism should be applied and post evaluation undertaken to build up the evidence base for future CBA. In some cases it may be difficult to identify or forecast all the impacts with a high degree of confidence. In these cases the CBA should draw on whatever information is available and describe and discuss the unquantified impacts as part of the report.
NSW Government Guide to Cost-Benefit Analysis (TPP17-03) 32
Appendix 3A: Valuation principles and methods
3.1 Valuation principles Where valuation of goods and services is possible, two key concepts are relevant: the opportunity cost principle and the willingness-to-pay (or willingness-to-accept) principle. Opportunity Cost Committing resources to a particular project or program will preclude their use elsewhere. The value of the resources used is their ‘opportunity cost’. This is the value of those resources in their most attractive alternative use. In general, market forces will generate a price for capital, labour or other inputs that reflect the opportunity cost of the resources. The principle also applies if an agency can access an input at a cost that differs from its market value. For example, where an agency proposes to use land that the agency already owns, the land should generally be valued at its highest opportunity cost equivalent to its maximum market value under current or likely land-use zoning (e.g. cost of urban parkland is the value of housing land that is forgone). In the case of labour, the opportunity cost is generally the value of the worker’s forgone output. That is, in a competitive market the opportunity cost is their highest wage in an alternative job. Where workers have occupational preferences, however, the real cost of employing someone is their reservation wage – the minimum amount that will attract the worker into a specific job. Based on the opportunity cost principle, benefits could be estimated based on the avoided cost of related or substitute public services. For example, the benefit of early intervention policies may include the avoided cost of policing, courts, incarceration or other related services for young offenders. Similarly, the benefits of preventative health measures could include avoided costs of acute medical services and care. Willingness to Pay Willingness to pay (WTP) is the maximum amount an individual or a firm is willing to pay for a good or service. In CBA, goods or services are generally valued at the highest amount of money that individuals or firms are willing to pay for them. A related concept is willingness to accept, which is the amount that individuals or firms are willing to accept in compensation for the loss of a good or service (e.g. loss of an environmental good like clean air). Where services are exchanged in competitive markets, the price paid reflects the value of the service to the consumer. This principle will hold most closely where the changes in output and price levels associated with the project, program or policy would be relatively small, i.e. marginal. Consumer surplus is the difference between what people are willing to pay for a good or service and its price. Where the goods or services are subsidised, the use of customer charges to value benefits is likely to understate benefits. A project or program is not necessarily justified because consumers are ‘willing to pay’ a price, if that price does not cover the costs of the service.
This appendix contains the following two sections: Valuation principles of opportunity cost and willingness to pay (WTP) Valuation methods – market prices, revealed preference and stated preference methods.

NSW Government Guide to Cost-Benefit Analysis (TPP17-03) 33
3.2 Valuation methods Market-based valuation Benefits and costs in a CBA should be valued at market prices, whenever prices or reasonable proxies are available. Market-based valuation relies on analysis of market information on consumer behaviour and/or prices in similar, complementary or related markets. Prices in competitive markets reflect what individuals are willing to pay. Market-based prices are relatively straightforward for estimating costs. For example, the cost of acquiring an asset can be valued based on: Replacement cost – The cost of replacing the asset at current market prices (rather than book
value), or Damage mitigation cost – The cost of building or replacing an existing asset to specified
engineering design or performance standards to withstand earthquakes. Market data can also provide measures of benefits, such as earnings differentials as a measure of the productivity benefits of education. Another example is the valuation of business travel time savings which is inferred from wages, on the assumption that workers are paid the value of their marginal product. Apart from analysis of markets directly affected by a government action, other examples of market-based valuation used to value benefits or costs include the analysis of prices and demand of goods or services that are substitutes or complements of each other. For example, the value of treating water to improve safety and quality may be inferred from the prices of marketed bottled water. Market data usually provides much of the information required for CBA and specialised valuation techniques may not be required. When markets are not competitive, however, prices may need to be adjusted to reflect real economic values. When markets do not exist or are heavily distorted, revealed or stated methods of valuation may be required. Non-market valuation methods: Revealed preference methods Where market prices are not available or excessively costly to obtain, non-market valuation methods are available. For example, some non-traded outputs (e.g. travel time savings in the case of transport projects) have long established methods of estimation and valuation. When non-market valuation methods are used, all else equal, revealed preference methods tend to be more reliable than stated preference methods and are generally preferred for this reason. There are a number of available approaches to non-market valuation: 1. Revealed Preference (RP) methods derive consumers’ WTP through examining their actual
behaviour. The four main revealed preference methods are hedonic analysis, travel costs analysis, defensive expenditure and special experimental studies. Hedonic analysis – Based on the idea that many goods can be viewed as bundles of attributes and
that the price of the good is the sum of the value of these attributes. Two major applications are hedonic analyses of house prices to elicit environmental values and hedonic analysis of wages to elicit returns to education. For example, a house has many attributes, often including several environmental attributes (positive or negative). By trading these attributes, consumers are expressing their values for all these goods. Statistical regression analysis can determine the values (implicit prices) of the attributes of these goods, services or assets. In labour markets hedonic analysis has estimated earnings as a function of years of schooling, work experience and socio-economic factors.
NSW Government Guide to Cost-Benefit Analysis (TPP17-03) 34
Travel cost studies – Used to value community facilities such as recreational sites. Visitors incur costs in the form of time and money travelling to recreational facilities and valuations are inferred from the relationship between visitation rates and access costs. Thus, trip costs act like prices in determining visits. For example, travel costs incurred on visits to national parks can be used to assess the value that visitors attach to the parks or similar recreational services. A critical assumption of the travel cost method is that the trip has a single purpose. If a trip has several purposes the travel costs must be allocated between them.
Defensive and corrective expenditure – Expenditure that mitigates the impact of an event before it
occurs, or reduces damages after it occurs. The value of goods can be inferred from defensive expenditure by assuming that a consumer will purchase goods and services up to the point where marginal benefit equal marginal cost. This method, however, must be used with care as some expenditures are lumpy (i.e. the expenditure profile has peaks and troughs, such as a household solar systems). Corrective expenditures that restore the individual or asset to their previous undamaged state represents what parties are willing to pay for the good or service involved. A common example is health care expenses to treat illnesses arising from pollution – this is sometimes described as the cost of illness valuation method.
Experimental studies – Field and laboratory studies can also provide information on the value of
goods and services. For example, Laury and Taylor (2008) found that the amount contributed to a laboratory public good was positively correlated with the willingness to contribute money to a local tree-planting organisation. 20
Non-market valuation methods: Stated preference methods
2. Stated Preference (SP) methods ask individuals to self-report their preferences or valuations. The
main methods are: Contingent valuation – Surveys asking consumers how much they are willing to pay to retain (or
avoid) something. This may be in the form of a binary (yes/no) answer in response to a specific price or a range of specific prices. This method has been widely used mainly to value environmental programs.
Choice modelling techniques21 – Surveys typically asks respondents to select from a number
of pre-defined options, where all options are described in terms of a common set of attributes, but each option is differentiated from the others by a different level of each attribute. Analysis of the trade-offs between attributes and price provides a monetary valuation. As with any survey, extensive pre-testing of the questionnaire is usually necessary to ensure that the survey design is effective and results are valid.
3. Wellbeing Valuation – This approach starts with an analysis of people’s overall life satisfaction,
applies econometric methods to estimate the life satisfaction provided by specific non-market goods, and then converts these into a monetary value by combining it with an estimate of the effect of income on life satisfaction.
22
This approach is similar to ‘Social Impact’ or ‘Social Value’ assessment or measurement
23, which
was developed more recently than other methods described above. Data sources and methodology for deriving value estimates in Australia should be rigorously documented, particularly if intended for use in future CBAs.
20
Laury, S, and Taylor L, Altruism spillovers: are behaviours in context-free experiments predictive of altruism toward a
naturally occurring public good, Journal of Economic Behaviour and Organisation, 65, 1 (2008), pp. 9-29. 21
See for example Hensher,D, Rose, J, and Greene, W, Applied Choice Analysis: A Primer, Cambridge University Press,
2005. 22 UK Treasury, Green Book: Appraisal and Evaluation in Central Government, 2011, p.58. For an example applying this
approach, see Trotter, L, Vine, J, Leach, M and Fujiwara, D, Measuring the Social Impact of Community investment: A Guide to using the Wellbeing Valuation Approach, Housing Associations Charitable Trust, 2014.
(http://www.hact.org.uk/sites/default/files/uploads/Archives/2014/3/MeasuringSocialImpactHACT2014.pdf?sid=9120). 23
This does not have the same meaning as ‘social impact assessment’ required by NSW environmental legislation. The latter
is usually concerned with documenting possible adverse social impacts of a development based on stakeholder
consultations, rather than aiming to monetise incremental changes in social welfare.

NSW Government Guide to Cost-Benefit Analysis (TPP17-03) 35
In stated preference surveys, WTP can be measured on an individual or household basis and the unit of analysis being used should be clear in the CBA. Household WTP is generally preferred over individual WTP because previous studies24 suggest that adding up WTP of individuals in a given household tend to result in overstating the WTP of the household as a whole. Methods to estimate WTP for some social, environmental or cultural services may be less well established and still subject to debate. There are also different WTP concepts that may apply to these services. For example, WTP for the consumption of a good or service (a private use value) is different from willingness to donate (WTD) payments that enable the provision of the service (a non-use value to a donor). It is appropriate to treat the two concepts differently in a CBA. Regarding WTD, the amount of private donations that can be raised may be highly speculative, or donations may be made expressly to obtain a material advantage for the donor. For this reason, where WTD is counted as a valid benefit in a CBA, it should be discounted to reflect (a) the probability that the donation may not occur, and (b) any material benefit to the donor. Donations made in exchange for a property right should be excluded entirely from the estimation of benefits in a CBA. Non-market valuation methods: Benefit transfer methods
4. Benefit Transfers – Can draw from either stated preference or revealed preference studies. This approach entails reviewing existing studies that measure specific benefits of other previous projects or programs, and using measures from those other studies as proxy values of benefits from the proposal being analysed. Provided the benefit transfer estimate is rigorously validated, this method can provide useful parameters and can be used for scaling estimated benefits up or down. For benefit transfer estimates to be valid, it is essential that there is a high level of comparability between the situations being considered, including a relevant operating environment, jurisdiction and context.
All of the valuation methods discussed above can provide useful answers so long as the methods are understood. What matters most is the quality of the work.
24
See for example Quiggin, J. “Individual and Household Willingness to Pay for Public Goods”, American Journal of
Agricultural Economics, 1997; and Lindhjem, H, and Navrud, S. “Asking for Individual or Household Willingness to Pay for
Environmental Goods – Implication for Aggregate Welfare Measures”, MPRA Paper No.24070, 2008.
NSW Government Guide to Cost-Benefit Analysis (TPP17-03) 36
Appendix 3B: Validity tests for willingness to pay estimates
The stated preference techniques, including contingent valuation, rely on responses to survey questions about hypothetical values placed on goods or services that are not readily valued based on market prices. There is a wide array of literature on reliability in contingent valuation
25, including evidence of
‘hypothetical bias’ (i.e. stated values exceeding actual payments) 26 and survey design that can minimise ‘strategic responses’27.
3.3 Potential weaknesses of survey responses Taking survey responses at face value implies making behavioural assumptions that: Respondents always truthfully answer the specific survey question, which in turn implies that, Respondents correctly understand and answer the question being asked. These assumptions may not always hold. Correctly interpreting survey responses requires understanding when the property of face value might fail. Some of the manifestations or causes of this failure are discussed below. The wrong things being measured The wrong things being measured can be due to WTP survey responses not being able to be taken at face value, for example28: Respondents may be answering a different question from the one being asked, because they may
not understand the question being asked. Implausible premises for the question being asked – such as, the cost of the good being too high
or too low or the service provider not having the capability to deliver the service. Inconsistent information being given at different points in a survey. Some scenarios or implicit assumptions may not apply to some respondents – such as, assuming
a certain tax payment vehicle when the respondent does not pay taxes or a payment mechanism not being valid.
25 Arrow, K, Solow, R, Portney, P, Leamer, P, Radner, R, and Schuman, H, Report of the NOAA Panel on Contingent
Valuation, 1993. http://www.economia.unimib.it/DATA/moduli/7_6067/materiale/noaa%20report.pdf. 26
These have been documented, for example, in Kling, C, Phaneuf, D, and Zhao, J, “From Exxon to BP: Has Some Number
Become Better than No Number?”, Journal of Economic Perspectives, 26, 4 (2012), pp. 2-26. Baker, R, and Ruting, B, Environmental Policy Analysis: A Guide to Non-Market Valuation, Productivity Commission Staff Working Paper, 2014,
provide some Australian examples. 27
See for example Carson, R, and Groves, T, “Incentive and Informational Properties of Preference Questions”,
Environmental Resource Economics, 37 (2007),pp. 181–210. 28
Carson, R, and Groves, T, “Incentive and Informational Properties of Preference Questions”, Environmental Resource
Economics, 37 (2007), pp.184-187.
This appendix discusses potential weaknesses of stated preference techniques and suggests validity tests that should be applied: Criterion validity Construct validity Convergent validity Content validity.

NSW Government Guide to Cost-Benefit Analysis (TPP17-03) 37
Highly subjective valuations leading to excessively wide ranges of value29
Contingent valuation surveys intended to measure willingness to donate tend to reflect WTD for the subjective (individual) moral satisfaction of contributing to public goods (which is highly subjective for each individual) and not necessarily the value of the public goods themselves.
30 This can occur for
various reasons, for example: Respondents tend to have difficulty separating their ‘warm glow’ (‘altruism’ value – i.e. the positive
feeling a person derives from making donations to fund an asset or service that will be consumed by others) from overall WTD for the value inherent to the public good.
Some studies found clear empirical evidence of ‘embedding’ effects – this refers to individuals’ WTD or WTP valuations being much higher when a public good is presented on its own, compared with when it is presented in a bundle of other goods.
In some cases, it was found that summing up WTP or WTD for all individuals from a stated preference survey would implausibly result in a figure that exceeded the total disposable income available for those individuals.
31
The WTD for providing a public good (the sum of use and non-use value) may not necessarily be equivalent to an individual’s actual donation for provision of the public good. Greater attention should focus on ensuring consistency between the way stated preferences are elicited and donations occurring in practice. Actually providing for the public good was found to matter to potential donors. Also, a decision to pay or donate could be conditional – for instance, it was found that a donor could be willing to donate a greater or lesser amount depending on what they knew about how much other people were donating. Respondent bias This is also called ‘survey bias’, and refers to the tendency of a person to answer survey questions untruthfully or misleadingly. People can give misleading answers in surveys for many reasons. For example: Respondents may feel pressured to provide answers that they believe are considered socially
acceptable. Respondents may believe that the surveyor wants to hear a particular response – this is called
‘compliance bias’. The manner of elicitation or the way the survey instrument is structured (e.g. ‘framing’ of the
survey questions, the sequence or complexity of the questions asked) may result in responses different from what the respondent would have provided if the information were elicited in a different way.
There may be limits to the range of preference questions that a respondent will be able to informatively answer. For instance, a survey with a large number of complex questions is more likely to generate typical responses when compared to a simple binary discrete choice format.
The ‘Free Rider’ problem ‘Free riding’ is a problem that is common among public goods, which tends to result in under provision of the good. It occurs when people take advantage of the availability of a public good or resource without paying for it. Free riding typically occurs with public goods whose supply does not reduce no regardless of how many people consume it (e.g. clean air) and where the goods are not excludable – people cannot prevent other people from using it.
29 Andreoni, J, Impure Altruism and Donations to Public Goods: A Theory of Warm-Glow Giving, The Economic Journal, 100
(1990), pp.464-477. 30
D.Kahneman and J.L.Knetsch, 1992. “Valuing Public Goods: The Purchase of Moral Satisfaction”, Journal of
Environmental Economics and Management 22, 57-70. See also R.C.Mitchell and R.T.Carson, 1988. “Evaluating the
Validity of Contingent Valuation Studies”, in Part 5: Methodological Issues in Economic Evaluation, pp.187-200. Venture Publishing: State College, Pennsylvania.
31 R.T.Carson, N.E.Flores and W.M.Hanemann, 1998, “Sequencing and Valuing Public Goods”, Journal of Environmental
Economics and Management 36, 314-323.
NSW Government Guide to Cost-Benefit Analysis (TPP17-03) 38
Due to the incentive to free ride, a person’s voluntary contribution to a public good would be expected to be smaller than that person’s true WTP. In stated preference surveys, however, the incentive to free ride can produce the opposite result. For instance, if survey respondents believe that the survey will result in a decision to provide the public good, they might report more than true WTP in a voluntary elicitation in which payment is not binding. The response would result in the provision of the public good, and respondents can then free-ride - i.e. they would end up paying less than what they stated in the survey once the good is actually provided.32
3.4 Validity tests that should be applied In most instances there is no ‘true’ observable value, against which a hypothetical WTP estimate based on stated preference methods can be judged. For this reason, values derived from stated preference techniques need to be able to meet specific tests of validity which have been developed by research practitioners based on experimental evidence over the past two decades. These validity tests are drawn largely from the behavioural sciences. The following discussion of validity tests draws heavily from reviews of the literature by Kling, Phaneuf and Zhao (2012), and Baker and Ruting (2014)
33, combined with actual examples of WTP estimates
in CBAs. Criterion validity
Criterion validity measures the extent to which statements in a stated preference survey are related to what the person actually does. A WTP estimate would have criterion validity if it is similar to what would arise from other measures of value that are generally accepted as valid. These measures include prices in competitive markets, values derived from economic experiments, or the outcomes of binding votes (e.g. in a referendum). An actual payment is preferred to a hypothetical survey response. It does not suffice for a survey respondent to be hypothetically willing to pay a certain amount – the payment mechanism should also be credible to respondents. In cases where data on actual payments are not available for comparison with WTP estimates, it would still be possible to undertake a ‘sense check’ using actual data from independent statistical sources34 or from focus group testing and a pilot survey. For instance, if the benefits in a CBA are based on a particular measure of WTP per household it should be possible to demonstrate that the WTP measure has been checked for plausibility against actual data on capacity to pay (e.g. estimated household income from the ABS or taxable income from the Australian Taxation Office). The CBA should clearly specify whether the WTP estimate is measuring:
(a) Consumer benefit deriving from use - i.e. an individual’s or household’s willingness to pay for the
consumption of a good or the service being provided by the proposed project or program, or (b) WTD, which typically derives from non-use – this could include any or a combination of altruism,
existence value, or option value (see Figure A7.1).
32
For example Champ, P, Bishop, R, Brown, T and McCollum, D, “Using Donation Mechanisms to Value Non-use Benefits
from Public Goods”, Journal of Environmental Economics and Management, 33 (1997), pp. 151-162, found in a field
experiment that hypothetical WTD substantially exceeded donations actually made for a public good with mainly non-use
value. 33
Baker, R, and Ruting, B, Environmental Policy Analysis: A Guide to Non-Market Valuation, Productivity Commission Staff
Working Paper, 2014 and Kling, C, Phaneuf, D, and Zhao, J, From Exxon to BP: Has Some Number Become Better than No Number?, Journal of Economic Perspectives, Volume 26, Number 4 (2012) pp. 3–26.
34 For example, the Australian Bureau of Statistics (ABS), the Reserve Bank of Australia RBA), the Australian Institute of
Health and Welfare (AIHW) and the Bureau of Crime Statistics and Research (BOCSAR).

NSW Government Guide to Cost-Benefit Analysis (TPP17-03) 39
The two measures are likely to differ in respect of how they are counted in the benefit streams of a CBA. Typically consumer benefits deriving from use of a public good or service should be estimated over the entire CBA analysis period and not as a one-off up-front benefit or payment. Where a WTD estimate is demonstrated to be valid it may be counted as a one-off up-front non-use benefit which can potentially offset the real resource cost of the program, consistent with the timing of the receipt of expected donations (e.g. at commencement of construction or operation, or staged over a multi-year construction period).
Construct validity
In the behavioural sciences, a ‘construct’ refers to a characteristic, trait, or complex psychological concept that is being measured or evaluated. Construct validity is the degree to which the variables measured in a test or experiment are consistent with the true theoretical meaning of the concept. Indirect constructs cannot be directly measured, and are estimated through reported indicators or behaviours (e.g. personality, intelligence, emotion, motivation). WTP and WTD are examples of indirect constructs. For purposes of a CBA, in order to have construct validity a WTP estimate should be consistent with established economic theory and principles. These principles include that:
WTP is correlated with household income and stated preferences, and the proportion of people willing to
pay for a non-market outcome falls as the amount they are asked to pay increases People typically face budget constraints People have stable and well-formed preferences People make rational decisions to maximise their own wellbeing.
Where one or more of these principles are violated (e.g. if the analysis implicitly or explicitly assumes no household budget constraints) the estimated WTP values would not be valid. At best they should be treated with caution.
Convergent validity
There are two ways to assess the construct validity of a measurement procedure – convergent validity and divergent validity35. Convergent validity refers to the degree to which the measures of two constructs that theoretically should be related are in fact related. A test of convergent validity is whether WTP estimates derived from stated preference surveys align with revealed preference estimates. This comparison can be done where there is sufficient data to allow both approaches to be used – e.g. in the valuation of recreation or housing amenity. Convergent validity, however, generally cannot be established for non-use values. There may be other cases where the evidence at face value might appear to demonstrate that two separate measures relate to the same construct. It is possible, however, that the evidence may be measuring some other construct, and not necessarily willingness to pay for the good or service that is being evaluated in the CBA. For example, the ‘warm glow’ derived by a private donor making a contribution to a project could arise not necessarily from pure altruism, but from material advantage to the donor deriving from factors other than consumption of the good or service:
A donation given in exchange for a property right is not a genuine non-use benefit, and should be
excluded altogether from a CBA. Where a donation is large enough to generate a non-trivial income tax deduction for the donor, the
value of the donation should be discounted to account for the income tax benefit to the donor. A further discount should also be applied to adjust for the probability that the expected donation may not be received in the first instance, unless there is a binding contract that the donation will actually be made.
35 Convergent validity helps to establish construct validity when two measures of constructs that theoretically are expected to
be related, are in fact found or observed to be related. Divergent (or discriminant) validity exists when measures of
constructs that theoretically should not be related to each other, are observed or found to not be related to each other.

NSW Government Guide to Cost-Benefit Analysis (TPP17-03) 40
On balance, there is evidence that stated preference estimates can be reasonably close to their revealed preference counterparts – but only for use values, and only where a good or service is able to be valued using both approaches. But this depends on how well each study is conducted and whether the same underlying values are being measured36. In some cases stated and revealed preference techniques may provide measures that are not strictly comparable, as they may provide estimates of different elements of welfare and estimates of some of these elements may be more valid than others. For instance, stated preference methods often include both use and non-use value, while revealed preference may not always pick up non-use value. Nonetheless, both stated and revealed preference methods can serve as valuable cross-checks on the order of magnitude of the estimated benefit in a CBA.
Content validity
Content validity refers to the extent to which a measure represents all facets of a given construct. Content validity is often seen as a prerequisite to criterion validity, because it indicates whether the desired trait or attribute is being measured. In this context, a WTP estimate should reflect statistically valid measures, and should be based on best practice study and survey design. This should consider the sampling frame and method to examine whether the sample is representative and statistically significant. The estimate should be able to be replicated and applied in different contexts.
3.5 Importance of sampling and survey methodology In most cases, establishing criterion validity and other forms of validity critically depend on survey design. Establishing validity will therefore require information about the sampling methodology and the survey instrument used to elicit survey responses. This will enable an assessment of the types of information that can validly be extracted and analysed for purposes of estimating WTP. Supporting information about the sampling approach should be provided in the CBA, including: Sampling frame – The population or universe that the sample was drawn from.
Sampling methodology used – A description of how the subset of individuals or firms was
chosen for inclusion in the sample. For example, matters of interest could include:
Whether the survey used a random sample that was statistically representative of NSW residents.
The specific sampling design used - as a general rule, convenience sampling or judgment sampling or other non-probability methods are much less reliable than the various forms of random sampling.
Whether the reported results include estimates of relative standard error (RSE), to enable users to determine the reliability of those estimates.
Sample size – It needs to be demonstrated that the sample size is sufficient to draw statistically
significant conclusions37. The appropriate sample size is usually determined in reference to the population (sampling frame)
and the sampling methodology. For example, a simple random sample may need to be large in relative size if the total population is small. A stratified random sample might require a larger overall sample size than a simple random sample because each strata of the population will need to be selected using a random sampling technique.
36
Baker, R, and Ruting, B, Environmental Policy Analysis: A Guide to Non-Market Valuation, Productivity Commission Staff
Working Paper, 2014, p.34. 37
For example, the National Statistical Service Sample Size Calculated may be a useful resource and is accessed at
http://www.nss.gov.au/nss/home.nsf/pages/Sample+size+calculator.

NSW Government Guide to Cost-Benefit Analysis (TPP17-03) 41
Focus group testing and pilot findings – Best practice WTP surveying should include focus group testing when developing the survey methodology and questions. A robust approach would also accompany this with a pilot survey to test for validity and refine where appropriate.
The survey questionnaire and methodology, and other validating procedures (e.g. focus group procedures and outcomes) should also be documented in the CBA.
3.6 Plausibility checks CBAs should demonstrate that the estimate of costs and benefits of the options are reasonable, particularly where: There is a high degree of uncertainty regarding the size or time path of benefits or costs, or The bulk of total benefits or costs are attributable to a single category of benefit or cost, or The project has a significantly higher BCR than other similar projects. Some examples of threshold analysis that might be undertaken include: Cost per user
If benefits cannot be valued, it may be possible to use the net present cost of a proposal to determine the likely cost per user over the life of the proposal. If this amount exceeds the likely benefit to each user (for instance, measured by their total ‘willingness to pay’, if this measure is available), then the proposal would be unlikely to be reasonable or plausible. Take the following example of a proposal to provide free services to users at a net present cost of $10 million:
If the proposal were to benefit 10 million users, the unit cost would be $1 per user. In the absence of an empirical evidence base, it could be reasonably inferred that the benefit per user is likely to outweigh the cost and that users or the community would be willing to pay $1.
At the other extreme, if the cost per user was $100 and it would not be realistic to assume that users would be willing to pay $100 each, then the proposal would fail the reasonableness check.
Cost differences between options
These could be compared to determine whether the additional cost is reasonable. For example, assume two options where Option A offers improved service levels compared to Option B. If the improved service levels of Option A are relatively minor but would incur a significantly increased cost of $20 million, a reasonableness check would likely rule out Option A.
Valuation of costs and benefits requires resources, time and effort. The appropriate degree of analysis will vary from one proposal to another. Common sense should guide the degree of analysis, particularly when assessing benefits or costs that are difficult to quantify. If an analyst is uncertain about the degree of analysis required to support certain assumptions in CBA, Treasury can provide advice.

NSW Government Guide to Cost-Benefit Analysis (TPP17-03) 42
Appendix 4: Discount rates and decision rules
4.1 The concept of discounting The costs and benefits flowing from a project or policy are generally spread over time. For example, a social policy may have initial implementation costs, while benefits or operating costs may extend into the future. To compare costs and benefits it is necessary to allow for these differences in time. This comparison is done by discounting the value of future costs and benefits to determine their present value. The present value is the value today of some future cost or benefit. Present values allow for decisions to be made in the present about initiatives that have costs and benefits in the future. It also allows for comparisons over time or across proposals with different analysis periods. Discounting reflects the view that a dollar received in the future is worth less than a dollar now (for a consumer), or that a dollar invested today will not be available to invest elsewhere (for an investor). The arithmetic of discounting is represented graphically in Figure A4.1, which uses a stylised example to illustrate that $100 in the present year is worth less than $100 in future years after allowing for the time value of a dollar by applying a discount rate. Figure A4.1: Stylised example of discounting (at a 7 per cent discount rate)
As explored in Appendix 4.2, this time value of a dollar does not reflect inflation. In fact, the social discount rate is a real rate of discount that applies to cost and benefit streams that are estimated in constant dollar terms (i.e. real terms).
0
20
40
60
80
100
120
Y0 Y1 Y2 Y3 Y4 Y5 Y6 Y7 Y8 Y9 Y10
$
Year
Discounting
This appendix outlines the theory and practice of discounting. The recommended social discount rate is 7 per cent (in real terms). Sensitivity testing should
be undertaken at 3 per cent and 10 per cent (in real terms). This appendix also explains the results and decision criteria that should be applied once all streams of costs and benefits have been discounted into present values.
NSW Government Guide to Cost-Benefit Analysis (TPP17-03) 43
4.2 Theoretical bases for social discount rates Social discount rates aim to reflect the opportunity cost of resources for society as a whole in the long term. Social discount rates are used in economic appraisal and evaluation to recognise that resources allocated to one initiative have other potential uses which are forgone. This reflects the fact that resources are scarce and there are many competing uses of resources. Generally, there are two prevailing theoretical bases to social discounting38: 1. Time preference
2. Opportunity cost of capital.
The concept of time preference recognises that society values current consumption over future consumption. In a growing economy, society tends to value a dollar of marginal consumption today at a higher rate than a dollar of marginal consumption in the future (when incomes are assumed to be higher). The concept of opportunity cost of capital recognises that any given public investment may occur at the expense of alternative public or private investment, as capital is limited. In this context, the public investment should not proceed if the expected return inclusive of all benefits is less than could be obtained in the private sector (the marginal opportunity cost of capital). Theoretically in a perfectly competitive capital market the consumer's marginal rate of time preference would equal the investor's rate of return on the marginal project. The opportunity cost of capital, however, typically exceeds time preference rates due to market distortions such as taxation of returns to capital, risk associated with general economic conditions (i.e. systematic risk) and transaction costs. The crucial question is whether the relevant alternative to a public initiative is (a) current consumption or (b) an alternative investment. Regardless of how the capital was originally raised, there is nearly always an investment opportunity cost – capital could be invested in an alternative private (or public) project at the opportunity cost of capital. Using the opportunity cost of capital aligns closely with the efficiency criterion in CBA (i.e. what benefits to society would the resources have returned if left in the private sector?). This Guide supports the utilisation of market data and there are market based benchmarks that can be used to calibrate the opportunity cost of capital, as outlined in Appendix 4.3 below. For the reasons above, this Guide adopts the opportunity cost of capital as the theoretical basis for the social discount rate in economic appraisal and evaluation. There are three other key theoretical issues to address in the application of social discount rates: 1. Should the social discount rate vary according to sector or project?
2. Should the social discount rate be risk adjusted?
3. Should the social discount rate decline over the analysis period?
38 Technically, there is a third approach called the weighted cost of funds which combines a time preference rate with the
opportunity cost of capital rate by applying weights that aim to reflect how much project expenditure displaces consumption
and investment. There are two major imitations of this approach. First, it is difficult to establish an agreed, standard set of weights. Second, and fundamentally, regardless of how funds are raised (i.e. whether consumption or investment is displaced) there is nearly always an investment opportunity cost – government could invest in an alternative private or
public project. As such, this Guide does not explore the weighted cost of funds beyond this footnote.

NSW Government Guide to Cost-Benefit Analysis (TPP17-03) 44
Should the discount rate vary according to sector or project? It is important to have a consistent social discount rate for all projects in all sectors. A different rate would imply one project or sector has a higher opportunity cost than another. If that is the case, this should be reflected in the estimated stream of costs and benefits (not in the discount rate). Box A4.1 below provides an illustrative example.
A consistent social discount rate also enables comparisons between all NSW Government initiatives across time on a ‘like with like’ basis. A single rate allows for consistent interpretation and comparison of economic appraisals and evaluations across the full range of NSW Government initiatives. This helps to minimise confusion about CBA for different projects of different agencies being assessed at different rates from year to year, as project funding requests may be carried over to future years. Should the social discount rate be risk adjusted? It is important that the social discount rate only reflects systematic risk. Systematic risk refers to unavoidable (non-diversifiable) market risk that affects all projects or programs and cannot be reduced by further diversifying a portfolio of programs or projects. If adjusted to reflect project specific risk (also called non-systematic or diversifiable risk), the rate can distort outcomes by altering the present value of the costs and benefits as a function of time, not as a function of risk. This would only be correct if time and risk were perfectly correlated. In practice all calculations in a CBA are subject to many sources of risk. If one project has a higher degree of risk than another this should be reflected in the quantification of costs and benefits (not through the discount rate). This can be done by using Expected Values (EVs) and tested by using sensitivity analysis. The EV of a stream of net benefits in a CBA is the probability weighted average of all potential outcomes for those streams. EVs can be quantified by estimating and applying a probability distribution of outcomes. For simplicity this may sometimes take the form of a weighted average for a discrete number of possible outcomes, each weighted by the likelihood of that outcome occurring. Should the social discount rate decline over the analysis period? It is important that the social discount rate remains stable over the analysis period. The social discount rate in this Guide is estimated on the basis that it is a long term opportunity cost of capital and its application over the analysis period reflects this. A declining rate would imply that the opportunity cost of resources is lower in every future period, however, the foundation for such an assumption is unclear. Initiatives that have very long term impacts that may involve intergenerational equity considerations tend to be the main rationale for declining discount rates. This does not closely align with the efficiency criterion of CBA or the opportunity cost of capital theory where the wellbeing of future
Box A4.1: Consistent discounting As an example, take a health outcome and an environmental outcome both valued at $10,000 now and in 10 years' time. In a CBA these benefits would be treated as equivalent values, subject only to discounting. A CBA would not attempt to weigh the health benefit or the environmental benefit differently once they have been estimated. To do so would be contrary to the basic valuation principles employed in CBA. Therefore, the same discount rate must apply to the health benefit and the environmental benefit. Moreover, the same discount rate should apply regardless of whether the health benefit or the environmental benefit is generated by a transport project, a health project or an environmental project. Once benefits have been estimated, the sector of the project does not in any way change the value of the benefit.

NSW Government Guide to Cost-Benefit Analysis (TPP17-03) 45
generations is best served by investing and reinvesting in the highest available return (Appendix 6 outlines distributional effects, which are a separate consideration). As discussed in Appendix 4.4, sensitivity analysis is the most practical approach to test whether initiatives with long term impacts are sensitive to the discount rate employed.
4.3 Empirical benchmarks to calibrate social discount rates There are two main empirical benchmarks that can be used to calibrate the long term social discount rate based on the real pre-tax opportunity cost of capital: 1. Backward looking benchmarks derived from the Australian National Accounts
2. Forward looking benchmarks derived from the Weighted Average Cost of Capital.
The Productivity Commission paper authored by visiting researcher Harrison (2010), reported a real pre-tax rate of return on capital in Australia of 8.9 per cent.39 This figure is based on Dolman (2007) which is derived from Australian National Accounts data40. The research paper considers this estimate to be “consistent with other national accounts based estimates of the before-tax rate of return to investment in Australia and the United States and with estimates of the cost of capital in Australia”. The Independent Pricing and Regulatory Authority (IPART) uses current market data and long-term averages to estimate the Weighted Average Cost of Capital (WACC) for a ‘benchmark’ regulated business. IPART publishes both a short term (40-day) and long term (10 year) measure of the WACC based on a standard gearing ratio (60 per cent) and average market volatility (equity beta of 1). At the time of writing, the pre-tax real long term WACC for the February 2017 update was 7.2 per cent41. It is important to note that the nominal benchmark Government long term bond rate is not a relevant empirical benchmark for calibrating the opportunity cost of capital because the government’s ability to borrow at a lower rate than private parties derives from its taxing powers (which impose welfare losses on the economy).
4.4 The recommended social discount rate Based on the considerations above, this Guide recommends that the social discount rate used in the central estimate of an economic appraisal or evaluation is 7 per cent. Sensitivity testing should be undertaken using a lower bound of 3 per cent and an upper bound of 10 per cent. The social discount rate is a long term parameter and has been calibrated based on long term empirical benchmarks of the opportunity cost of capital. Given the long term nature of these parameters, there is only a need to review them on an intermittent basis. While this Guide uses the opportunity cost of capital as the theoretical basis for the social discount rate, it is acknowledged that there are competing theories and this can lead to a range of different discount rates. For example, Harrison (2010) canvasses estimates in recent decades ranging from 1 per cent to 15 per cent depending on the approach taken – 1 per cent to 5 per cent for time preference rates and 5 per cent to 15 per cent for opportunity cost of capital rates42.
39 Harrison, M, Valuing the Future: The Social Discount Rate in Cost-Benefit Analysis, Productivity Commission, 2010.
40 Dolman, B, The distribution of recent economic gains: some early observations, presentation to the 3rd Productivity
Perspectives Conference, December, Canberra, 2007.
41 See https://www.ipart.nsw.gov.au/Home/Industries/Special-Reviews/Regulatory-policy/WACC for further information about
IPART’s WACC methodology. At the time of writing, the pre-tax long term WACC estimate can be found in the spreadsheet model accompanying IPART’s WACC Biannual Updates.
42 Harrison, M, Valuing the Future: The Social Discount Rate in Cost-Benefit Analysis, Productivity Commission, 2010,
Chapter 3, canvasses various discount rate concepts and benchmarks, and distinguishes between descriptive and prescriptive approaches to setting the social discount rate. The prescriptive approach mixes efficiency and equity considerations, and provides a wide range of suggested discount rates that reflect different value judgements which cannot
be resolved objectively.
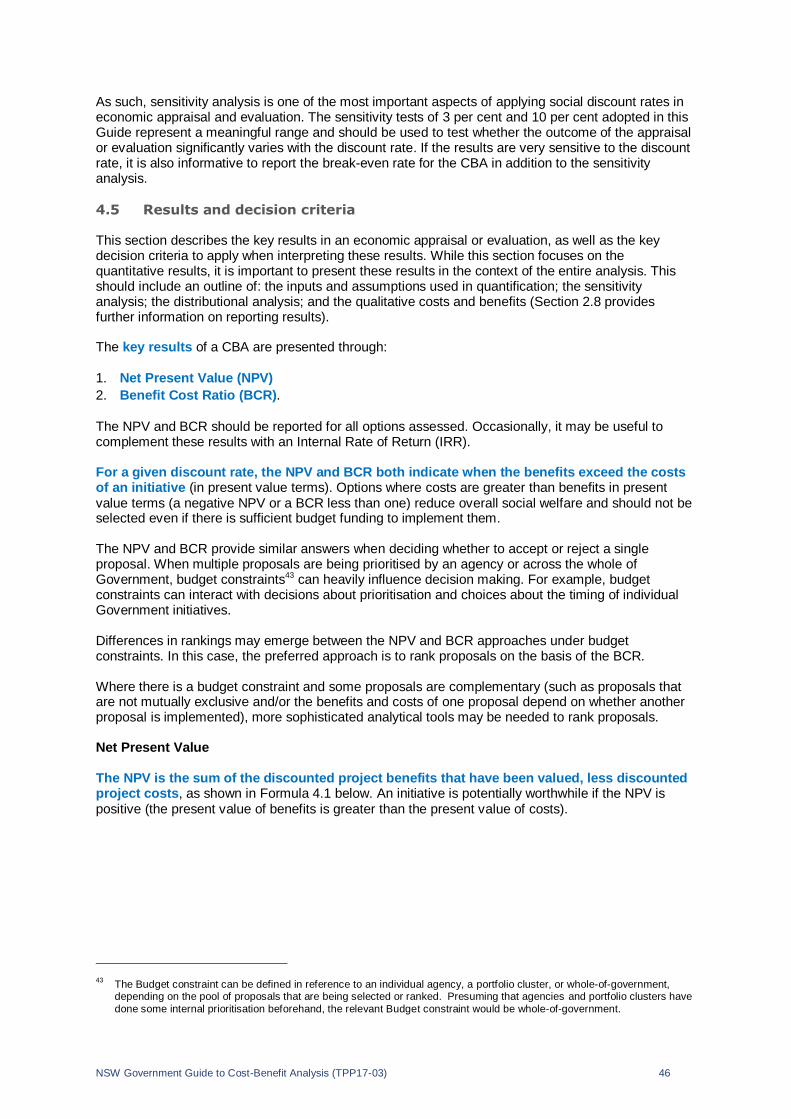
NSW Government Guide to Cost-Benefit Analysis (TPP17-03) 46
As such, sensitivity analysis is one of the most important aspects of applying social discount rates in economic appraisal and evaluation. The sensitivity tests of 3 per cent and 10 per cent adopted in this Guide represent a meaningful range and should be used to test whether the outcome of the appraisal or evaluation significantly varies with the discount rate. If the results are very sensitive to the discount rate, it is also informative to report the break-even rate for the CBA in addition to the sensitivity analysis.
4.5 Results and decision criteria This section describes the key results in an economic appraisal or evaluation, as well as the key decision criteria to apply when interpreting these results. While this section focuses on the quantitative results, it is important to present these results in the context of the entire analysis. This should include an outline of: the inputs and assumptions used in quantification; the sensitivity analysis; the distributional analysis; and the qualitative costs and benefits (Section 2.8 provides further information on reporting results). The key results of a CBA are presented through: 1. Net Present Value (NPV)
2. Benefit Cost Ratio (BCR).
The NPV and BCR should be reported for all options assessed. Occasionally, it may be useful to complement these results with an Internal Rate of Return (IRR). For a given discount rate, the NPV and BCR both indicate when the benefits exceed the costs of an initiative (in present value terms). Options where costs are greater than benefits in present value terms (a negative NPV or a BCR less than one) reduce overall social welfare and should not be selected even if there is sufficient budget funding to implement them. The NPV and BCR provide similar answers when deciding whether to accept or reject a single proposal. When multiple proposals are being prioritised by an agency or across the whole of Government, budget constraints43 can heavily influence decision making. For example, budget constraints can interact with decisions about prioritisation and choices about the timing of individual Government initiatives. Differences in rankings may emerge between the NPV and BCR approaches under budget constraints. In this case, the preferred approach is to rank proposals on the basis of the BCR. Where there is a budget constraint and some proposals are complementary (such as proposals that are not mutually exclusive and/or the benefits and costs of one proposal depend on whether another proposal is implemented), more sophisticated analytical tools may be needed to rank proposals. Net Present Value The NPV is the sum of the discounted project benefits that have been valued, less discounted project costs, as shown in Formula 4.1 below. An initiative is potentially worthwhile if the NPV is positive (the present value of benefits is greater than the present value of costs).
43
The Budget constraint can be defined in reference to an individual agency, a portfolio cluster, or whole-of-government, depending on the pool of proposals that are being selected or ranked. Presuming that agencies and portfolio clusters have
done some internal prioritisation beforehand, the relevant Budget constraint would be whole-of-government.
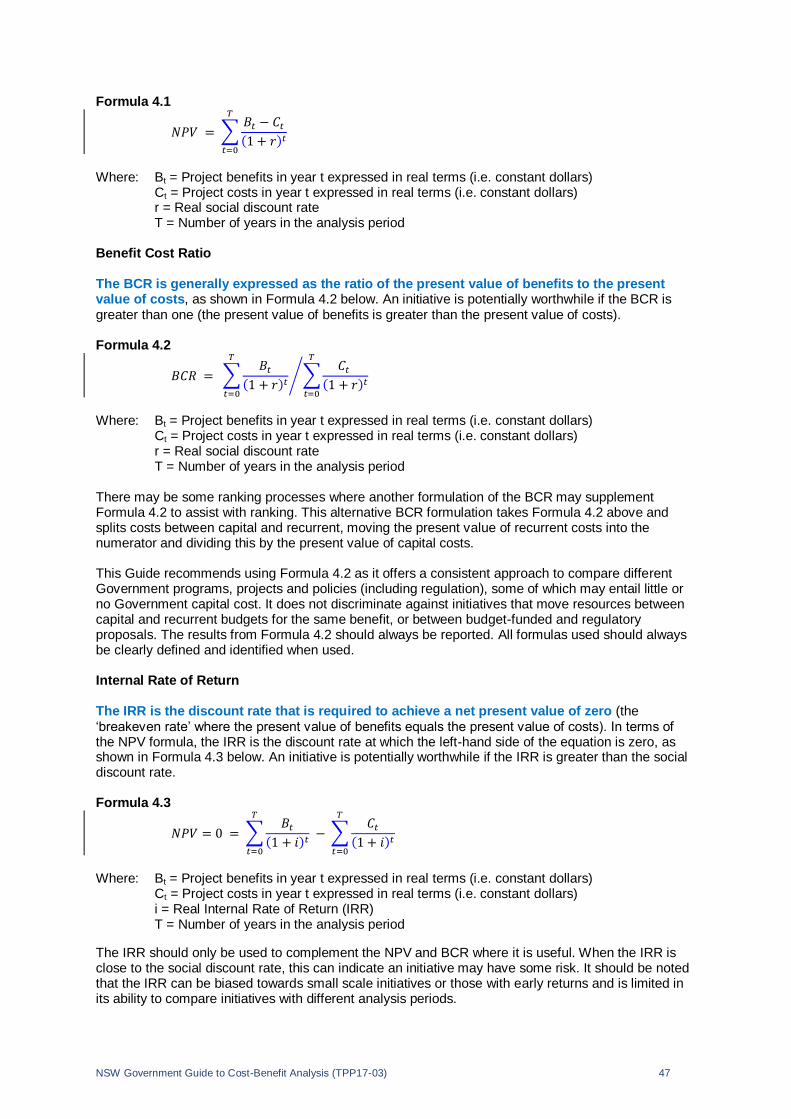
NSW Government Guide to Cost-Benefit Analysis (TPP17-03) 47
Formula 4.1
𝑁𝑃𝑉 = ∑𝐵𝑡 − 𝐶𝑡
(1 + 𝑟)𝑡
𝑇
𝑡=0
Where: Bt = Project benefits in year t expressed in real terms (i.e. constant dollars)
Ct = Project costs in year t expressed in real terms (i.e. constant dollars) r = Real social discount rate T = Number of years in the analysis period
Benefit Cost Ratio The BCR is generally expressed as the ratio of the present value of benefits to the present value of costs, as shown in Formula 4.2 below. An initiative is potentially worthwhile if the BCR is greater than one (the present value of benefits is greater than the present value of costs). Formula 4.2
𝐵𝐶𝑅 = ∑𝐵𝑡
(1 + 𝑟)𝑡
𝑇
𝑡=0
∑𝐶𝑡
(1 + 𝑟)𝑡
𝑇
𝑡=0
⁄
Where: Bt = Project benefits in year t expressed in real terms (i.e. constant dollars)
Ct = Project costs in year t expressed in real terms (i.e. constant dollars) r = Real social discount rate T = Number of years in the analysis period
There may be some ranking processes where another formulation of the BCR may supplement Formula 4.2 to assist with ranking. This alternative BCR formulation takes Formula 4.2 above and splits costs between capital and recurrent, moving the present value of recurrent costs into the numerator and dividing this by the present value of capital costs. This Guide recommends using Formula 4.2 as it offers a consistent approach to compare different Government programs, projects and policies (including regulation), some of which may entail little or no Government capital cost. It does not discriminate against initiatives that move resources between capital and recurrent budgets for the same benefit, or between budget-funded and regulatory proposals. The results from Formula 4.2 should always be reported. All formulas used should always be clearly defined and identified when used. Internal Rate of Return The IRR is the discount rate that is required to achieve a net present value of zero (the ‘breakeven rate’ where the present value of benefits equals the present value of costs). In terms of the NPV formula, the IRR is the discount rate at which the left-hand side of the equation is zero, as shown in Formula 4.3 below. An initiative is potentially worthwhile if the IRR is greater than the social discount rate. Formula 4.3
𝑁𝑃𝑉 = 0 = ∑𝐵𝑡
(1 + 𝑖)𝑡
𝑇
𝑡=0
− ∑𝐶𝑡
(1 + 𝑖)𝑡
𝑇
𝑡=0
Where: Bt = Project benefits in year t expressed in real terms (i.e. constant dollars)
Ct = Project costs in year t expressed in real terms (i.e. constant dollars) i = Real Internal Rate of Return (IRR) T = Number of years in the analysis period
The IRR should only be used to complement the NPV and BCR where it is useful. When the IRR is close to the social discount rate, this can indicate an initiative may have some risk. It should be noted that the IRR can be biased towards small scale initiatives or those with early returns and is limited in its ability to compare initiatives with different analysis periods.

NSW Government Guide to Cost-Benefit Analysis (TPP17-03) 48
Appendix 5: Dealing with risk and uncertainty
5.1 Concepts of risk and uncertainty The terms ‘risk’ and ‘uncertainty’ have precise and different meanings in economics44. Both should be considered and addressed in CBA of major projects and programs. Risk refers to situations where the probability of alternative future outcomes can be reasonably estimated usually based upon theoretical models or historical observations. Uncertainty refers to situations where future outcomes themselves are unknown and therefore have unquantifiable probabilities.
5.2 Assessing risk and uncertainty An adequate assessment of risk in a program or project would typically start with identifying the scope, value and other attributes of a project; identifying the likely costs and benefits; and mapping the chain of impacts of the project or policy in as much detail as possible. This should help identify the costs and benefits that might be impacted by particular sources of risk. This could in turn help to identify and value risks more accurately, inform the selection of project options or sensitivity tests, and help the agency to develop appropriate risk management strategies. For example, some risks may have a very low probability of occurring but could incur a very high cost if they eventuated (so-called ‘catastrophic’ events). Other risks could have relatively manageable costs but a relatively high probability of occurring. Where probabilities of certain risks occurring can be reasonably estimated, Government may be able to protect itself against those risks. Insurance is one example of such risk-mitigating arrangements. Uncertainty is most likely to surround the assumptions and estimates relating to complex projects with long periods of analysis. For example, estimating the demand for health services at a particular hospital 50 years in the future depends on many factors such as technology and demography whose relative influence may vary over time in an unpredictable manner. To account for uncertainty, CBA should include transparent assumptions, recognise the limitations of long-term forecasts, discount future cost and benefit streams, and undertake rigorous sensitivity testing on all key variables.
5.3 Considering and addressing risk in CBA Design changes Some sources of risk can be assessed and managed through design changes to individual projects and programs. Unexpected developments (e.g. the discovery of contamination requiring remediation at the project site or planning conditions of approval) may require scope or design changes that add to costs or delay the realisation of benefits.
44
This distinction between the two was first identified and discussed in Knight, F, Risk, Uncertainty and Profit, Boston,
Houghton Mifflin Co, 1921.
This appendix explains the concepts of risk and uncertainty and discusses the following methods to assess, consider and address risk in CBA: Design changes Contingency allowances Risk registers Expected Net Present Value (ENPV) with simple risk weighting Sensitivity analysis Scenario planning Monte Carlo methods Real options analysis.

NSW Government Guide to Cost-Benefit Analysis (TPP17-03) 49
To minimise the impact of unexpected developments, risk management strategies in project design should therefore be canvassed as part of the technical appraisal of a project (such as spreading orders around components suppliers, using alternative inputs, changing project design that reduces performance in return for greater reliability). Some risks can also be managed by providing for adequate processes of document verification, early threat identification and assessment. The implementation of these strategies could change the costs or benefits of the program or project and should therefore be included in the CBA. Contingency allowances A strategy often employed by agencies to cover for risks in a project or program is to build a contingency funding provision into the program budget. In most cases the contingency allowance is estimated as a given percentage of the initial capital cost and is included in the total cost of the proposal. This approach is acceptable in cases where there is a reliable history of past projects with similar attributes or contexts and therefore similar risks e.g. buildings that are being constructed according to fixed design standards. Risk registers
For large, high risk or complex programs and projects, a detailed risk register and the use of more sophisticated tools (such as Monte Carlo simulation) are strongly encouraged.
Risk registers are planning and management tools that help in the identification, assessment and management of project risks. The register provides a framework in which the potential impact of risks that threaten the delivery of the anticipated benefits can be actioned and minimised. Information in a risk register will usually list (amongst other things):
All major known risks of the project. Estimates of the range of costs that could be incurred if each risk were to eventuate. Identification of a range of risk mitigation measures. Estimates of the financial impact post risk mitigation. Key persons responsible for monitoring and managing each risk. The risk register is intended to be a ‘live’ document that is updated as a project or program is developed. This could result in changes in the CBA between the preliminary and final Business Case. Expect Net Present Value (ENPV) with simple risk weighting A more practical approach to incorporating risk into CBA is the estimation of discrete potential outcomes and calculation of the project or program’s present value by weighting each outcome by its probability of occurring. In this approach, proposals are assessed using their ENPV. ENPV is calculated as the sum of the NPV for each possible outcome, weighted by the assessed probability that the outcome will occur. The assessed probability could be determined based on past experience, expert opinion or other sources of information. Table A5.1 illustrates the benefits of this approach. In this example, the ENPV is the same for two alternative policy options but the variability of the result is greater in the first option. Table A5.1: Illustration of simple risk weighting Policy Options
(1) NPV Outcome 1 ($m)
(2) Probability of Outcome 1
(3) NPV Outcome 2 ($m)
(4) Probability of Outcome 2
Risk weighted ENPV = 1)x(2) + (3)x(4)
Option 1 $1.00m 70% $2.00m 30% $1.3m
Option 2 $1.25m 50% $1.35m 50% $1.3m
For CBA of smaller programs or projects the inclusion of ENPV and simple risk-weighting of a few expected outcomes, usually based on past experience, may suffice.

NSW Government Guide to Cost-Benefit Analysis (TPP17-03) 50
Sensitivity Analysis
Sensitivity analysis should be used to test assumptions about key drivers of costs and benefits or to assess possible outcomes under specified conditions of uncertainty. It illustrates what would happen if the assumptions made about some or all key variables prove to be incorrect, and how changes in the values of these variables affect the costs or benefits of a program.
Sensitivity analysis is a necessary part of any CBA. It is particularly valuable when different views are reasonably held about key assumptions. It is also a useful means of indicating the critical elements on which the outcome of the project or program depends. This allows focus on these areas during implementation or areas for improvement of cost and benefit estimates.
When the results of a CBA are highly sensitive to key parameter changes, the level of uncertainty surrounding the estimate becomes an important consideration. In some cases it may be significant enough to result in a recommendation that the project/program not proceed despite having a positive NPV.
Sensitivity analysis could include an indication of the probabilities of various scenarios occurring, if these are known. Sensitivity tests should also reflect the degree of uncertainty surrounding specific factors especially when uncertainty is asymmetrical – for instance, where uncertainty is likely to be greater on the downside.
Important relationships between factors should be taken into account. Sensitivity analysis could include scenarios when key variables move at the same time. For some projects or programs, sensitivity testing could include scenarios entailing the application of alternative valuation methods. Scenario Planning Scenario planning sets up a few plausible scenarios to test key technical, economic, political, or other uncertainties that could affect the success of a project or program. Scenarios usually consist of differing descriptions of the future environment which differ in crucial respects, usually in terms of significant or ‘big picture’ factors. It is best undertaken in conjunction with (or taking into account the assumptions tested in) sensitivity analysis. This is because sensitivity analysis occurs within a particular state of the world, whereas scenario planning explores different states of the world. Scenarios are not forecasts but rather describe ‘what if’ situations that might occur over the medium to long term and which should be considered in a project or program. Scenario construction should avoid averaging scenarios, or choosing the central or the most likely scenario. In some cases, scenario planning can be effective in dealing with inherent uncertainty facing decision makers or ensuring some flexibility in planning. If particular risks are considered salient only over the long term, this assumption could be tested as part of the CBA. Monte Carlo methods
With the advent of more powerful computational tools, it has become possible to develop a more detailed basis for risk assessment and valuation in CBAs. Monte Carlo analysis is a computerised technique based on repeated random sampling to generate a frequency distribution of certain outcomes occurring. Off-the-shelf software products are now available which enable the use of Monte Carlo simulations to facilitate the analysis of risks under varying assumptions and probability distributions.
Monte Carlo analysis enables the modelling of outcomes based on a combination of any number of risk factors or causes of uncertainty relating to a project or program.
Any or a combination of risks affecting the stream of benefits and costs of a proposal can be valued using Monte Carlo analysis, including in scenarios where these risks may occur individually, sequentially or simultaneously.
NSW Government Guide to Cost-Benefit Analysis (TPP17-03) 51
Examples of salient risks that have been valued using Monte Carlo analysis in high-cost or complex proposals include:
Site risks (e.g. contamination and remediation) Design, construction and commissioning risk Financial risk Operating risk Tax and other legislative changes Market risk and general economic conditions Network and interface risk Regulatory risk Force majeure Breach, default and/or termination risk.
The use of probabilistic modelling approaches should be informed by actual experience of project managers, service delivery officers, legal or other experts who are able to identify and place a value on salient risks. Due to the high level of expertise required, however, Monte Carlo analysis should generally be limited to high-risk projects. Real Options Analysis Real Options (RO) analysis acknowledges that decision making is sequential rather than one-off, so decision makers can choose options that retain or increase flexibility at a future date, when more information is known. In its simplest form RO analysis is based on the benefits and costs of obtaining additional information needed to place a value on the options. 45 RO analysis aims to quantify the value of investment decisions that keep options open which might otherwise be closed off on the basis of initial NPV assessment, e.g. until trends in demand or costs become clearer. In some cases a positive dollar value will be inferred from keeping options open. RO analysis tends to be of value mainly where an investment entails an irreversible cost in an environment of uncertainty. The practicality, usefulness and cost of the RO approach will need to be assessed on a case-by-case basis for public sector applications.
45
See for example, Van Putten, A, and MacMillan, I, “Making Real Options Really Work”, Harvard Business Review, 2014,

NSW Government Guide to Cost-Benefit Analysis (TPP17-03) 52
Appendix 6: Social welfare and distributional analysis
6.1 Social welfare Social welfare depends on the accrual of benefits and costs to different groups in society as a result of economic activity. In welfare economics the key groups are: Consumers Producers (owners of land and capital) Labour Government46. For a policy proposal the sum of impacts on these groups results in the net social benefit. To estimate the net social benefit of a proposed project, the total benefit to all groups generated by the proposed project is compared to the total benefit to all groups in the status quo (in present value terms). Use of net social benefit to estimate social welfare is consistent with the First Fundamental Theorem of Welfare Economics which states: A competitive market equilibrium is Pareto efficient, where it is not possible to make one person
better off without leaving another person worse off. The First Fundamental Theorem has been criticised for assuming that one dollar has the same marginal value for all individuals across society. Empirically, this is not necessarily a reasonable assumption, nor does it necessarily reflect a socially acceptable outcome from an equity perspective. In principle however, if the net social benefit of a project or policy is positive, the winners can compensate the losers; some people will still gain and no one will lose. When compensation does not occur it is still possible to have a net social benefit where there are some significant losers. Moreover, in some cases the losers may be from less well-off groups in the community. The Second Fundamental Theorem of Welfare Economics therefore attempts to introduce equity considerations while remaining consistent with Pareto principles. The theorem states: Any desired distributional outcome can be Pareto efficient, and Any distributional outcome can be attained through lump sum transfers. Even so, this has been criticised on two grounds: It is hard to objectively and impartially justify a position on how society should weigh such equity
considerations, and Lump-sum transfers are not always feasible.
46
For example, see Richard, J, Hueth, D, and Schmitz, A, Applied Welfare Economics, Edward Elgar Publishing, 2008.
This appendix outlines the basic theory of welfare economics and steps for undertaking distributional analysis. Cost-benefit analysis aims to estimate net social benefit which is the difference between total
benefits and total costs. In some cases, where the costs are borne by less well-off groups in society and the benefits
accrue to better-off groups, a positive net social benefit may result in adverse equity outcomes. Distributional analysis disaggregates the overall impacts of the options by groups of
beneficiaries and losers. This allows decision makers to make informed decisions accounting for social equity as well as overall net social benefit.

NSW Government Guide to Cost-Benefit Analysis (TPP17-03) 53
It is true that if net social benefit is the decision criterion across a sufficiently large number of policies, aggregate social welfare is likely to be maximised and the number of losers tends to cancel out or alternatively the losers may be compensated generally via tax or benefit transfers rather than on a project by project basis. Nonetheless, this compensation cannot be guaranteed and decision makers are often reasonably concerned about the distributional impacts of projects and policies. Accordingly, decision makers are often presented with an assessment of distributional impacts alongside cost-benefit results. This could include potential compensation arrangements.
6.2 Distributional (incidence) analysis The distribution of gains and losses is an important aspect of any new initiative, particularly in a reform context. The success of some reforms can hinge on having a robust understanding of the distributional impacts as well as appropriate strategies to manage the distribution of gains and losses. Distributional analysis disaggregates the overall impacts of the options by groups of beneficiaries and losers – for example, by income group, institutional sector (households, private business and government), providers of inputs (labour, producers), demographic groups (age, gender), geographic areas (LGA, region) or other categories that are relevant for the government. There are seven main steps in a distributional analysis: 1. Identify the key groups of interest in the relevant community, for example in NSW. 2. Allocate all costs and benefits identified in the CBA to one or more of these groups. Note that this
may depend on the pricing policy identified in the CBA, for example the use of road tolls. 3. Consider whether any of these costs or benefits may be shifted to another group. For example,
savings in production costs may be passed on to consumers in lower prices, especially in a competitive market. User benefits from transport infrastructure may be capitalised in value uplift and accrue to landowners.
4. Include any transfer payments that have not been included in the CBA (because transfers net out).
5. Consider how these transfers are actually borne. Taxes on producers may be passed on in higher prices, and taxes on consumers may lead to lower prices for producers. Conversely subsidies for producers may lead to lower prices for consumers.
6. Consider any unquantified effects and whether these are likely to impact significantly on any of the identified groups.
7. If appropriate, consider any mechanisms that could mitigate inequitable social impacts arising from the policy.
Disaggregated analysis can provide valuable information to decision makers on the distribution of benefits and costs, and should be included as supplementary information in a CBA. However, distributional analysis is a supplement rather than a substitute to the traditionally required measures of Net Present Value and the Benefit-Cost Ratio. Describing distributional effects may require information additional to what is required for the conventional CBA: Distributional analysis requires a selection of segments to allocate costs and benefits to. The UK
Treasury47 proposes that distributional impacts should be shown by income quintiles or by ethnicity.
To estimate the consumer surpluses for each group, the demand curve for each group would need to be known.
47
UK Treasury, Green Book: Appraisal and Evaluation in Central Government, 2011.

NSW Government Guide to Cost-Benefit Analysis (TPP17-03) 54
The distribution of benefits between producers and consumers depends on forecasts of prices. Lower production costs may initially benefit producers. But, if the market is competitive, consumers will ultimately benefit from price reductions. Indeed, if it is fully competitive, all cost savings will accrue to consumers. On the other hand, where producers retain the surpluses, the surpluses may accrue to owners of capital or to other employees.
Transfer payments, mainly indirect taxes and subsidies, also need to be accounted for because they affect the distribution of costs and benefits but not the total value of consumption.
Subject to careful analysis, this distributional information can be provided along with the CBA. This Guide does not recommend the use of distributional weights. Distributional weights leave an analyst with a high degree of discretion over equity judgements which are better placed in the hands of decision makers who are presented with transparent information on distributional impacts. Decision makers may then weigh the impacts according to their preferences, well informed of the distributional impacts of projects and their potential welfare implications.

NSW Government Guide to Cost-Benefit Analysis (TPP17-03) 55
Appendix 7: Practical issues in CBA
7.1 Analysis period The analysis period of a CBA must be long enough to capture all significant costs and benefits of the proposal. For major new capital expenditure this Guide recommends a practical asset life of 20-30 years. The period for a proposal is unlikely to exceed 40-50 years – which can be applied to longer-lived network type assets (e.g. roads, water supply systems). For assets with a long life, a cut-off point should be imposed and a residual value for the asset calculated. For recurrent expenditure, agencies are advised to consult their Treasury analyst because the relevant analysis period could range from a year for an ongoing program to multiple years if there is a known end date. Agencies are also advised to consult their Treasury analyst for regulatory options, because the relevant analysis period will depend upon the nature of the regulation. The longer a project period, the more difficult it becomes to forecast costs and benefits, and the less sensitive the quantum of costs and benefits become in later years. Proposals to adopt longer analysis periods beyond the recommended 20-30 years should be discussed with Treasury, having regard to the plausibility of data and assumptions over long time periods – e.g. assessing climate change issues or early intervention programs. In practice, different projects or programs can have different periods of economic life. For example, there may be various options to address an objective that are being compared or ranked and some options may involve different principal assets with different economic lives. Where the project or program procures fixed assets, the cost of renewal and replacement of assets with a shorter economic life should be included in the analysis, while a residual value may be assigned to assets with a life that exceeds the analysis period.
In some cases an item of plant or equipment with a relatively short life would be considered to be continually replaced by similar equipment. In all cases, analysts should test the plausibility of assumptions used.
Assets with shorter lives may be associated with greater flexibility, a lower level of risk and lower capital costs. The greater frequency of replacement means the benefits of improved technology can be incorporated more quickly into the production process. This may facilitate adjustment to changes in the quantity and type of service required.
This type of issue is more likely to arise in sectors where the pace of technological change is relatively rapid, demand is volatile or asset lives differ significantly. For example, CBAs would typically cover shorter analysis periods for: Information Communications Technology (ICT) equipment – 2 years or up to 5 years, reflecting
rapid technological change in the field. Advertising – Usually 1 year or less, reflecting the expected impact period, although in rare cases a
campaign can sometimes run for multiple years.
This appendix gives guidance on practical issues in CBA, including: Analysis periods Treatment of standard costs Treatment of willingness to pay estimates Practical valuation issues Items that should be excluded from CBA Valuation pitfalls.

NSW Government Guide to Cost-Benefit Analysis (TPP17-03) 56
Residual value In general, agencies should use the default assumption that an asset will have reached the end of its economic life by the end of the analysis period and the residual value would be zero. Alternatively, the asset may have reached the end of its economic life but may have a ‘scrap’ value which can be counted as a benefit at the end of the analysis period. In less common cases where an asset has not reached the end of its useful life, a residual value benefit may be included if the asset is still of use or there is a market for its resale. In this case the remaining value of the asset may be based on the lesser of replacement cost and the present value of future benefits.
7.2 Treatment of standard costs Land and pre-existing buildings or plant A project may use land, buildings or plant already owned by a government agency, for which no payment will be made. In these cases the opportunity costs of the assets should still be included. For land and buildings, the CBA should use a valuation based on the most profitable alternative use. This will require realistic assessment of potential alternative uses and the likelihood that amendments to existing land use regulations would be permitted by the relevant authorities. Note that all realistic uses of the land should be considered, including environmental or open space. Land owned within commercial centres is commonly zoned ‘general use’ but if it has development potential (i.e. realistic potential for rezoning) it should be valued accordingly. Where valuation of land is expected to be contentious this issue should be discussed with Treasury. Expert advice on land valuation is available from the NSW Valuer General. In regard to plant transferred to the project, the value placed on the plant should reflect its value in an alternative use. Sale value may be used for highly marketable assets (e.g. motor vehicles). Where resale markets do not exist for some items of plant, the particular plant may be valued by the lesser of the: Estimated present value of the plant’s savings or revenue earnings potential in its current location or
activity, or Current replacement value of the plant, adjusted for the residual life of the existing plant where
appropriate.
Labour The cost of labour in a CBA is its opportunity cost, which is the reservation wage – i.e. the lowest wage rate that a worker would be willing to accept for doing a particular job. Where the project or program uses in-house labour, the agency should include in its cost estimate the value of existing labour resources allocated to the project, as well as additional labour (i.e. new hires) required. While employees dedicated to the project or program should in principle be valued at their alternative output value, conventionally in-house labour cost is assumed to be equal to the total cost of the employees to the agency. Labour on-costs (e.g. superannuation, workers’ compensation, long service leave and other statutory or contractual obligations of an employer that comprise part of labour-related expenses) are incremental, unavoidable costs that are added to direct labour costs and included in cost and/or savings estimates (if labour savings are involved on the benefits side). Where an agency uses subcontractors, the agency should include in the cost estimate a breakdown of the amount to be subcontracted into separate components for labour, capital and other significant cost categories. This would facilitate comparison with other procurement options.

NSW Government Guide to Cost-Benefit Analysis (TPP17-03) 57
Overheads Overheads such as supervision, transport costs, administrative costs, printing and stationery, are also included if the with-without comparison shows that they differ between project alternatives and the base case. Material overhead costs associated with purchasing, storing and transporting materials needed for the project or program will also be relevant.
7.3 Treatment of willingness to pay estimates in CBA In cases where WTP is not easily estimated, care should be taken to avoid double-counting of benefits. Figure A7.1 illustrates the theoretical components of consumer value.48 Figure A7.1: Components of Total Consumer Value
The following principles should apply where benefits are valued using non-market valuation techniques:
1. Rigorous validation procedures should be used in order to demonstrate that estimates drawn from stated preference WTP surveys are:
(a) Similar to those that would be generated if respondents were to make real payments49 (b) Similar to answers that might arise from revealed preference tests (c) Consistent with sound economic principles (for example, that payments vary with household
income and stated preferences, that respondents have budget constraints, and are able to choose between substitute goods and services)
(d) Reflective of rigourous study and survey design.
Validity tests should be met in order for any estimates of WTP, particularly non-use values, to be counted as benefits in the central estimates of a CBA. Values that fail these validity tests should be excluded from the analysis.
2. Where possible, WTP measures in a CBA should aim to distinguish between private use
value and all other values in order to avoid double-counting of benefits.
48 The chart is adapted from previous work on applied environmental economics. See for example Figure 1.1 in Bateman, I,
Lovett, A, and Brainard, J, Applied Environmental Economics, Cambridge University Press, 2003. 49
Apart from actual payments, estimates derived from stated preference surveys could also be cross-checked against actual
statistical data.
NSW Government Guide to Cost-Benefit Analysis (TPP17-03) 58
3. Where an aggregate WTP measure includes non-use values that cannot be separated from private use values or option value the CBA should state this clearly and the assessment of validity should consider the plausibility of the aggregate WTP measure.
4. In most cases, WTP deriving from consumption (use) of a public good or service should be
calculated as a stream of benefits over the entire analysis period of the CBA, and not as a one-off up-front benefit.
5. In practice there is likely to be significant overlap between various categories of consumer value,
particularly non-use values such as the following cases.
With cultural, natural or environmental assets in particular, it can be difficult to distinguish between and separately estimate the various categories of non-use value and private option value.
It may be possible for non-use value to account for the bulk of benefits form significant natural or environmental assets.
Built assets with a primary value ultimately residing in their use would be expected to derive most (if not all) of their benefits from private use value – e.g. stadiums, cultural or recreational facilities. Where this is not the case the CBA should rigorously document the validation procedures used.
6. A positive private option value should be excluded because (a) option value is relevant only in very rare cases where there are no substitute services or assets; (b) private option value is likely to be negative where future use is uncertain; and (c) for cultural and recreational services in particular, all private expenditure has an opportunity cost.
7. Where non-use values do not meet the required validity tests, these values should not be
included in the central estimates. These values may be included in sensitivity tests as a possible upside scenario, but only where the CBA presents conclusive evidence that (a) the benefits actually exist, (b) they are directly attributable to the project or program, and (c) they are able to be measured in a valid and reliable way.
8. Estimates using the benefit transfer method would generally be valid where the estimates are:
Based on previous projects with similar nature and characteristics, site conditions, context and affected population
Consistent with sound economic theory Based on comprehensive, accurate and reliable data Based on robust and valid measurement methods in the original study Relevant to the project to which the Benefit Transfer estimate is applied Able to yield consistent and comparable measures of WTP or other measures of social
welfare Adjusted where appropriate to control for differences in attributes (e.g. population size or
density, educational attainment, socio-demographic characteristics).
Where these conditions do not apply, the benefit transfer method should not be used. The findings of independent academic or consultants’ research can inform the valuation of benefits. Care should be taken, however, particularly where there is a lack of consensus about particular approaches. When quantification or valuation is not possible, benefits should be discussed in qualitative terms. Regardless of the valuation method used, the appraisal should state the key assumptions and parameters used as explicitly and comprehensively as possible. In all cases the value assigned to each unit of output and the rationale for using that value should be clearly specified. Where there is debate over the precise value of an output unit, a range of values should be specified and if the benefit is significant, sensitivity analysis should be undertaken.

NSW Government Guide to Cost-Benefit Analysis (TPP17-03) 59
7.4 Practical valuation issues Externalities
Negative externalities occur where some of the costs associated with consuming or producing the service are borne by third parties who do not use that service. Examples of negative externalities include noise, congestion, environmental pollution or loss of amenity. Positive externalities occur where providing a good or service generates benefits to households or firms beyond the private benefit accruing only to consumers of the service. Examples of positive externalities include third party benefits from provision of health or educational services. Externalities can be estimated drawing on market data, where it is available. For example, the valuation of externalities like greenhouse gas emissions is normally examined as part of an Environmental Impact Assessment which follows broadly similar steps: 1. Determine the scope of the impact (e.g. categories of externality and/or geographic coverage). 2. Measure the physical change (i.e. the volume of greenhouse gas emissions relative to the base
case). 3. Derive from market data or reasonable proxies a market price or cost in dollars per unit of
volume/impact (e.g. market prices of emissions trading certificates). 4. Undertake sensitivity analysis of key parameters. Externalities can also be estimated using non-market valuation techniques such as stated preference surveys to estimate the value placed by respondents on externalities of health or environmental programs or various revealed preference valuation methods. Taxes and subsidies Taxes (and subsidies) are transfers50 which increase (reduce) the prices faced by producers and consumers. As a general rule the taxes and subsidies should be excluded from economic costs because they do not represent a resource cost. However, insofar as they are part of consumers’ willingness to pay for something, they form part of willingness to pay valuations. Indirect taxes on inputs and taxes on profits (producer surplus) are usually excluded in a CBA. In some cases it may be appropriate for the impact of incremental taxes (subsidies) on future streams of economic costs (benefits) to be taken into account. However, this consideration would only be to the extent that those incremental taxes or subsidies lead to demand or supply of the service being significantly different from what they otherwise would have been without the project or program. In such cases it may be appropriate to make relevant adjustments to market prices. The impact of taxes and subsidies will depend on the balance between incremental effects (i.e. net increases in output attributable to the project or program) and displacement effects of the project (i.e. increases in output displacing other output that would be produced). Land value uplift The benefit of land value uplift in areas surrounding a project should be excluded from a CBA. This is because in most cases land value would reflect the capitalisation of an increased output stream that is already included in other benefits, such as producer or consumer surpluses. For example, where an irrigation project both increases the value of farm land and the income generated by farming it, both should not be counted as benefits in a CBA because the increased land value reflects the value of the increased output stream.
50
Taxation takes part of the income of private parties and transfers it to a government, which in turn pays subsidies (welfare
benefits or concessions) or provides goods and services to private parties. Those who pay the tax are not necessarily the
same parties who receive the benefits.
NSW Government Guide to Cost-Benefit Analysis (TPP17-03) 60
In urban renewal programs any, regulatory changes (e.g. zoning of an area) or new infrastructure investments (e.g. additional transport capacity, new services like schools or hospitals) can increase the market value of land in or close to the project area. Again, however, the land value uplift is likely to be included in other benefits. Care should be taken that all costs and benefits are incremental to the base case. For example, where the producer surplus to developers is included as a benefit in a CBA for an urban renewal program, the producer surplus to developers would comprise the above market return. The above market return is estimated as the expected profit of the proposed development less the standard margin for that class of development. Inclusion of land value uplift benefits may be valid only in very rare cases where the project proponent can provide evidence that all of the following apply: 1. The benefit from the project theoretically exists (identification), and 2. The land value increase is directly caused by the project (attribution), and 3. The benefit is able to be separately measured, and the measure of the benefit is established
through the appropriate validation procedures (e.g. statistical tests, field experiments and so on). In general the estimates of land value uplift should be excluded unless evidence is provided to demonstrate that the conditions for valid use of this method are met. As per Appendix 7.3, the key is to avoid double counting. Value sharing is a separate but related concept to value uplift. Value sharing refers to how any value uplift might be shared between parties. In CBA, value sharing should generally be addressed through distributional analysis (see Appendix 6 for further details). Wider Economic Impacts Wider Economic Impacts (WEIs) relate specifically to major transport and urban development proposals. WEI analysis aims to measure benefits not normally captured by travel time savings in conventional CBAs. WEIs include: Agglomeration economies – benefits of improved productivity derived from greater density of
employment, input and labour markets which offer the firm greater choice, and greater access to knowledge and technology of other firms
Benefits of increased competition as a result of better transport Value of increased output in imperfectly competitive transport-using industries Economic welfare benefits from improved labour supply due to increased labour participation,
longer hours worked, or movement of workers to higher productivity jobs. Efforts to quantify WEIs have focused largely on measuring increased output due to agglomeration economies, based on the concept of ‘effective density’ of a location.
51 ‘Effective density’ is defined as
the employment in and surrounding the specific project area, weighted by proximity to the location (in generalised cost). There are substantial practical issues in quantifying WEIs, including the availability of relevant data, the validity of the measures used and the conclusions that can be drawn from them and the high risk of double-counting some economic benefits. The existing literature also suggests that the size and direction of WEIs can differ strongly across projects and that a transport project can actually give rise to agglomeration costs due to dispersion of jobs and housing. WEIs should be excluded from the central estimate of a CBA, but could be shown separately in a possible ‘upside’ sensitivity test.
51
UK Department for Transport, Transport, Wider Economic Benefits, and Impacts on GDP, 2006. Accessed 30/08/2016 at
http://webarchive.nationalarchives.gov.uk/20080306143059/http://www.dft.gov.uk/pgr/economics/rdg/webia/webmethodology/.

NSW Government Guide to Cost-Benefit Analysis (TPP17-03) 61
Cost of carbon abatement Scientific evidence suggests that human activities have increased carbon dioxide emissions which in turn have harmful effects on climate, but which are not necessarily reflected in market prices. With the development of regulatory mechanisms that mimic a competitive market, e.g. baseline-and-credit schemes or emissions trading schemes, market prices reflecting the cost of carbon emissions are now available. The price of carbon, however, can vary within a very wide range because the value can be driven by the design of the market mechanism (e.g. excessively generous exemptions) or the assumptions used, e.g. discount rates. The following general rules could guide valuing the cost of carbon emissions for a CBA where the issue is significant: Market prices should be used as a basis for valuing the costs of carbon emissions, where
reliable evidence can demonstrate that those market prices are not significantly biased as a direct consequence of scheme design.
Where market prices are not deemed to reflect the true cost of carbon emissions, estimates of damage or damage mitigation costs may be used.
Where adjustments are made to cost and benefit streams to reflect the costs of carbon emissions, the CBA should document clearly the carbon cost assumptions made in the base case and each of the options evaluated. Potential climate change impacts should be assessed like any other risk factors that affect the economic life cycle of assets, as part of an agency’s ongoing risk management and decision making for both existing and new assets. Excess burden of taxation As revenue from taxation provides the majority of government funds, government projects are usually considered to be taxpayer funded. Therefore, the costs of taxation should be considered alongside other impacts as part of the CBA. If agencies are unsure about the application of excess burden, Treasury can provide advice The cost of taxation is the deadweight loss (or excess burden) to society from distortions to resource allocation, which leads to a sub-optimal outcome. For example, payroll tax thresholds could lead to reduced incentives for business growth and expansion, as the amount paid and level of compliance required increases with total wage payments. In addition, collecting tax has administration and compliance costs. The excess burden of taxation will depend on the portion of a project or program that is funded by taxation – e.g. compared to private sector contributions. There are various studies that have estimated the marginal excess burden of different taxation measures52. The excess burden of taxation could be shown separately in a possible ‘downside’ sensitivity test. Adjustments to reflect true cost (shadow prices) A shadow price is an estimate of a market price when a market price is not available or when the market price is known to be distorted. For example, a subsidy (tax) on production will lead to a price lower (higher) than the true economic cost.
52 Henry, K., Australia’s Future Tax System, 2010. Accessed 02/03/2017 at
https://taxreview.treasury.gov.au/content/Content.aspx?doc=html/pubs_reports.htm
NSW Government Guide to Cost-Benefit Analysis (TPP17-03) 62
The use of shadow prices (i.e. adjustments to observed prices to reflect the real cost of a good or service) could be considered where: 1. Taxes and subsidies drive a substantial wedge between the real costs of production and prices. 2. The resource used (capital, labour) would otherwise be unemployed or under-employed – so that
the opportunity costs of labour employed on a project/program are less than the wage costs and costs could be adjusted accordingly.
Shadow price adjustments for use of resources are not commonly used in the Australian context, and this Guide does not generally recommend their use due to the significant measurement complexities involved.
7.5 Items that should be excluded from a CBA Sunk Costs In a CBA all costs must relate to incremental new expenditures only. All past (or sunk) costs are irrelevant and should be excluded from the analysis. Depreciation The capital cost of a project is incurred at the time that expenditure is incurred for labour, machinery and other inputs for construction, or in the case of an existing asset, when it is diverted from its current use to use in the project being evaluated. These inputs are valued at their opportunity cost. Depreciation is an accounting means of allocating the cost of a capital asset over the years of its estimated useful life. It does not directly reflect any opportunity cost of capital. Depreciation should not be included in a CBA because this would double count the up-front capital cost. Interest As future costs and benefits are discounted to present value terms in a CBA, the discount rate reflects the use of capital resources for the project or program over time. Including interest cost or dividend returns to equity would double count the cost of capital implicit in the discount rate. Transfer payments Transfer payments53 are financial transfers between groups that do not involve the use of economic resources. These payments should be excluded from a CBA because they have no impact on net benefits of the program, as the benefits to one group are offset by costs to other groups. If the analysis, however, aims to show distributional impacts on various groups affected by the proposal, this could be included in the analysis and appropriately qualified so as to avoid double-counting.
7.6 Valuation pitfalls As far as possible the following categories of valuation pitfalls should be taken into account and avoided. Double counting of benefits The risk of double counting can arise, especially in stated preference methods, where: Impacts of a proposal are incorporated in subsequent valuations of assets or in market prices
(see land value uplift discussion in Appendix 7.4 above). New goods and services have many substitutes, particularly where existing facilities are
underutilised. E.g. NSW households may have fixed budgets for recreational activities, so any household spending on new entertainment facilities might be expected to displace existing spending on substitute recreational activities.
53
This item should not be confused with ‘benefit transfers’, which are non-market valuation assumptions drawn from prior
studies and which are typically used to measure externalities. See Appendix 3 for further discussion of the ‘benefit transfer’
method.

NSW Government Guide to Cost-Benefit Analysis (TPP17-03) 63
Distribution of benefits between different groups of society is being estimated, and transfers between groups (i.e. an increased cost to one group offset by an increase in benefit to other groups) are not explicitly taken into account.
Confusing costs as benefits Some CBAs present increases in employment as an economic benefit. However, this would be the case only if the labour resources employed by the project were previously unemployed or underemployed, or if the actual wage increased above the reservation wage. Where this is not the case, any employment would represent a displacement of otherwise employed resources, which should not be considered as a net increase in social welfare. Economic multipliers Economic multipliers (e.g. for income, output, employment, value added, or imports) are typically derived from input-output tables. They are often applied to measures of direct impact in order to estimate flow-on impacts, which are then presented as estimates of economic benefits arising from a project or program. Multiplier analysis is subject to significant limitations (see Appendix 8.2) and should not be used in CBA. Multipliers assume no technological change and provide no indication of timing of impacts and most importantly assume no opportunity costs or, equivalently, resource constraints. Estimation bias International research has identified systematic bias in estimates of benefits and costs. The costs of major projects or programs can often be underestimated or demand forecasts are too high. In infrastructure projects this bias often manifests itself in overly optimistic benefits or understating of timing or costs.54 Valuation errors or estimation bias can be minimised in a number of ways, including: Using reasonable cost and benefit assumptions and data sourced from a reliable evidence base
For example, where available and properly validated, ‘comparison’ forecasts for the base case and the options evaluated can be derived from similar projects or similar past situations whose outcomes have been documented.
Incorporating adequate sensitivity analysis
Where data are not readily available or where future demand forecasting is difficult, sensitivity analysis should be undertaken to determine the minimum amount of expected benefits for the project to remain worthwhile or become marginal, and consider how likely that would be. Sensitivity tests on the options assessed should go beyond the standard plus-or-minus a fixed percentage of costs or benefits in the base case. One approach might be to base sensitivity tests on specific sources of salient risk. The sensitivity analysis should highlight key assumptions that drive the CBA results. Another option might be to draw on data and factual experience from recently commissioned similar projects or programs, determine the difference between expected (‘ex-ante’) and actual (‘ex-post’) outcomes and apply the difference to the project or program being evaluated. The use of data from past experience should be supported by post implementation reviews.
Identifying risks and applying risk management strategies
The sensitivity analysis should highlight key assumptions that drive the CBA results. Devising risk management strategies for the project should help improve confidence in the findings of the CBA.
54 Flyvbjerg, B, Bruzelius, N, and Rothengatter, W, Mega-projects and Risk: An Anatomy of Ambition, Cambridge University
Press, Cambridge, 2003; and Macdonald, M, for HM Treasury, Review of Large Public Procurement in the UK, 2002.
NSW Government Guide to Cost-Benefit Analysis (TPP17-03) 64
Appendix 8: Other economic appraisal methods
8.1 Cost-Effectiveness Analysis Cost effectiveness analysis (CEA) shows the costs of achieving a given outcome. The aim is to achieve these outcome(s) at least cost. CEA is used to compare the costs of different options where outcomes are taken as given or considered equivalent among options. In the past, CEA was applied in cases where CBA was not possible mainly due to difficulties in valuing the major benefits in dollar terms. In recent decades, however, methodological approaches have been developed which enable the valuation of benefits which were previously not able to be quantified, usually in the human services sectors (e.g. health, education, disability services). The steps in conducting a CEA are very similar to those for a CBA, except that benefits are typically not quantified in a CEA. CEA requires the same robust evidence as CBA, but CEA merely shows the least cost option. The major disadvantages of CEA are: CEA cannot be used to compare projects or programs with different outcomes or objectives that
are not directly comparable. Unlike CBA, CEA cannot indicate whether the preferred option provides a net benefit to society. It
is possible that the preferred option in a CEA could result in a net cost rather than a net benefit to society.
For these reasons, in rare instances where CEA is used initially, agencies should aim to collect better information from post evaluations over time, to enable a transition to CBA where changes in policy, analytical techniques or data availability make CBA feasible. As a general rule, CBA is the preferred approach in assessing projects or programs or regulatory proposals. CEA may be a second-best option in those rare instances where: It is not possible to value the major benefits in monetary terms. There is no reliable evidence for estimating the main benefits. The project is too small to justify the work entailed in quantifying benefits – i.e. benefit valuation
and data collection are likely to be expensive relative to the cost of the program being evaluated. Decision makers have previously agreed on a specific outcome or objective, and only wish to
compare options that meet the same objective. CEA is easiest when all the options have the same degree of effectiveness (same outcomes) because the aim simplifies to minimising cost for the given outcome. In some cases, however, carrying out a CEA is not that simple because different options entail different degrees of effectiveness, or the ‘business as usual’ option may entail a reduction in services to begin with. Wherever possible, agencies should consider CEA options with similar outcomes. If this is not possible, agencies should attempt to quantify the effectiveness of each option relative to other options.
This appendix discusses the other techniques sometimes used in assessing projects and programs seeking government funding: Cost-Effectiveness Analysis (CEA) Economic impact assessment, including Input-Output analysis and Computable General
Equilibrium (CGE) modelling Multi-Criteria Analysis. The advantages and limitations of these techniques should be considered in deciding whether they provide helpful information for decision makers. These techniques, by themselves, are of limited usefulness in assessing the net social benefit of proposals, but they may be useful to supplement information in a CBA. They do not, however, substitute for a CBA (except if it is not possible to estimate benefits, and then CEA may be a second-best option).

NSW Government Guide to Cost-Benefit Analysis (TPP17-03) 65
One variation of CEA, referred to as ‘cost utility analysis’, combines cost measured in monetary values with benefits that use a quantitative measure for what is effectively a qualitative attribute. This approach is often used in health-related initiatives55. In some cases it may be possible to assume a linear relationship between effort (expenditure) and effectiveness (outcomes) over different scales of operation. For example, if it can be established that one option is twice as effective as another, it may be possible to compare the costs of the options more easily. In other cases the equivalent effectiveness could be inferred – for example, through the application of a uniform set of physical standards. This approach should be taken with great care because uniform standards can potentially impose inefficient costs (e.g. some buildings may not all require identical physical attributes or features in order to deliver similar performance outcomes). In instances where these alternatives are not feasible, the appraisal should describe as fully as possible the effectiveness of each option. Where assumptions are made about the degree of effectiveness versus cost, the agency should provide evidence that supports the assumptions made. These assumptions could be based on post-implementation reviews of past programs, or precedents in other Australian jurisdictions or elsewhere, and may be subject to appropriate qualifications (e.g. differences in statutory or regulatory regimes among jurisdictions).
8.2 Input-Output (Multiplier) Analysis Input-Output (I-O) or Multiplier Analysis is commonly used to assess the impacts of a given project or program on income, often in reference to particular States or regions or a particular industry. In the simplest form of I-O analysis, multipliers are applied to measures of direct expenditure to give estimates of flow-on impacts (e.g. for income and employment). I-O analysis is subject to significant limitations, and extreme care should be taken in its interpretation. I-O analysis is concerned with simply measuring economic activity. It is not a tool to measure welfare in the appraisal of projects or programs, nor does it take account of the alternative uses (opportunity costs) of resources. I-O analysis does not necessarily measure net benefits. For example, poor investments in heavily subsidised fields of endeavour could be associated with greater levels of activity than good investments. Multipliers are often inappropriate for assessing impacts associated with additional (marginal) investment. Published multipliers measure the overall linkages between an industry and the remainder of the economy, and therefore represent average rather than marginal impacts. Other limitations include: Often poor quality of the data on which regional input-output models are based.
Potential double counting of impacts – Value added, income and employment impacts are alternative measures of the level of activity, and should not be added together.
Lack of supply-side constraints – Multipliers assume that extra output can be produced in one area of activity without reducing resources for other activities. This would not apply, for instance, where resources are fully employed.
The assumption that prices are fixed and that relative price changes have no impact on the allocation of scarce resources between activities, which may not always be true.
The assumption of fixed production technology, which can lead to erroneous conclusions, particularly when technology is changing rapidly.
Absence of budget constraints – As a result changes in consumption occur without reducing demand elsewhere. When in reality most consumption expenditure by households and government are budget constrained.
Multiplier impacts are based on a theoretical relationship. They cannot be considered as literal or precise, and any flow-on impacts (i.e. impacts beyond the first round effects) cannot be directly observed, measured or verified after the fact.
55 Cost-utility analysis estimates the ratio between the cost of an intervention and the benefit that the intervention generates,
where the latter is measured by Quality-Adjusted Life Years (QALYs) – a QALY value of 1.0 applies to each year lived in
perfect health, or 0.0 if dead. If not lived in full health, a QALY would be valued between 0 and 1.
NSW Government Guide to Cost-Benefit Analysis (TPP17-03) 66
I-O multipliers calculated and published by the Australian Bureau of Statistics are derived from Australia-wide and not State-specific inter-industry flows, and therefore provide estimates of national impacts only. To the extent that NSW industry structure differs significantly from the national average, the use of Australia-wide multipliers could result in misleading estimates of impacts.
Multipliers provide no indication of the timing of the impacts.
8.3 Computable General Equilibrium (CGE) Modelling A general equilibrium approach to assessing economic impacts takes a comprehensive view, and entails the use of whole-of-economy models comprising sets of equations that represent the relationships among key variables in the economy. This approach aims to estimate the effect of a change in one variable on all other interrelated variables. CGE models are an example of a general equilibrium approach and comprise a series of equations based on linkages between industries and institutional sectors of the economy (households, government and private business). These models apply resource constraints to estimate how an economy might react to changes in investments, policy or technology. CGE modelling is best used for assessing the macroeconomic impacts of a portfolio of projects/programs of significant size or a large body of reforms (e.g. competition policy reforms in the 1990s). CGE models are of limited use for microeconomic project/program appraisal, selection and ranking on the basis of social welfare. Macroeconomic parameters in CGE models may not always be directly applicable to individual programs or projects. Similar to I-O analysis, CGE models focus on the effects of exogenous changes (‘shocks’) on economic activity, income or employment. The results of I-O multiplier analysis usually imply that these changes generate only positive outcomes. The CGE models take a more comprehensive view and have the capacity to indicate whether a proposal could have negative impacts on particular industries, regions or the economy more broadly. CGE models can be used to evaluate distributive effects of a project or reform within the economy and at different levels of disaggregation – e.g. impacts on consumers and businesses at the state or national level. Care should be taken when applying CGE modelling to highly disaggregated groups, such as the regional level, due to the limited availability of quality data. While CGE models provide a more complete picture of the impact on the economy of various changes in selected policy drivers or variables, these models are subject to a number of limitations: CGE models estimate changes in economic measures that do not necessarily measure changes
in welfare. All Government programs or projects would have some beneficial economic impact in terms of an increase in expenditure, and may support employment. CGE models, however, may not always be able to assess whether a given initiative maximises social welfare.
For example, although increased employment and income are important factors, they are unlikely to be the primary objective of a hospital, a rail line or a national park. In these cases, it would be more useful for a CBA to measure the increase in social welfare arising directly from the benefits enjoyed by users of those services.
While a CGE model can show that a given program is associated with greater levels of economic activity, the costs to society of the program may outweigh the benefits associated with the increased economic activity. Depending on the structure of the model used, CGE modelling may not necessarily account for the opportunity cost associated with investment in particular programs or projects.
CGE models may not provide decision makers with an objective tool to evaluate and compare competing proposals on a ‘like-with-like’ basis.
As CGE models typically rely on historical data and are based on relatively inflexible conditions, they may not always provide a realistic forecast of the future in the context of individual projects or programs.
CGE results often reflect input assumptions applied to various sectors, i.e. the labour market. If these assumptions are defined incorrectly the results may not be realistic – e.g. if a CBA is based on CGE modelling results where the model erroneously assumes equilibrium conditions in the labour market, employment benefits attributable to the project could be misstated.
CGE may not substitute entirely for a good quality CBA, but in some cases they may be used to model inputs that can be used in CBA.

NSW Government Guide to Cost-Benefit Analysis (TPP17-03) 67
8.4 Multi-Criteria Analysis A CBA with valuations is always preferred over multi-criteria analysis (MCA). MCA may be used only in rare cases where it is not possible or practical to value costs or benefits in monetary terms. MCA entails identifying pre-defined criteria, assigning weights to them, and then scoring options, programs or projects on how well they perform against each weighted criterion. The sum of weighted scores is used to rank each program/project against others in the pool of programs or projects that are being ranked. A simpler variant could entail listing the performance criteria to be considered and assessing each option, program or project on whether or not it meets those criteria.56 A key feature of MCA is its emphasis on the subjective judgement of decision makers in establishing objectives and criteria, estimating weights to denote relative importance, and judging the qualitative contribution of each option to each performance criterion. The main benefits are that: It provides a degree of structure to the decision-making process. It can be open, explicit, relatively
simple, require less detailed information than cost-benefit or cost-effectiveness analysis and permit the decision making process to be documented for future reference.
MCA techniques are diverse in both the kinds of problem that they address (e.g. prioritisation of programs as well as single option selection) and in the techniques that they employ, ranging from decision conferencing to less resource intensive processes.
MCA has some advantages relative to informal and undocumented judgment, although it does not substitute for cost-benefit analysis or cost-effectiveness analysis.57 The main limitations of MCA are: The subjectivity or arbitrariness in setting objectives, criteria and weights creates the risk that
decision makers or subject matter experts might apply their own personal objectives, criteria and weights, which may not accord with the preferences of society as a whole.
Decision makers’ preconceptions or biases may not be readily detected or amenable to scrutiny or replication. Putting numbers on what are essentially qualitative assessments could give a false impression of scientific certainty, since the number produced by one MCA cannot be replicated or compared with the number produced by another and is not objectively testable.
MCA is not founded on any principles of welfare measurement and therefore cannot show whether a program or option adds to, or subtracts from, social welfare. Unlike CBA, MCA does not require that benefits exceed costs.
MCA carries the risk that the program/project might be inconsistent with improving welfare, and that doing nothing might in fact be preferable. In practice MCA can also inadvertently include contradictory criteria, making it difficult to interpret the results of the analysis for fiscal decision making purposes.
Use of CBA instead of MCA in areas such as environmental and social policy does not mean the criteria considered are only those which can be valued in dollars. While some categories of benefit and cost may not readily be valued, it does not follow that CBA should be abandoned in favour of other alternative methods of analysis. If CBA is not possible due to lack of information to value the costs and benefits of a proposal, it is unlikely that other methodologies will be able to address this gap.
Given its disadvantages, notably the lack of any valuation principles, MCA should not be used as a substitute for CBA. MCA may sometimes be used as a complement to CBA to clarify the pros and cons of a given decision. In these cases, information from CBA can help define criteria or weights for MCA purposes, and both techniques can draw on valuations based on other rigorous analyses (e.g. benefit transfer estimates).
56 UK Treasury, Green Book: Appraisal and Evaluation in Central Government, 2011, p.35. 57 UK Department for Communities and Local Government, Multi-Criteria Analysis: A Manual, London, 2009, pp.19-21. See
also Dobes, L, and Bennett, J, “Multi-Criteria Analysis: Good Enough for Government Work?”, Agenda, 16, 3, 2009.
Accessed at https://openresearch-repository.anu.edu.au/handle/10440/1065.

NSW Government Guide to Cost-Benefit Analysis (TPP17-03) 68
Appendix 9: Differences between CBA and Financial Appraisal
Financial Appraisal58 (FA) is a method used to evaluate the financial viability of a proposed project or program. It primarily assesses project cash flows from the perspective of the sponsoring agency or, in some cases, from a whole-of-government perspective (i.e. it includes impacts on all Government entities affected by the program).
9.1 Scope of a Financial Appraisal Depending on the scope of the proposal and the purpose for which it will be used, FA should provide sufficient details on:
Financial impacts on the sponsoring agency
For example, a Public Trading Enterprise (PTE) operating in a contestable market, where the cost of the proposal could be funded from the PTE’s internally generated funds (e.g. sales of goods and services, other income).
In this case the FA is usually intended for submission to the PTE Board or shareholding Minister in order to demonstrate the cash flow requirements of the proposal, its impact on net revenue and the financial return and costs to the PTE.
A General Government (GG) sector agency, which usually prepares a FA initially for its own
internal budgeting or service planning or project development purposes, or as part of a preliminary Business Case.
Financial impacts on all public sector entities affected by the proposal
In multi-agency programs the sponsoring agency could initially undertake high level FA showing impacts only for that agency and then subsequently do a more detailed FA after the proposal has been further developed.
At that stage the FA should assess net whole-of-government Budget impacts, usually for
purposes of seeking funding approval for the total proposal. This assessment would apply, for instance, to proposals requiring input or resourcing from two or more GG agencies, or entailing payments between agencies.
In addition to cash flows, the FA also shows the rate of return from the proposal which enables comparison of alternative commercial projects. An FA can also be undertaken to determine the Government’s funding offer to the market as part of a competitive tender process.
9.2 Differences between CBA and Financial Appraisal The building blocks of FA have many elements in common with CBA. Both CBA and FAs require quantifying the stream of costs and benefits into the future and discounting these to obtain a Net Present Value (NPV), and they typically cover the same analysis period. FAs and CBAs, however, differ in respect to the scope and the basis for valuation of the costs and benefits included in the analysis, and the discount rate used.
58
See NSW Treasury, TPP07-4: Commercial Policy Framework: Guidelines for Financial Appraisal, 2007 for further details,
including financial appraisal submission requirements.
This appendix explains the differences between CBA and Financial Appraisal. Financial Appraisal (FA) does not replace a CBA, but the results of a FA are usually reported
alongside a CBA to inform decision makers.

NSW Government Guide to Cost-Benefit Analysis (TPP17-03) 69
Discount rate A CBA uses real discount rates, while a FA uses nominal discount rates. In CBA, the real discount rate reflects the long term social opportunity cost of capital (i.e. for society collectively, including public and private sectors). In FAs, the nominal discount rate typically reflects the cost of capital to the entity undertaking the proposal – in some cases, it may reflect the required rate of return for the project. The nominal discount rate in a FA can often reflect project specific risk, whereas the social discount rate only reflects unavoidable systematic risk (i.e. it does not reflect project specific risk). Costs and benefits included A FA is done from the whole-of-government perspective of the State Budget or from the perspective of each agency involved in delivering the project or program and includes all costs including interest expenses, taxes and depreciation. In contrast, a CBA typically excludes the impact of financing costs (e.g. the payment of interest or dividends), taxes (in most cases), depreciation and amortisation on the fiscal position, because for purposes of measuring social welfare these are normally considered as transfers. Both a CBA and FA may include costs or savings to the sponsoring entity and the whole of Government. A CBA, however, also includes spill over impacts on the rest of the economy (private businesses and households), natural capital, and other impacts not necessarily priced by the market but which nonetheless affect social welfare. Basis for valuation of costs and benefits A CBA reflects the opportunity cost of resources used for the project or program. A financial appraisal does not, particularly where the actual price paid by or to the agency or government business is not a good indicator of the real value of the alternative use of the resources. A CBA shows real resource flows, while FA shows only cash flows. The discount rate and cash flows in FA are normally specified on a nominal post-tax basis. In CBA, capital expenditure is recognised as a resource cost at the time it is incurred. In FA it may be amortised over the life of the project for taxation and other purposes. Benefit and cost streams in a CBA are specified in real terms, while those in a FA are usually specified in nominal (current) terms. Conclusions that may be drawn from a Financial Appraisal Considering the methodological differences listed above, there may be cases where a CBA might justify proceeding with a proposal based on a net increase in social welfare, but the FA might show a net cost to the Budget. The opposite situation may also occur. In such cases it is essential to submit both the CBA and the FA to decision makers so that they are fully informed of any trade-offs involved in proceeding (or not) with a proposed initiative.

NSW Government Guide to Cost-Benefit Analysis (TPP17-03) 70
Appendix 10: Other Sector-Specific CBA Guidance NSW Office of Environment and Heritage (November 2015), NSW Coastal Management Manual, Part C: Coastal Management Toolkit - Using Cost–Benefit Analysis to assess Coastal Management Options: Guidance for Councils. (Released by the OEH as part of a suite of documents comprising the Coastal
Management Toolkit). (http://www.environment.nsw.gov.au/resources/coasts/150805-cost-benefit-analysis.pdf). NSW Resources and Energy (2015), “Energy Efficiency Policy: Cost-Benefit Analysis Framework Paper” (part of the Energy Savings Scheme Options Paper, Appendix A)
(http://www.resourcesandenergy.nsw.gov.au/__data/assets/pdf_file/0010/558865/part-2-options-paper-april-2015.pdf). Transport for NSW (March 2013), Principles and Guidelines for Economic Appraisal of Transport Investment and Initiatives, Appendix 4 – Economic Parameter Values and Valuation Methodologies, (http://www.transport.nsw.gov.au/sites/default/files/b2b/publications/tfnsw-principles-and-guidelines-for-economic-appraisal-of-transport-initiatives.pdf). NSW Health (May 2011), Capital Projects Economic Appraisal
(http://www1.health.nsw.gov.au/pds/ActivePDSDocuments/GL2011_006.pdf).
NSW Government (August 2015), Cost-Benefit Analysis Framework for Government Advertising and Information Campaigns
(http://www.advertising.nsw.gov.au/sites/default/files/downloads/page/nsw_advertising_cba_framework.pdf). NSW Department of Planning and Environment (December 2015), Guidelines for the Economic Assessment of Mining and Coal Seam Gas Proposals (released as part of the Government’s Integrated
Mining Policy). (http://www.planning.nsw.gov.au/Policy-and-Legislation/Mining-and-Resources/~/media/C34250AF72674275836541CD48CBEC49.ashx).
NSW Government Guide to Cost-Benefit Analysis (TPP17-03) 71
Glossary
Analysis period Time period over which a project or program is assessed, i.e. the period for
which costs and benefits are estimated.
Base Case The scenario against which proposals are compared, and which shows baseline projections of costs and benefits ‘without’ the project or program.
Benefits Increases in social wellbeing.
Benefit-Cost Ratio The ratio of the present value of a stream of benefits to the present value of costs.
Benefit transfer A method of estimating benefits based on the use of findings of previous studies on similar projects or initiatives. Commonly used for valuing health or environmental impacts for CBA.
Business as usual option
A scenario where the status quo is retained.
Conjoint analysis This method extends the contingent valuation approach to include large numbers of attributes and levels of price/quality. Focuses more on mathematical representations of rankings of attributes rather than on predicting human behavioural responses.
Consumer surplus The difference between the maximum amount that consumers are willing to pay and the actual amount they pay.
Contingent valuation A survey method to place a value on a non-market good, contingent on it being available. Willingness to pay for (or willingness to accept payment for damage to or reduction of) a good or service is treated as a proxy of the value of the good or service.
Costs Reductions in social wellbeing.
Cost-benefit analysis An appraisal and evaluation technique that estimates the costs and benefits of a project or program in monetary terms.
Cost-effectiveness analysis
A technique for comparing the costs of alternative proposals to find the minimum cost solution which achieves the given objective.
Discount rate The rate used to convert future streams of costs and benefits into today’s dollar value (present value).
Economic surplus The sum of consumer and producer surplus.
Ex-post evaluation An economic evaluation of a project or program after it has been completed. Also referred to as Post Evaluation.
Externality Any effects (positive or negative) that market exchanges have on firms or individuals who do not participate in those exchanges.
Financial analysis Appraisal of the cash flows of a project or program.
Financial benefits The cash inflows of a project or program.
Financial costs The cash outflows of a project or program.
Iterative analysis The process of assessing options over more than one round of analysis to refine and develop options as more information comes to light.
Labour surplus The difference between a worker’s actual wages received and the minimum they are willing to accept to work.
NSW Government Guide to Cost-Benefit Analysis (TPP17-03) 72
Market failure A situation where the market fails to supply a socially optimal level of a good or service.
Marginal social benefit
The benefit accruing to society from the production of an additional unit of a good or service.
Marginal social cost The cost to society from production of an additional unit of a good or service.
Monte Carlo simulation
An analytical technique for solving quantitative problems by approximating the probability of certain outcomes occurring. This is done by performing a large number of simulations based on randomly generated values of input variables specified by the modeller.
Net present value The estimated value of a stream of benefits net of costs discounted to today’s dollar value.
Options Alternative project or program proposals.
Opportunity cost The real marginal cost of a resource or action. It is the value forgone by using the resource or by acting in one way rather than another.
Producer surplus The difference between the price that a producer receives and the cost of production.
Project A planned set of interrelated tasks to deliver a specified result, service or product. A project is typically characterised by a fixed time period for delivery, with a specified budget or set of predetermined resources.
Program A set of activities managed together over a sustained period of time that aims to achieve an outcome for a client or group. In this Guide, examples of a ‘program’ include related but distinct projects in a single location (e.g. urban redevelopment), or many projects of the same type in different locations (e.g. renewal or maintenance of roads and bridges in NSW or a single local government area) or components of a similar nature staged sequentially over time (e.g. multi-year phases of a single government advertising campaign).
Project/Program bias, Optimism bias
The tendency to overestimate benefits and/or underestimate costs.
Risk Refers to situations where different possible outcomes have known probabilities.
Scenarios Alternative states of the world resulting from changes in a given variable or assumption.
Sensitivity analysis, Sensitivity test
An analysis technique that assesses the net present value of a project or program under different scenarios – for example, by varying critical assumptions. Usually presented for comparison with the central estimates to indicate a range of possible outcomes, including ‘best’ and ‘worst’ scenarios linked to sources of project risk.
Shadow price A constructed price that is intended to reflect the ‘true’ cost to society of a good or service. Used in cases where there is a wedge between the market price and the ‘true’ price.
Sunk costs Costs that have already been incurred and cannot be recovered.
Uncertainty Refers to situations where future outcomes and the probabilities of hese different outcomes are unknown.

NSW Government Guide to Cost-Benefit Analysis (TPP17-03) 73
Willingness to accept
The minimum amount that individuals or firms are willing to accept in compensation for the loss of a good or service. Often used to value the loss of an environmental good.
Willingness to donate
The maximum amount a person or business would be willing to donate in order to fund the provision of a good or service, whether or not the donor consumes the good or service.
Willingness to pay The maximum amount a person or business would be willing to pay in order to consume a good or service.
With-without principle
A comparison of the states of the world with and without the proposed Government initiative. Care should be taken not to confuse this with ‘before-after’ analysis, which is not acceptable in a CBA.