mar 2008 sayed abdall
16
-
Upload
sayed-helal -
Category
Documents
-
view
23 -
download
4
Transcript of mar 2008 sayed abdall


1- Map1- Map
2- Organization Structure2- Organization Structure
3- Trade Structure3- Trade Structure
4- Contribution by Sub Channel – Sub Channel Share of business4- Contribution by Sub Channel – Sub Channel Share of business
5- Distributors KPI’s5- Distributors KPI’s
6- AC VS Plan Monthly6- AC VS Plan Monthly
7- Brand Share of Business7- Brand Share of Business
8- ROI- Cost8- ROI- Cost
9- Monthly KPI’s9- Monthly KPI’s
10- Loyalty Scheme10- Loyalty Scheme
11-ND 11-ND
12-Growth12-Growth
13- Forecast13- Forecast


DistributorELMAHMEL
ASM E . ABDELKADER
AccountantHAYMEN SALEH
Team LeaderSAYED ABDALLAH
DSF 1ADEL SAYED
DSF 2MOHAMED ALY
Customer service3
Cashier1
Warehouse Keeper1
Workers4
DSF 2MOHAMED khlefa

DSFActive WS
Big WS WS
Semi WS
Supplier
Coffee Mill Total
Adel sayed 3 9 8 20
Mohamed aly 2 40 48 90
Mohamed kha 90 90
Sayed 2 35 53 90
Total 3 13 83 191 290

NPS Share of business
Sub channel share of business
W/S31%
active w /s2%
Big W/S47%
Semi W/S17%
Contribution by sub channel
Semi W/S66%
Big W/S4%
ACTIVE W/S2%
W/S29%

Target Act % Target Act % Target Act % Target Act % Target Act %
Adel sayed 20 20 100% 192 445 232% 48 94 196% 20 20 100% 1033708 1171039 113%
Mohamed 90 90 100% 960 954 99% 240 230 96% 90 85 94% 377122 434201 115%
SAYED 90 90 100% 960 993 103% 240 242 101% 90 86 96% 393334 388815 99%
M khalifa 90 90 100% 960 772 80% 240 192 80% 90 89 99% 125836 129024 103%
Total 2 290 290 100% 3072 3164 103% 528 566 107% 290 280 97% 1930000 2123079 110%
Elmahmel
E CO T ODist
LPC PCCoverageNo of Sales Men's

Brand Share of Business till Mar 2008
GM4%
Lux8%
Vegetar3%
Paste6%
Instant3%
T//B6%CTC
2%
Cubes13%
Dust48%
other7%
Brand Share of Business till Mar 2007
GM14%
Lux17%
Vegetar2%
Paste7%
Instant3%
T//B5%
CTC1%
Cubes10%
Dust37%
other4%

Dist GSV Discount Net Profit W.C ROI
Elmahmel 5,979,393 1% 59,794 1,000,000 5.98%
ROI Mar 2008ROI Mar 2008
Dist Actual
ExpensesGSV
Commission
Total Cost
%
Elmahmel 95,839 5,979,393 59,794 155,633 2.6%
Cost Mar 2008 Cost Mar 2008

0
50
100
150
200
250
300
Mar-07 265 76 239 220 215 157 174 236 235 196
Mar-08 290 153 265 182 257 181 176 261 168 254
Total Customer
CTC Dust T//BCube
sVeget
arInsta
ntPaste GM Lux

GSV O .P % Ach O .P GrowthCustomer Name 2008 2007 2008 2008 2008
أوالدبدوى 468,193 2,190,968 21%محفوظبكرى 206,361 1,820,556 11%
أوالدعليوة 865,319 1,825,307 47%نيازىالصباحى 174,534 1,738,766 10%
سيدالمنشاوى 367,584 1,529,171 24%عصاممسلم 355,911 1,093,657 33%شركةاآلمين 4,155 891,943 0%
المدينة 130,184 460,343 28%بهلول 139,512 436,170 32%
أوالدحجاب 147,795 417,687 35%إسماعيلمحمود 99,377 390,845 25%طيبة 127,269 388,005 33%
عمرومحمود 109,232 376,969 29%سميروهبة 140,805 362,675 39%
رزقاألزهرى 81,482 266,744 31%محمدحسن 59,702 266,559 22%جمالصابر 64,161 232,573 28%سالمةإسماعيل 63,290 230,371 27%
هانىالجمال 39,607 215,353 18%شريفوسامى 71,938 175,968 41%
TO TAL 3,417,713 15,310,630 22%

Plan 08 Ach 08 % Ach 07Growt
hAVG/ wk 08
AVG/ wk 07
6068810 6099079 100.5% 6069758 0.5% 469160 466904
2357391 3481631 148% 2869241 21% 267818 220711
1425553 1614493 113% 1565421 3% 124192 120417
1415526 619314 44% 2034350 -70% 47640 156488
Total LYL T.O
Total Foods T . O
Total P W T.O
TOTAL T.O
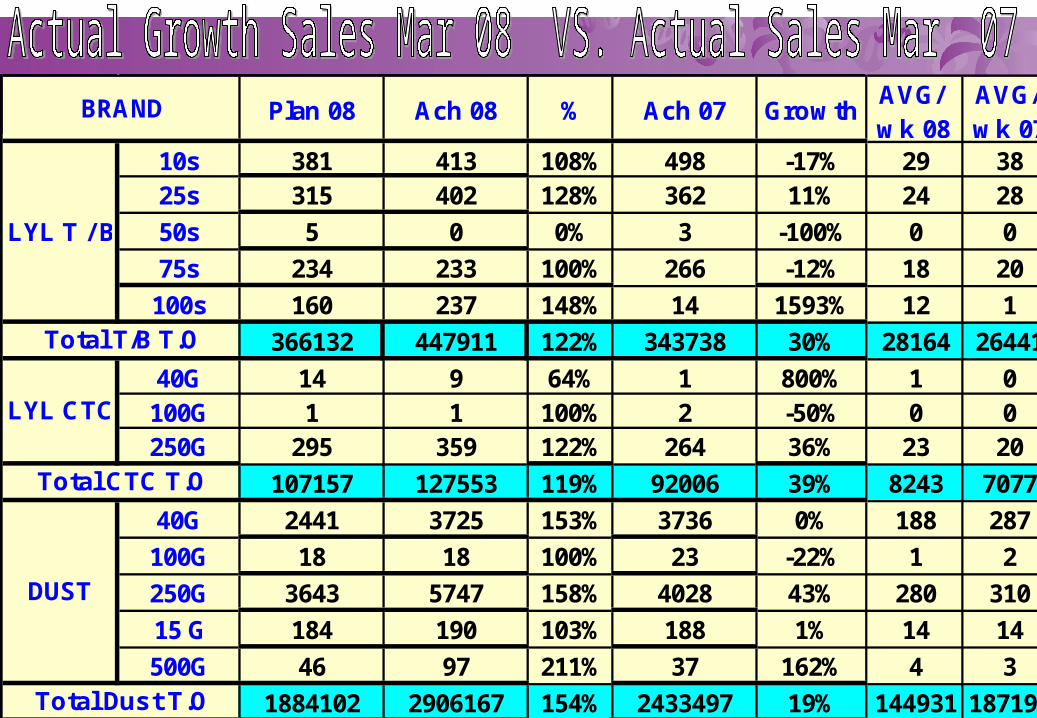
Plan 08 Ach 08 % Ach 07 GrowthAVG/ wk 08
AVG/ wk 07
10s 381 413 108% 498 -17% 29 3825s 315 402 128% 362 11% 24 28
50s 5 0 0% 3 -100% 0 0
75s 234 233 100% 266 -12% 18 20
100s 160 237 148% 14 1593% 12 1
366132 447911 122% 343738 30% 28164 26441
40G 14 9 64% 1 800% 1 0100G 1 1 100% 2 -50% 0 0250G 295 359 122% 264 36% 23 20
107157 127553 119% 92006 39% 8243 7077
40G 2441 3725 153% 3736 0% 188 287
100G 18 18 100% 23 -22% 1 2
250G 3643 5747 158% 4028 43% 280 310
15 G 184 190 103% 188 1% 14 14
500G 46 97 211% 37 162% 4 3
1884102 2906167 154% 2433497 19% 144931 187192
2357391 3481631 148% 2869241 21% 181338 220711
Total Dust T.O
Total T/B T.O
Total CTC T.O
TOTAL LYL T.O
BRAND
LYL T / B
LYL CTC
DUST

Plan 08 Ach 08 % Ach 07 GrowthAVG/ wk 08AVG/ wk 07
2 426 356 84% 318 12% 33 24
10 2215 2522 114% 2248 12% 170 173
1 3468 4277 123% 3168 35% 267 244
2 veg 53 12 23% 26 -54% 4 2
735779 831597 113% 697542 19% 56598 53657
Normal 1563 1235 79% 1305 -5% 120 100
Hot 1542 1231 80% 1148 7% 119 88
201204 159797 79% 158954 1% 15477 12227
6G 2407 2614 109% 2692 -3% 185 207
8G 821 642 78% 942 -32% 63 72
178475 175852 99% 201320 -13% 13729 15486
Jars 2104 2287 109% 2143 7% 162 165
Pouch 1941 3028 156% 3575 -15% 149 275
310095 447247 144% 507605 -12% 23853 39047
1425553 1614493 113% 1565421 3% 109658 120417
3782944 5096124 135% 4434662 15% 290996 341128
Total Foods T.O
TOTAL Foods& LYL T.O
Vegetar
Instant
Total Tomato T.O
Total Vegtar T.O
Total Instant T.O
Cubes
BRAND
Paste
Total Cubes T.O

Plan 08 Ach 08 % Ach 07Growt
hAVG/ wk 08
AVG/ wk 07
85G 11709 7891 67% 14176 -44% 607 1090
110G 2197 722 33% 8780 -92% 56 675
599274 364582 61% 1042804 -65% 28045 80216
GM 70G 33799 10641 31% 47760 -78% 819 3674
674209 204847 30% 952812 -79% 15757 73293
90G 4815 1503 31% 1010 49% 116 78
170 G 0 188 #DIV/0! 303 -38% 14 23
142043 49885 35% 38734 29% 3837 2980
1415526 619314 44% 2034350 -70% 47640 156488
5198470 5715438 110% 6469012 -12% 439649 497616
394063 217399 55% 98981 120% 16723 7614
6068810 6099079 100.5% 6069758 0.5% 469160 466904
22500000 6099079 27.1% 0ANNUAL PLAN
Total PW T.O
Total Foods & PW T.O
Total other T.O
TOTAL T.O
Lux
BRAND
Total Mist T.O
Total Lux T.O
Total GM T.O
Mist