OpenText Archiving and Document Access for SAP Solutions Whitepaper

MAPS with special reference to the
GEOLOGIC AND MINERAL MAPS OF ARIZONA
By
J. D. Forrester, Director, and Richard T . Moore, Associate Geologist
•
Bulletin 170 1962
•

Price Twenty-Five CentsFree to Residents of Arizona

MAPSWITH SPECIAL REFERENCE
TO THE
GEOLOGIC AND MINERAL MAPSOF
ARIZONA
ByJ. D. Forrester, Director,
andRichard T. Moore, Associate Geologist
Arizona Bureau of Mines
THE ARIZONA BUREAU OF MINES
Bulletin 1701962
THE UNIVERSITY OF ARIZONA PRESS. TUCSON

COPYRIGHT © 1962The Board of Regents of the Universities andState College of Arizona. All rights reserved.

FOREWORD
This bulletin of the Arizona Bureau of Mines about the nature anduse of maps has been prepared for two purposes, namely;
1. To assist the reader in comprehending how a given map may beused and interpreted most satisfactorily to gain full knowledge of theinformation being portrayed by the map.
2. To give supplementary account about the several maps that arecomponent parts of the Folio of Geologic and Mineral Maps of Arizona,issued by the Arizona Bureau of Mines and, also, to serve as a companionpiece with Bulletin 171 of the Arizona Bureau of Mines, titled; "A Resumeof the Geology of Arizona," prepared by Eldred D. Wilson, Geologist.
J. D. Forrester, DirectorArizona Bureau of Mines,University of Arizona, Tucson.August, 1962.

INTRODUCTION
A map is a symbolic or pictorial representation of particular featuresthat may be either natural or man-made and which exist throughout agiven portion of the earth's surface or crust. This being the situation, itfollows logically as a precept of map-making, that it (the map) alwaysshould be designed to show to the best advantage possible the specificphenomena which the map is designed to portray.
The more common types of maps are those that diagrammaticallydepict conditions as they would appear on the surface when viewed fromabove, as from an airplane. These maps, showing the relative positionsof features in a horizontal plane, are called "plan maps" or "areal maps."Other, more specialized diagrams may be developed also to present asectional picture such as that of an end-view or a side-view of givenphenomena. Thus, these drawings show conditions which reach in depthrather than throughout a horizontal extent, as is the case of plan maps.When they are made to depict an end-view, they are called "cross-sections"or, sometimes, "elevations"; when the diagram is prepared to demonstratea side-view, it is designated as a "longitudinal-section" or a "profile."There are several individual areal maps and cross-sections among thecollection of the Folio of Geologic and Mineral Maps issued by theArizona Bureau of Mines, but there are no longitudinal-sections.
Before proceeding further with a discussion of the maps and cross-sections that have been assembled by the Arizona Bureau of Mines, itwill be helpful perhaps to the non-professional reader to review some ofthe general or elementary rules which apply to map-making and to mapinterpretation. Therefore, the following general rules are presented aboutmaps and cross-sections:
1. As noted above, a given map always is developed to depictspecifically a condition or feature of particular interest. That is, someareal maps are made especially to show geologic conditions as they occuron the earth's surface; some are made fundamentally to demonstratetopographic features; and others are constructed to depict roads and

highway systems. Therefore, each would be designated respectively as a"geologic map," a "topographic map," and a "road map." The classifica-tion in each case is made on the basis of the fundamental feature which themap is designed to illustrate. Another type of map may be planned to showreal estate boundaries, such as are used in defining residential sub-divisionsand, in other instances, the map may be made to demonstrate the existenceof underground or surface mine excavations and it would be identifiedaccordingly as a "mine map."
It should now be apparent to the reader that the possible range oftypes of maps is very great.
In addition to the separate phenomena for which a given map isconstructed, it is often feasible and desir=ble to depict supplementaryfeatures. Thus, for example, many geologic maps frequently will indicatealso accessory topographic and cultural details, such as streams, hills,roads, and mines.
2. An important precept to be observed in all map-making is thatthe dimensions on which the map diagram is developed must be largeenough to accommodate the degree-of-exactitude and fineness-of-detailwhich are needed to show the features being portrayed. That is, if con-siderable detail is required, it is not possible to satisfactorily or properlydemonstrate the relations if the size (area) of the map is too small com-pared with the area of the region it represents. The map-maker alwaysmust take this matter into account.
It follows logically that a "Scale" must be indicated on a map inorder for a reader successfully to interpret the relationships of how dis-tances on the map are representative of distances on the ground or surface.This is done for areal maps by using anyone of three methods, as follows:
Verbal Scale: Such as, for example, by a statement on the mapthat One (1) inch equals Six (6) miles.Graphic or Bar Scale: A diagram, where distance units which arethe equivalent of field extents, are depicted as a type of "ruler."A Graphic or Bar Scale is shown in Figure. 1.Ratio or Fraction Scale: Such as, for example, where 1 : 375,000(ratio) or 375~OOO (fraction) is used. Each of these mathematicalexpressions means that a distance of one unit (inch or foot, etc.)on the map is equal to 375,000 similar units in the field.
Fig. 1. Graphic or Bar Scale.
2

On cross-sections or profile diagrams, a horizontal scale should beidentified and shown by one of the above methods and, also, becausesome exaggeration of the vertical range of the section often is required,it is necessary that the vertical scale be stated. This is done commonly byindicating the vertical distances by means of unitized "tick marks" alongthe side limits of the diagram. For further details of this matter, thereader is referred to the later discussion (page 7) about Geologic Cross-sections and to the several cross-sections which constitute a part of theFolio of Geologic and Mineral Maps of Arizona.
3. A map should have a "Title" which describes the map's identityand the phenomena it portrays. Also, the map should be dated, and theagent responsible for the map should be indicated.
In the matter of a cross-section or profile, which usually is made invertical projection, the bearing (horizontal direction) of the plane-of-projection should be defined either in the title of the plat or at some otherstrategic position on the diagram.
4. In addition to the Title, every map diagram should have an"Explanation" or "Legend" which defines the symbols that have beenused to portray the various features for which the map has been designed.
The distinctions of geologic phenomena on the County GeologicMaps issued by the Arizona Bureau of Mines, have been accomplishedchiefly by using colored line-symbols and patterns. The lighter, pastelshades of colors like yellow, pink, etc. have been used, in general, toindicate the occurrence of sedimentary rocks whereas the vivid, moreintense color patterns, such as deep red, purple, etc. have been employedfor igneous and metamorphic rock materials. This system is similar tothe one employed on most geologic maps that are issued by variousFederal and State agencies. The reader will gain further knowledge ofthe various relationships by studying the Explanation presented on eachof the County Geologic Maps.
Whenever other features of a map may require a definition of theirmeaning or significance, then such items should be explained. Forexample, on a topographic map where the relative land relief (presence ofstreams, hills and valleys) is shown by means of contour lines, the"Contour Interval" or "c.I." should be stated. A "Contour Line" is aline on the map along which all points, as they occur in the field, are atthe same elevation with respect to some datum of reference, such as sealevel. A contour line, therefore, represents a horizontal line in the field,and the contour interval is the vertical distance existing between adjacentcontour lines.
5. Wherever possible, every map should be oriented with referenceto the controls of latitude and longitude. For an areal or plan map this
3

means the diagram is made so that north-south and east-west lines ofreference are shown. Also, the common practice of map-making is todraw it (the map) so that the top of the map sheet is North. Therefore,West is to the viewer's left, East is to the right, and South is toward thebottom of the sheet.
In the case of a cross-section or profile, the top of the diagram iscomprised, of course, of the upper phenomena being portrayed. The left-hand and the right-hand sides or ends of the sketch are fixed respectivelyby the direction in which the view of the features has been taken.
GEOLOGIC AND MINERAL MAPSOF ARIZONA
Inasmuch as this treatise on maps has been prepared with specialreference to the Geologic and Mineral Maps of Arizona which, for mostconvenient use, have been assembled as a complete collection in the"Folio of Geologic and Mineral Maps of Arizona," the following discus-sion is presented in the sequence of four broad categories; each being acomponent part of the Folio, as a whole. The reader should understand,of course, that individual copies of the maps may be obtained also asseparate items from the Arizona Bureau of Mines.
The map categories are:A. Geologic Maps.B. Geologic Cross-sections.C. Outcrop Maps.D. Mineral Occurrence and Mining District Maps.
A. Geologic Maps.A Geologic Map is an areal map and is one made fundamentally to
depict the occurrences of rock materials and geologic structures existingat the surface of the earth in a particular region. Because some of thesenatural phenomena may be older than others, and, as some are of differenttypes, the distinctions that are defined on a given map are basically thoseof; 1. Establishing the kinds of rocks and/or structures which occur; and2. Classifying the relative ages of such features with respect to other asso-ciated phenomena that are present within the area encompassed by themap. These distinctions, as has been explained previously, are accom-plished by explanatory or legend symbols.
There are fourteen counties in Arizona and each has been mappedso that the geologic environment has been suitably and convenientlyrepresented on a scale of 1 : 375,000. A separate map has been made foreach county except in those cases where the size and shape of contiguous
4
counties have efficiently permitted a procedure where two counties canbe depicted together as a map unit.
Therefore, the individual County Geologic Maps of Arizona whichhave been issued by the Arizona Bureau of Mines are as follows:
1. Coconino County2. Cochise County3. Gila County4. Graham-Greenlee Counties5. Maricopa County6. Mohave County7. Navajo-Apache Counties8. Pima-Santa Cruz Counties9. Pinal County
10. Yavapai County11. Yuma County
Although the primary purpose of presenting the County GeologicMaps has been to demonstrate the geologic relationships, it has beenpossible to depict also, in a more or less subdued manner, the topographyand some cultural or man-made features. Thus, without unduly distractingthe reader's attention or hindering his interpretation of the geology, ithas been feasible to show some roads and towns and, also, major "landrelief" features such as the occurrences of significant valleys, streams, hills,and mountains. These latter natural phenomena have been portrayed byusing contour lines on a contour interval (C.I.) of 500 feet, a practicewhich has been explained previously (page 3). To have such a combinedmap showing not only the geologic conditions but the topographic fea-tures, as well, often is of special value in comprehending the naturalphysical picture of a given area. That is, the map which thus is availablefor interpretation, frequently can be used to good advantage to determinethe inter-relations of the land relief and the geologic complexities and,on the basis of the following rules, it is often possible to read almost at aglance, the significance of the essential natural phenomena as they occuron the surface. The general rules are:
1. Narrow, ribbon-like, lineated geologic exposures commonlyindicate the presence of inclined, tabular rock materials and structures.Such phenomena may be those of stratified (layered) masses or they mayrepresent the occurrence of veins (ore deposits), faults, and dikes(igneous, tabular structures). For examples of this type of phenomenon,the reader is referred to the Geologic Maps of Coconino County (36 °30'Lat. - 111°30' Long.); Apache County (35 °30' Lat., near the extremeeastern border with New Mexico) ; and Cochise County (extreme south-west corner).
5

2. Flat-lying rock masses, particularly those of recent, surficialnature, such as have been accumulated in valley areas, generally haveirregular lines of demarcation and long, tongue-like extents where theyapproach the base of adjacent higher lands. Illustrations of these featuresmay be seen to especially good advantage in the northwest portion of theGeologic Map of Gila County and in the southwest part of CochiseCounty and, also, in various other sections of the State.
3. Except in cases which the specialist will understand, the line-of-outcrop of a geologic formation usually "bends" upstream when therocks or structure are incised or cut by a transverse valley or streamchannel. This sometimes gives the appearance of a "sawtooth" effect onthe geologic map. Examples of this condition may be observed in theGeologic Maps of Coconino County (northwest portion); Navajo- ApacheCounties (36°30' Lat. - 110° Long.); and Graham County (33° Lat._110° Long.).
4. Where faulting has occurred to appreciably disturb the rocks ofthe earth's crust, the older formations of the geologic sequence which hasbeen involved in the adjustments usually are on the relative upthrown sideof the fault trace. Good illustrations of this type of phenomenon occur onthe Geologic Maps of Apache County (36° 15' Lat., approximately 10miles west of the New Mexico border); Gila County (northwest section);Yavapai County (north central portion); and Mohave County (northernsection) .
5. Irregular, often more or less circular, elliptical, or pod-like rockoutcrops are those forms generally assumed by large igneous masses suchas granite occurrences that now are exposed at the surface. Thesephenomena are demonstrated in the Geologic Maps of Yavapai County(34°45' Lat. - 112°45' Long.); Graham County (33° Lat., about 10miles east of the Pinal County border); Pinal County (33°15' Lat. -111° Long.); and Mohave County (35° Lat. -114°30' Long.).
6. A given sequence of stratified rocks, if it has been deformed intoan upwarp or "anticline" after original deposition of the strata, depictsolder rocks bounded progressively by younger ones. Conversely, thepresence of a downwarp or "syncline" is evidenced by younger rocksbounded progressively by older materials. These relations may be seenrespectively on the Geologic Map of Navajo-Apache Counties at 35°45'Lat., near the New Mexico-Arizona border, and at 36°05' Lat. - 110°Long. Also, an anticlinal structure is similarly defined on the CoconinoCounty map in the vicinity of 36°30' Lat. - 112° Long.
7. In the case of Contour (topographic) Maps, the following rulesapply:
A. Contour lines never cross each other except in very unusual
6

circumstances, such as where overhanging cliffs extensivelyexist in the field.
B. When a contour line is platted across a stream or valley, itbends or migrates upstream.
C. Contour lines "arc" around abutting hills and, depending onthe nature of the high land and the contour interval beingused, they may form closed, more or less circular or ellip-tical patterns near the tops of the hills and mountains.
D. The closer that adjacent contour lines are together, thesteeper the slope of the ground or surface. Conversely, thewider the space (horizontal) between them, the more gentlethe slope they represent.
The application of the above rules, together with some others ofmore technical nature, to the reading of geologic and topographic mapscan be an extremely interesting and entertaining activity and it is hopedthe above rather elementary discussion will cause the reader to be attractedto further interest in acquiring more complete knowledge of eventsthat have occurred in the earth's crust. Arizona shows a remarkable rangeof geologic and topographic phenomena and it is a veritable field labora-tory which is available at first hand to the professional geologist andlayman alike.B. Geologic Cross-Sections.
As previously noted, a cross-section is an end-view diagram orelevation plat and, therefore, it generally is represented as a verticalslice or cut that has been taken along a given line on the surface. It hasa vertical attitude which is in marked contrast to the horizontal projectionof an areal or plan map.
The geologist, by using a geologic-topographic map as a basereference, often can make salient cross-sectional interpretations of thegeologic relations which exist beneath the earth's surface. Therefore, givena suitable base map, it is possible to construct a vertical diagram whichdepicts the profile of the ground and, also, the position and character, indepth, of geologic features that have been observed and recorded on thesurface.
The procedure of making a cross-sectional interpretation is asfollows:
1. A decision is made as to the selection of a line on the surface ofthe areal map along which the cross-section will be constructed. This line isknown as the "line-of-section." It usually is chosen because the geologistconsiders it will constitute a good control that will result in a cross-sectional diagram which will portray especially significant or interestingphenomena beneath the surface. Thus, it is apparent the line along which
7
the cross-section is made can be fixed wherever desired in order to showparticular relations of special interest, for one purpose or another.
2. In the next step, by an engineering process of correlating theelevations of the ground occurring along the line-of-section with an inter-pretation of the geologic relations, it is possible to design a depth pro-jection which forms the geologic cross-section. In order to accomplishsuch a process of interpretation and construction, and to depict satisfac-torily the various relations, it often is necessary to exaggerate the verticalscale of the diagram. If some exaggeration is not done, even though theprocess results in a degree of distortion of the true picture, the verticalrange is so limited that it usually is not possible to show the details of thegeologic phenomena with sufficient clarity.
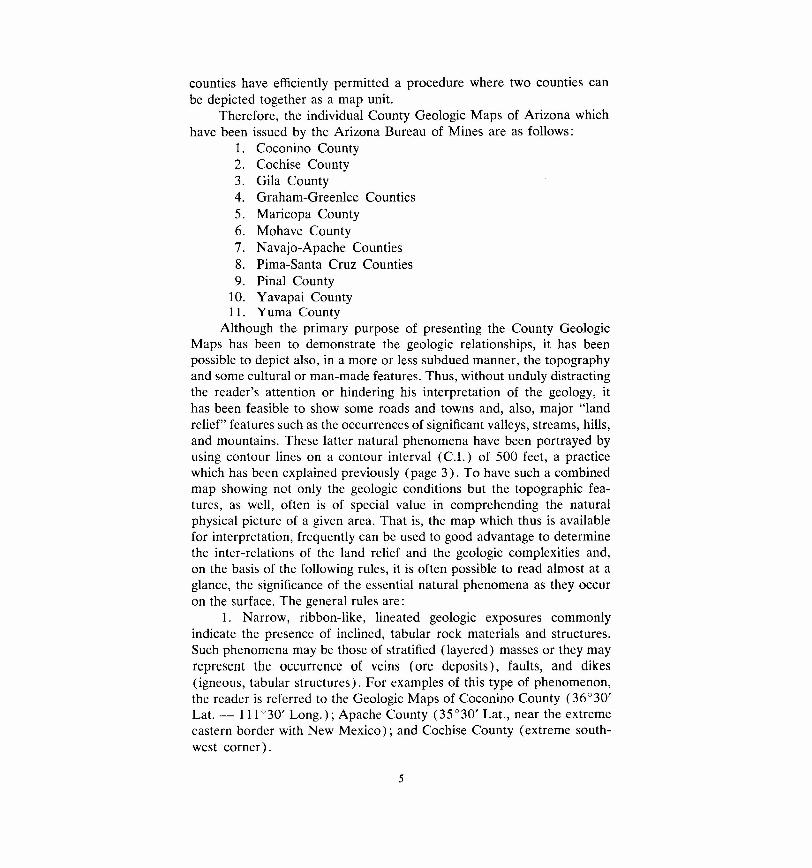
By comparatively studying the diagrams of Figures 2 and 3, thereader will comprehend some of the effects which ensue when exag-geration is, or is not, undertaken.
Figure 2 shows a cross-section where no exaggeration has been made.Therefore, the horizontal and vertical scales are equal at 1 : 375,000.This is the scale (horizontal) of the County Geologic Maps that haveserved as the work bases for construction of the geologic cross-sectionswhich have been prepared by the Arizona Bureau of Mines.
10000' ~
QTs
o 10 Miles~~~~~~--------~--------~,
Horizontal Sects
Fig. 2. Geologic Cross-section.
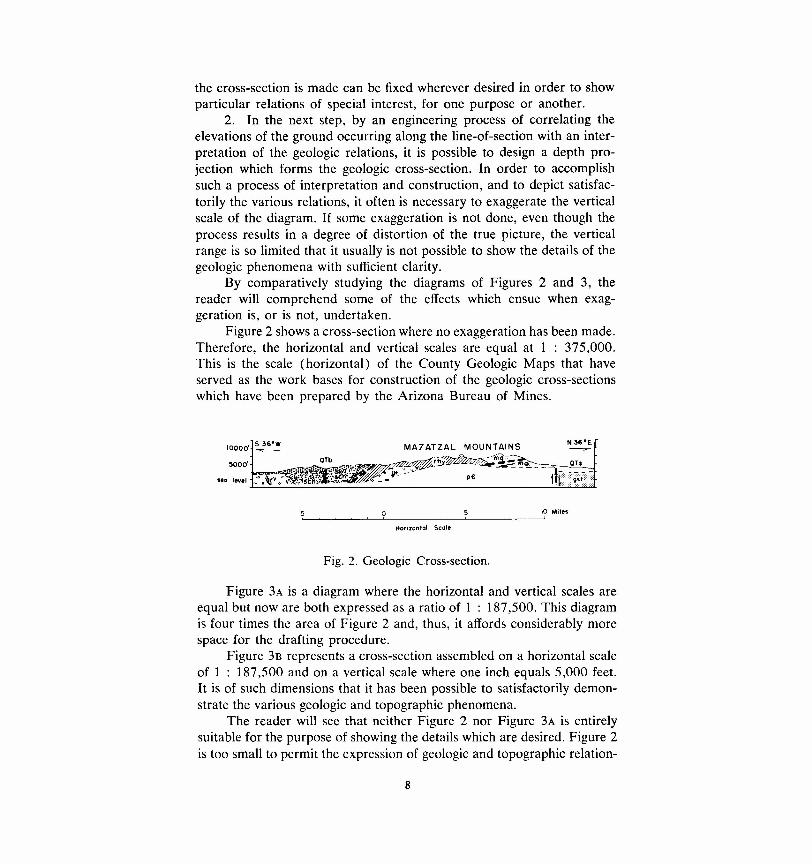
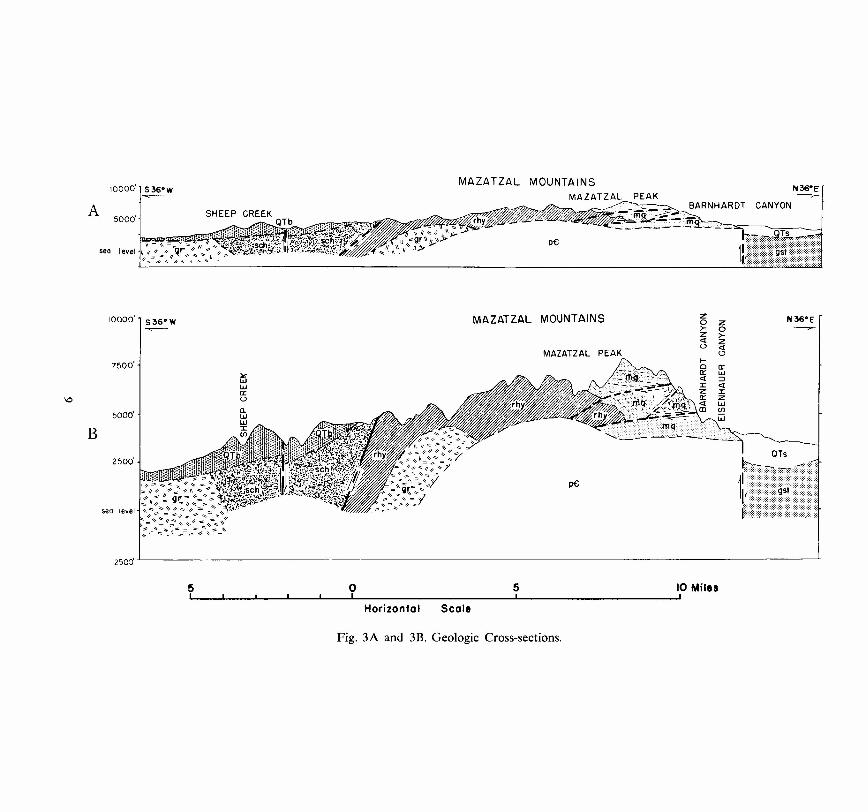
Figure 3A is a diagram where the horizontal and vertical scales areequal but now are both expressed as a ratio of 1 : 187,500. This diagramis four times the area of Figure 2 and, thus, it affords considerably morespace for the drafting procedure.
Figure 3n represents a cross-section assembled on a horizontal scaleof 1 : 187,500 and on a vertical scale where one inch equals 5,000 feet.It is of such dimensions that it has been possible to satisfactorily demon-strate the various geologic and topographic phenomena.
The reader will see that neither Figure 2 nor Figure 3A is entirelysuitable for the purpose of showing the details which are desired. Figure 2is too small to permit the expression of geologic and topographic relation-
8
10000'1 S36°W~MAZATZAL MOUNTAINS
A5000'
\\,.... \\=_",,~- 7i
I~~Z~:If;':~,~~:~\~I!~~
PEAKN36°E~
CANYON
sea level
sea
250dL'------------------------------------------------------------------------------------------------------
5 0 5 10 Miles, I I I I I I ,
Horizonfal Scale
Fig, 3A and 3B, Geologic Cross-sections.
j~t::/E~;g:~\~{:~-x-
fevel~\\"","_:::::"3'q.:=, ~ = _~ )X~
i~::~~:~~;:~:i
MAZATZAL MOUNTAINS zo>-Z<!o
zo>-Z<!o
N36°E10000'1 S 36° W~
MAZATZAL PEAK
5000'
7500'
ID
B
2500'

ships with sufficient clarity. For example, it is not possible to display thecomplex pattern of faulting known to be present in the eastern part of theMazatzal Mountains and considerable generalization is required. InFigure 3A, although the major faults are shown, the details of folding in therocks must be omitted because there is insufficient vertical space to allowfor the plotting of these features. Therefore, in order to depict thesectional relations to proper advantage, the horizontal and vertical scaleswhich have been applied in Figure 38 have been used for constructingthe Geologic Cross-sections issued by the Arizona Bureau of Mines. Thishas been deemed necessary even though considerable distortion of theattitude of the rocks and structural features has been introduced by theapproximately three-fold exaggeration of the vertical scale.
The cross-sectional diagrams assembled by the Arizona Bureau ofMines have been made along several lines-of-section in the State andthey are incorporated in the Folio of Geologic and Mineral Maps ofArizona. They have been designated as Sections 1 through 8 and eachhas been selected to demonstrate especially strategic information con-cerning the sub-surface geologic relations. The direction-of-view in allof the cross-sections is in a northerly direction.
An Index Map, showing the various lines-of-section, has beendeveloped as a plan map and it is made available also so the reader canreadily identify the significance and scope of each of the sections.C. Outcrop Maps.
The Maps of Outcrops of various rock materials in Arizona are atype of areal map and they have been developed as a convenient meanswhereby the present occurrence and distribution are shown of rocksformed during particular times of the geologic past. Thus, each of thesemaps depicts only the current existence of rocks which were depositedat some definitive time interval of the earth's history. The chief value ofsuch a map lies in the fact that the reader is able to grasp "at a glance" thegeographic distribution of certain rock materials because the picture oftheir occurrence is not complicated by the illustration of rocks formedduring either an earlier or a later age.
The Outcrop Maps of the Folio of Geologic and Mineral Maps ofArizona are:
1. Map of Outcrops of Precambrian Rocks in Arizona.2. Map of Outcrops of Paleozoic and Mesozoic Rocks
in Arizona.3. Map of Outcrops of Laramide (Cretaceous-Tertiary)
Rocks in Arizona.4. Map of Outcrops of Tertiary and Quaternary Igneous
Rocks in Arizona.
10

The further significance of each of the above maps is treated in thediscussions of Bulletin 171 of the Arizona Bureau of Mines, titled; "AResume of the Geology of Arizona."
D. Mineral Occurrence and Mining District Maps.
Three separate areal maps, each on a scale of 1 : 1,000,000, whichis the equivalent of one inch (map) to approximately 16 miles (field),have been issued by the Arizona Bureau of Mines to assist the reader ingaining a knowledge of the distribution of some of the economic mineralsubstances in Arizona. These maps are:
MAP OF KNOWN METALLIC MINERAL OCCURRENCES IN ARIZONA.
This map shows the general distribution of metallic mineral materialsoccurring in the State of Arizona. The various known occurrences ofdifferent mineral substances are depicted and distinguished by means ofcolor-block symbols which are defined by a reference legend and indexon the map. The information imparted by this map gives no measure ofpotential quantity or relative value of the deposits of the different sub-stances. Twenty-nine separate types of metallic materials are platted.
MAP OF KNOWN NONMETTALIC MINERAL OCCURRENCE IN ARIZONA.
This is a companion piece to the Map of Known Metallic MineralOccurrences of Arizona and its format is very similar. That is, by meansof color symbols which are comprehensively indexed, the occurrence of50 types of economic nonmetallic or industrial mineral substances isdemonstrated over the State. Just as in the case of the Map of KnownMetallic Mineral Occurrences, this chart gives no ready measure of therelative quantity of the various mineral commodities.
MAP AND INDEX OF MINING DISTRICTS IN ARIZONA.
The Map and Index of Mining Districts of Arizona has been com-piled to serve as a reference whereby the general location and specificnames of the several mining districts of the state can be identified. Becauseof the complex and overlapping nature of the many districts, it has notbeen practicable to delineate the individual boundaries of the units.
The records of mining claim locations and mineral property owner-ships occurring within the limits of the respective counties of Arizonagenerally are kept in the County Recorder's office at the County Seat.Therefore, to give assistance in identifying places where such recordsrepose, the county borders and the names of the county seats have beendefined in red on the map.
II

ARIZONA BUREAU OF MINESJ. D. FORRESTER,Director
T. G. CHAPMAN,Director Emeritus H. W. PEIRCE,Assistant MineralogistG. R. FANSETT,Mining Engineer Emeritus G. H. ROSEVEARE,MetallurgistR. T. MOORE,Associate Geologist F. L. STUBBS,Assistant Mining EngineerR. T. O'HAIRE,Assistant Mineralogist E. D. WILSON,Geologist
N. J. YOUNG,Draftsman Statistics Clerk
SERVICES AVAILABLE FROM ARIZONA BUREAU OF MINESTHE UNIVERSITY OF ARIZONA, TUCSON, ARIZONA
The Arizona Bureau of Mines, which functions as a part of the University ofArizona, Tucson, is conscious of its opportunities and responsibilities to render con-tinuing service about mineral resources to the people of Arizona; accordingly it has aprogram of operation designed to contribute as many sound benefits as possible. Thebroad objectives of this program are to:
1. Prepare and publish bulletins and circulars containing authoritative informa-tion on a wide range of topics of interest to prospectors, miners, and others concernedwith the development of Arizona's mineral resources and industries. The bulletinsare distributed free of charge to residents and at cost to non-residents of Arizonaupon request.
2. Classify mineral and rock specimens. Besides identifying rocks and givingthe composition of minerals, the Bureau makes qualitative tests for important ele-ments and answers inquiries concerning the probable market for and the economicvalue of material similar to samples submitted. This service is furnished free of chargeproviding the specimens originate within the State of Arizona; a charge of $1 perspecimen is made for samples submitted from outside the State. When spectrographicanalyses or detailed microscopic determinations are desired, they are furnished atestablished rates, a schedule of which will be submitted on request.
3. Conduct laboratory and pilot-plant metallurgical testing of mineral substancesin cooperation with industries and individual mine operators in the State. Such testsare conducted on the basis of nominal charges to compensate for wear and depreciationof equipment needed in the experimentation.
4. Make geologic investigations of mining districts and counties and compilegeologic maps and reports. Geologic maps of each county, on a scale of 1:375,000,have been issued. As a product that will result from the compilation of data for thecounty map issues, a new Geologic Map of the State, as a whole, will be establishedon a scale of 1:500,000. It is hoped that this map can be finished in 1962.
5. Maintain a working file of statistical records of mineral production in Arizona.6. Develop well-log storage facilities and a library of data pertaining to oil and
water wells drilled in Arizona.7. Conduct state-wide commodity studies as to modes of occurrence and poten-
tial industrial value of various mineral materials.8. Collect and file items relating to Arizona mines and minerals that appear
in Arizona newspapers and in many technical periodicals.The basic philosophy which obtains in the operation of Arizona Bureau of Mines
is that of providing for the people of Arizona mineral services which cannot be readilysecured elsewhere. That is, the Bureau gives advice and service which cannot beobtained conveniently from commercial sources. Competition with industrial con-cerns is not engaged in and therefore, any work of this nature, such as assaying, isnot pursued. An inquiry addressed to the Director, Arizona Bureau of Mines, theUniversity of Arizona, Tucson, will bring a prompt response if further informationis desired about the services which are available.
All communications should be addressed and remittances made payable to theArizona Bureau of Mines. The University of Arizona, Tucson, Arizona.