Mapping the habitats of NSW estuaries
97
Mapping the habitats of NSW estuaries R.G. Creese, T.M. Glasby, G. West, C. Gallen Industry & Investment NSW Port Stephens Fisheries Institute Locked Bag 1, Nelson Bay, NSW 2315, Australia Report to the Hunter Central Rivers Catchment Management Authority HCRCMA Project No. HCR 07_458 September 2009 Industry & Investment NSW – Fisheries Final Report Series No. 113 ISSN 1837-2112
Transcript of Mapping the habitats of NSW estuaries

Mapping the habitats of NSW estuaries
R.G. Creese, T.M. Glasby, G. West, C. Gallen
Industry & Investment NSW Port Stephens Fisheries Institute
Locked Bag 1, Nelson Bay, NSW 2315, Australia
Report to the Hunter Central Rivers Catchment Management Authority HCRCMA Project No. HCR 07_458
September 2009
Industry & Investment NSW – Fisheries Final Report Series
No. 113 ISSN 1837-2112

Mapping the habitats of NSW estuaries
September 2009
Authors: Bob Creese, Tim Glasby, Greg West, Chris Gallen
Published By: Industry & Investment NSW (now incorporating NSW Department of Primary Industries)
Postal Address: Port Stephens Fisheries Institute, Locked Bag 1, Nelson Bay, NSW 2315
Internet: www.industry.nsw.gov.au
Department of Industry and Investment (Industry & Investment NSW)
This work is copyright. Except as permitted under the Copyright Act, no part of this reproduction may be reproduced by any process, electronic or otherwise, without the specific written permission of the copyright owners. Neither may information be stored electronically in any form whatsoever without such permission.
DISCLAIMER
The publishers do not warrant that the information in this report is free from errors or omissions. The publishers do not accept any form of liability, be it contractual, tortuous or otherwise, for the contents of this report for any consequences arising from its use or any reliance placed on it. The information, opinions and advice contained in this report may not relate to, or be relevant to, a reader’s particular circumstance.
ISSN 1837-2112
Note: Prior to July 2004, this report series was published by NSW Fisheries as the ‘NSW Fisheries Final Report Series’ with ISSN number 1440-3544. Then, following the formation of the NSW Department of Primary Industries the report series was published as the ‘NSW Department of Primary Industries – Fisheries Final Report Series’ with ISSN number 1449-9967. The report series is now published by Industry & Investment NSW as the ‘Industry & Investment NSW – Fisheries Final Report Series’ with ISSN number 1837-2112.

Contents i
Mapping the habitats of NSW estuaries – Creese, Glasby, West & Gallen
TABLE OF CONTENTS
TABLE OF CONTENTS .................................................................................................................................I
LIST OF TABLES.......................................................................................................................................... II
LIST OF FIGURES........................................................................................................................................ II
LIST OF APPENDICIES..............................................................................................................................III
ACKNOWLEDGEMENTS ..........................................................................................................................IV
EXECUTIVE SUMMARY ............................................................................................................................. 5
1. INTRODUCTION................................................................................................................................... 7 1.1. Mapping marine habitats............................................................................................................... 7 1.2. Mapping NSW estuaries ................................................................................................................ 8
1.2.1. Classifying estuaries.............................................................................................................. 8 1.2.2. Estuarine macrophytes.......................................................................................................... 8 1.2.3. Rocky reefs .......................................................................................................................... 11
1.3. Objectives of the project .............................................................................................................. 12
2. ESTUARINE MACROPYTES ............................................................................................................ 13 2.1. Methods ......................................................................................................................................... 13 2.2. Results............................................................................................................................................ 15
2.2.1. General................................................................................................................................ 15 2.2.2. Northern Rivers CMA.......................................................................................................... 15 2.2.3. Hunter/Central Rivers CMA................................................................................................ 19 2.2.4. Hawkesbury Nepean CMA .................................................................................................. 26 2.2.5. Sydney Metropolitan CMA.................................................................................................. 30 2.2.6. Southern Rivers CMA.......................................................................................................... 37
3. HARD SURFACE HABITATS IN ESTUARIES............................................................................... 43 3.1. Methods ......................................................................................................................................... 43
3.1.1. Foreshore habitats .............................................................................................................. 43 3.1.2. Subtidal rocky reef .............................................................................................................. 47
3.2. Results............................................................................................................................................ 51 3.2.1. Intertidal foreshore ............................................................................................................. 51
Port Stephens ............................................................................................................................... 51 Cowan Creek/Broken Bay ........................................................................................................... 51 Pittwater ....................................................................................................................................... 51 Port Jackson ................................................................................................................................ 51 Port Hacking................................................................................................................................ 51 Batemans Bay .............................................................................................................................. 51
3.2.2. Subtidal rocky reef .............................................................................................................. 64 Port Stephens ............................................................................................................................... 66 Cowan Creek/Broken Bay ........................................................................................................... 66 Pittwater ....................................................................................................................................... 66 Port Jackson ................................................................................................................................ 67 Port Hacking................................................................................................................................ 67 Batemans Bay .............................................................................................................................. 67
4. DISCUSSION AND FUTURE DIRECTIONS ................................................................................... 74 4.1. Implications of findings................................................................................................................ 74 4.2. Future directions........................................................................................................................... 80 4.3. Priorities for coastal CMA investment in estuarine projects.................................................... 82
5. REFERENCES...................................................................................................................................... 85
6. APPENDICIES...................................................................................................................................... 90

ii Contents
Mapping the habitats of NSW estuaries – Creese, Glasby, West & Gallen
LIST OF TABLES
Table 1. Habitat attributes used in the mapping of NSW estuarine macrophytes. ................................... 13 Table 2. Area of estuarine macrophytes in the estuaries of the Northern Rivers CMA, also showing
which estuarine macrophytes are present................................................................................... 16 Table 3. Area of estuarine macrophytes in the estuaries of the Hunter Central Rivers CMA, also
showing which estuarine macrophytes are present .................................................................... 19 Table 4. Area of estuarine macrophytes in the estuaries of the Hawkesbury Nepean CMA , also
showing which estuarine macrophytes are present. ................................................................... 26 Table 5. Area of estuarine macrophytes in the estuaries of the Sydney Metropolitan CMA, also
showing which estuarine macrophytes are present. ................................................................... 30 Table 6. Area of estuarine macrophytes in the estuaries of the Southern Rivers CMA, also showing
which seagrass species are present. ........................................................................................... 38 Table 7. Intertidal foreshore substratum categories. ................................................................................ 44 Table 8. Biogenic habitat categories recorded for subtidal rocky reefs. .................................................. 48 Table 9. Details of imagery and techniques used for mapping foreshore and subtidal habitats in
selected NSW estuaries. ............................................................................................................ 48 Table 10. Percent of intertidal foreshore habitats mapped for each estuary. ............................................. 52 Table 11. Presence or absence of subtidal habitats per estuary and total area of reef mapped. ................. 64 Table 12. Summary of condition scores for estuarine macrophytes under the NSW MER program. ........ 74 Table 13. The extent of the seagrass Posidonia australis recorded during two state-wide surveys in the
1980s (West et al. 1985) and the 2000s (Williams et al. 2007 and this project). ...................... 76 Table 14. Cumulative area of NSW estuaries invaded by Caulerpa taxifolia, expressed as the sum of
all areas where it has been recorded since its initial discovery.................................................. 79
LIST OF FIGURES
Figure 1. The seagrasses Zostera capricorni and Posidonia australis growing together in Port Stephens....................................................................................................................................... 9
Figure 2. Mangrove trees lining Cowan Creek at Bobbin Head................................................................ 10 Figure 3. A saltmarsh meadow merging into a mangrove community at the upper tidal levels of
Kooragang Island, Hunter River. ............................................................................................... 11 Figure 4. The field mapping system used to verify preliminary macrophyte maps. .................................. 14 Figure 5. An example of a diverse arrangement of estuarine macrophytes in the NRCMA region –
Camden Haven .......................................................................................................................... 17 Figure 6. An example of a largely closed system without seagrass in the NRCMA region – the Lake
Innes/Lake Cathie system. ......................................................................................................... 18 Figure 7. Macrophytes of Port Stephens. .................................................................................................. 20 Figure 8. Estuarine macrophytes of the Hunter River illustrating the absence of any seagrass................. 21 Figure 9. Estuarine macrophytes of Lake Macquarie................................................................................ 22 Figure 10. Estuarine macrophytes of the Tuggerah Lakes system showing the extensive fringing
seagrass beds (mainly Zostera) that are a feature of this estuary. .............................................. 23 Figure 11. Wamberal and Cockrone Lakes on the NSW Central Coast contain only the seagrass Ruppia
megacarpa, but Avoca Lagoon is totally devoid of any macrophytes and Terrigal Lagoon only has a very small area of mangroves. .................................................................................. 24
Figure 12. The diverse estuarine macrophytes of the Brisbane Waters system........................................... 25 Figure 13. Estuarine macrophytes of Cowan Creek, a significant sub-catchment of the estuarine portion
of Hawkesbury River ................................................................................................................. 27 Figure 14. Estuarine macrophytes of Pittwater. .......................................................................................... 28 Figure 15. Estuarine macrophytes of the Hawkesbury River ‘estuary’. ...................................................... 29 Figure 16. Estuarine macrophytes of Narrabeen and Dee Why Lagoons.................................................... 31 Figure 17. Estuarine macrophytes of Manly Lagoon. ................................................................................. 32 Figure 18. Estuarine macrophytes of Port Jackson and its tributaries – Parramatta River, Lane Cove
River and Middle Harbour Creek. ............................................................................................. 33

Contents iii
Mapping the habitats of NSW estuaries – Creese, Glasby, West & Gallen
Figure 19. Estuarine macrophytes of Georges River. ..................................................................................34 Figure 20. Estuarine macrophytes of Botany Bay showing the very diverse arrangement of habitats
around Towra Point, west of Kurnell. ........................................................................................35 Figure 21. Estuarine macrophytes of Port Hacking. ....................................................................................36 Figure 22. An example of the estuarine macrophytes of the SRCMA region – Lake Illawarra...................40 Figure 23. Another example of estuarine macrophytes in the SRCMA region – Shoalhaven River............41 Figure 24. An example of the very diverse estuarine macrophyte arrangement in St Georges Basin..........42 Figure 25. Artificial rock wall. ....................................................................................................................45 Figure 26. Horizontal rock platform............................................................................................................45 Figure 27. Cobble/boulder foreshore...........................................................................................................46 Figure 28. Vertical rock platform................................................................................................................46 Figure 29. The habitat ‘Macroalgae’, showing the kelp Ecklonia radiata and Sargassum sp.....................49 Figure 30. The habitat ‘Turfing algae’, dominated by the brown seaweed Zonaria sp. and the red
coralline alga Amphiroa anceps. ................................................................................................49 Figure 31. The green seaweed Caulerpa filiformis which can cover large areas on shallow subtidal
reefs, often adjacent to sand, and often a distinctive habitat. .....................................................50 Figure 32. The habitat ‘Sessile invertebrates’, showing a diverse assemblage of sponges, ascidians, soft
corals and bryozoans..................................................................................................................50 Figure 33. Extent of shoreline in Port Stephens for which foreshore habitat has been mapped ..................53 Figure 34. Foreshore habitat classes mapped in Port Stephens. ..................................................................54 Figure 35. Extent of shoreline mapped in Cowan Creek/Broken Bay and Pittwater. ..................................55 Figure 36. Foreshore habitat mapped for Cowan Creek. .............................................................................56 Figure 37. Foreshore habitat for Pittwater...................................................................................................57 Figure 38. Extent of shoreline in Port Jackson in which foreshore habitat has been mapped. ....................58 Figure 39. Foreshore habitat mapped in Port Jackson.................................................................................59 Figure 40. Extent of shoreline in Port Hacking in which foreshore habitat has been mapped.....................60 Figure 41. Foreshore habitat in Port Hacking..............................................................................................61 Figure 42. Extent of shoreline in Batemans Bay in which foreshore habitat has been mapped...................62 Figure 43. Foreshore habitat in Batemans Bay............................................................................................63 Figure 44. Side scan sonar image showing subtidal rock shelf....................................................................65 Figure 45. Side scan sonar image showing subtidal boulder reef. ...............................................................65 Figure 46. Side scan sonar image of the sunken HMAS Psyche in Port Stephens. .....................................66 Figure 47. Mapped subtidal reef in Port Stephens.......................................................................................68 Figure 48. Mapped subtidal reef in Cowan Creek. ......................................................................................69 Figure 49. Mapped subtidal reef in Pittwater. .............................................................................................70 Figure 50. Mapped subtidal reef and habitats in Port Jackson. ...................................................................71 Figure 51. Mapped subtidal Reef in Port Hacking. .....................................................................................72 Figure 52. Mapped subtidal reef in Batemans Bay......................................................................................73 Figure 53. Changes over 8 decades in the extent of 3 estuarine macrophytes in Port Hacking. ..................75 Figure 54. Holes created in a bed of Posidonia australis by boat moorings in Lake Macquarie. ...............78 Figure 55. The invasive Caulerpa taxifolia growing amongst sparse Zostera sp........................................78 Figure 56. The helicopter-based mapping system that is being trialled for use in the more detailed
mapping of high priority seabed habitats in NSW. ....................................................................81 Figure 57. Framework for qualitative ecological risk analysis for estuarine habitats. .................................83
LIST OF APPENDICIES
Appendix 1. 1:25000 map series index for the coastal habitats of NSW........................................................90

iv Acknowledgements
Mapping the habitats of NSW estuaries – Creese, Glasby, West & Gallen
ACKNOWLEDGEMENTS
Several people within the Aquatic Ecosystems unit of the Industry & Investment NSW assisted with the digital mapping work, with field verification and with production of this technical report. Special thanks go to Isabelle Thiebaud, Roger Laird, James Van Den Broek, Brooke McCartin, Victoria Gladstone, Peter Gibson, Christina Venables, Trudy Walford and Richele West. Karen Astles provided the draft risk assessment framework. Brian Hughes from the Hunter Central Rivers CMA was responsible for project management, and his tireless efforts and continued enthusiasm helped make this a very enjoyable and worthwhile endeavour. Valuable input was provided by members of the project steering committee (Bill Gladstone, Tim Pritchard, Russ Glover, Jeff Palmer and Glen Lyons), and this was always greatly appreciated. Alan Jordan from the NSW Department of Environment, Climate Change and Water is particularly thanked for his input and advice at all stages of the work. Some of the aerial photographic imagery used in the mapping work was provided by Lake Macquarie City or the Sydney Metropolitan CMA. The majority of the funding was provided by the Australian Government through the Natural Heritage Trust. Some additional funding for estuarine reef mapping was provided by the NSW Government via Catchment Action NSW. Funding from the Sydney Metropolitan Catchment Management Authority was used to produce a preliminary map of subtidal reefs in Port Jackson which was augmented as part of the current project. This report is dedicated to Robert Williams, seen below enjoying a pensive moment among the mangroves on Kooragang Island, Hunter river. Rob has been a key figure in promoting the need for habitat mapping within NSW estuaries for a long time. He was one of the authors of the seminal ‘West et al.’ report of 1985. He has been a tireless champion for the need to collect high quality quantitative data from our estuarine ecosystems and to use those data to promote better management of our valuable estuarine resources. The estuarine mapping component of the Comprehensive Coastal Assessment, in many ways the precursor for this project, was his brainchild. He was an adviser during the early stages of this project before his retirement from the NSW Department of Primary Industries in mid 2008. We thank Rob for his critical review of the draft of this report. But more than that, his general words of wisdom are always greatly appreciated. His continued enthusiastic support for this line of work is acknowledged, and we hope that he will continue to maintain an active interest in the ecology of NSW’s estuaries.

Executive Summary 5
Mapping the habitats of NSW estuaries – Creese, Glasby, West & Gallen
EXECUTIVE SUMMARY
The health of the estuaries of NSW is something that needs constant consideration and attention. The NSW Natural Resource Commission has set a target that requires that “By 2015 there is an improvement in the condition of estuaries and coastal lake ecosystems”. Coastal CMAs in NSW also have targets in their Catchment Action Plans related to maintaining or improving the health of estuaries. An important component of estuarine condition is the status of the key biogenic habitats in estuaries – their seagrass, mangrove and saltmarsh communities, collectively known as macrophytes. Having comprehensive data about the extent of these habitat types is a fundamental first step to being able to assess trends through time, and hence assess whether condition is, in fact, improving. The primary objective of the estuarine component of the Seabed Mapping project was to complete a state-wide GIS inventory of these 3 habitats, a task that was started during the Comprehensive Coastal Assessment (CCA). The CCA had adopted a rigorous protocol for recording the extent of estuarine macrophytes and had mapped them in estuaries north of Newcastle and south of Wollongong. However, this had left a significant knowledge gap along the central part of the NSW coast, a region that contained several very large drowned river systems (Hawkesbury River, Port Jackson) and the state’s largest coastal lake (Lake Macquarie). The task of finalising the state-wide inventory was completed using a combination of interpreted aerial photographs and field surveys. The inventory now contains a standardised GIS layer for the macrophytes in 154 estuaries. It is often not possible to directly assess estuarine biodiversity without a very large amount of sampling effort. As long as the limitations of the approach are acknowledged, habitats can provide a suitable surrogate for biodiversity. The extent and diversity of estuarine habitats in a particular area can be expected to reflect the biological diversity in that area. It has long been recognised that seagrass beds and mangrove forests provide an important nursery habitat for fishes – not just those that spend all their lives in estuaries, but also those which leave estuaries as juveniles and then live in offshore habitats. Saltmarsh also is important, less as a nursery area for fishes but more as a highly productive intertidal habitat providing food for fishes and foraging shorebirds. Declines in the spatial extent of these habitats within an estuary or region, therefore, might indicate a reduction of the important ecosystem services they provide. Having a comprehensive baseline for these habitats is an important first step in being able to manage them better to conserve estuarine biodiversity. While macrophytes are acknowledged as being a major contributor to the habitat structure in estuaries, non-biogenic structures such as subtidal reefs, intertidal rocky shores and shallow sediment flats are also important as habitats for estuarine biodiversity. Further, many NSW estuaries contain increasing amounts of non-natural hard surfaces as a result of human activities in estuaries. Artificial rock walls, wharves, jetties, marinas, etc. all provide structural habitat, especially in estuaries that are also major ports and/or are highly urbanised. Natural hard surfaces can increase the diversity of native plants and animals in estuaries, but artificial hard surfaces may also attract large numbers of introduced marine species. During this project, a protocol was developed for recording these hard surfaces. The technique uses a combination of aerial photograph interpretation (as for the macrophyte habitats), field surveys, side scan sonar and underwater video to delineate a set of foreshore features and rocky reef sub-habitats. This methodology is analogous to that used to map offshore habitats in deeper water, something that was done in the companion marine component of this Seabed Mapping project. The technique was piloted in 6 estuaries in the central and southern regions of the NSW coast where large amounts of hard surface habitat was known or suspected. The information was

6 Executive Summary
Mapping the habitats of NSW estuaries – Creese, Glasby, West & Gallen
recorded in a GIS and can be readily used in conjunction with other GIS layers (including estuarine macrophytes) to assess the relative biodiversity values of an estuary or region. Because the estuarine and marine habitat mapping work was done concurrently and because both components used complementary habitat classifications and recording standards, it is now possible to combine all the information in a common GIS. One of the key outputs from this project is a new set of 1:25000 scale maps which show detailed bathymetrical, topographical and habitat information for the entire NSW coast from the upper tidal limit of estuaries out to the 3 nautical mile limit of state waters. These maps can continually be updated as new information is gathered and added into the underlying GIS. While these products are valuable in their own right in terms of providing a comprehensive description of the NSW coast, perhaps the greatest value of the GIS is that it provides a solid framework for making decisions about management actions needed to meet the state-wide target set for estuaries. As data were being collected on the spatial extent of the habitats being mapped, thought was also going into understanding the connectivity of the habitats and their juxtaposition with the wide range of threats that face estuarine biodiversity. The best way to synthesise and use all this information to determine priorities for management action is to do a risk analysis, and suitable frameworks for doing such analyses in coastal ecosystems have been developed in recent years. This can now readily be done in an explicit spatial context by using the habitat maps generated during this project (and preceding ones), in conjunction with knowledge about how and where the threats operate, to generate vulnerability values for key estuarine habitats. When these values are considered in the risk assessment framework, it will be possible in the future to provide management agencies the means by which they can assign relative values to particular locations. In turn, this will allow those agencies to prioritise their investments in management activities and hence progress more efficiently towards the various estuarine targets.
Industry & Investment NSW 7
Mapping the habitats of NSW estuaries – Creese, Glasby, West & Gallen
1. INTRODUCTION
1.1. Mapping marine habitats
Habitats provide the structural living places for the earth’s plants and animals. Some species can live in a wide range of habitats, while others are restricted to very particular ones. Ideally, to understand how the earth’s biodiversity is distributed spatially in the landscape, one would do exhaustive surveys of all the species that were present in a certain place. It is usually not possible to do this because of the time and expense involved. Currently, data on the distribution patterns of biodiversity and on the ecology of key species are not available for most NSW coastal habitats. Consequently, a framework that uses larger scale, surrogate measures of biodiversity is often developed as the initial basis for planning and management purposes. Subdivision of marine environments into habitat units is the surrogate most widely used, and this approach as been adopted in NSW for selecting suitable candidate areas for protection within Marine Parks. The initial bioregional assessments that were done along the NSW coast as part of the Marine Park planning process (Breen et al. 2003, 2004, etc) used the finest scale habitat information that was available at the time, but this was often fairly crude. It was recognised during that process that habitat classification down to a finer scale and maps at a greater resolution would greatly enhance the sustainable management and conservation of the marine resources of NSW. Although mapping of terrestrial habitats to provide information for effective natural resource management has been conducted for several decades, similar assessments of estuarine and marine habitats have only recently commenced in Australia. Maps are an effective tool for informing managers, stakeholders and the community about the extent and condition of important seabed habitats. Maps also provide an opportunity to investigate those habitats under pressure from humans and they can be used in a predictive way to identify habitats or sites that may be threatened by future events such as development on adjacent land or climate shifts. Estuarine habitats, in particular, are under increasing pressure from human activities as more and more urban and semi-urban settlement occurs along NSW’s narrow coastal fringe. There is a wide range of techniques available to map the key geomorphic and biotic features of the seabed, and the exact methods and level of discrimination or classification used will depend on the question(s) being addressed. In general, the mapping of seafloor features is done using remote sensing techniques, that is, by collecting data without any physical contact with the seafloor. The two general classes of remote sensing techniques are aerial or water-based. Aerial remote sensing involves using optical images collected from satellite, aeroplane, helicopter, etc. for digitising visible boundaries of habitat features. Such aerial techniques can be used successfully for land-based habitats, intertidal habitats and subtidal habitats where the water is clear and the view through the water is unobstructed. Water-based techniques involve a sensor being deployed from a boat to collect either optical or acoustic (sonar) data. Optical sensors (e.g., video or still camera) generally collect information over very small areas and will only be useful in clear water, whereas acoustic sensors can cover a wider area in a variety of conditions (Diaz et al. 2004). Optical sensors will generally be needed for identifying biotic habitat features (i.e., types of plants and animals), while acoustic sensors are best at providing information about the physical substratum (e.g., the topography and texture of rock platforms, subtidal reefs, canyons and other subsurface features).

8 Industry & Investment NSW
Mapping the habitats of NSW estuaries – Creese, Glasby, West & Gallen
1.2. Mapping NSW estuaries
1.2.1. Classifying estuaries
An estuary is a semi-enclosed coastal water body having a permanently or intermittently open connection with the ocean. Water levels inside an estuary vary in a periodic way in response to fluctuations in tides, weather patterns and freshwater inflow. The upstream boundary of an estuary is the limit of tidal influence. Variation in estuary type, entrance condition, catchment characteristics and the local climate produce estuarine ecosystems that are complex and dynamic. The seabed in estuaries is predominantly sandy or muddy, but rocky reefs and the hard surfaces of jetties, oyster racks and seawalls can provide considerable habitat complexity. The soft sediments in the shallow parts of estuaries often support seagrasses, mangroves or saltmarsh plants. Together, these macrophytes provide habitat for a rich diversity of marine life. The 184 recognised estuaries in NSW can be classified into five main types with decreasing oceanic influence (Roper et al. 2009):
• Semi-enclosed embayments (6 in NSW) are characterised by marine waters with little freshwater inflow;
• Drowned river valleys (13) have large, wide entrances and tidal ranges similar to the ocean;
• Barrier estuaries (51) are rivers and lakes that are generally open to the ocean but are constricted at their entrances by sand from adjacent beaches. They are often associated with larger catchments, the flow from which assists in keeping the entrance open;
• Intermittent estuaries (110) are creeks and lagoons that become closed to the ocean for extended periods of time. They often have small catchments, hence low river flows to keep entrances open. This is the largest group of estuaries in NSW with many located along the South Coast;
• Brackish lakes (4) are generally connected to the ocean by a long creek and hence have extended flushing times allowing freshwater inflows to dominate.
1.2.2. Estuarine macrophytes
Unlike most marine habitats, estuarine macrophytes have been mapped previously in NSW estuaries. A comprehensive investigation of 133 NSW estuaries was done in the 1980s and maps were produced showing the cover of seagrass, mangrove and saltmarsh (West et al. 1985). More detailed mapping of estuarine habitats commenced in 2003 as part of the Comprehensive Coastal Assessment (CCA) coordinated by NSW Planning. The concentration of effort on these habitats arises from a recognition that seagrasses, mangroves and saltmarshes play an important role in the ecology of estuaries. Seagrass beds often support a rich variety of animals and algae, and act as sources of food (mainly indirectly via epiphytes and detritus) and shelter for numerous species (Keough and Jenkins 1995). Loss of seagrass can result in the destabilisation of sediments, removal of potential nursery habitats for fishes, and a decrease in primary productivity of estuaries. Depending on the species of seagrass, recovery of beds from disturbances can be slow. For all these reasons, seagrass beds are seen as critically important biogenic habitats in estuaries, and consequently their distribution patterns and changes in their size over time have been documented as a means of monitoring the ecological health of estuaries (Williams et al. 2007, Roper et al. 2009).

Industry & Investment NSW 9
Mapping the habitats of NSW estuaries – Creese, Glasby, West & Gallen
Seagrasses normally occur as extensive beds in shallow water. The exact number of seagrass species present in NSW estuaries is still a matter of conjecture. Six species are noted in Stewart and Fairfull (2007); the large Posidonia australis which is restricted to only 21 estuaries, 2 species of the genus Zostera (Z. muelleri and Z. capricorni) and three species of Halophila. Recent molecular analyses, however, have suggested that there is only one species of Zostera (Z. capricorni;.Figure 1), the closely related Hetrozostera nigricaulis and four species of Halophila H. ovalis, H. minor, H. major, H. decipiens) (Kuo 2005, Kuo, pers. comm.). When doing the mapping work described in this report, it has not been possible to accurately distinguish between species of Zostera and Heterozostera or among Halophila spp., and they are just mapped to genus level. Seagrass taxa are often found growing in close proximity to each other (Figure 1). Another plant that is common in many NSW estuaries is the brackish water macrophyte, Ruppia megacarpa. While scientific opinion is divided as to whether this species is a true seagrass or not, it is abundant in many estuaries and may provide similar habitat values as seagrass.
Figure 1. The seagrasses Zostera capricorni (foreground) and Posidonia australis growing together in Port Stephens.
Temperate mangrove communities are relatively simple, with NSW mangrove forests generally being a mixture of only two species, Aegiceras corniculatum and Avicennia marina (Figure 3). In the northern parts of NSW, however, individual trees of more tropical species such as Rhizophera stylosa, Bruguiera gymnorrhiza, Ceriops tagal and Exoecaria agallocha are occasionally encountered (Lear and Turner 1977, West et al. 1985, Stewart and Fairfull 2008). Mangroves are highly productive habitats and supply nutrients and organic matter to estuaries, in addition to being important habitats for the larvae of juveniles of many species (Mazumder et al. 2005a, 2005b; Connolly and Lee 2007). Coastal development and its associated anthropogenic activities are causing the reduction of mangroves in many parts of the world (Connolly and Lee 2007), but it has

10 Industry & Investment NSW
Mapping the habitats of NSW estuaries – Creese, Glasby, West & Gallen
also been suggested that humans might be responsible for the unnatural spread of mangroves in some Sydney estuaries, often at the expense of saltmarsh (Saintilan and Williams 1999, 2000). Saltmarsh is a more complex vegetation community in NSW, being composed of many different species some of which cannot be readily distinguished from each other without painstaking field investigation (Laegdsgaard 2001). Saltmarsh occurs on the same types of soft muddy shorelines as mangroves, but are typically most commonly found at the extreme upper tidal limits. To date there has been only piecemeal study of the distribution and abundance of saltmarshes in NSW (Kelleway et al. 2007) and of their value as a marine habitat, thus making the conservation of these macrophytes particularly difficult. However, recent studies have suggested that NSW saltmarsh communities are an important habitat for crabs and that the export of crab larvae from areas of saltmarsh is an important food source for juvenile fish (Mazumder et al. 2006). Saltmarshes are also important foraging areas for shorebirds.
Figure 2. Mangrove trees lining Cowan Creek at Bobbin Head. All seagrass and mangrove species in NSW are protected under the Fisheries Management Act 1994, and are specifically dealt with as “protected marine vegetation”. Guidelines which identify types of activities that can harm these two estuarine habitats were developed by the Department of Industry & Investment (I&I NSW; formerly the NSW Department of Primary Industries) some time ago and were recently updated (Stewart and Fairfull 2007, 2008) and these describe measures to minimise disturbance to them. The value of coastal saltmarsh communities and the threat they are under has recently been recognised, resulting in the declaration of saltmarsh as an Endangered Ecological Community under the NSW Threatened Species Act. Reclamation of estuarine foreshores and the introduction of invasive species are major threats to saltmarshes throughout the world (Connolly and Lee 2007). Because of its listing as “Endangered”, there is a legislative requirement to monitor its distribution in NSW. I&I NSW guidelines regarding saltmarsh are currently being finalised.

Industry & Investment NSW 11
Mapping the habitats of NSW estuaries – Creese, Glasby, West & Gallen
Figure 3. A saltmarsh meadow merging into a mangrove community at the upper tidal levels of Kooragang Island, Hunter River. The reddish tinged plants are Sarcocornia quinqueflora and the green ones are likely a mixture of Sporobolus virginicus and Suaeda australis.
1.2.3. Rocky reefs
Rocky reefs are common subtidal habitats along the exposed coast of NSW (Andrew 1999) and in some sheltered estuaries, mainly south of Forster. Rocks and other hard surfaces provide attachment space for a wide range of sessile species (algae and invertebrates) which in turn create further habitats for numerous mobile species of invertebrates and fishes (Andrew 1999, Keough and Butler 1995). Rocky reef habitats are also important for maintaining recreational fisheries (Kingsford et al. 1991) and many are popular diving sites. There are relatively few published accounts of the subtidal rocky reef habitats in sheltered NSW estuaries. Some exceptions include a detailed description of the flora and fauna in a small aquatic reserve (Shiprock) in Port Hacking (Lawler 1998), studies of subtidal kelp beds at Fairlight in Port Jackson (Farrant and King 1982; Kennelly 1983; 1987a; b; 1989; Kennelly and Underwood 1985), studies of invertebrates and alga settling on rocky reefs in Broken Bay (Glasby 1998; Glasby and Underwood 1998) and Port Jackson (Glasby 1997; 1999; 2001; Glasby and Connell 1999; Connell 1999; 2000), and descriptions of algae and sponges in Botany Bay (Van der Velde and King 1984; Knott et al. 2004; 2006). Over the last 10 years, numerous studies have examined the development of invertebrate and algal assemblages on estuarine reefs and compared natural reef habitats to artificial hard surfaces such as seawalls, pontoons and pilings, particularly in Sydney estuaries. There is good evidence that many artificial structures create habitats that are distinct from intertidal or subtidal natural rocky reefs (Glasby 1999; Connell and Glasby 1999; Chapman and Bulleri 2003; Bulleri 2005), most notably because many invasive species colonise artificial structures (Glasby et al. 2007). This is a serious concern given that the numbers of artificial structures are increasing in urbanised estuaries and along intertidal foreshores, and in many instances these structures are replacing and

12 Industry & Investment NSW
Mapping the habitats of NSW estuaries – Creese, Glasby, West & Gallen
fragmenting natural habitats (Chapman 2003; Blockley 2007; Goodsell et al. 2007; Goodsell 2009).
1.3. Objectives of the project
The NSW government has long supported the mapping of marine habitats, especially in the context of planning the location and zoning arrangements for Marine Parks in this state. There is an ongoing need to refine these habitat maps to constantly improve the level of information available to coastal managers within the NSW Marine Parks Authority and other NSW Government agencies. More recently, Catchment Management Authorities (CMAs) have been established in NSW and have been required to develop Catchment Action Plans. There are five CMAs along the NSW coast and they also need scientific information about the marine and estuarine environments within their jurisdictions. This project was a joint initiative between NSW government agencies and the coastal CMAs with funding provided by the Federal Government’s Natural Heritage Trust. The mapping work was jointly done by the I&I NSW and the NSW Department of Environment, Climate Change & Water (DECCW; formerly the NSW Department of Environment & Climate Change). DECCW undertook marine habitat mapping off the coast of NSW out to the 3 nm limit of state waters, and I&I NSW undertook the mapping of estuarine habitats. The overall objectives of the entire project were to:
• compile and synthesise new and existing bathymetric, oceanographic, geomorphological and biodiversity information (including datasets that extend to Commonwealth shelf waters),
• use this information to assess the extent (and, in some cases, condition) of seabed habitats and identify current and potential pressures and threats, including vulnerability to climate change,
• provide natural resource managers, industry and the community with the information and tools needed for sustainable natural resource management and biodiversity conservation within the estuarine and marine areas of NSW,
• build on and extend related projects that have been funded by CMAs and NSW government agencies, and other NHT-funded marine habitat mapping projects in other states,
• facilitate input from all key stakeholders and get expert advice into the strategic direction of future marine biodiversity assessments in NSW.
The general aim of the I&I NSW component of the project was to fill key gaps in existing knowledge of the spatial distribution of key estuarine benthic habitats in NSW. The work was an extension of the NSW Comprehensive Coastal Assessment (CCA), which involved mapping seagrasses, mangroves and saltmarshes in the northern and southern regions of NSW (Williams et al. 2007). The current project focused on mapping macrophytes in the estuaries not mapped as part of the CCA (i.e., those in the central part of the NSW coast), and on initiating mapping of subtidal estuarine rocky reefs and intertidal foreshores in selected NSW estuaries.

Industry & Investment NSW 13
Mapping the habitats of NSW estuaries – Creese, Glasby, West & Gallen
2. ESTUARINE MACROPYTES
2.1. Methods
Estuarine macrophytes in NSW were mapped for 133 estuaries in 1985 (West et al. 1985). Several studies including Watford and Williams (1998), Williams and Watford (1997), Williams and Watford (1999), Williams and Meehan (2004), West et al. (2005), Kelleway et al. (2007) and West and Williams (2008), have since occurred that have enabled finer resolution mapping of estuarine macrophytes within selected estuaries in the Sydney Metropolitan region. However, not all estuaries within that region were mapped during these projects and some were in need of updating. More recently, estuarine mapping was updated as part of the CCA (Williams et al. 2007). In that project, the estuarine macrophytes in the estuaries north of Newcastle and south of Wollongong were remapped using a more streamlined approach than that used by West et al. 1985). The current study enables the completion of the estuarine mapping within the region from Newcastle south to Wollongong, thereby creating a complete and comprehensive state-wide assessment of the NSW estuarine macrophytes. The estuarine mapping of West et al. (1985) was captured at 1:25000 using a Bausch and Lomb Zoom transfer scope, aerial photos and 1:25,000 topographic maps. The features were traced onto base layers and transferred onto 1:25,000 scale maps. Areas were calculated using the dot grid method. This was a very time-consuming process with an estimated accuracy of around +/-10 m. Table 1. Habitat attributes used in the mapping of NSW estuarine macrophytes.
Habitat Macrophyte Mangrove Mangrove Mangrove / Saltmarsh Seagrass Halophila Halophila / Ruppia Posidonia Posidonia / Halophila Posidonia / Halophila / Ruppia Posidonia / Ruppia Posidonia / Zostera Posidonia / Zostera / Halophila Ruppia Zostera Zostera / Halophila Zostera / Halophila / Ruppia Zostera / Ruppia Saltmarsh Saltmarsh
The mapping in this study is a continuation of the methods developed for the CCA project (Williams et al. 2007) and involves the capture of habitat boundaries from either scanned aerial photos or digital orthorectified images. All features were captured via onscreen digitising at a scale of 1:1500. All ‘presumptive’ maps were then validated in the field from a small boat. The boat was navigated around the mapped patches with a trained operator annotating the presumptive map by

14 Industry & Investment NSW
Mapping the habitats of NSW estuaries – Creese, Glasby, West & Gallen
adding areas, subtracting areas or changing the classifications (e.g., for different seagrass species) as required. These changes were captured within a real-time computer mapping system using ArcPad, a GPS, an underwater video system and an acoustic single beam depth sounder (Figure 4). The presumptive map was next updated with the field data as well as by additional reference back to the original photos to produce the final product. While the GPS used in the field has an accuracy of +/-1 m, accuracy arising from the orthorectification was of the order of +/-15 m and the onscreen digitising had an accuracy of +/-2 m (depending on the resolution of the image and the onscreen scale). Quality control included re-digitising a test area on at least three occasions during a project (after Evans and Williams 2001). Further details of the current mapping procedure are given in Roper et al. (2009). The final step in the mapping process is to assign each polygon in the GIS to a macrophyte category. For seagrass, this is done on the basis of presence/absence – if any seagrass at all is present in a polygon it is scored as being ‘seagrass’. Subdivision within the ‘seagrass’ classification is based on the species composition. Thus, polygons may be classified as just one species or taxon of seagrass or as a mixture of taxa (Table 1). Mangrove and Saltmarsh are mapped to the ‘community’ level rather than down to the level of individual taxa. These two habitat types often overlap and field investigation will often reveal saltmarsh plants growing underneath a mangrove canopy at the upper tidal level (Kelleway and Williams 2007). Thus, both habitat types may appear in a single polygon within the GIS.
Figure 4. The field mapping system used to verify preliminary macrophyte maps.
Power distributer/controller
Optical mouse Laptop computer
(with 12volt adapter)
Video power supply and video output
Depth sounder
Video display

Industry & Investment NSW 15
Mapping the habitats of NSW estuaries – Creese, Glasby, West & Gallen
2.2. Results
2.2.1. General
One of the key objectives of the NSW Seabed Mapping project was to amalgamate as much existing information as possible into a single consistent format. For the estuarine component, this involved completing the mapping of macrophytes for the whole of NSW by building on the work done previously for the CCA project. The “new” information derived from the project is restricted, therefore, to the central part of the NSW coast, incorporating most of the Hunter Central Rivers CMA area, all of the Hawkesbury Nepean CMA area, and notionally all of the Sydney Metropolitan CMA (SMCMA) area. However, some mapping in the ‘non CCA region’ (Newcastle south to Wollongong) had already been done – for Botany Bay/Georges River as part of a separate project funded by the SMCMA. In the sections below, information is presented for all 16 central coast estuaries that were mapped as part of the Seabed Mapping project using the standardised CCA protocol (sections 2.2.2 to 2.2.4). Information obtained from the abovementioned ‘other’ projects have also been summarised on a regional basis (from North to South) to give a complete overview of the extent of macrophytes in the 154 estuaries that are known to contain these biotic habitats. The remaining estuaries, out of the 184 generally recognised in NSW (Roper et al. 2009), are either ocean embayments such as Twofold Bay, brackish lakes or very small, predominantly closed ICOLLs (Intermittently Closed and Open Lakes and Lagoons). The latter water bodies rarely support macrophyte communities. The complete set of information from the GIS dataset has been presented in two different ways. First, a 1:25,000 map series has been prepared for the entire NSW coast which gives all the base level information on the marine habitats of NSW, both within estuaries and offshore to the 3 nm limit of NSW state waters (Appendix 1). This map series will also be available on the Ozcoasts website http://www.ozcoasts.org.au/geom_geol/case_studies/index.jsp later in 2009. The estuarine information in this map series is shown as the three ‘standard’ macrophyte categories only – seagrass, mangrove, saltmarsh. Where mixtures of macrophytes occur within a single polygon, the procedures set out in Roper et al. (2009) are used to assign the category (see also Table 1). These three ‘standard’ habitat layers are used as habitat indicators for the state-wide assessment of the condition of NSW estuaries under the MER program (Roper et al. 2009). Second, the more detailed information has been compiled individually for each of the 154 mapped estuaries. At this level, seagrass cover is broken down to individual species or to unique mixtures of two or more species (Table 1). All new maps are provided below. For the sake of general illustration, selected examples are also provided for those regions not mapped as part of this Seabed Mapping project. The complete set of detailed maps is being made available on the Industry & Investment NSW website (http://www.dpi.nsw.gov.au/research/areas/systems-research/aquatic-ecosystems/estuarine-habitats-maps).
2.2.2. Northern Rivers CMA
The Northern Rivers CMA encompasses the estuaries from the Tweed River south to include Camden Haven River. A total of 38 estuaries were surveyed in this region for the CCA (Table 2). Of these, four estuaries had no mangrove, saltmarsh or seagrass: Tallow Creek, Broken Head Creek, Jerusalem Creek and Saltwater Creek. Of the remaining estuaries, seagrass was found in 28 of them. The total area of seagrass within this CMA was estimated as 15.899 km2. The majority of this was in the Camden Haven River (Figure 5) with an area of 10.25 km2 and Hastings River with

16 Industry & Investment NSW
Mapping the habitats of NSW estuaries – Creese, Glasby, West & Gallen
1.458 km2. Mangroves were found in 34 estuaries with a total estimated area of 36.332 km2. The majority of this was in the Clarence River (7.653 km2), Richmond River (6.026 km2), Macleay River (5.710 km2), Tweed River (3.982 km2) and Hastings River (3.437 km2). Saltmarsh was found in 34 estuaries with a total coverage of 22.376 km2. The largest areas of saltmarsh were in 4 estuaries: Lake Innes/Cathie with 5.887 km2 (Figure 6), Macleay River (4.247 km2), Clarence River (2.901 km2) and Hastings River (1.867 km2). Table 2. Area (km2) of estuarine macrophytes in the estuaries of the Northern Rivers CMA,
also showing which estuarine macrophytes are present (*).
Macrophyte Estuary
P Z H R M S Seagrass Mangrove Saltmarsh
Tweed River * * * 0.806 3.982 0.763 Cudgen Creek * * * 0.009 0.139 0.052 Cudgera Creek * * * 0.034 0.148 0.074 Mooball Creek * * * 0.024 0.114 0.008 Brunswick River * * * 0.036 1.233 0.310 Belongil Creek * * 0.000 0.070 0.083 Tallow Creek 0.000 0.000 0.000 Broken Head Creek 0.000 0.000 0.000 Richmond River * * * 0.320 6.026 0.599 Evans River * * * 0.006 0.409 0.358 Jerusalem Creek 0.000 0.000 0.000 Clarence River * * * * 0.826 7.653 2.901 Cakora Lagoon * * * 0.000 0.005 0.129 Sandon River * * * 0.086 0.574 0.477 Wooli Wooli River * * * 0.094 0.860 0.669 Station Creek * * 0.000 0.000 0.004 Corindi River * * * 0.024 0.371 0.572 Arrawarra Creek * * * * 0.001 0.010 0.010 Darkum Creek * * * 0.013 0.010 0.000 Woolgoolga Lake * * 0.000 0.006 0.000 Hearns Lake * * 0.000 0.003 0.045 Moonee Creek * * * * 0.032 0.085 0.132 Coffs Harbour Creek * * * 0.002 0.192 0.002 Boambee Creek * * * * 0.060 0.331 0.029 Bonville Creek * * * 0.089 0.137 0.159 Bellinger River * * * * 0.133 1.172 0.143 Dalhousie Creek * * * * 0.002 0.007 0.007 Oyster Creek * * 0.000 0.000 0.003 Deep Creek * * * 0.010 0.035 0.639 Nambucca River * * * * 0.626 1.455 1.277 Macleay River * * * * 0.957 5.710 4.247 South West Rocks Creek * * * 0.002 0.648 0.112 Saltwater Creek (Frederickton) 0.000 0.000 0.000 Korogoro Creek * * * 0.000 0.058 0.040 Killick Creek * * * 0.000 0.045 0.009 Hastings River * * * 1.458 3.437 1.867 Lake Innes/Lake Cathie * * 0.000 0.000 5.887 Camden Haven River * * * * * 10.250 1.408 0.768 Total (for 38 estuaries) 15.899 36.332 22.376 P = Posidonia australis, Z = Zostera spp., H = Halophila spp., R = Ruppia spp, M= Mangrove communities, S = Saltmarsh communities. Grey shading indicates that the calculated area values were too small to show up in the table. Areas mapped as mixed Mangrove/Saltmarsh are recorded under the mangrove calculations.

Industry & Investment NSW 17
Mapping the habitats of NSW estuaries – Creese, Glasby, West & Gallen
Figure 5. An example of a diverse arrangement of estuarine macrophytes in the NRCMA region – Camden Haven (mapped for the CCA project).

18 Industry & Investment NSW
Mapping the habitats of NSW estuaries – Creese, Glasby, West & Gallen
Figure 6. An example of a largely closed system without seagrass in the NRCMA region – the Lake Innes/Lake Cathie system (mapped for the CCA project).

Industry & Investment NSW 19
Mapping the habitats of NSW estuaries – Creese, Glasby, West & Gallen
2.2.3. Hunter/Central Rivers CMA
The Hunter Central Rivers CMA encompasses the estuaries from the Manning River south to include Brisbane Water. Sixteen estuaries were surveyed in this region. With the exception of Avoca Lagoon (Figure 11), all of them had at least one category of macrophyte habitat. However, no seagrass was found in Black Head Lagoon, the Hunter River (Figure 8) or Terrigal Lagoon (Figure 11). Mangroves were absent from four estuaries and saltmarsh from six (Table 3). The total area of seagrass in this CMA was estimated as 92.081 km2. While seagrass was found in 12 estuaries, the majority of this was found in only four. Wallis Lake had by far the most, containing 35% (31.897 km2) of the region’s seagrass. Tuggerah Lake has 17.318 km2 (Figure 10), Lake Macquarie 15.311 km2 (Figure 9) and Port Stephens 14.392 km2 (Figure 7). Mangroves were found in 12 estuaries with the majority being in the Hunter River (19.217 km2) and Port Stephens (19.044 km2). Saltmarsh occurred in 10 of the estuaries with 32% of it (approximately 10.632 km2) occurring in Port Stephens. Table 3. Area (km2) of estuarine macrophytes in the estuaries of the Hunter Central Rivers
CMA, also showing which estuarine macrophytes are present (*).
Macrophyte Estuary
P Z H R M S Seagrass Mangrove Saltmarsh
Manning River * * * 1.654 3.905 2.447 Khappinghat Creek * * * 0.003 0.000 0.159 Black Head Lagoon * 0.000 0.000 0.000 Wallis Lake * * * * * 31.897 1.471 5.900 Smiths Lake * * * 2.960 0.000 0.000 Lower Myall River * * * * 2.172 3.028 2.670 Karuah River * * * 0.066 5.070 3.756 Port Stephens * * * * * 14.392 19.044 10.632 Hunter River * * 0.000 19.217 5.204 Lake Macquarie * * * * * * 15.311 1.130 0.752 Tuggerah Lake * * * * * 17.318 0.001 0.129 Wamberal Lagoon * 0.436 0.000 0.000 Terrigal Lagoon * 0.000 0.001 0.000 Avoca Lake 0.000 0.000 0.000 Cockrone Lake * 0.289 0.000 0.000 Brisbane Water * * * * * 5.582 2.078 1.124 Total (for 16 estuaries) 92.081 54.945 32.774 P = Posidonia australis, Z = Zostera spp., H = Halophila spp., R = Ruppia spp, M= Mangrove communities, S = Saltmarsh communities. Grey shading indicates that the calculated area values were too small to show up in the table. Areas mapped as mixed Mangrove/Saltmarsh are recorded under the mangrove calculations.

Mapping the habitats of NSW estuaries – Creese, Glasby, West & Gallen Page 20
Figure 7. Macrophytes of Port Stephens (mapped for the CCA project).

Industry & Investment NSW 21
Mapping the habitats of NSW estuaries – Creese, Glasby, West & Gallen
Figure 8. Estuarine macrophytes of the Hunter River illustrating the absence of any seagrass (mapped for the CCA project).

22 Industry & Investment NSW
Mapping the habitats of NSW estuaries – Creese, Glasby, West & Gallen
Figure 9. Estuarine macrophytes of Lake Macquarie.

Industry & Investment NSW 23
Mapping the habitats of NSW estuaries – Creese, Glasby, West & Gallen
Figure 10. Estuarine macrophytes of the Tuggerah Lakes system showing the extensive fringing seagrass beds (mainly Zostera) that are a feature of this estuary.

24 Industry & Investment NSW
Mapping the habitats of NSW estuaries – Creese, Glasby, West & Gallen
Figure 11. Wamberal and Cockrone Lakes on the NSW Central Coast contain only the seagrass Ruppia megacarpa, but Avoca Lagoon is totally devoid of any macrophytes and Terrigal Lagoon only has a very small area of mangroves.

Industry & Investment NSW 25
Mapping the habitats of NSW estuaries – Creese, Glasby, West & Gallen
Figure 12. The diverse estuarine macrophytes of the Brisbane Waters system. The small patch of Zostera/Halophila at the bottom of the image is actually one of the only patches of seagrass within the entire Broken Bay estuary which adjoins Brisbane Waters.

26 Industry & Investment NSW
Mapping the habitats of NSW estuaries – Creese, Glasby, West & Gallen
2.2.4. Hawkesbury Nepean CMA
The Hawkesbury Nepean CMA has the fewest estuaries of all coastal CMAs. Effectively, there is only one system, a large drowned river valley universally known as ‘the Hawkesbury’. Because this system is so large (the largest in NSW even excluding Brisbane Waters), it is usually broken down into component ‘estuaries’. In this report, we have followed the classification adopted by the NSW MER program (Roper et al. 2009), and calculated the areas of macrophytes for 3 ‘estuaries’ (Table 3). However, other ways of classifying the Hawkesbury system are common. For illustrative purposes, we have further separated out Cowan Creek (Figure 13) from the rest of the Hawkesbury River for two reasons – first, so that the features of its macrophyte habitats can be more readily seen, and second, because it was one of the selected ‘estuaries’ for the mapping of subtidal reef and foreshore features (Chapter 3). Despite its large size the estimated total amount of seagrass present in the Hawkesbury system was only a meagre 2.809 km2, with the majority of this occurring in Pittwater (1.855 km2) (Figure 14). This is because much of the system, in common with other drowned river valleys, is deeper than the normal depth range for the growth of seagasses. Pittwater, like Brisbane Waters on the northern side of Broken Bay, is shallower and generally has clearer water than the main system, thus promoting the establishment of more extensive seagrass beds. Apart from a relatively small area of seagrass just outside Brisbane Waters (see Figure 12), Broken Bay, at the mouth of the Hawkesbury system, is devoid of macrophyte habitat. There was 10.005 km2 of mangrove habitat in this CMA, with 98% occurring in the Hawkesbury River (Figure 15). The total area of saltmarsh was 2.904 km2, and again 98% of this was in the Hawkesbury River. Both these habitats are predominant features of Mangrove Creek and upstream of where this creek joins the main river (Figure 15). Other areas with large amounts of mangrove and saltmarsh in this estuary are Patonga Creek and some arms of Berowra Creek. Table 4. Area (km2) of estuarine macrophytes in the estuaries of the Hawkesbury Nepean
CMA, also showing which estuarine macrophytes are present (*).
Macrophyte Estuary
P Z H R M S Seagrass Mangrove Saltmarsh
Broken Bay * * * 0.036 0.000 0.000 Hawkesbury River * * * * * 0.917 9.830 2.878 Pittwater * * * * * 1.855 0.175 0.027 Total (for 3 estuaries) 2.809 10.005 2.904 P = Posidonia australis, Z = Zostera spp., H = Halophila spp., R = Ruppia spp, M= Mangrove communities, S = Saltmarsh communities. Grey shading indicates that the calculated area values were too small to show up in the table. Areas mapped as mixed Mangrove/Saltmarsh are recorded under the mangrove calculations.

Industry & Investment NSW 27
Mapping the habitats of NSW estuaries – Creese, Glasby, West & Gallen
Figure 13. Estuarine macrophytes of Cowan Creek, a significant sub-catchment of the estuarine portion of Hawkesbury River. Significantly, the only beds of Posidonia australis within Hawkesbury River are found in Cowan creek.

28 Industry & Investment NSW
Mapping the habitats of NSW estuaries – Creese, Glasby, West & Gallen
Figure 14. Estuarine macrophytes of Pittwater.

Mapping estuarine macrophytes and rocky reefs – Creese, Glasby, West & Gallen Page 29
Figure 15. Estuarine macrophytes of the Hawkesbury River ‘estuary’.

30 Industry & Investment NSW
Mapping the habitats of NSW estuaries – Creese, Glasby, West & Gallen
2.2.5. Sydney Metropolitan CMA
The Sydney Metropolitan CMA (SMCMA) contains 12 estuaries from Narrabeen Lagoon in the north to Port Hacking in the south (Table 5). Many of these ‘estuaries’ are tributaries of Port Jackson (Figure 18) which, like the Hawkesbury system described in section 2.2.3, is the predominant drowned river valley in the region. The Botany Bay system also has ‘estuarine components’ – the large Georges River (Figure 19) and the much smaller Cooks River as well as Botany Bay proper. The Hacking River system has a number of significant tributaries (Figure 21), but these are not large enough to be considered as ‘estuaries’ in their own right. Some estuarine macrophytes were found in all 11 estuaries except Curl Curl Lagoon, although the amount in Manly Lagoon was very small (Figure 17). Three estuaries; Dee Why Lagoon (Figure 16), Curl Curl Lagoon and Cooks River are devoid of any seagrass. The total area of seagrass was estimated to be 7.84 km2, with 57% of this found in Botany Bay. Almost all of this is in the southern part of the Bay within, or adjacent to, the Towra Point Aquatic Reserve (Figure 20). All three of the main seagrasses occur here, often intermixed, as well as large areas of mangrove and saltmarsh habitats. This Reserve is an important stronghold for Posidonia australis in the SMCMA region, although Port Hacking also has reasonably large beds (Figure 21). There was a total of 8.38 km2 of mangroves in the SMCMA, with the majority of it found in Georges River and Botany Bay. Mangroves were not found in Curl Curl or Dee Why Lagoons. Saltmarsh was limited to 1.9 km2, predominantly in the upper parts of Georges River and the southern part of Botany Bay. Table 5. Area (km2) of estuarine macrophytes in the estuaries of the Sydney Metropolitan
CMA, also showing which estuarine macrophytes are present (*).
Macrophyte Estuary
P Z H R M S Seagrass Mangrove Saltmarsh
Narrabeen Lagoon * * * * 0.617 0.000 0.008 Dee Why Lagoon * 0.000 0.000 0.063 Curl Curl lagoon 0.000 0.000 0.000 Manly Lagoon * * 0.001 0.000 0.000 Middle Harbour Creek * * * * 0.058 0.142 0.000 Port Jackson * * * * 0.340 0.000 0.000 Lane Cove River * * * 0.015 0.359 0.000 Parramatta River * * * * 0.105 1.346 0.095 Cooks River * * 0.000 0.108 0.003 Botany Bay * * * * * 4.038 2.296 0.763 Georges River * * * * * 1.647 3.829 0.840 Port Hacking * * * * * 1.002 0.299 0.128 Total (for 12 estuaries) 7.824 8.380 1.900 P = Posidonia australis, Z = Zostera spp., H = Halophila spp., R = Ruppia spp, M= Mangrove communities, S = Saltmarsh communities. Grey shading indicates that the calculated area values were too small to show up in the table. Areas mapped as mixed Mangrove/Saltmarsh are recorded under the mangrove calculations.

Industry & Investment NSW 31
Mapping estuarine macrophytes and rocky reefs – Creese, Glasby, West & Gallen
Figure 16. Estuarine macrophytes of Narrabeen and Dee Why Lagoons.

32 Industry & Investment NSW
Mapping the habitats of NSW estuaries – Creese, Glasby, West & Gallen
Figure 17. Estuarine macrophytes of Manly Lagoon.

Mapping the habitats of NSW estuaries – Creese, Glasby, West & Gallen Page 33
Figure 18. Estuarine macrophytes of Port Jackson and its tributaries – Parramatta River, Lane Cove River and Middle Harbour Creek.

Mapping the habitats of NSW estuaries – Creese, Glasby, West & Gallen Page 34
Figure 19. Estuarine macrophytes of Georges River.

Mapping the habitats of NSW estuaries – Creese, Glasby, West & Gallen Page 35
Figure 20. Estuarine macrophytes of Botany Bay showing the very diverse arrangement of habitats around Towra Point, west of Kurnell.

Mapping the habitats of NSW estuaries – Creese, Glasby, West & Gallen Page 36
Figure 21. Estuarine macrophytes of Port Hacking.

Industry & Investment NSW 37
Mapping the habitats of NSW estuaries – Creese, Glasby, West & Gallen
2.2.6. Southern Rivers CMA
The Southern Rivers CMA is the largest Coastal CMA in NSW. A total of 85 estuaries were surveyed in this CMA ranging from Towradgi Creek in the north to Nadgee Lake in the far south (Table 6). The region is dominated by ICOLLs which means that the conditions prevailing in these estuaries are temporally variable depending on whether they are opened or closed to the sea. While seagrass can tolerate these variable conditions to some extent, they do best when the salinity is reasonably close to that of oceanic seawater and there is some regular tidal water movement. If an ICOLL stays sealed off from the ocean for too long, seagrass beds can gradually decline or disappear altogether. During the CCA survey, seagrass was found in 67 estuaries with a total area of 41.978 km2. Over 50% of this was in five estuaries: Lake Illawarra (7.966 km2) (Figure 22), Jervis Bay (5.534 km2), Shoalhaven River (4.239 km2) (Figure 23), St Georges Basin (3.170 km2) (Figure 24) and Tuross Lake (2.176 km2). All of these are large systems that always have some connection with the sea, and hence are likely to have more stable seagrass beds than the ICOLLs. Estimated areas of seagrass in ICOLLs from 5–6 years ago (i.e., the CCA survey) may not give a very reliable indication of current seagrass coverage. Mangroves were found in 34 of the 85 estuaries with a total estimated area of 16.264 km2. The Shoalhaven and Clyde rivers accounted for 46% of the total mangrove area with 4.180 km2 and 3.310 km2 respectively. Saltmarsh was mapped in 62 estuaries with a total area of 12.635 km2. Of this, 25% was found in just two estuaries – Shoalhaven River (2.058 km2) and Carama Creek (1.089 km2).

38 Industry & Investment NSW
Mapping the habitats of NSW estuaries – Creese, Glasby, West & Gallen
Table 6. Area (km2) of estuarine macrophytes in the estuaries of the Southern Rivers CMA, also showing which seagrass species are present (*).
Macrophyte Estuary
P Z H R M S Seagrass Mangrove Saltmarsh
Towradgi Creek * 0.000 0.000 0.000 Allans Creek * * 0.000 0.021 0.008 Lake Illawarra * * * * * 7.966 0.000 0.302 Elliott Lake * * * 0.007 0.005 0.001 Shellharbour Creek * 0.001 0.000 0.000 Killalea Lagoon 0.000 0.000 0.000 Minnamurra River * * * 0.117 0.879 0.327 Wrights Creek 0.000 0.000 0.000 Werri Lagoon * * 0.001 0.000 0.000 Crooked River * * * 0.046 0.008 0.017 Shoalhaven River * * * 4.239 4.180 2.058 Lake Wollumboola * 1.340 0.000 0.000 Wowly Gully * 0.000 0.000 0.094 Carama Creek * * * * 0.264 0.993 1.089 Currambene Creek * * * 0.251 0.943 0.266 Moona Moona Creek * * 0.033 0.055 0.000 Jervis Bay * * * * * 5.534 0.062 0.028 Flat Rock Creek * 0.000 0.000 0.006 St Georges Basin * * * * * * 3.170 0.276 0.149 Swan Lake * 0.261 0.000 0.000 Berrara Creek * * * 0.052 0.000 0.005 Nerrindilah Creek * 0.030 0.000 0.000 Lake Conjola * * * 0.166 0.001 0.027 Narrawallee Inlet * * * * 0.087 0.416 0.176 Mollymook Creek * * 0.000 0.000 0.001 Ulladulla * * * 0.001 0.001 0.001 Burrill Lake * * 0.764 0.000 0.237 Toubouree Lake * * * * 0.219 0.000 0.040 Termeil Lake * 0.006 0.000 0.000 Meroo Lake * 0.755 0.000 0.000 Willinga Lake * 0.173 0.000 0.000 Kioloa Lagoon * * 0.007 0.000 0.001 Durras Lake * * 0.496 0.000 0.171 Maloneys Creek 0.000 0.000 0.000 Cullendulla Creek * * * 0.125 0.881 0.174 Clyde River * * * * 0.793 3.310 0.521 Batemans Bay * * * * 0.302 0.004 0.000 Tomaga River * * * * 0.293 0.351 0.458 Candlagan Creek * * * 0.048 0.039 0.070 Bengello Creek 0.000 0.000 0.000 Moruya River * * * * * 1.197 0.474 0.790 P = Posidonia australis, Z = Zostera spp., H = Halophila spp., R = Ruppia spp, M= Mangrove communities, S = Saltmarsh communities. Grey shading indicates that the calculated area values were too small to show up in the table. Areas mapped as mixed Mangrove/Saltmarsh are recorded under the mangrove calculations.

Industry & Investment NSW 39
Mapping the habitats of NSW estuaries – Creese, Glasby, West & Gallen
Table 6 (continued)
Macrophyte Estuary P Z H R M S
Seagrass Mangrove Saltmarsh
Congo Creek * * * 0.002 0.000 0.011 Meringo Creek * 0.000 0.000 0.012 Coila Lake * * * 1.367 0.000 0.343 Kellys Lake 0.000 0.000 0.000 Tuross Lake * * * * 2.176 0.664 0.802 Lake Brunderee * * 0.026 0.000 0.017 Lake Brou * 0.000 0.000 0.088 Lake Dalmeny * * * * 0.325 0.013 0.022 Kianga Lake * 0.113 0.000 0.000 Wagonga Inlet * * * * * 0.809 0.197 0.023 Little Lake (Narooma) 0.000 0.000 0.000 Bullengella Lake 0.000 0.000 0.000 Nangudga Lake * * * 0.202 0.000 0.146 Nargal Lake 0.000 0.000 0.000 Corunna Lake * * 0.161 0.000 0.049 Tilba Tilba Lake * * 0.095 0.000 0.156 Little Lake (Wallaga) * 0.000 0.000 0.017 Wallaga Lake * * * 1.085 0.000 0.162 Bermagui River * * * * 0.271 0.473 0.168 Barragoot Lake * * 0.006 0.000 0.079 Cuttagee Lake * * * * 0.385 0.000 0.113 Murrah Lake * * * * 0.097 0.017 0.161 Bunga Lagoon * * * 0.000 0.000 0.030 Wapengo Lake * * * * 0.418 0.555 0.506 Middle Lake * * * 0.211 0.000 0.052 Nelson Lake * * * * 0.010 0.491 0.155 Bega River * * 0.261 0.000 0.533 Wallagoot Lake * * * * 0.774 0.000 0.118 Bournda Lagoon * * 0.000 0.000 0.005 Back Lagoon * * 0.215 0.000 0.022 Merimbula Lake * * * * * 1.639 0.349 0.592 Pambula Lake * * * * * 0.706 0.580 0.366 Curalo Lagoon * * * 0.185 0.000 0.090 Shadrachs Creek * 0.004 0.000 0.000 Twofold Bay * * 0.740 0.000 0.000 Nullica River * * * * 0.012 0.008 0.018 Boydtown Creek * 0.000 0.000 0.005 Fisheries Creek * * * 0.006 0.000 0.035 Towamba River * * * 0.097 0.017 0.125 Wonboyn River * * * * 0.806 0.000 0.518 Merrica River 0.000 0.000 0.000 Table Creek * 0.000 0.000 0.001 Nadgee River * * 0.000 0.000 0.082 Nadgee Lake * * 0.032 0.000 0.001 Total (for 85 estuaries) 41.978 16.264 12.635
P = Posidonia australis, Z = Zostera spp., H = Halophila spp., R = Ruppia spp, M= Mangrove communities, S = Saltmarsh communities. Grey shading indicates that the calculated area values were too small to show up in the table. Areas mapped as mixed Mangrove/Saltmarsh are recorded under the mangrove calculations.

Mapping the habitats of NSW estuaries – Creese, Glasby, West & Gallen Page 40
Figure 22. An example of the estuarine macrophytes of the SRCMA region – Lake Illawarra (mapped for the CCA project).

Mapping the habitats of NSW estuaries – Creese, Glasby, West & Gallen Page 41
Figure 23. Another example of estuarine macrophytes in the SRCMA region – Shoalhaven River (mapped for the CCA project).

Mapping the habitats of NSW estuaries – Creese, Glasby, West & Gallen Page 42
Figure 24. An example of the very diverse estuarine macrophyte arrangement in St Georges Basin (mapped for the CCA project).

Industry & Investment NSW 43
Mapping estuarine macrophytes and rocky reefs – Creese, Glasby, West & Gallen
3. HARD SURFACE HABITATS IN ESTUARIES
3.1. Methods
3.1.1. Foreshore habitats
Foreshore habitat types have been mapped previously in some estuaries for specific purposes (e.g., planning by Local Government), but it is rare that such mapping has considered habitat types in relation to their ecological role or importance. Three exceptions are 1) the foreshore habitat descriptions of Port Jackson done by the Centre for Research on Ecological Impacts of Coastal Cities (Sydney University) in the late 1990s, 2) maps produced by the NSW Department of Planning in 2005 (www.planning.nsw.gov.au/harbour/sydney_dcp_downloads.asp), and 3) the oil spill response atlas maintained by NSW Maritime and made available only to the NSW Ports Corporations and the NSW Department of Environment, Climate Change & Water. The Sydney University map is not available in GIS and is now outdated, while the other two map series use limited natural habitat categories and do not specifically identify artificial surfaces. The intertidal foreshore was defined roughly as the zone between mean low water and mean high water. Thus, on gently sloping shores, the shoreline could be many metres wide and so would typically be classified as a mixture of habitat types. On steeply sloping shores, there was more likely to be just one habitat type as the effective area sampled was much narrower. High resolution digital aerial photography was used to rapidly identify, map and classify the estuary shoreline. In cases where aerial images were unavailable or inadequate, Google Earth images were used to provide indicative habitat boundaries. The minimum mapping unit (i.e., smallest shoreline feature mapped) was 10 m and all mapping was done at a scale of 1:1500. A spatial layer of the estuary boundary (polyline) was applied to the high resolution aerial images in ArcGIS 9.2. An estuary foreshore classification scheme was developed which incorporated both natural and artificial habitats (Table 7). Mixed habitats were also identified, although these generally occupied less than 5% of the shoreline. In the GIS, the estuary polyline was segmented according to visual interpretation of apparent shoreline boundaries from the aerial photographs. To each segmented polyline, an identifier was ascribed that corresponded to the estuary foreshore classification table in the attribute data in ArcGIS 9.2, classifying the type of habitat present at the specific location and creating a presumptive map of the entire estuary shoreline. Detailed boat-based field validation of the estuary shoreline was then conducted to asses the accuracy of the presumptively mapped habitat boundaries and to incorporate any habitats that were obscured or otherwise difficult to identify from aerial images. Examples of 4 rocky foreshore habitat categories are shown in Figures 25 – 28.

44 Industry & Investment NSW
Mapping estuarine macrophytes and rocky reefs – Creese, Glasby, West & Gallen
Table 7. Intertidal foreshore substratum categories. Biogenic habitats (i.e., animals and seaweeds) growing on these surfaces were not defined.
Substratum/Habitat Definition Artificial Rock Wall Typically vertical to 45°, consolidated/structured
sandstone blocks, mixed rock, concrete, etc, or unconsolidated rock fill
Horizontal rock platform Flat or sloped solid rock > 15 m long and 2 m wide. Can have deep crevices and rockpools
Cobbles/boulders Rocks ranging from small pebbles to large boulders Vertical rock platform Solid vertical rock > 15 m long and 2 m wide; can have
deep crevices Mangrove Natural mangrove foreshore, with muddy sediments Mudflats Muddy sediments, no large stands of mangroves, but may
have or 1–2 small trees Sand Sandy sediments with no obvious vegetation, very few
rocks Mangrove natural rock Rocky foreshore with dense to sparse mangroves Patchy rocky + sand/mud Sand/mud interspersed with rock Artificial rock wall + patchy rock/sand/mud
Artificial rock wall + cobbles/boulders Artificial rock wall + rock platform Artificial rock wall + mangrove Artificial rock wall + sand Artificial rock wall + mud

Industry & Investment NSW 45
Mapping estuarine macrophytes and rocky reefs – Creese, Glasby, West & Gallen
Figure 25. Artificial rock wall.
Figure 26. Horizontal rock platform.

46 Industry & Investment NSW
Mapping estuarine macrophytes and rocky reefs – Creese, Glasby, West & Gallen
Figure 27. Cobble/boulder foreshore.
Figure 28. Vertical rock platform.

Industry & Investment NSW 47
Mapping estuarine macrophytes and rocky reefs – Creese, Glasby, West & Gallen
3.1.2. Subtidal rocky reef
Presumptive maps of subtidal rocky reef were created using two methods. The first method was the same as that used for mapping the macrophytes, and involved digitising the outline of visible subtidal reef identified from aerial photographs in ArcGIS 9.2. An identifier was ascribed to each polygon that corresponded to one of seven habitat categories (Table 8). In clear water with high resolution images, reefs could be mapped down to a maximum of 10 m depth using this method, but in many estuaries, reef could not be seen through water greater than 5 m depth. The high resolution orthorectified digital imagery gave a ground resolution of between 0.1 m per pixel to 1 m per pixel, depending on the quality of the imagery. Only low resolution aerial photographs were available for some estuaries (Table 9) and these were digitally scanned orthorectified TIF images at a scale of 1:25 000. The second component of the subtidal habitat mapping involved using a Humminbird Inc. Side Imaging Sonar (1197c SI Combo series) with a connected 16 channel GPS to find and scan reef in water greater than 5 m deep. The sonar was used from a 6 m boat with a standard 500 watt transducer mounted to the stern. An operating frequency of 455 kHz was used, with a sonar beam width of 60 – 100 m (depending on depth and slope of the seafloor). The seafloor directly below the boat is not captured by the sonar. The boat travelled at speeds of 4–5 knots and, whenever possible, was navigated in straight lines to minimise distortion of the images. The port side of the boat was kept parallel to the shallow edge of the shoreline to allow for the starboard side sonar beam to penetrate the deeper edge of unexplored water. The positional error of the side imaging sonar was determined to be 4 m or less in water 20 m deep. The recorded raw image sonar files were exported and converted to .XTF format via Humminbird’s Son2xtf file converter software. Each converted file was then imported into the post-processing software SonarWiz.MAP V4 (Chesapeake Technology Inc.) which produced a geo-referenced image track of the recorded image. SonarWiz.MAP also provides ‘slant range correction’ (i.e., removal of the blank water column directly below the boat). The geo-referenced images were then exported as GeoTiffs to ArcGIS for digitising and delineation of reef boundaries. Boundaries of the preliminary subtidal reef maps were validated in the field using a combination of a standard single beam echo-sounder (to help clarify the deep edge of reefs), a bathyscope (to allow the observer to look below the water’s surface) and an underwater video camera (MorphCam CCTV) with footage recorded on a Sony DCR-TRV27E digital recorder. It was not possible to accurately map shallow subtidal reef in Cowan Creek from aerial images because of overhanging trees and deep water. Instead, side scan sonar was used to find some areas of reef in water > 5 m deep, but this methodology could not be used accurately in water < 5 m deep when the seafloor was steeply sloped. It was known, however, that shallow subtidal reef occurred along the edges of much of Cowan Creek (Glasby and Underwood 1998), so an indicative boundary for shallow subtidal reef was delineated by applying a 3 m wide buffer along the foreshore line wherever the foreshore consisted of a natural rocky substratum. This buffered line was then merged with any deeper reef mapped using the side scan sonar. In many cases, reef extended further from the shore than this 3 m (Glasby pers. obs.), so the measure of areal extent of subtidal reef in Cowan Creek is almost certainly underestimated. In selected estuaries (Table 9), detailed information on the subtidal rocky reef benthic assemblages (i.e., biotic habitats) was gathered using towed and dropped underwater video surveys. The most detailed subtidal habitat mapping was done in Port Jackson as high resolution digital images (0.1 m) and clear water enabled many habitats to be classified directly from aerial photos. Field validation of subtidal reef habitats in Port Jackson entailed using a GPS, a dual frequency, colour depth sounder combined and a towed underwater video camera all linked to a mobile mapping computer (see Figure 4). Deep reefs which were located by the side imaging sonar were surveyed

48 Industry & Investment NSW
Mapping estuarine macrophytes and rocky reefs – Creese, Glasby, West & Gallen
using the underwater video system to identify various habitat types. In the other estuaries, subtidal biotic habitats were not spatially mapped, usually because there was only sparse cover of only a limited number of habitat types in each of the digitised reef polygons. Examples of subtidal biogenic habitat types are presented in Figures 29 – 32. Table 8. Biogenic habitat categories recorded for subtidal rocky reefs.
Biogenic Habitat Definition Macroalgae Primarily brown seaweed such as Ecklonia radiata, Sargassum
spp or Phyllospora comosa. This habitat could also contain small patches of the green alga Caulerpa filiformis.
Turfing algae Small filimanetous and foliose algae of the genera Zonaria, Corallina, Amphiroa or Laurencia (often with some Sargassum spp).
Caulerpa filiformis Typically mono-specific beds greater than 5 m x 5 m. Sessile invertebrates Sponges, ascidians or corals, typically found on vertical or
sloping walls on the deep edge of reefs. Barrens White, pink or red rock, with no obvious plant or animal growth.
This habitat could also contain a few scattered larger seaweeds. Mixed macroalgae + turfing algae Ecklonia radiata or Sargassum spp with large patches of
filamentous or foliose algae. Mixed macroalgae + barrens Large patches of macroalgae greater than 5 m x 5 m)
interspersed with barrens.
Table 9. Details of imagery and techniques used for mapping foreshore and subtidal
habitats in selected NSW estuaries.
Estuary
High Resolution orthorectified imagery
Low Resolution scanned aerial photographs
Side Image Sonar
Underwater video
Buffer Analysis
Port Stephens Y Y Cowan Creek Y Y Y Y Pittwater Y Y Port Jackson Y Y Y Port Hacking Y Y Y Batemans Bay Y Y Y

Industry & Investment NSW 49
Mapping estuarine macrophytes and rocky reefs – Creese, Glasby, West & Gallen
Figure 29. The habitat ‘Macroalgae’, showing the kelp Ecklonia radiata (top left) and Sargassum sp. (centre).
Figure 30. The habitat ‘Turfing algae’, dominated by the brown seaweed Zonaria sp. and the red coralline alga Amphiroa anceps.

50 Industry & Investment NSW
Mapping estuarine macrophytes and rocky reefs – Creese, Glasby, West & Gallen
Figure 31. The green seaweed Caulerpa filiformis which can cover large areas on shallow subtidal reefs, often adjacent to sand, and often a distinctive habitat.
Figure 32. The habitat ‘Sessile invertebrates’, showing a diverse assemblage of sponges, ascidians, soft corals and bryozoans.

Industry & Investment NSW 51
Mapping estuarine macrophytes and rocky reefs – Creese, Glasby, West & Gallen
3.2. Results
3.2.1. Intertidal foreshore
The entire foreshore of each estuary was mapped and classified into habitat categories (Table 10), but due to space limitations, only some examples of selected areas in each estuary have been presented in this report. The full maps are available electronically on the DII website (http://www.dpi.nsw.gov.au/research/areas/systems-research/aquatic-ecosystems/estuarine-habitats-maps).
Port Stephens
A total of 281.33 km of foreshore was mapped in Port Stephens (Figure 33). The vast majority of the mapped foreshore was classed as natural. Mangrove accounted for 69%, Sand 11.7% and Cobbles/Boulders 7.7% (Table 10). Artificial foreshore accounted for only 5% of the mapped foreshore. An example of the foreshore habitat mapped in Port Stephens is in Figure 34.
Cowan Creek/Broken Bay
A total of 135.77 km of foreshore was mapped along the Cowan Creek/Broken Bay estuarine shore (Figure 35). The majority of the shoreline was natural, with the major habitat being Cobbles/Boulders (Figure 36), accounting for 46.1% and Horizontal rock platform being 16.6% (Table 10). Artificial habitat accounted for only 3.8% of the total foreshore.
Pittwater
The total foreshore mapped in Pittwater was 54.69 km (Table 10 and Figure 35). Natural habitat accounted for 54.2% of the mapped foreshore with the major natural habitat types being Cobbles/boulders (23.4%) and sand (12.9%). Artificial habitats accounted for a very high 45.8% of the mapped foreshore with artificial rock walls accounting for 35.1%. Figure 37 is an example of the foreshore habitat mapped in Pittwater.
Port Jackson
The foreshore mapped in Port Jackson totalled 288.9 km (Figure 38). This estuary had the greatest percentage of artificial habitat, accounting for approximately 49% of the foreshore. Natural habitat accounted for 51.1% of the total mapped shoreline, Mangroves for 17.49%, Horizontal rock platform for 10.5% and Cobbles/boulders for 10.4% (Table 10). Figure 39 is an example of the foreshore mapping in Port Jackson.
Port Hacking
The total length of foreshore mapped in Port Hacking was 72.97 km (Figure 40), with 67.6 % of it being natural. Cobbles/Boulders accounted for 26.9%, Horizontal rock platform for 12.6% and Mangrove for 10.90% (Table 10). Artificial shoreline covered approximately 32% of the foreshore. Figure 41 is an example of the foreshore habitat mapped in Port Hacking.
Batemans Bay
A total of 149.47 km of shoreline was mapped in Batemans Bay (Figure 42), with 77.8% of it being natural habitat. The major habitat types within this were Mangrove (33.2%), Cobbles/Boulders (15.9%) and Sand (10.6%) (Table 10). Artificial habitats occupied 22.2% of the shore. An example of the mapped foreshore habitat is in Figure 43.

Mapping the habitats of NSW estuaries – Creese, Glasby, West & Gallen Page 52
Table 10. Percent of intertidal foreshore habitats mapped for each estuary.
Substratum/Habitat Port Stephens Cowan Creek /
Broken Bay Pittwater Port
Jackson Port Hacking Batemans Bay
Artificial Rock Wall 2.64% 3.15% 35.11% 34.00% 9.86% 3.08% Horizontal rock platform 1.69% 16.56% 3.57% 10.47% 12.59% 2.23% Cobbles/boulders 7.69% 46.10% 23.41% 10.40% 26.91% 6.22% Vertical rock platform 0.55% 9.33% 0.15% 1.59% 1.83% 1.36% Mangrove 69.18% 8.51% 7.19% 17.49% 10.90% 38.48% Mudflats 0.51% 0.00% 0.00% 0.37% 1.68% 12.33% Sand 11.67% 6.69% 12.92% 3.55% 8.54% 25.79% Mangrove natural rock 2.19% 1.76% 0.22% 1.71% 0.80% 0.51% Patchy rocky + sand/mud 1.46% 7.23% 6.70% 5.52% 4.31% 7.03% Artificial rock wall + cobbles/boulders 0.18% 0.11% 2.53% 2.42% 4.44% 0.00% Artificial rock wall + patchy rock/sand/mud 0.06% 0.00% 1.95% 2.02% 6.67% 0.12% Artificial rock wall + rock platform 0.00% 0.32% 1.01% 4.31% 4.63% 0.00% Artificial rock wall + mangrove 0.10% 0.15% 0.64% 2.31% 0.39% 0.10% Artificial rock wall + sand 2.04% 0.10% 4.59% 3.30% 6.46% 2.76% Artificial rock wall + mud 0.03% 0.00% 0.00% 0.56% 0.00% 0.00% TOTAL km of foreshore 281.33 135.77 54.69 288.88 72.97 149.47

Mapping the habitats of NSW estuaries – Creese, Glasby, West & Gallen Page 53
Figure 33. Extent of shoreline in Port Stephens for which foreshore habitat has been mapped (dark line).

Mapping the habitats of NSW estuaries – Creese, Glasby, West & Gallen Page 54
Figure 34. Foreshore habitat classes mapped in Port Stephens.

Mapping the habitats of NSW estuaries – Creese, Glasby, West & Gallen Page 55
Figure 35. Extent of shoreline mapped in Cowan Creek/Broken Bay (green) and Pittwater (orange).

Mapping the habitats of NSW estuaries – Creese, Glasby, West & Gallen Page 56
Figure 36. Foreshore habitat mapped for Cowan Creek.

Mapping the habitats of NSW estuaries – Creese, Glasby, West & Gallen Page 57
Figure 37. Foreshore habitat for Pittwater.

Mapping the habitats of NSW estuaries – Creese, Glasby, West & Gallen Page 58
Figure 38. Extent of shoreline in Port Jackson in which foreshore habitat has been mapped (dark line).

Mapping the habitats of NSW estuaries – Creese, Glasby, West & Gallen Page 59
Figure 39. Foreshore habitat mapped in Port Jackson.

Mapping the habitats of NSW estuaries – Creese, Glasby, West & Gallen Page 60
Figure 40. Extent of shoreline in Port Hacking in which foreshore habitat has been mapped (dark line).

Mapping the habitats of NSW estuaries – Creese, Glasby, West & Gallen Page 61
Figure 41. Foreshore habitat in Port Hacking.

Mapping the habitats of NSW estuaries – Creese, Glasby, West & Gallen Page 62
Figure 42. Extent of shoreline in Batemans Bay in which foreshore habitat has been mapped (dark line).

Mapping the habitats of NSW estuaries – Creese, Glasby, West & Gallen Page 63
Figure 43. Foreshore habitat in Batemans Bay.

64 Industry & Investment NSW
Mapping the habitats of NSW estuaries – Creese, Glasby, West & Gallen
3.2.2. Subtidal rocky reef
Extensive surveys were done for subtidal reef in most of the selected estuaries (Table 11), but it was not practical to cover the entire estuary searching for deep reef using the narrow beam of the side scan sonar. Instead, side scan sonar surveys focussed on areas that were considered most likely to contain deep reef. Some examples of side scan sonar images are presented in Figures 44–46, including a wreck that was located in Port Stephens. Due to space limitations, only some examples of selected subtidal reef areas in each estuary have been presented in this report. The complete maps are available on the DII website (http://www.dpi.nsw.gov.au/research/areas/systems-research/aquatic-ecosystems/estuarine-habitats-maps).
Table 11. Presence (Y) or absence (N) of subtidal habitats per estuary and total area of reef
mapped. Full subtidal habitat mapping (allowing area estimates) was completed only for Port Jackson. No habitat data (ND) were collected for Batemans Bay, but each habitat is likely to be present, except for the green seaweed Caulerpa filiformis.
Biogenic Habitat Port
Stephens Cowan Pittwater Port
Jackson Port Hacking
Batemans Bay
Macroalgae Y Y Y 0.59 Y ND Turfing algae Y Y Y 0.09 Y ND Caulerpa filiformis Y Y Y 0.002 Y ND Sessile Invertebrates Y Y Y 0.13 Y ND Barrens Y N N 0.29 Y ND Mixed macroalgae + turfing algae
Y Y Y 0.08 Y ND
Mixed macroalgae + barrens Y N N 0.39 Y ND Total reef mapped (km2) 0.42 0.13 0.10 1.58 0.22 2.27 † Total waterway area (km2) 128.79 45.17 18.39 51.87 11.70 46.06 † an additional 2.34 km2 of deeper offshore subtidal reef was mapped by NSW DECCW and has been included in the full electronic reef maps.

Industry & Investment NSW 65
Mapping the habitats of NSW estuaries – Creese, Glasby, West & Gallen
Figure 44. Side scan sonar image showing subtidal rock shelf.
Figure 45. Side scan sonar image showing subtidal boulder reef.

66 Industry & Investment NSW
Mapping the habitats of NSW estuaries – Creese, Glasby, West & Gallen
Figure 46. Side scan sonar image of the sunken HMAS Psyche in Port Stephens.
Port Stephens
A total of 0.42 km2 of subtidal reef was mapped in Port Stephens and all of the pre-defined subtidal habitats were recorded (Table 11). The mapped areas of reef in Port Stephens were primarily around the northern (Yacaaba) and southern (Tomaree) headlands (Figure 47), and along the southern shoreline between Nelson Head and Dutchman’s Beach. A narrow ban of fringing reef was also mapped at Winda Woppa (Barnes Rocks), near Fame Cove, and around Boondaba (Middle) Island.
Cowan Creek/Broken Bay
Cowan creek (including the mouth of Broken Bay) had 0.13 km2 of subtidal reef mapped (Table 11). Much of this was indicative only as it occurred in shallow water (0 – 3 m) close to the shoreline and as such could not be mapped accurately with side scan sonar, nor could the reef be seen clearly from aerial images. The thin line around the foreshore in Figure 48 indicates the buffer in which reef was presumed to occur. Deeper reef was mapped in various locations scattered throughout Cowan creek (Figure 38) and all reef habitats except barrens were found.
Pittwater
Subtidal habitats in Pittwater were similar to those in the adjacent Cowan Creek but there was far less subtidal reef mapped in Pittwater (Table 11). The majority of reef in Pittwater occurs on the western side, from West Head down to Longnose Point (Figure 49) and it is generally very shallow. Much of the subtidal reef in Pittwater consists of cobbles and boulders, but there are larger platforms at the mouth of the waterway around West head and some large vertical rock walls covered in ascidians around Barrenjoey Headland.

Industry & Investment NSW 67
Mapping the habitats of NSW estuaries – Creese, Glasby, West & Gallen
Port Jackson
Comprehensive maps of subtidal habitats were prepared for a total of 1.58 km2 of reef in Port Jackson, incorporating each habitat type (Table 11). The majority of reef occurred at the mouth of the estuary, around North and South heads, Dobryod Head and Middle Head (Figure 50). Shallow reef lines much of the shoreline of Port Jackson all the way to the limits of our mapping around Birchgrove in the Parramatta River and Roseville Bridge in Middle Harbour.
Port Hacking
All subtidal habitat types were found on the 0.22 km2 of reef mapped in Port Hacking (Table 11). As in other estuaries, the majority of subtidal reef occurred near the mouth of the estuary and there was a great deal of shallow fringing reef stretching along the estuary (Figure 51) all the way to the limits of mapping near the Audley weir. Notably, some areas of deep, invertebrate-covered reef were found in the South West Arm of Port Hacking.
Batemans Bay
By far the most substantial subtidal reef systems were mapped in Batemans Bay, with a total area of 2.27 km2 mapped by I&I NSW using the methods described in this report, plus an additional 2.34 km2 mapped using multibeam sidescan sonar in deeper areas by NSW DECCW (Jordan et al. 2009) (Table 11). Habitat types on the reef were not documented for large areas of Batemans Bay, but it is very likely that each of the habitats was present, except the green alga Caulerpa filiformis, which is not known to occur much further south than Bulli. The vast majority of subtidal reef in Batemans Bay occurs in the mouth of the estuary, with not much found west of Long Beach (Figure 52). Some small patches of reef were mapped in the Clyde River, however, including some as far upstream as Nelligen.

Mapping the habitats of NSW estuaries – Creese, Glasby, West & Gallen Page 68
Figure 47. Mapped subtidal reef in Port Stephens.

Mapping the habitats of NSW estuaries – Creese, Glasby, West & Gallen Page 69
Figure 48. Mapped subtidal reef in Cowan Creek.

70 Industry & Investment NSW
Mapping the habitats of NSW estuaries – Creese, Glasby, West & Gallen
Figure 49. Mapped subtidal reef in Pittwater.

Industry & Investment NSW 71
Mapping the habitats of NSW estuaries – Creese, Glasby, West & Gallen
Figure 50. Mapped subtidal reef and habitats in Port Jackson.

Mapping the habitats of NSW estuaries – Creese, Glasby, West & Gallen Page 72
Figure 51. Mapped subtidal Reef in Port Hacking.

Mapping the habitats of NSW estuaries – Creese, Glasby, West & Gallen Page 73
Figure 52. Mapped subtidal reef in Batemans Bay.

74 Industry & Investment NSW
Mapping the habitats of NSW estuaries – Creese, Glasby, West & Gallen
4. DISCUSSION AND FUTURE DIRECTIONS
4.1. Implications of findings
This project is the culmination of many years effort in remapping the estuarine macrophytes of NSW following the initial surveys done in the early 1980s by West et al. (1985). The availability of these two state-wide datasets allows some assessment of changes over time, not only of the overall spatial extent of these important habitat types in NSW but also at the scale of individual estuaries or even particular patches of habitat within those estuaries. The spatial extent of seagrass, mangrove and saltmarsh habitats is recognised nationally and internationally as an important indicator of the condition of estuarine health (Mount et al. 2008). In NSW, this indicator has been adopted for the Estuarine theme of the Natural Resources Commission’s Monitoring, Evaluation and Reporting (MER) program for the state. The data collected during this seabed mapping project and its predecessor the Comprehensive Coastal Assessment (CCA) have been used, in comparison to the original West et al. (1985) survey, to score individual estuaries and regions in terms of the relative loss or gain of these habitats (Roper et al. 2009). An increase in the extent of saltmarsh or seagrass habitats is considered to be ‘good’ and, conversely, a decrease is ‘bad’. However, it is difficult to determine whether a change in mangrove extent is positive or negative for estuary health without conducting estuary specific studies. The MER analysis suggested that saltmarsh habitat has remained relatively stable or increased in all regions and that seagrass habitat has remained relatively stable in 2 of the 4 regions (Table 12). There was estimated to have been a loss of seagrass of over 10% (and up to 40%) in the estuaries of the central regions of the NSW coast, resulting in a ranking of ‘fair’ (Table 12). Although not scored by the MER process, the mapped extent of mangrove habitat increased between the 2 surveys in all regions. Although this assessment might be useful for state-wide purposes (e.g., for State of the Environment (SoE) reporting), it does not identify particular problems that might be able to be addressed at a local or regional level. Table 12. Summary of condition scores for estuarine macrophytes under the NSW MER
program (see also Roper et al. 2009). Scores were assigned as very good for a >10% gain, good ±10%, fair -10 to -40% loss, poor -40 to -70% loss and very poor -70 to -100% loss.
CMA region Seagrass Mangrove Saltmarsh Northern Rivers Good Not rated Very good Hunter Central Rivers Fair Not rated Very good Hawkesbury Nepean and Sydney Metropolitan Fair Not rated Good Southern Rivers Good Not rated Good Overall Good Not rated Good
There is much greater value in a condition assessment once the change in extent of estuarine macrophytes is examined at the scale of individual estuaries as will be done in the regional report cards to be released later in 2009. Even greater value can be gained if the extent of macrophytes is mapped periodically to provide a time series of data points that can be used to assess long-term trends (e.g., Larkum and West 1990). It was beyond the scope of this project to do such a trend analysis, but there are now several published time series available. This seabed mapping project and any small scale studies that are done from time to time can continue to add valuable information about changes in the extent of estuarine habitats in NSW. An example is shown below

Industry & Investment NSW 75
Mapping the habitats of NSW estuaries – Creese, Glasby, West & Gallen
for Port Hacking where a sharp decline in the area of seagrass was noted between the 1950s and the 1970s, followed by a stabilisation (Williams and Meehan 2004). The latest data point derived from our study suggests that a gradual increase in seagrass may be occurring (Figure 53). The extent of mangroves may have stabilised following slight increases since the 1960s, while the extent of saltmarsh habitat may also have increased recently following a slow decline over many decades. These area values are estimates only and, like all estimates, are subject to error. It is not easy to quantify the errors from this sort of mapping technique (but see Meehan et al. 2005) but they may be quite large especially for earlier times. Taken as general trends, however, the data suggest that there is no cause for concern in terms of loss of macrophyte habitats in Port Hacking.
0
20
40
60
80
100
120
140
160
180
200
1920 1930 1940 1950 1960 1970 1980 1990 2000 2010
Year
Are
a (h
a)
seagrass
Mangrove
Saltmarsh
Figure 53. Changes over 8 decades in the extent of 3 estuarine macrophytes in Port Hacking. Note that for the last 3 data points (1985, 1999 and 2005), field verification was done of the interpreted maps, so they are likely to be more accurate estimates than earlier ones. (Extension of dataset from Williams and Meehan 2004).
While seagrass is an important habitat category, the form and stability of the different seagrass species means that the nature of its habitat value to other estuarine biota also varies among species. Halophila spp. grow close to the seabed and tend to be fast growing and often ephemeral (Stuart and Fairfull 2007). They do not usually provide long-lasting structural habitat. Posidonia australis, on the other hand, is a slow growing, long lived species that is very good at stabilising estuarine sediment. Its fronds can grow to over 80 cm long and beds of Posidonia can often be very dense and persist for decades (Larkum 1976). It is generally considered to provide the greatest habitat structure of any of the seagrass species found in NSW (Middleton et al. 1984, Bell and Pollard 1989) and is thus considered the most worthy of protection (Stuart and Fairfull 2007). Zostera spp. are somewhat intermediate between Posidonia and Halophila in terms of their life history characteristics and ability to provide structural habitat.

76 Industry & Investment NSW
Mapping the habitats of NSW estuaries – Creese, Glasby, West & Gallen
Table 13. The extent of the seagrass Posidonia australis recorded during two state-wide surveys in the 1980s (West et al. 1985) and the 2000s (Williams et al. 2007 and this project).
Estuary Posidonia area (km2) West et al. 1985 Current mapping Wallis Lake 3.299 2.429 Port Stephens 2.480 4.097 Lake Macquarie 1.680 0.991 Brisbane Water 1.414 0.957 Broken Bay 0.000 0.003 Hawkesbury River 0.000 0.007 Pittwater * 1.245 Port Jackson 0.081 0.104 Botany Bay 2.414 3.151 Port Hacking * 0.633 Jervis Bay * 5.131 St Georges Basin 0.429 1.401 Batemans Bay 0.007 0.207 Wagonga Inlet 0.892 0.605 Bermagui River 0.054 0.199 Merimbula Lake 0.789 1.157 Pambula Lake 0.134 0.523 Twofold Bay 0.018 0.001 * Indicates that the original West et al. 1985 data is not available.
The state-wide survey of estuarine macrophytes done in the 1980s (West et al. 1985) paid particular attention to Posidonia australis. Similarly, in the most recent surveys, special effort was made to thoroughly map the extent of Posidonia beds during field surveys particularly the deeper edges which are often difficult to discern from aerial photographs. Comparison of the 2 surveys shows quite marked changes in the extent of Posidonia in many estuaries. Where there has been an estimated large loss (Wallis Lake, Lake Macquarie and Brisbane Water) are of potential concern and these estuaries should be earmarked for further investigation to verify the suspected losses and investigate their possible causes. Of course, for many estuaries in the Sydney region, the most substantial losses may have occurred well before 1985 (Larkum and West 1990, Williams and Meehan 2004). While change in the total extent of an estuarine macrophyte habitat gives some indication of its condition, it usually does not provide the full story. For example, the mapping technique used here is unable to take account of discontinuities within mapped seagrass beds. There are many instances in NSW where quite substantial bare patches occur within beds, often because of human activities such as the installation of boat moorings. These ‘holes’ can mean that the real extent of a bed is much less than that mapped. Again, for Posidonia beds (e.g., Figure 54), this is a matter of concern as continuing fragmentation might eventually result in the loss of integrity of the entire bed. These fragmented seagrass beds are not likely to provide the same high habitat value as intact ones. There are many other threats to seagrass beds, most of them as a result of direct or indirect human activities, and these have been well documented elsewhere (e.g., Keough and Jenkins 1995, Gillanders 2007). One potential threat that is under constant surveillance in NSW is the threat posed by introduced marine pests, and particularly the green alga Caulerpa taxifolia. It was first discovered in NSW in 2000, and has now been recorded in 14 of NSW’s 184 estuaries (Table 14).

Industry & Investment NSW 77
Mapping the habitats of NSW estuaries – Creese, Glasby, West & Gallen
This seaweed, although native to tropical regions of Australia, is listed under NSW legislation as a noxious species because of the potential threat it poses to marine species in temperate waters (Glasby and Creese 2007). C. taxifolia grows very rapidly and can cover extensive areas of the seabed in a matter of only a few years. It appears to grow best in the same shallow depths as seagrass (Figure 55), and there is sill some risk is that, in the long term, it might overgrow and eventually displace native seagrass. Importantly, however, research to date suggests that dense beds of seagrass are not adversely affected by C. taxifolia and both Zostera capricorni and Posidonia australis have been found to sprout amongst C. taxifolia (Glasby and Creese 2007). It is perhaps more likely that seagrass that is already under stress from other anthropogenic disturbances might become more susceptible to impacts from C. taxifolia, or that if seagrass is killed, C. taxifolia colonise and prevent the complete recovery of seagrass. While techniques have been developed to control C. taxifolia (Creese et al. 2004), they are only effective at very small scales and large infestations are still present in some of the affected estuaries (Table 14). Fortunately, with the exception of Lake Conjola, C. taxifolia has not expanded to the extent where it has dominated the shallow areas of any NSW estuary. When, C. taxifolia first established in Lake Conjola there was virtually no seagrass living there (Zostera and Halophila spp. would have been expected) as a result of the estuary, an ICOLL, having been closed for a long period of time (Ron West, University of Wollongong, pers. comm. 2009). In most estuaries where it is found, C. taxifolia occurs as sparsely distributed plants rather than as large monospecific beds (Table 14). Although there is no evidence to date that C. taxifolia has outcompeted and displaced native seagrass (Glasby and Creese 2007), there may be more subtle indirect impacts on some of the fauna that live in, or closely associated with, the estuarine seafloor. Such impacts have been documented in Lake Conjola (e.g., Gribben and Wright 2006, McKinnon et al. 2009) which is by far the largest stronghold of this invader in NSW. There are also many human-mediated threats to mangrove and saltmarsh habitats (documented in Connolly and Lee 2007). Large-scale clearing of mangrove forests in NSW ceased many years ago, and mangrove habitat is generally increasing in extent in most NSW estuaries. Some of this recolonisation is into areas where mangroves previously had been removed, which would be a positive change. In some cases, mangrove colonisation has been ‘upslope’ into areas previously or currently occupied by saltmarsh (see Figure 3) due to increased sedimentation and possibly also to sea level rise. While this is positive for mangroves, it can be detrimental to saltmarsh considering the generally small areas of saltmarsh within NSW estuaries and the limited opportunities for them to expand landward as sea levels continue to rise (Saintilan and Williams 1999). The marinisation of estuaries (i.e., higher salinity levels caused by things such as entrance training, artificial opening of lagoons, water extraction upstream or lower rainfall associated with drought) may also provide mangroves with a competitive advantage at the expense of saltmarsh.

78 Industry & Investment NSW
Mapping the habitats of NSW estuaries – Creese, Glasby, West & Gallen
Figure 54. Holes created in a bed of Posidonia australis by boat moorings in Lake Macquarie.
Figure 55. The invasive Caulerpa taxifolia growing amongst sparse Zostera sp.

Industry & Investment NSW 79
Mapping the habitats of NSW estuaries – Creese, Glasby, West & Gallen
Table 14. Cumulative area of NSW estuaries invaded by Caulerpa taxifolia, expressed as the sum of all areas where it has been recorded since its initial discovery (i.e., the maximum extent of mapped infestations). Some infestations are extremely dense (e.g., in Lake Conjola), while others are very sparse (e.g., in Narrawallee Inlet and Brisbane Water).
CMA Estuary/Lake First
recorded Cumulative area invaded (ha)
Status/trend
HCR Lake Macquarie Feb 2001 16.50 Initially found at several sites, but present at only 1 in 2004. Not found in the lake since May 2006.
HCR Brisbane Water, including Patonga
Apr 2006 0.76 Very sparse and patchy. Has not noticeably expanded in area.
HN Pittwater Dec 2000 111.69 First found in Careel Bay, but has since spread to other bays and around Scotland Island. Continues to increase in extent.
SM Port Jackson Apr 2002 25.78 Mostly sparsely distributed but some dense patches. Has not noticeably expanded in recent years.
SM Botany Bay Apr 2001 779.00 Very sparse coverage but over a large area. Has not noticeably expanded in recent years.
SM Port Hacking Apr 2000 85.18 Mostly sparsely distributed except in Gunnamatta Bay. Decreased extent in recent years.
SR St Georges Basin Apr 2004 25.41 Rapidly expanded from a couple of small patches until 2008. Substantial decrease since then, with none found in 2009.
SR Lake Conjola Apr 2000 249.81 Rapidly increased to cover much of the lake. Has remained very dense over recent years.
SR Narrawallee Inlet Apr 2001 9.23 Very little present in 2009. Abundance can fluctuate greatly, but it is always very sparse.
SR Burrill Lake March 2001 57.81 Mostly sparsely distributed but some dense patches. Slight increase in recent years.
SR Durras Lake Apr 2007 1.88 Small patch that has remained stable in extent.
SR Batemans Bay Feb 2007 9.89 Sparse coverage only. Slight decrease in 2008 and 2009.
SR Wallagoot Lake Sept 2007 0.05 Small isolated patch treated with salt, most recently in July 2009

80 Industry & Investment NSW
Mapping the habitats of NSW estuaries – Creese, Glasby, West & Gallen
4.2. Future directions
The estuary-wide mapping of macrophytes described in this report has identified some trends in extent. Some of these changes require further investigation, especially for saltmarsh where apparent increases may merely reflect improved ability to detect and record small patches (Kelleway et al. 2007). For seagrass, particularly Posidonia, the situation is more clear-cut and some worrying declines are evident. This information can now be combined with data on human impacts as part of a threat identification process which would identify those seagrass beds that might be most vulnerable to human impacts (e.g., damage from boat moorings; Figure 54). Such areas could then be monitored in more detail using newly-developed detailed mapping techniques that operate at small spatial scales (e.g., covering a few kilometres of shoreline). This low-altitude, high-resolution aerial photography (using a camera vertically mounted in a helicopter; Figure 55) has been developed as part of the monitoring program for offshore rocky reefs under the Marine theme of MER. Trials have proven that the helicopter technique works well for all shallow water habitats where there is reasonably clear water, whether on the open coast or in estuaries. This technique permits very detailed discrimination of the main seagrasses in NSW estuaries and can be used to detect changes in the size, shape and density of individual beds to an accuracy of approximately a metre (or less depending on resources available). By regularly monitoring small areas of seagrass that are likely to be under threat from human disturbances and comparing these to nearby seagrass beds in less disturbed areas, it will be possible to detect significant changes and so enable management intervention to ameliorate any impacts. This approach is already being used in the Port Stephens – Great Lakes Marine Park to monitor the response of Posidonia beds following the replacement of conventional boat moorings with ‘seagrass-friendly’ moorings (Brian Hughes, HCRCMA, pers. comm.. 2009). Because this technique has a number of major advantages over standard aerial photographic images (greater resolution, control over time of image capture), it means that individual estuaries or seabed habitats within particular estuaries can be readily and regularly mapped. Other improvements in mapping techniques have been made during this project such as the use of side scan sonar to map estuarine reefs and other submerged hard objects that can be used as structural habitat (e.g., Figure 46). This technique, especially if further improvements can be made to mapping reef habitats very close to shore in water less than 5m depth, can now be deployed wherever such surfaces are likely to be an important habitat type, primarily in drowned river valleys which are most numerous in the central regions of the NSW coast. This subtidal mapping can be extended to include descriptions of the substratum (e.g., cobbles or consolidated reef) and used in conjunction with video camera surveys to more fully document the biodiversity on the reefs (as was done for Port Jackson). By combining detailed maps of habitats, their associated biodiversity and the threats posed to these into a risk assessment framework, it will be possible in the future to provide management agencies the means by which they can assign relative values to particular locations. In turn, this will allow those agencies to prioritise their investments in management activities.

Industry & Investment NSW 81
Mapping the habitats of NSW estuaries – Creese, Glasby, West & Gallen
Figure 56. The helicopter-based mapping system that is being trialled for use in the more detailed mapping of high priority seabed habitats in NSW. The external ‘helipod’, which contains the camera is shown above and the laptop computer control system in the cockpit below.
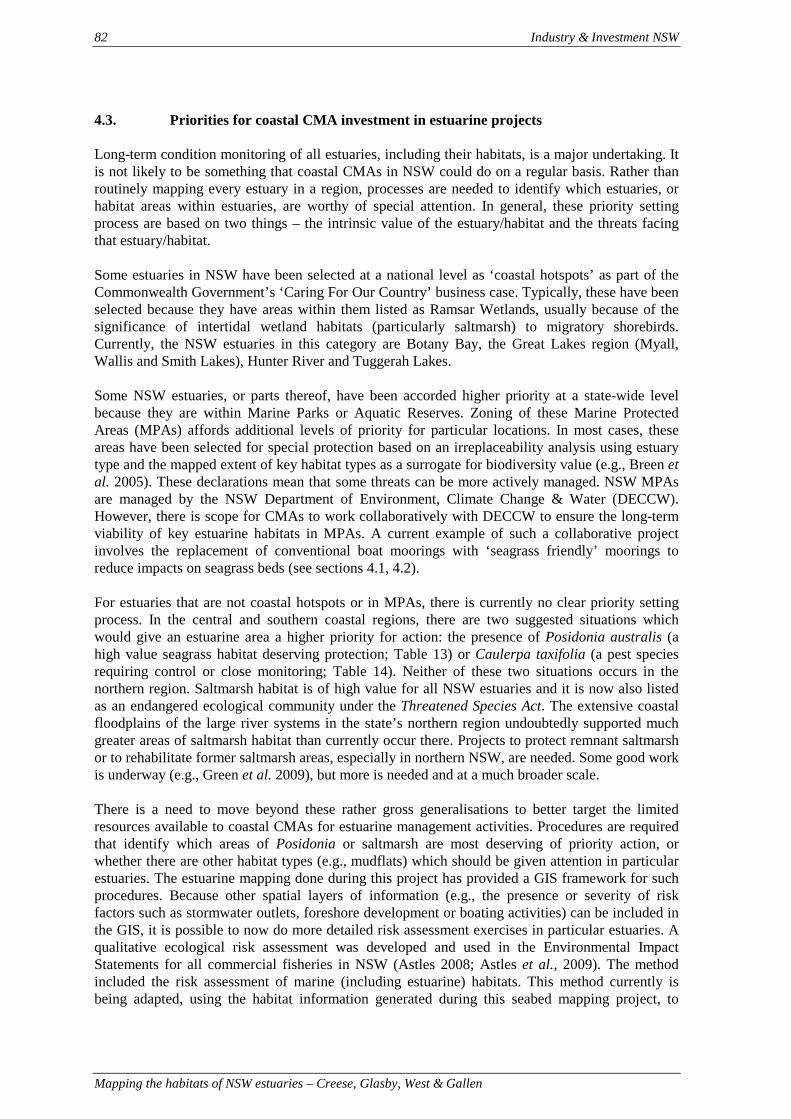
82 Industry & Investment NSW
Mapping the habitats of NSW estuaries – Creese, Glasby, West & Gallen
4.3. Priorities for coastal CMA investment in estuarine projects
Long-term condition monitoring of all estuaries, including their habitats, is a major undertaking. It is not likely to be something that coastal CMAs in NSW could do on a regular basis. Rather than routinely mapping every estuary in a region, processes are needed to identify which estuaries, or habitat areas within estuaries, are worthy of special attention. In general, these priority setting process are based on two things – the intrinsic value of the estuary/habitat and the threats facing that estuary/habitat. Some estuaries in NSW have been selected at a national level as ‘coastal hotspots’ as part of the Commonwealth Government’s ‘Caring For Our Country’ business case. Typically, these have been selected because they have areas within them listed as Ramsar Wetlands, usually because of the significance of intertidal wetland habitats (particularly saltmarsh) to migratory shorebirds. Currently, the NSW estuaries in this category are Botany Bay, the Great Lakes region (Myall, Wallis and Smith Lakes), Hunter River and Tuggerah Lakes. Some NSW estuaries, or parts thereof, have been accorded higher priority at a state-wide level because they are within Marine Parks or Aquatic Reserves. Zoning of these Marine Protected Areas (MPAs) affords additional levels of priority for particular locations. In most cases, these areas have been selected for special protection based on an irreplaceability analysis using estuary type and the mapped extent of key habitat types as a surrogate for biodiversity value (e.g., Breen et al. 2005). These declarations mean that some threats can be more actively managed. NSW MPAs are managed by the NSW Department of Environment, Climate Change & Water (DECCW). However, there is scope for CMAs to work collaboratively with DECCW to ensure the long-term viability of key estuarine habitats in MPAs. A current example of such a collaborative project involves the replacement of conventional boat moorings with ‘seagrass friendly’ moorings to reduce impacts on seagrass beds (see sections 4.1, 4.2). For estuaries that are not coastal hotspots or in MPAs, there is currently no clear priority setting process. In the central and southern coastal regions, there are two suggested situations which would give an estuarine area a higher priority for action: the presence of Posidonia australis (a high value seagrass habitat deserving protection; Table 13) or Caulerpa taxifolia (a pest species requiring control or close monitoring; Table 14). Neither of these two situations occurs in the northern region. Saltmarsh habitat is of high value for all NSW estuaries and it is now also listed as an endangered ecological community under the Threatened Species Act. The extensive coastal floodplains of the large river systems in the state’s northern region undoubtedly supported much greater areas of saltmarsh habitat than currently occur there. Projects to protect remnant saltmarsh or to rehabilitate former saltmarsh areas, especially in northern NSW, are needed. Some good work is underway (e.g., Green et al. 2009), but more is needed and at a much broader scale. There is a need to move beyond these rather gross generalisations to better target the limited resources available to coastal CMAs for estuarine management activities. Procedures are required that identify which areas of Posidonia or saltmarsh are most deserving of priority action, or whether there are other habitat types (e.g., mudflats) which should be given attention in particular estuaries. The estuarine mapping done during this project has provided a GIS framework for such procedures. Because other spatial layers of information (e.g., the presence or severity of risk factors such as stormwater outlets, foreshore development or boating activities) can be included in the GIS, it is possible to now do more detailed risk assessment exercises in particular estuaries. A qualitative ecological risk assessment was developed and used in the Environmental Impact Statements for all commercial fisheries in NSW (Astles 2008; Astles et al., 2009). The method included the risk assessment of marine (including estuarine) habitats. This method currently is being adapted, using the habitat information generated during this seabed mapping project, to

Industry & Investment NSW 83
Mapping the habitats of NSW estuaries – Creese, Glasby, West & Gallen
assess the risk to estuarine habitats in the lower Hawkesbury estuary. It is hoped that this product will have general applicability to other estuaries in NSW. ‘Risk assessment’ is a key component of an overall process called ‘risk analysis’ (Figure 57). Risk assessment consists of four stages. ‘Risk context’ defines the undesirable events to be avoided (i.e., those that might jeopardise management objectives) and the spatial and temporal extent of that event that management or stakeholders wish to avoid. These are usually determined by the management or conservation objectives of those responsible for managing an estuary. ‘Risk identification’ categorises the habitats and generates a list of sources of potential impacts on the habitats from human activities (i.e., potential threats). ‘Risk characterization’ estimates the likelihood that the identified sources of risk will cause the undesirable event defined in the risk context. ‘Issues arising’ are the considerations that management agencies such as state government departments, CMAs or local councils, need to address if they are to reduce or mitigate the risk to estuarine habitats from the range of human activities assessed. These issues are then fed into the risk management component of risk the analysis.
Figure 57. Framework for qualitative ecological risk analysis for estuarine habitats (modified from Astles et al. 2009).

84 Industry & Investment NSW
Mapping the habitats of NSW estuaries – Creese, Glasby, West & Gallen
The information generated during this project provides a valuable first step in the risk characterisation process. It can now be used, in conjunction with other data sets, to determine the vulnerability of particular habitats. It is recommended that a formal risk assessment process be undertaken for the key habitats in other estuaries in NSW that are considered at risk or have otherwise been accorded a high priority status. Ultimately, this will allow better targeting of scarce public resources by natural resource managers in NSW.

Industry & Investment NSW 85
Mapping the habitats of NSW estuaries – Creese, Glasby, West & Gallen
5. REFERENCES
Andrew, N.L. (1999). New South Wales. In: Under Southern Seas – the Ecology of Australia’s Rocky Reefs (N.L. Andrew, ed.). pp. 9–19. New South Wales University Press, Sydney.
Astles, K.L. (2008). A systematic approach to estimating ecological risks in marine fisheries. CAB Reviews: Perspectives in Agriculture, Veterinary Science, Nutrition and Natural Resources 3, No. 045, 1–16.
Astles, K.L., Gibbs, P.G., Steffe, A.S. and Green, M. (2009). A qualitative risk-based assessment of impacts on marine habitats and harvested species for a data deficient wild capture fishery. Biological Conservation. 142, 2759–2773.
Bell, J.D. and Pollard, D.A. (1989). Ecology of fish assemblages and fisheries associated with seagrasses. In: Seagrass Ecosystems – an Australian Perspective. (Larkum A.W.D., McComb A.J. and Shepherd S.A., eds). pp. 565–609. Elsevier, Amsterdam.
Bell, J.D. and Edwards A.R. (1980). An environmental inventory of estuaries and coastal lagoons in New South Wales. Report by the Total Environment Centre, Sydney, NSW. 187 pp.
Blockley, D.J. (2007). Effect of wharves on intertidal assemblages on seawalls in Sydney Harbour, Australia. Marine Environmental Research 63, 409–27.
Breen, D.A., Avery R.P. and Otway, N.M. (2005). Broadscale Biodiversity Assessment of The Batemans Shelf and Twofold Shelf Marine Bioregions. Final report for the N.S.W. Marine Parks Authority. 149 pp.
Bulleri, F. (2005). Role of recruitment in causing differences between intertidal assemblages on seawalls and rocky shores. Marine Ecology Progress Series 287, 53–65.
Carter, S. (1995). Coastal Resource Atlas for Oil Spills from Crowdy Head to Port Stephens. Report of the Environment Protection Authority of New South Wales. Sydney, NSW. 87 pp.
Chapman, M.G. (2003). Paucity of mobile species on constructed seawalls: effects of urbanization on biodiversity. Marine Ecology Progress Series 264, 21–9.
Chapman, M.G. and Bulleri, F. (2003). Intertidal seawalls – new features of landscape in intertidal environments. Landscape and Urban Planning 62, 159–72.
Connell, S.D. (1999). Effects of surface orientation on the cover of epibiota. Biofouling 14, 219–26.
Connell, S.D. (2000). Floating pontoons create novel habitats for subtidal epibiota. Journal of Experimental Marine Biology and Ecology 247, 183–94.
Connell, S.D. and Glasby, T.M. (1999). Do urban structures influence local abundance and diversity of subtidal epibiota? A case study from Sydney Harbour, Australia. Marine Environmental Research 47, 373–87.
Connolly, R.M. and Lee, S.Y. (2007). Mangroves and saltmarsh. In: Marine Ecology (S.D. Connell and B.M. Gillanders, eds) pp. 485–512. Oxford University Press, Melbourne.

86 Industry & Investment NSW
Mapping the habitats of NSW estuaries – Creese, Glasby, West & Gallen
Creese, R.G., Davis, A. and Glasby T.M. (2004). Eradicating and preventing the spread of the invasive alga Caulerpa taxifolia in NSW. NSW Fisheries Final Report Series # 64, 100 pp.
Dekker, A.G., Anstee, J.M. and Brando, V.E. (2003). Seagrass change assessment using satellite data for Wallis Lake. A consultancy report to the Great Lakes Council and Department of Land and Water Conservation, Technical report 13/03, CSIRO Land and Water, Canberra, April 2003.
Diaz, R.J., Solan, M. and Valente, R.M. (2004). A review of approaches for classifying benthic habitats and evaluating habitat quality. Journal of Environmental Management 73, 165–81.
Evans, M.J. and R.J. Williams (2001). Historical distribution of estuarine wetlands of Kurnell peninsular, Botany Bay. Wetlands (Australia) 19, 61–71
Farrant P.A. and King R.J. (1982). The subtidal seaweed community of the Sydney region. Wetlands (Australia) 2, 51–60.
Gillanders, B.M. (2007). Seagrass. In: Marine Ecology (S.D. Connell and B.M. Gillanders, eds) pp. 457–484. Oxford University Press, Melbourne.
Glasby, T.M. (1997). Analysing data from post-impact studies using asymmetrical analyses of variance: a case study of epibiota on marinas. Australian Journal of Ecology 22, 448–59.
Glasby, T.M. (1998.) Estimating spatial variability in developing assemblages of epibiota on subtidal hard substrata. Marine and Freshwater Research 49, 429–37.
Glasby, T.M. (1999). Differences between subtidal epibiota on pier pilings and rocky reefs at marinas in Sydney, Australia. Estuarine, Coastal and Shelf Science 48, 281–90.
Glasby, T.M. (2001). Development of sessile marine assemblages on fixed versus moving substrata. Marine Ecology Progress Series 215, 37–47.
Glasby, T.M. and Connell, S.D. (1999). Urban structures as marine habitats. Ambio 28, 595–8.
Glasby, T.M. and Creese, R.G. (2007). Invasive Marine Species Management and Research. In: Marine Ecology (S.D. Connell & B.M. Gillanders, eds) pp. 569–594. Oxford University Press, Melbourne.
Glasby, T.M. and Underwood, A.J. (1998). Determining positions for control locations in environmental studies of estuarine marinas. Marine Ecology Progress Series 171, 1–14.
Glasby, T.M., Connell, S.D., Holloway M.G. and Hewitt C.L. (2007). Nonindigenous biota on artificial structures: could habitat creation facilitate biological invasions? Marine Biology 151, 887–95.
Goodsell, P.J. (2009). Diversity in fragments of artificial and natural marine habitats. Marine Ecology Progress Series 384, 23–31.
Goodsell, P.J., Chapman, M.G. and Underwood A.J. (2007). Differences between biota in anthropogenically fragmented habitats and in naturally patchy habitats. Marine Ecology Progress Series 351, 15–23.

Industry & Investment NSW 87
Mapping the habitats of NSW estuaries – Creese, Glasby, West & Gallen
Green, J., Reichelt-Brushett, A. and Jacobs, S.W.L. (2009). Re-establishing a slatmarsh vegetation structure in a changing climate. Ecological Management & Restoration 10: doi:10.111/j.1442–8903.2009.00438.x.
Gribben P.E. and Wright, J.F., (2006). Subleathal effects on reproduction in native fauna: are females more vulnerable to biological invasion? Oecologia (Berlin) 149, 352–361.
Jordan A., Davies P., Ingleton T., Mesley E., Neilson J. and Pritchard T. (2009). Mapping of seabed habitats on the continental shelf of NSW. NSW Department of Environment, Climate Change and Water Occasional Paper Series, 208 pp.
Kelleway, J., Williams, R.J. and Allen, C.B. (2007). An assessment of the saltmarsh of the Parramatta River and Sydney Harbour. Final report to NSW Maritime Authority. NSW DPI – Fisheries Final Report Series No. 90. 100pp.
Kennelly, S.J. (1983). An experimental approach to the study of factors affecting algal colonization in a sublittoral kelp forest. Journal of Experimental Marine Biology and Ecology 68, 257–76.
Kennelly, S.J. (1987a) Physical disturbances in an Australian kelp community. I. Temporal effects. Marine Ecology Progress Series 40, 145–53.
Kennelly, S.J. (1987b). Physical disturbances in an Australian kelp community. II. Effects on understorey species due to differences in kelp cover. Marine Ecology Progress Series 40, 155–65.
Kennelly, S.J. (1989). Effects of kelp canopies on understorey species due to shade and scour. J Journal of Experimental Marine Biology and Ecology 50, 215–24.
Kennelly, S.J. and Underwood, A.J. (1985). Sampling of small invertebrates on natural hard substrata in a sublittoral kelp forest. Journal of Experimental Marine Biology and Ecology 89, 55–67.
Keough, M.J. and Butler, A.J., 1995. Temperate subtidal hard substrata, In State of the marine environment report for Australia. Technical annex 1. The marine environment. eds L.P. Zann, P. Kailola, pp. 37–52. Great Barrier Reef Marine Park Authority, Townsville.
Keough, M.J. and Jenkins, G.P. (1995). Seagrass meadows and their inhabitants. In: Coastal Marine Ecology of Temperate Australia (eds A.J. Underwood and M.G. Chapman) pp. 221–39. University of New South Wales, Sydney.
Kingsford, M.J., Underwood, A.J. and Kennelly, S.J., (1991). Humans as predators on rocky reefs in New South Wales, Australia. Marine Ecology Progress Series 72, 1–14.
Knott N.A., Underwood A.J., Chapman M.G. and Glasby T.M. (2004). Epibiota on vertical and on horizontal surfaces on natural reefs and on artificial structures. Journal of the Marine Biological Association of the UK 84, 1117–30.
Knott, N.A., Underwood, A.J., Chapman, M.G. and Glasby, T.M. (2006). Growth of the encrusting sponge Tedania anhelans (Lieberkuhn) on vertical and horizontal surfaces of temperate subtidal reefs. Marine and Freshwater Research 57, 95–104.
Kuo, J., (2005). A revision of the genus Heterozostera (Zosteraceae). Aquatic Botany 81, 97–140.

88 Industry & Investment NSW
Mapping the habitats of NSW estuaries – Creese, Glasby, West & Gallen
Larkum, A.W.D. (1976). Ecology of Botany Bay I. Growth of Posidonia australis (Brown) Hook. f. in Botany Bay and other bays of the Sydney basin. Australian Journal of Marine and Freshwater Research 27, 117–127.
Larkum, A.W.D., and West, R.J. (1990). Long term changes in seagrass meadows in Botany Bay, Australia. Aquatic Botany 37, 55–70.
Lawler, C. J. (1998). The subtidal flora and fauna at Shiprock, Port Hacking, New South Wales during 1965–1970. Wetlands (Australia) 17, 41–59.
Mazumder, D.N., Saintilan, N. and Williams, R.J. (2005a). Temporal variations in fish catch using pop nets in mangrove and saltmarsh flats at Towra Point, NSW, Australia. Wetlands Ecology and Management 13: 457–467.
Mazumder, D., Saintilan, N. and Williams, R.J. (2005b). Fish assemblages in three tidal saltmarsh and mangrove flats in temperate NSW, Australia: a comparison based on species diversity and abundance. Wetlands Ecology and Management 14: 201–209.
Mazumder, D., Saintilan, N. and Williams R.J. (2006). Trophic relationships between itinerant fish and crab larvae in a temperate Australian saltmarsh. Marine and Freshwater Research 57: 193–199.
McKinnon, J.G., Gribben, P.E., Davis, A.R., Jolley, D.F. and Wright, J.T., (2009). Differences in soft-sediment macrobenthic assemblages invaded by Caulerpa taxifolia compared to uninvaded habitats. Marine Ecology Progress Series 380, 59–71.
Meehan, A.J. and West, R.J. (2000). Recovery times for a damaged Posidonia australis bed in south eastern Australia. Aquatic Botany 67: 161–167.
Meehan, A.J., Williams, R.J. and Watford, F.A. (2005). Detecting trends in seagrass abundance using aerial photograph interpretation: problems arising with the evolution of mapping methods. Estuaries 28: 462–472.
Middleton, M.J., Bell, J.D., Burchmore, J.J., Pollard, D.A. and Pease, B.C. (1984). Structural differences in the fish communities of Zostera capricorni and Posidonia australis seagrass meadows in Botany Bay, New South Wales. Aquatic Botany 18, 89–109.
Mount R., Newton, J. and Innes, A. (2008). Estuarine Coastal & Marine – Status of information for reporting against indicators under the National Natural Resource Management Monitoring and Evaluation Framework. National Land & Water Resources Audit, Canberra. 48 pp.
Roper, T., Creese, R.G., Scanes, P., Stephens, K., Dela-Cruz, J. and Coates, B. (2009). Estuaries and Coastal Lakes – Technical Report. NSW State of the Catchments 2008. Department of Environment, Climate Change and Water NSW. 213pp. In press.
Saintilan, N. and Williams, R.J. (1999). Mangrove transgression into saltmarsh environments in south-east Australia. Global Ecology and Biogeography 8, 117–124.
Stewart, M. and Fairfull, S. (2007). Seagrasses. Primefact 629. NSW Department of Primary Industries.
Stewart, M. and Fairfull, S. (2008). Mangroves. Primefact 746. NSW Department of Primary Industries.

Industry & Investment NSW 89
Mapping the habitats of NSW estuaries – Creese, Glasby, West & Gallen
Van der Velde, J.T. and King, R.J. (1984) The subtidal seaweed communities of Bare Island, Botany Bay. Wetlands (Australia) 4, 7–22.
Watford, F.A. and Williams, R.J. (1998). Inventory of estuarine vegetation in Botany Bay, with special reference to change in the distribution of seagrass. Fishcare Project No. 97/003741. NSW Fisheries Final Report Series No. 11, 51 pp.
West, G., Williams, R.J. and Laird, R. (2004). Distribution of estuarine vegetation in the Parramatta River and Sydney Harbour, 2000. Final report to NSW Waterways Authority. NSW Fisheries Final Report Series No. 70. 33 pp.
West G, and Williams, R.J. (2008). Preliminary assessment of the historical, current and future cover of seagrass in the estuary of the Parramatta River. NSW Department of Primary Industries – Fisheries Final Report Series No. 98. 61pp.
West, R.J., Thorogood, C.A., Walford, T.R. and Williams R.J. (1985). An estuarine inventory for New South Wales, Australia. Fisheries Bulletin 2. Department of Agriculture, New South Wales. 140 pp.
Williams, R.J. and Meehan, A.J. (2004). Focusing management needs at the sub-catchment level via assessments of change in the cover of estuarine vegetation, Port Hacking, NSW, Australia. Wetlands Ecology and Management 12: 499–518.
Williams, R.J. and Thiebaud, I. (2007). Hawkesbury-Lower Nepean aquatic habitat study: developing a monitoring framework. NSW Fisheries Final Report Series No 91. 97 pp.
Williams, R.J. and Watford, F.A. (1997). Change in the distribution of mangrove and saltmarsh in Berowra and Marramarra Creeks, 1941–1992. Contract report to Hornsby Shire Council. 21 pp.
Williams, R.J. and Watford, F.A. (1999). Distribution of seagrass, mangrove and saltmarsh in the Cowan Creek Catchment Management Area. Contract report to SHURE and the Cowan Creek Catchment Management Committee. 27 pp.
Williams, R.J., West, G., Morrison D. and Creese R.G. 2007. Estuarine Resources of NSW. In: The NSW Comprehensive Coastal Assessment Toolkit. CD ROM, ISBN 0 7347 5805 7. NSW Department of Planning. 61pp.

90 Industry & Investment NSW
Mapping the habitats of NSW estuaries – Creese, Glasby, West & Gallen
6. APPENDICIES
Appendix 1. 1:25000 map series index for the coastal habitats of NSW.

Other titles in the series 91
Mapping the habitats of NSW estuaries – Creese, Glasby, West & Gallen
Other titles in this series:
ISSN 1440-3544 (NSW Fisheries Final Report Series)
No. 1 Andrew, N.L., Graham, K.J., Hodgson, K.E. and Gordon, G.N.G., 1998. Changes after 20 years in relative abundance and size composition of commercial fishes caught during fishery independent surveys on SEF trawl grounds.
No. 2 Virgona, J.L., Deguara, K.L., Sullings, D.J., Halliday, I. and Kelly, K., 1998. Assessment of the stocks of sea mullet in New South Wales and Queensland waters.
No. 3 Stewart, J., Ferrell, D.J. and Andrew, N.L., 1998. Ageing Yellowtail (Trachurus novaezelandiae) and Blue Mackerel (Scomber australasicus) in New South Wales.
No. 4 Pethebridge, R., Lugg, A. and Harris, J., 1998. Obstructions to fish passage in New South Wales South Coast streams. 70pp.
No. 5 Kennelly, S.J. and Broadhurst, M.K., 1998. Development of by-catch reducing prawn-trawls and fishing practices in NSW's prawn-trawl fisheries (and incorporating an assessment of the effect of increasing mesh size in fish trawl gear). 18pp + appendices.
No. 6 Allan, G.L. and Rowland, S.J., 1998. Fish meal replacement in aquaculture feeds for silver perch. 237pp + appendices.
No. 7 Allan, G.L., 1998. Fish meal replacement in aquaculture feeds: subprogram administration. 54pp + appendices.
No. 8 Heasman, M.P., O'Connor, W.A. and O'Connor, S.J., 1998. Enhancement and farming of scallops in NSW using hatchery produced seedstock. 146pp.
No. 9 Nell, J.A., McMahon, G.A. and Hand, R.E., 1998. Tetraploidy induction in Sydney rock oysters. 25pp.
No. 10 Nell, J.A. and Maguire, G.B., 1998. Commercialisation of triploid Sydney rock and Pacific oysters. Part 1: Sydney rock oysters. 122pp.
No. 11 Watford, F.A. and Williams, R.J., 1998. Inventory of estuarine vegetation in Botany Bay, with special reference to changes in the distribution of seagrass. 51pp.
No. 12 Andrew, N.L., Worthington D.G., Brett, P.A. and Bentley N., 1998. Interactions between the abalone fishery and sea urchins in New South Wales.
No. 13 Jackson, K.L. and Ogburn, D.M., 1999. Review of depuration and its role in shellfish quality assurance. 77pp.
No. 14 Fielder, D.S., Bardsley, W.J. and Allan, G.L., 1999. Enhancement of Mulloway (Argyrosomus japonicus) in intermittently opening lagoons. 50pp + appendices.
No. 15 Otway, N.M. and Macbeth, W.G., 1999. The physical effects of hauling on seagrass beds. 86pp.
No. 16 Gibbs, P., McVea, T. and Louden, B., 1999. Utilisation of restored wetlands by fish and invertebrates. 142pp.
No. 17 Ogburn, D. and Ruello, N., 1999. Waterproof labelling and identification systems suitable for shellfish and other seafood and aquaculture products. Whose oyster is that? 50pp.
No. 18 Gray, C.A., Pease, B.C., Stringfellow, S.L., Raines, L.P. and Walford, T.R., 2000. Sampling estuarine fish species for stock assessment. Includes appendices by D.J. Ferrell, B.C. Pease, T.R. Walford, G.N.G. Gordon, C.A. Gray and G.W. Liggins. 194pp.
No. 19 Otway, N.M. and Parker, P.C., 2000. The biology, ecology, distribution, abundance and identification of marine protected areas for the conservation of threatened Grey Nurse Sharks in south east Australian waters. 101pp.
No. 20 Allan, G.L. and Rowland, S.J., 2000. Consumer sensory evaluation of silver perch cultured in ponds on meat meal based diets. 21pp + appendices.
No. 21 Kennelly, S.J. and Scandol, J. P., 2000. Relative abundances of spanner crabs and the development of a population model for managing the NSW spanner crab fishery. 43pp + appendices.
No. 22 Williams, R.J., Watford, F.A. and Balashov, V., 2000. Kooragang Wetland Rehabilitation Project: History of changes to estuarine wetlands of the lower Hunter River. 82pp.
No. 23 Survey Development Working Group, 2000. Development of the National Recreational and Indigenous Fishing Survey. Final Report to Fisheries Research and Development Corporation. (Volume 1 – 36pp + Volume 2 – attachments).
No.24 Rowling, K.R and Raines, L.P., 2000. Description of the biology and an assessment of the fishery of Silver Trevally Pseudocaranx dentex off New South Wales. 69pp.
No. 25 Allan, G.L., Jantrarotai, W., Rowland, S., Kosuturak, P. and Booth, M., 2000. Replacing fishmeal in aquaculture diets. 13pp.

92 Other titles in the series
Mapping the habitats of NSW estuaries – Creese, Glasby, West & Gallen
No. 26 Gehrke, P.C., Gilligan, D.M. and Barwick, M., 2001. Fish communities and migration in the Shoalhaven River – Before construction of a fishway. 126pp.
No. 27 Rowling, K.R. and Makin, D.L., 2001. Monitoring of the fishery for Gemfish Rexea solandri, 1996 to 2000. 44pp.
No. 28 Otway, N.M., 1999. Identification of candidate sites for declaration of aquatic reserves for the conservation of rocky intertidal communities in the Hawkesbury Shelf and Batemans Shelf Bioregions. 88pp.
No. 29 Heasman, M.P., Goard, L., Diemar, J. and Callinan, R., 2000. Improved Early Survival of Molluscs: Sydney Rock Oyster (Saccostrea glomerata). 63pp.
No. 30 Allan, G.L., Dignam, A and Fielder, S., 2001. Developing Commercial Inland Saline Aquaculture in Australia: Part 1. R&D Plan.
No. 31 Allan, G.L., Banens, B. and Fielder, S., 2001. Developing Commercial Inland Saline Aquaculture in Australia: Part 2. Resource Inventory and Assessment. 33pp.
No. 32 Bruce, A., Growns, I. and Gehrke, P., 2001. Woronora River Macquarie Perch Survey. 116pp.
No. 33 Morris, S.A., Pollard, D.A., Gehrke, P.C. and Pogonoski, J.J., 2001. Threatened and Potentially Threatened Freshwater Fishes of Coastal New South Wales and the Murray-Darling Basin. 177pp.
No. 34 Heasman, M.P., Sushames, T.M., Diemar, J.A., O’Connor, W.A. and Foulkes, L.A., 2001. Production of Micro-algal Concentrates for Aquaculture Part 2: Development and Evaluation of Harvesting, Preservation, Storage and Feeding Technology. 150pp + appendices.
No. 35 Stewart, J. and Ferrell, D.J., 2001. Mesh selectivity in the NSW demersal trap fishery. 86pp.
No. 36 Stewart, J., Ferrell, D.J., van der Walt, B., Johnson, D. and Lowry, M., 2001. Assessment of length and age composition of commercial kingfish landings. 49pp.
No. 37 Gray, C.A. and Kennelly, S.J., 2001. Development of discard-reducing gears and practices in the estuarine prawn and fish haul fisheries of NSW. 151pp.
No. 38 Murphy, J.J., Lowry, M.B., Henry, G.W. and Chapman, D., 2002. The Gamefish Tournament Monitoring Program – 1993 to 2000. 93pp.
No. 39 Kennelly, S.J. and McVea, T.A. (Ed), 2002. Scientific reports on the recovery of the Richmond and Macleay Rivers following fish kills in February and March 2001. 325pp.
No. 40 Pollard, D.A. and Pethebridge, R.L., 2002. Report on Port of Botany Bay Introduced Marine Pest Species Survey. 69pp.
No. 41 Pollard, D.A. and Pethebridge, R.L., 2002. Report on Port Kembla Introduced Marine Pest Species Survey. 72pp.
No. 42 O’Connor, W.A, Lawler, N.F. and Heasman, M.P., 2003. Trial farming the akoya pearl oyster, Pinctada imbricata, in Port Stephens, NSW. 170pp.
No. 43 Fielder, D.S. and Allan, G.L., 2003. Improving fingerling production and evaluating inland saline water culture of snapper, Pagrus auratus. 62pp.
No. 44 Astles, K.L., Winstanley, R.K., Harris, J.H. and Gehrke, P.C., 2003. Experimental study of the effects of cold water pollution on native fish. 55pp.
No. 45 Gilligan, D.M., Harris, J.H. and Mallen-Cooper, M., 2003. Monitoring changes in the Crawford River fish community following replacement of an effective fishway with a vertical-slot fishway design: Results of an eight year monitoring program. 80pp.
No. 46 Pollard, D.A. and Rankin, B.K., 2003. Port of Eden Introduced Marine Pest Species Survey. 67pp.
No. 47 Otway, N.M., Burke, A.L., Morrison, NS. and Parker, P.C., 2003. Monitoring and identification of NSW Critical Habitat Sites for conservation of Grey Nurse Sharks. 62pp.
No. 48 Henry, G.W. and Lyle, J.M. (Ed), 2003. The National Recreational and Indigenous Fishing Survey. 188 pp.
No. 49 Nell, J.A., 2003. Selective breeding for disease resistance and fast growth in Sydney rock oysters. 44pp. (Also available – a CD-Rom published in March 2004 containing a collection of selected manuscripts published over the last decade in peer-reviewed journals).
No. 50 Gilligan, D. and Schiller, S., 2003. Downstream transport of larval and juvenile fish. 66pp.
No. 51 Liggins, G.W., Scandol, J.P. and Kennelly, S.J., 2003. Recruitment of Population Dynamacist. 44pp.
No. 52 Steffe, A.S. and Chapman, J.P., 2003. A survey of daytime recreational fishing during the annual period, March 1999 to February 2000, in Lake Macquarie, New South Wales. 124pp.
No. 53 Barker, D. and Otway, N., 2003. Environmental assessment of zinc coated wire mesh sea cages in Botany Bay NSW. 36pp.
No. 54 Growns, I., Astles, A. and Gehrke, P., 2003. Spatial and temporal variation in composition of riverine fish communities. 24pp.

Other titles in the series 93
Mapping the habitats of NSW estuaries – Creese, Glasby, West & Gallen
No. 55 Gray, C. A., Johnson, D.D., Young, D.J. and Broadhurst, M. K., 2003. Bycatch assessment of the Estuarine Commercial Gill Net Fishery in NSW. 58pp.
No. 56 Worthington, D.G. and Blount, C., 2003. Research to develop and manage the sea urchin fisheries of NSW and eastern Victoria. 182pp.
No. 57 Baumgartner, L.J., 2003. Fish passage through a Deelder lock on the Murrumbidgee River, Australia. 34pp.
No. 58 Allan, G.L., Booth, M.A., David A.J. Stone, D.A.J. and Anderson, A.J., 2004. Aquaculture Diet Development Subprogram: Ingredient Evaluation. 171pp.
No. 59 Smith, D.M., Allan, G.L. and Booth, M.A., 2004. Aquaculture Diet Development Subprogram: Nutrient Requirements of Aquaculture Species. 220pp.
No. 60 Barlow, C.G., Allan, G.L., Williams, K.C., Rowland, S.J. and Smith, D.M., 2004. Aquaculture Diet Development Subprogram: Diet Validation and Feeding Strategies. 197pp.
No. 61 Heasman, M.H., 2004. Sydney Rock Oyster Hatchery Workshop 8 – 9 August 2002, Port Stephens, NSW. 115pp.
No. 62 Heasman, M., Chick, R., Savva, N., Worthington, D., Brand, C., Gibson, P. and Diemar, J., 2004. Enhancement of populations of abalone in NSW using hatchery-produced seed. 269pp.
No. 63 Otway, N.M. and Burke, A.L., 2004. Mark-recapture population estimate and movements of Grey Nurse Sharks. 53pp.
No. 64 Creese, R.G., Davis, A.R. and Glasby, T.M., 2004. Eradicating and preventing the spread of the invasive alga Caulerpa taxifolia in NSW. 110pp.
No. 65 Baumgartner, L.J., 2004. The effects of Balranald Weir on spatial and temporal distributions of lower Murrumbidgee River fish assemblages. 30pp.
No. 66 Heasman, M., Diggles, B.K., Hurwood, D., Mather, P., Pirozzi, I. and Dworjanyn, S., 2004. Paving the way for continued rapid development of the flat (angasi) oyster (Ostrea angasi) farming in New South Wales. 40pp.
ISSN 1449-9967 (NSW Department of Primary Industries – Fisheries Final Report Series)
No. 67 Kroon, F.J., Bruce, A.M., Housefield, G.P. and Creese, R.G., 2004. Coastal floodplain management in eastern Australia: barriers to fish and invertebrate recruitment in acid sulphate soil catchments. 212pp.
No. 68 Walsh, S., Copeland, C. and Westlake, M., 2004. Major fish kills in the northern rivers of NSW in 2001: Causes, Impacts & Responses. 55pp.
No. 69 Pease, B.C. (Ed), 2004. Description of the biology and an assessment of the fishery for adult longfinned eels in NSW. 168pp.
No. 70 West, G., Williams, R.J. and Laird, R., 2004. Distribution of estuarine vegetation in the Parramatta River and Sydney Harbour, 2000. 37pp.
No. 71 Broadhurst, M.K., Macbeth, W.G. and Wooden, M.E.L., 2005. Reducing the discarding of small prawns in NSW's commercial and recreational prawn fisheries. 202pp.
No. 72. Graham, K.J., Lowry, M.B. and Walford, T.R., 2005. Carp in NSW: Assessment of distribution, fishery and fishing methods. 88pp.
No. 73 Stewart, J., Hughes, J.M., Gray, C.A. and Walsh, C., 2005. Life history, reproductive biology, habitat use and fishery status of eastern sea garfish (Hyporhamphus australis) and river garfish (H. regularis ardelio) in NSW waters. 180pp.
No. 74 Growns, I. and Gehrke, P., 2005. Integrated Monitoring of Environmental Flows: Assessment of predictive modelling for river flows and fish. 33pp.
No. 75 Gilligan, D., 2005. Fish communities of the Murrumbidgee catchment: Status and trends. 138pp.
No. 76 Ferrell, D.J., 2005. Biological information for appropriate management of endemic fish species at Lord Howe Island. 18 pp.
No. 77 Gilligan, D., Gehrke, P. and Schiller, C., 2005. Testing methods and ecological consequences of large-scale removal of common carp. 46pp.
No. 78 Boys, C.A., Esslemont, G. and Thoms, M.C., 2005. Fish habitat and protection in the Barwon-Darling and Paroo Rivers. 118pp.
No. 79 Steffe, A.S., Murphy, J.J., Chapman, D.J. and Gray, C.C., 2005. An assessment of changes in the daytime recreational fishery of Lake Macquarie following the establishment of a ‘Recreational Fishing Haven’. 103pp.
No. 80 Gannassin, C. and Gibbs, P., 2005. Broad-Scale Interactions Between Fishing and Mammals, Reptiles and Birds in NSW Marine Waters. 171pp.

94 Other titles in the series
Mapping the habitats of NSW estuaries – Creese, Glasby, West & Gallen
No. 81 Steffe, A.S., Murphy, J.J., Chapman, D.J., Barrett, G.P. and Gray, C.A., 2005. An assessment of changes in the daytime, boat-based, recreational fishery of the Tuross Lake estuary following the establishment of a 'Recreational Fishing Haven'. 70pp.
No. 82 Silberschnieder, V. and Gray, C.A., 2005. Arresting the decline of the commercial and recreational fisheries for mulloway (Argyrosomus japonicus). 71pp.
No. 83 Gilligan, D., 2005. Fish communities of the Lower Murray-Darling catchment: Status and trends. 106pp.
No. 84 Baumgartner, L.J., Reynoldson, N., Cameron, L. and Stanger, J., 2006. Assessment of a Dual-frequency Identification Sonar (DIDSON) for application in fish migration studies. 33pp.
No. 85 Park, T., 2006. FishCare Volunteer Program Angling Survey: Summary of data collected and recommendations. 41pp.
No. 86 Baumgartner, T., 2006. A preliminary assessment of fish passage through a Denil fishway on the Edward River, Australia. 23pp.
No. 87 Stewart, J., 2007. Observer study in the Estuary General sea garfish haul net fishery in NSW. 23pp.
No. 88 Faragher, R.A., Pogonoski, J.J., Cameron, L., Baumgartner, L. and van der Walt, B., 2007. Assessment of a stocking program: Findings and recommendations for the Snowy Lakes Trout Strategy. 46pp.
No. 89 Gilligan, D., Rolls, R., Merrick, J., Lintermans, M., Duncan, P. and Kohen, J., 2007. Scoping knowledge requirements for Murray crayfish (Euastacus armatus). Final report to the Murray Darling Basin Commission for Project No. 05/1066 NSW 103pp.
No. 90 Kelleway, J., Williams. R.J. and Allen, C.B., 2007. An assessment of the saltmarsh of the Parramatta River and Sydney Harbour. 100pp.
No. 91 Williams, R.J. and Thiebaud, I., 2007. An analysis of changes to aquatic habitats and adjacent land-use in the downstream portion of the Hawkesbury Nepean River over the past sixty years. 97pp.
No. 92 Baumgartner, L., Reynoldson, N., Cameron, L. and Stanger, J. The effects of selected irrigation practices on fish of the Murray-Darling Basin. 90pp.
No. 93 Rowland, S.J., Landos, M., Callinan, R.B., Allan, G.L., Read, P., Mifsud, C., Nixon, M., Boyd, P. and Tally, P., 2007. Development of a health management strategy for the Silver Perch Aquaculture Industry. 219pp.
No. 94 Park, T., 2007. NSW Gamefish Tournament Monitoring – Angling Research Monitoring Program. Final report to the NSW Recreational Fishing Trust. 142pp.
No. 95 Heasman, M.P., Liu, W., Goodsell, P.J., Hurwood D.A. and Allan, G.L., 2007. Development and delivery of technology for production, enhancement and aquaculture of blacklip abalone (Haliotis rubra) in New South Wales. 226pp.
No. 96 Ganassin, C. and Gibbs, P.J., 2007. A review of seagrass planting as a means of habitat compensation following loss of seagrass meadow. 41pp.
No. 97 Stewart, J. and Hughes, J., 2008. Determining appropriate harvest size at harvest for species shared by the commercial trap and recreational fisheries in New South Wales. 282pp.
No. 98 West, G. and Williams, R.J., 2008. A preliminary assessment of the historical, current and future cover of seagrass in the estuary of the Parramatta River. 61pp.
No. 99 Williams, D.L. and Scandol, J.P., 2008. Review of NSW recreational fishing tournament-based monitoring methods and datasets. 83pp.
No. 100 Allan, G.L., Heasman, H. and Bennison, S., 2008. Development of industrial-scale inland saline aquaculture: Coordination and communication of R&D in Australia. 245pp.
No. 101 Gray, C.A and Barnes, L.M., 2008. Reproduction and growth of dusky flathead (Platycephalus fuscus) in NSW estuaries. 26pp.
No. 102 Graham, K.J., 2008. The Sydney inshore trawl-whiting fishery: codend selectivity and fishery characteristics. 153pp.
No. 103 Macbeth, W.G., Johnson, D.D. and Gray, C.A., 2008. Assessment of a 35-mm square-mesh codend and composite square-mesh panel configuration in the ocean prawn-trawl fishery of northern New South Wales. 104pp.
No. 104 O’Connor, W.A., Dove, M. and Finn, B., 2008. Sydney rock oysters: Overcoming constraints to commercial scale hatchery and nursery production. 119pp.
No. 105 Glasby, T.M. and Lobb, K., 2008. Assessing the likelihoods of marine pest introductions in Sydney estuaries: A transport vector approach. 84pp.
No. 106 Rotherham, D., Gray, C.A., Underwood, A.J., Chapman, M.G. and Johnson, D.D., 2008. Developing fishery-independent surveys for the adaptive management of NSW’s estuarine fisheries. 135pp.
No. 107 Broadhurst, M., 2008. Maximising the survival of bycatch discarded from commercial estuarine fishing gears in NSW. 192pp.

Other titles in the series 95
Mapping the habitats of NSW estuaries – Creese, Glasby, West & Gallen
No. 108 Gilligan, D., McLean, A. and Lugg, A., 2009. Murray Wetlands and Water Recovery Initiatives: Rapid assessment of fisheries values of wetlands prioritised for water recovery. 69pp.
No. 109 Williams, R.J. and Thiebaud, I., 2009. Occurrence of freshwater macrophytes in the catchments of the Parramatta River, Lane Cove River and Middle Harbour Creek, 2007 – 2008. 75pp.
No. 110 Gilligan, D., Vey, A. and Asmus, M., 2009. Identifying drought refuges in the Wakool system and assessing status of fish populations and water quality before, during and after the provision of environmental, stock and domestic flows. 56pp.
ISSN 1837-2112 (Industry & Investment NSW – Fisheries Final Report Series)
No. 111 Gray, C.A., Scandol. J.P., Steffe, A.S. and Ferrell, D.J., 2009. Australian Society for Fish Biology Annual Conference & Workshop 2008: Assessing Recreational Fisheries; Current and Future Challenges. 54pp
No. 112 Otway, N.M. Storrie, M.T., Louden, B.M. and Gilligan, J.J., 2009. Documentation of depth-related migratory movements, localised movements at critical habitat sites and the effects of scuba diving for the east coast grey nurse shark population. 90pp.
No. 113 Creese, R.G., Glasby, T.M., West, G. and Gallen, C., 2009. Mapping the habitats of NSW estuaries. 95pp.