Mapping the future Converting storylines to maps Nasser Olwero GMP, Bangkok April 2-6 2012.
24
Mapping the future Converting storylines to maps Nasser Olwero GMP, Bangkok April 2-6 2012
-
Upload
mitchell-barnett -
Category
Documents
-
view
214 -
download
1
Transcript of Mapping the future Converting storylines to maps Nasser Olwero GMP, Bangkok April 2-6 2012.

Mapping the futureConverting storylines to maps
Nasser Olwero
GMP, Bangkok April 2-6 2012

Scenarios
• They are not necessarily predictions• Scenarios
– Narratives of alternative environments in which today’s decisions may be played out (Adam Gordon – futuresavvy.net)
– alternative pathways into the future– Plausible future– “What if” analysis

Introduction
• Landcover change scenarios• Modeling landcover change
– Determined by factors, but has a random component
• Need for scenarios tool in InVEST• Terrestrial vs Marine• Tier 0?

Land cover change modeling
• Quantity of change– How much is changing?– Stakeholder storylines
• Transition probabilities– Statistical methods – regression, Bayesian probabilities….– Artificial intelligence – artificial neural networks– Stakeholder estimates
• Factors – spatial and environmental characteristics• Decision rules
– Drivers, actors influence– Eg development can occur only in areas less than 35% slope
• Constraints• Transition procedures

What are the storylines?
Landcover Types Change Rules
Broadleaved tree plantation increase
along roads, in poor soils, on hilltops, difficult to cultivate areas, in and around cfrs & lfrs,
Coniferous plantation increase
along roads, in poor soils, on hilltops, difficult to cultivate areas, in and around cfrs & lfrs,
Tropical high forest increase in and around cfrs and lfrs, not in nps
Degraded forest decrease in and around cfrs and lfrs, not in nps
Woodland increase outside pas

How do you move from story to map?
Landcover Types Change Rules
Broadleaved tree plantation increase
along roads, in poor soils, on hilltops, difficult to cultivate areas, in and around cfrs & lfrs,
Coniferous plantation increase
along roads, in poor soils, on hilltops, difficult to cultivate areas, in and around cfrs & lfrs,
Tropical high forest increase
in and around cfrs and lfrs, not in nps
Degraded forest decreasein and around cfrs and lfrs, not in nps
Woodland increase outside pas
?

Land cover transition
(Swetnam et al 2010)

Land cover transition
Forest AgricultureGrassland
built
72
13
1
Original
Forest AgricultureGrassland BuiltScenario
New cover

Objectives: Cover as Objective
• Land cover change is driven by an objective and the objective determines the decision rule
• Objective can be complimentary or conflicting• Single objective modeling is simpler than multi-
objective• Examples of objectives are: agricultural
development, conservation, urbanization etc• In this model, the cover type is used as a proxy
for the objective. Cover types that increase represent some objectives

Factors
• Factors are criteria that increases or reduces the suitability of a parcel for a specific objective
• Proximity attributes that determine where change occurs – Roads [transportation, ]– Rivers [transportation, proximity to water]– Slope [access, ag suitability]– Cities [market, population pressure]
• Rules combined added to attributes creates a suitability layer

Constraints
• Limit the alternatives• Create exceptions [‘no go’]• Constraints can be simple (specific areas cannot be
affected) or more complex (eg minimum area required for large scale agriculture)
• Constraints have varied degrees of porosity– 0 – no change– 1 – no effect on change
• Multiple constraint layers combined by taking the minimum value
• An example is protected areas

Criteria Evaluation
• Land cover change analysis is a decision strategy analysis
• Developing scenarios based on decision strategy helps make them more realistic and plausible

Multi Criteria Evaluation
Slope
Fact
ors
Wei
ghts w1
Dist to Roads Elevation
w2 w3
< 35% < 5km > 1000mx1 (std 0-1) X2 (std 0-1) X3 (std 0-1)
Suitability (x1w1 x2w2 x2w2) * Constraints+ +=
pixels with suitability values above threshold are converted
Decision Rules
Assigned by AHP
Threshold
User sets goal of conversion quantitiesAddition of likelihood matrix and Overrides

Calculating weights with AHP
• Its easy to assign weight for a few criteria but with more criteria, it becomes problematic
• AHP is used to assign weights by comparing two factors at a time – much easier
• A comparison matrix is prepared• Eigenvectors used to compute the weights• In this model AHP is used both for weighting
criteria and objectives (cover types)

AHP in a nutshell
• Objective: Find areas to convert for agriculture• Criteria: Soils, Rainfall, Distance to roads,
Distance to Market• How do you weight them? Compare each 2!
Soils Rainfall Roads Market Weight
Soils 1 0.2856
Rainfall 2/1 1 0.4525
Roads 1/2 1/4 1 0.0965
Market 1/3 1/3 3/1 1 0.1654

The Matrix
Forest
Grassland
Agriculture
Urban
Change
Proximity
Proximity distance
Priority
/Forest 0 1 7 2 -30% 0 0 0
Grassland 0 0 3 1 -40% 0 0 0
Agriculture 0 0 0 0 50 1 10 2
Urban 0 0 0 0 10 1 5 1
Location QuantityGAI
N
LOSS

Preparing Suitabilitylayers
Likelihood(+)
Factors(+)
Proximity (+)
Constraints (x)
weighted
Aggregate transition probability/suitability
Rules

AHP Tool
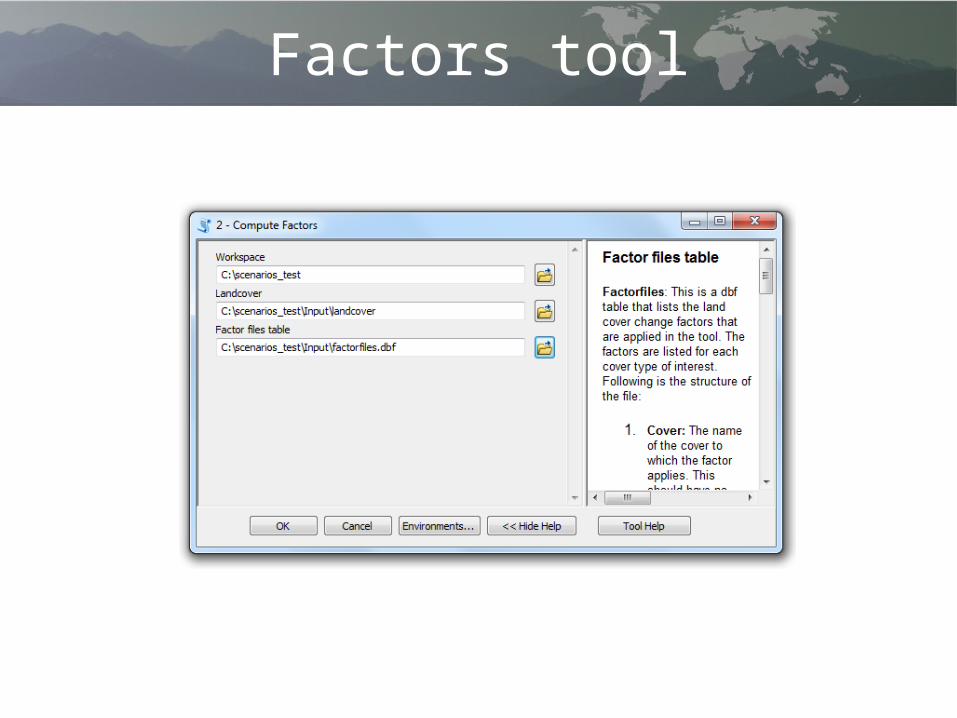
Factors tool

Scenario Generator

Changing the pixel
• Process each cover in order of priority• Calculate quantity of change from % change
given in matrix• Convert pixels starting from suitability values
10 down to 1 until target area change is attained
• If number of pixels required is less than number available in the group, select randomly. Clumping algorithm used.
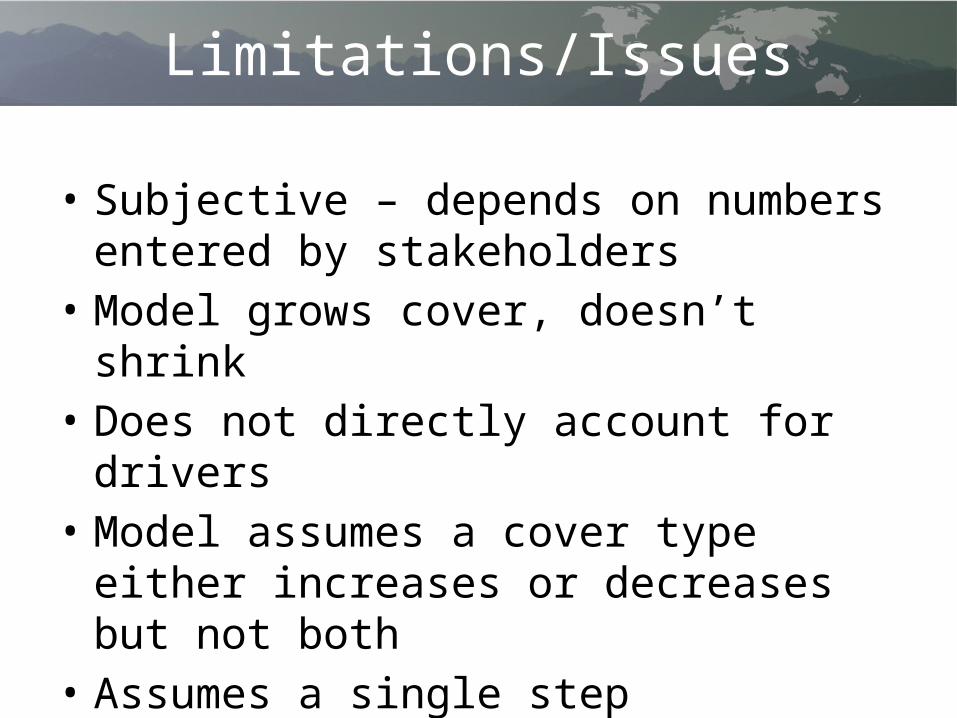
Limitations/Issues
• Subjective – depends on numbers entered by stakeholders
• Model grows cover, doesn’t shrink• Does not directly account for drivers• Model assumes a cover type either increases
or decreases but not both• Assumes a single step transition• Cover grows as a % of existing cover

Virungas Example
Current
BAU
Market
Green

Virungas Example