Mapping State Proficiency Standards Onto the NAEP Scales · proficiency standards onto the NAEP...
16
Mapping State Proficiency Standards Onto the NAEP Scales: Results From the 2015 NAEP Reading and Mathematics Assessments NCES 2018-159 U.S. DEPARTMENT OF EDUCATION
Transcript of Mapping State Proficiency Standards Onto the NAEP Scales · proficiency standards onto the NAEP...

Mapping State Proficiency Standards Onto the NAEP Scales:
Results From the 2015 NAEP Reading and Mathematics
Assessments
NCES 2018-159
U.S. DEPARTMENT OF EDUCATION
What Is NAEP?
The National Assessment of Educational Progress (NAEP), also known as The Nation’s Report Card™, is an assessment program conducted by the National Center for Education Statistics (NCES) to inform the public of what elementary and secondary students in the United States know and can do in various subject areas, including reading, mathematics, and science. Since 1969, NAEP has been administered periodically to students in order to report results for the nation, participating states, and selected large urban school districts. The National Assessment Governing Board oversees and sets policy for the NAEP program. Additional information about NAEP is available at http://nces.ed.gov/nationsreportcard/.

MAPPING STATE PROFICIENCY STANDARDS ONTO THE NAEP SCALES:Results From the 2015 NAEP Reading and Mathematics Assessments 1
About the Study
During the past 15 years, the National Center for Education Statistics (NCES) has published reports in which the National Assessment of Educational Progress (NAEP) is used for comparing the proficiency standards that students have to meet in each state. This sixth report highlights results of mapping state proficiency standards onto the NAEP scales using state assessment results for public schools from the 2014–15 school year and the 2015 NAEP assessments. The report focuses on the reading and mathematics standards that states set for grades 4 and 8 for federal reporting under the 2001 and 2015 reauthorizations of the Elementary and Secondary Education Act of 1965. By placing standards onto the NAEP scales, a common metric to all states, it is possible to compare the standards that students are expected to meet in each state.
The report draws special attention to the changes in state assessment practices to measure student achievement using the college and career readiness standards adopted by the majority of states. For each state, the report displays the NAEP equivalent score, which is the placement of state standards for proficient performance in reading and mathematics onto the 0–500 NAEP scale. In addition, the NAEP equivalent scores are shown with respect to the NAEP achievement levels: below Basic, Basic, and Proficient levels.
Some states participated in one of three testing programs: ACT Aspire, Partnership for Assessment of Readiness for College and Careers, or Smarter Balanced Assessment Consortium (hereinafter referred to, respectively, as ACT, PARCC, and SBAC). For those states, NAEP equivalent scores were estimated in two ways. First, the scores were estimated for the testing program as a whole by considering the participating states as one single jurisdiction. The figures in the main report show these estimates. Second, the NAEP equivalent scores were estimated for each state individually. Tables in the Technical Notes present these estimates.
Overall, in 2015 the ranges between the highest and lowest NAEP equivalent scores of the state standard for proficient performance were smaller than in 2013. Most state standards in both grades and subjects mapped at the NAEP Basic level. It should be noted that the 2015 mapping study did not include all states for various reasons. A brief explanation for exclusion is provided in the Technical Notes.
The mapping study is not an evaluation of the various state assessments or of the quality of the states’ achievement standards. State assessments and NAEP are developed for different purposes and have different goals, and they may vary in format and administration. The analyses presented do not address questions about the differences between state assessments and NAEP. Findings of different standards should not be interpreted as evidence of deficiencies either in state assessments or in NAEP. The mapping of state achievement standards onto the NAEP scales and comparing them with NAEP achievement levels only gives context to the discussion on achievement standards and their rigor. The mapping of the state standards does not imply that the NAEP achievement levels are more valid than the state standards or that states should emulate NAEP standards.
The Technical Notes at the end of this report present a brief overview of the methodology, a description of data sources, and tables that complement the text and figures in the body of the report. The mapping methodology and previous results are discussed in detail in earlier reports, which are available at http://nces.ed.gov/nationsreportcard/studies/statemapping/.

MAPPING STATE PROFICIENCY STANDARDS ONTO THE NAEP SCALES:Results From the 2015 NAEP Reading and Mathematics Assessments2
2015 Grade 4 ReadingNAEP scale equivalents of state grade 4 reading standards for proficient performance, by state: 2015
190
0
200
210
220
230
240
250
260
500
180
State
NAEP equivalent score ±2 standard errors
SBAC
ACT PARCC
NAEP Proficient (238)
NAEP Basic (208)
NAEP equivalent score
NYUT
GARINMNJMSMDILDCCOARSCALNC
TNAKAZKYWIWVWAVTSDORNHMIMEIDHIDECTCAFLMNPAWYKS
MO
INOK
OHVAIA
TXNELA
• In reading, 43 of 47 states included in the study had grade 4 standards at or above the NAEP Basic level. Two states, New York and Utah, had standards at the NAEP Proficient level.
• All three testing programs—ACT Aspire (ACT), Partnership for Assessment of Readiness for College and Careers (PARCC), and Smarter Balanced Assessment Consortium (SBAC)—had standards that mapped at the NAEP Basic level.
Number of states, by state standards for proficient performance in grade 4 reading classified into NAEP achievement levels: 2013 and 2015
NAEP achievement level
20152013
Number of states
Below Basic
Basic
Proficient
0 10 20 30 40 50
22
22
41
234
• Forty-three states had grade 4 reading standards at or above the NAEP Basic level in 2015, an increase from 24 states in 2013 for the same set of 47 states.
• Four of 47 states had standards that were below NAEP Basic in 2015, a decrease from the 23 states with standards that were below NAEP Basic in 2013 for the same set of 47 states.
Range between the highest and lowest NAEP scale equivalent scores of state standards for proficient performance in grade 4 reading: 2013 and 2015
Year2013 2015
160
180
200
220
240
260243 241
193
167
7648
0
500NAEP equivalent score • The difference between the NAEP equivalent scores of the
states with the lowest and highest proficiency standards for grade 4 reading, Louisiana and New York, respectively, in 2015, was 48 points on the NAEP scale, 28 points narrower than in 2013 for the same set of 47 states.
• The 48-point difference between the highest and lowest standards is about one and a half times larger than the 30-point difference between NAEP Basic and Proficient levels set for grade 4 reading.
NOTE: Massachusetts, Montana, Nevada, and North Dakota were not included in the study due to data not being available. For comparability, these four states are excluded from the 2013 counts. Although Louisiana and Ohio administered the PARCC assessment, they were not included in the estimation of the NAEP scale equivalent of the PARCC proficiency standard because both states used PARCC’s Approaching Expectations level as their standard for proficient. Missouri and Wisconsin administered the SBAC assessment but were not included in the estimation of the NAEP scale equivalent of the SBAC reading standard because of issues related to their test administration. The classification of NAEP equivalent scores into NAEP achievement levels accounts for the margin of error associated with each estimate. Results shown in the charts are based on unrounded numbers.
SOURCE: U.S. Department of Education, Institute of Education Sciences, National Center for Education Statistics, National Assessment of Educational Progress (NAEP), 2013 and 2015 Reading Assessments.

MAPPING STATE PROFICIENCY STANDARDS ONTO THE NAEP SCALES:Results From the 2015 NAEP Reading and Mathematics Assessments 3
2015 Grade 4 Mathematics NAEP scale equivalents of state grade 4 mathematics standards for proficient performance, by state: 2015
190
0
200
210
220
230
240
250
260
500
180
State
NAEP equivalent score ±2 standard errors
SBAC
ACT
PARCCNAEP Proficient (249)
NAEP Basic (214)
NAEP equivalent score
Relative error > .5
RINMNJMSMDILDCCOARKS
PAWYAZNCAKWIWVWAVTSDORNHMOMIMEIDHIDECTCAGAUTNYTNKYFLINMNSCAL
OHTX
OKNELAIA VA
• In mathematics, 47 states had grade 4 standards that were at or above the NAEP Basic level, with 12 states having standards at the NAEP Proficient level.
• The PARCC standard mapped at the NAEP Proficient level, and ACT and SBAC standards mapped at the NAEP Basic level.
Number of states, by state standards for proficient performance in grade 4 mathematics classified into NAEP achievement levels: 2013 and 2015
20152013
Below Basic
Basic
Proficient
0 10 20 30 40 50
412
3935
40
NAEP achievement level
Number of states
• Twelve states had grade 4 mathematics standards at the NAEP Proficient level in 2015, an increase from 4 states in 2013 for the same set of 47 states.
• None of 47 states had standards that were below NAEP Basic in 2015, a decrease from 4 for the same set of 47 states in 2013.
Range between the highest and lowest NAEP scale equivalent scores of state standards for proficient performance in grade 4 mathematics: 2013 and 2015
Year2013 2015
200
240
220
260
280
300
220
49 37
256 257
0
500NAEP equivalent score
207
• The difference between the NAEP equivalent scores of the states with the lowest and highest proficiency standards for grade 4 mathematics, Iowa and PARCC states, respectively, in 2015, was 37 points on the NAEP scale, 12 points narrower than in 2013 for the same set of 47 states.
• The 37-point difference between the highest and lowest standards is similar to the distance between NAEP Basic and Proficient levels set for grade 4 mathematics (35 points).
NOTE: Massachusetts, Montana, Nevada, and North Dakota were not included in the study due to data not being available. For comparability, these four states are excluded from the 2013 counts. Although Louisiana and Ohio administered the PARCC assessment, they were not included in the estimation of the NAEP scale equivalent of the PARCC proficiency standard because both states used PARCC’s Approaching Expectations level as their standard for proficient. The NAEP scale equivalent for Virginia has a relative error greater than .5, and the result should be interpreted with caution. The classification of NAEP equivalent scores into NAEP achievement levels accounts for the margin of error associated with each estimate. Results shown in the charts are based on unrounded numbers.
SOURCE: U.S. Department of Education, Institute of Education Sciences, National Center for Education Statistics, National Assessment of Educational Progress (NAEP), 2013 and 2015 Mathematics Assessments.

MAPPING STATE PROFICIENCY STANDARDS ONTO THE NAEP SCALES:Results From the 2015 NAEP Reading and Mathematics Assessments4
2015 Grade 8 ReadingNAEP scale equivalents of state grade 8 reading standards for proficient performance, by state: 2015
NAEP equivalent score
NAEP Proficient (281)
NAEP Basic (243)
240
230
0
250
260
270
280
290
500
State
NAEP equivalent score ±2 standard errors
ACT SBAC
PARCC
AKNY
AZRINMNJMSMDILDCCOARGANC
WYMNWIPAWVWAVTSDORNHMOMIMEIDHIDECTCASCALTNKY
FLIN
OH
NEVAOK
LA
KS
• For the 44 states that indicated having an end-of-grade reading assessment that all students are required to take, with exception of Louisiana, all grade 8 standards were at or above the NAEP Basic level, with Alaska and Kansas having standards at the NAEP Proficient level.
• All three testing programs, ACT, PARCC, and SBAC, had standards that mapped at the NAEP Basic level.
Number of states, by state standards for proficient performance in grade 8 reading classified into NAEP achievement levels: 2013 and 2015
20152013
Below Basic
Basic
Proficient
0 10 20 30 40 50
NAEP achievement level
Number of states
3441
1
12
9
• Forty-three states had grade 8 reading standards at or above NAEP Basic in 2015, an increase from 35 in 2013 for the same set of 44 states.
• One of 44 states had standards that were placed below the NAEP Basic level in 2015, a decrease from the 9 for the same set of 44 states in 2013.
Range between the highest and lowest NAEP scale equivalent scores of state standards for proficient performance in grade 8 reading: 2013 and 2015
282
199
83
285
237
48
2013 2015
190
210
230
250
290
270
Year0
500NAEP equivalent score • The difference between the NAEP equivalent reading
scores of the states with the lowest and highest proficiency standards for grade 8 reading, Louisiana and Kansas, respectively, in 2015, was 48 points on the NAEP scale, 35 points narrower than in 2013 for the same set of 44 states.
• The 48-point difference between the highest and lowest standards is larger than the difference between the NAEP Basic and Proficient levels set for grade 8 reading (38 points).
NOTE: Massachusetts, Montana, Nevada, and North Dakota were not included in the study due to data not being available. States that did not have a general end-of-grade reading/English language arts assessment in grade 8 required for all students were not included in the analysis. For comparability, the same set of 44 states is included in the 2013 counts. Although Louisiana and Ohio administered the PARCC assessment, they were not included in the estimation of the NAEP scale equivalent of the PARCC proficiency standard because both states used PARCC’s Approaching Expectations level as the standard for proficient. Wisconsin administered the SBAC assessment but was not included in the estimation of the NAEP scale equivalent of the SBAC reading standard because of issues related to its test administration. The classification of NAEP equivalent scores into NAEP achievement levels accounts for the margin of error associated with each estimate. Results shown in the charts are based on unrounded numbers.
SOURCE: U.S. Department of Education, Institute of Education Sciences, National Center for Education Statistics, National Assessment of Educational Progress (NAEP), 2013 and 2015 Reading Assessments.

MAPPING STATE PROFICIENCY STANDARDS ONTO THE NAEP SCALES:Results From the 2015 NAEP Reading and Mathematics Assessments 5
2015 Grade 8 Mathematics NAEP scale equivalents of state grade 8 mathematics standards for proficient performance, by state: 2015
NAEP equivalent score
NAEP Proficient (299)
NAEP Basic (262)
0
260
250
270
280
290
300
310
500
State
NAEP equivalent score ±2 standard errors
KSPAAK
NMNJMSMDILAZ
NCWIWVWAVTSDORNHMIMEIDHIDECTCA
GASCALWYMNIN
KY
NE
LA
SBACACT
PARCC
State
• For the 33 states that indicated having an end-of-grade mathematics assessment that all students are required to take, all grade 8 standards were at or above the NAEP Basic achievement level, with 9 states having standards at the NAEP Proficient level.
• The PARCC standard mapped at the NAEP Proficient level, and ACT and SBAC standards mapped at the NAEP Basic level.
Number of states, by state standards for proficient performance in grade 8 mathematics classified into NAEP achievement levels: 2013 and 2015
20152013
Below Basic
Basic
Proficient
0 10 20 30 40 50
NAEP achievement level
Number of states
19
2524
06
• All grade 8 mathematics standards for the 33 states included in the study mapped at or above NAEP Basic level in 2015. The number of states with standards at the NAEP Proficient level increased to 9 states in 2015 from 1 state in 2013, for the same set of 32 states with both years of data.
• None of the 33 states had standards that were below NAEP Basic in 2015, a decrease of 6 from 2013 for the same set of 32 states with both years of data.
Range between the highest and lowest NAEP scale equivalent scores of state standards for proficient performance in grade 8 mathematics: 2013 and 2015
2013 2015
220
0
240
260
280
300
320
500NAEP equivalent score
Year
244
58
302
261
48
309
• The difference between the NAEP equivalent scores of the states with the lowest and highest proficiency standards for grade 8 mathematics, Louisiana and Kansas, respectively, in 2015, was 48 points on the NAEP scale, 10 points narrower than in 2013 for the same set of 32 states.
• The 48-point difference between the highest and lowest standards is larger than the 37-point difference between the NAEP Basic and Proficient levels set for grade 8 mathematics.
NOTE: Massachusetts, Montana, Nevada, and North Dakota were not included in the study due to data not being available. States that did not have a general end-of-grade mathematics assessment in grade 8 required for all students were not included in the analysis. For comparability, the same set of 32 states is included in the 2013 counts. Although Louisiana administered the PARCC assessment, it was not included in the estimation of the NAEP scale equivalent of the PARCC proficiency standard because the state used PARCC’s Approaching Expectations level as their standard for proficient. The classification of NAEP equivalent scores into NAEP achievement levels accounts for the margin of error associated with each estimate. Results shown in the charts are based on unrounded numbers.
SOURCE: U.S. Department of Education, Institute of Education Sciences, National Center for Education Statistics, National Assessment of Educational Progress (NAEP), 2013 and 2015 Mathematics Assessments.

MAPPING STATE PROFICIENCY STANDARDS ONTO THE NAEP SCALES:Results From the 2015 NAEP Reading and Mathematics Assessments6
Technical Notes
Mapping states’ standards onto the NAEP scales
The NAEP equivalent score, that is, the NAEP score that corresponds to a state’s standard, is determined by a direct application of equipercentile mapping. For a given subject and grade, the percentage of students reported in the state assessment to be meeting the standard in each NAEP school is matched to the point on the NAEP achievement scale corresponding to that percentage. For example, if a state reports that 70 percent of the students in fourth grade in a school are meeting their reading achievement standard and 70 percent of the students in the NAEP achievement distribution in that school are at or above 229 on the NAEP scale, then the best estimate from that school’s results is that the state’s standard is equivalent to 229 on the NAEP scale. Results are then aggregated over all schools participating in NAEP in the state to provide an estimate of the NAEP scale equivalent of the state’s threshold for its standard. By extension, when estimating the NAEP score equivalent to the standard of a common assessment shared by a group of states, all schools participating in NAEP in those states are included in the estimation.
In reporting the mapping results, in addition to NAEP equivalent scores, two types of error—standard error and relative error—are presented to describe various sources of variation in the mapping of state proficiency standards. The sources of random variation (measurement error and sampling variation) are accounted for by the standard error of the mapping, and the amount of error that is added to the placement of the standard, given the fact that NAEP and the state assessment may not measure exactly the same knowledge and skills, is captured in the relative error. This measure is based on the accuracy with which school-level percentages meeting the state standard are reproduced by applying the cut score indicated by the linkage to the NAEP results in each school, after taking into account measurement variation in NAEP and NAEP student sampling within each participating school.
When the relative error is greater than .5 (i.e., the mapping error accounts for more than half of the total variation), it is considered to be too large to support useful inferences from the placement of the state standard on the NAEP scale without additional evidence. In the figures and tables in this report, a triangle indicates that the relative error is greater than .5.1
1 Additional details on the mapping methodology and relative error are available at http://nces.ed.gov/nationsreportcard/studies/statemapping/.
Data sources
The analyses in this report are based on NAEP and state assessment results for public schools that participated in the grade 4 and grade 8 NAEP assessments in reading and mathematics, weighted to represent the states. The analyses used data from (a) NAEP data files for the states and the District of Columbia (referred to as a state in this report) that participated in the 2015 reading and mathematics assessments and (b) state assessment school-level achievement data for the 2014–15 school year from EDFacts and, in some cases, provided directly by the states.
Four states—Massachusetts, Montana, Nevada, and North Dakota—were not included in the 2015 study because of issues associated with their data. In Massachusetts, approximately one-half of the students took the Massachusetts Comprehensive Assessment System tests and the other half of the students took the PARCC assessments, therefore making the estimated NAEP equivalent score not an accurate expression of the state standard for proficient performance. Montana, Nevada, and North Dakota requested their exclusion from the study as they experienced problems with the administration of state assessments in 2015.

MAPPING STATE PROFICIENCY STANDARDS ONTO THE NAEP SCALES:Results From the 2015 NAEP Reading and Mathematics Assessments 7
The study reports on the placement on the NAEP metric of the individual state performance standards as well as on the placement of the standards from the three testing program: ACT, PARCC, and SBAC. Table A-1 lists the states and their respective testing programs in 2015.
Table A-1. States and their testing program: 2015
Testing program States
ACT Alabama and South Carolina
PARCC1 Arkansas, Colorado, District of Columbia, Illinois, Louisiana, Maryland, Massachusetts, Mississippi, New Jersey, New Mexico, Ohio, and Rhode Island
SBAC2California, Connecticut, Delaware, Hawaii, Idaho, Maine, Michigan, Missouri, Montana, Nevada, New Hampshire, North Dakota, Oregon, South Dakota, Vermont, Washington, West Virginia, and Wisconsin
Individual program
Alaska, Arizona, Florida, Georgia, Indiana, Iowa, Kansas, Kentucky, Minnesota, Nebraska, New York, North Carolina, Oklahoma, Pennsylvania, Tennessee, Texas, Utah, Virginia, and Wyoming
1 Louisiana and Ohio were not included in the estimation of the NAEP scale equivalent of the PARCC proficiency standard because both states used PARCC’s Approaching Expectations level as their standard for proficient.
2 Missouri (in grade 4) and Wisconsin (in grades 4 and 8) were not included in the estimation of the NAEP scale equivalent of the SBAC reading standards because their test administration did not follow the SBAC blueprint.
SOURCE: State Education Agencies.
Some states were not included in the 2015 mapping study at grade 8 reading or mathematics because of differences in the population and content assessed by NAEP and the state assessments. NAEP assesses reading and general mathematics with a sample of students representative of all grade 8 students in each state. In 2015, some states did not require all grade 8 students to take the state’s end-of-grade general assessments (i.e., some students took advanced English language arts courses, algebra I, or geometry). As a result, the population assessed by the state may not be necessarily the same student population assessed by NAEP. Other states did not administer a general grade 8 assessment in reading/language arts or mathematics, but, rather, administered assessments focused on specific content within English/language arts or mathematics. For these states, the assessment content differed too much from NAEP to place them on the NAEP scales.
To determine the appropriateness of the inclusion of a state in the study, NCES surveyed the states on their assessment practices in the 2014–15 school year and followed up with each state to resolve unexplained discrepancies identified during the data review process. Table A-2 lists the states not included in the grade 8 analyses for the above stated reasons. It should be noted that this exclusion does not suggest any problems with the quality of the state assessment or performance standards—the exclusion indicates only that these standards could not be meaningfully mapped onto NAEP.
Table A-2. States that were not included in the grade 8 analyses because of differences in student population and/or content assessed, by subject: 2015
Subject States
Reading/English language arts Iowa, Texas, and Utah
Mathematics Arkansas, Colorado, District of Columbia, Florida, Iowa, Missouri, New York, Ohio, Oklahoma, Rhode Island, Tennessee, Texas, Utah, and Virginia
SOURCE: State Education Agencies.
MAPPING STATE PROFICIENCY STANDARDS ONTO THE NAEP SCALES:Results From the 2015 NAEP Reading and Mathematics Assessments8
Interpretation of results
Although NAEP results are reported on a 0- to 500-point scale for different grades and subjects, they do not have the same meaning across subjects or grades. Therefore, results shown in figures or tables are not comparable across grades or subjects.
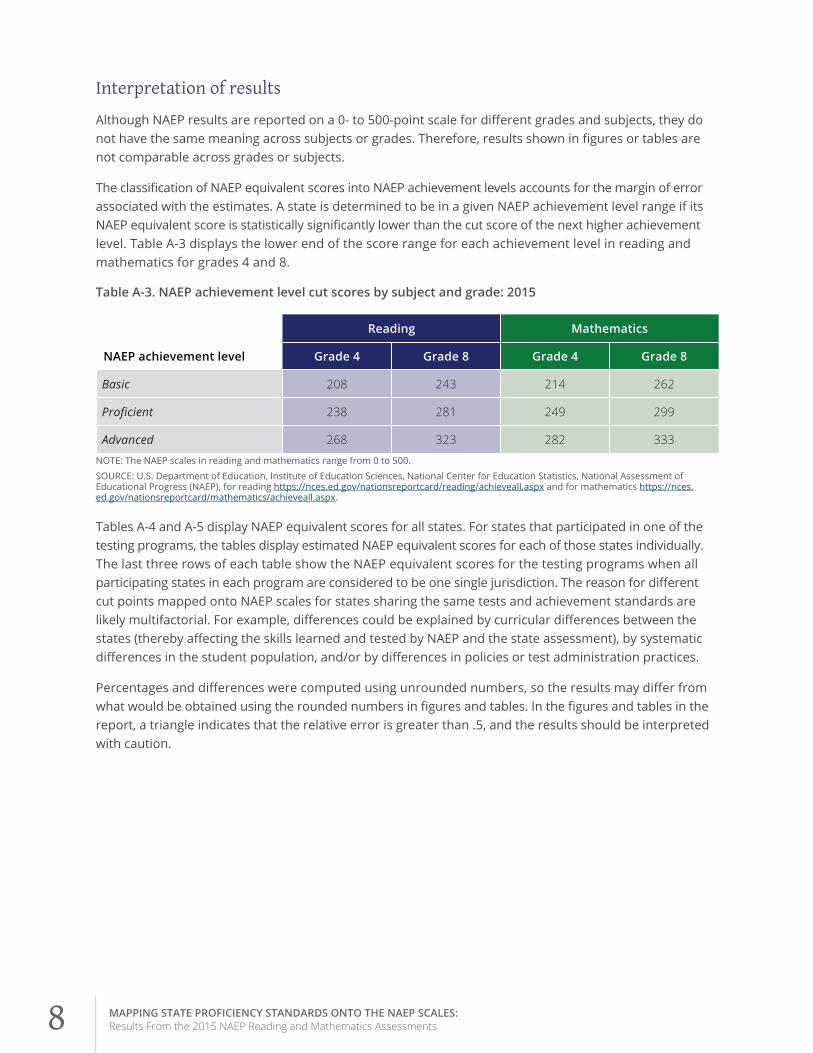
The classification of NAEP equivalent scores into NAEP achievement levels accounts for the margin of error associated with the estimates. A state is determined to be in a given NAEP achievement level range if its NAEP equivalent score is statistically significantly lower than the cut score of the next higher achievement level. Table A-3 displays the lower end of the score range for each achievement level in reading and mathematics for grades 4 and 8.
Table A-3. NAEP achievement level cut scores by subject and grade: 2015
Reading Mathematics
NAEP achievement level Grade 4 Grade 8 Grade 4 Grade 8
Basic 208 243 214 262
Proficient 238 281 249 299
Advanced 268 323 282 333
NOTE: The NAEP scales in reading and mathematics range from 0 to 500.
SOURCE: U.S. Department of Education, Institute of Education Sciences, National Center for Education Statistics, National Assessment of Educational Progress (NAEP), for reading https://nces.ed.gov/nationsreportcard/reading/achieveall.aspx and for mathematics https://nces.ed.gov/nationsreportcard/mathematics/achieveall.aspx.
Tables A-4 and A-5 display NAEP equivalent scores for all states. For states that participated in one of the testing programs, the tables display estimated NAEP equivalent scores for each of those states individually. The last three rows of each table show the NAEP equivalent scores for the testing programs when all participating states in each program are considered to be one single jurisdiction. The reason for different cut points mapped onto NAEP scales for states sharing the same tests and achievement standards are likely multifactorial. For example, differences could be explained by curricular differences between the states (thereby affecting the skills learned and tested by NAEP and the state assessment), by systematic differences in the student population, and/or by differences in policies or test administration practices.
Percentages and differences were computed using unrounded numbers, so the results may differ from what would be obtained using the rounded numbers in figures and tables. In the figures and tables in the report, a triangle indicates that the relative error is greater than .5, and the results should be interpreted with caution.

MAPPING STATE PROFICIENCY STANDARDS ONTO THE NAEP SCALES:Results From the 2015 NAEP Reading and Mathematics Assessments 9
Table A-4. NAEP scale equivalent scores for the state reading and mathematics standards for proficient performance in grade 4, by state and testing program: 2015
Reading Mathematics
State Testing program
NAEP scale equivalent Standard error NAEP scale
equivalent Standard error
Alabama ACT 231 1.1 233 1.3
Alaska 229 1.5 246 1.3
Arizona 229 1.0 246 0.8
Arkansas PARCC 237 1.2 256 1.1
California SBAC 228 1.1 245 0.7
Colorado PARCC 237 1.1 260 1.0
Connecticut SBAC 227 1.6 246 1.1
Delaware SBAC 223 0.8 242 0.8
District of Columbia PARCC 240 1.4 251 0.6
Florida 227 0.9 239 0.6
Georgia 236 1.1 245 0.9
Hawaii SBAC 221 2.0 242 0.9
Idaho SBAC 229 1.1 245 1.2
Illinois PARCC 235 0.9 257 1.4
Indiana 212 1.1 238 1.2
Iowa 204 0.9 220 1.0
Kansas 222 1.4 255 1.3
Kentucky 228 0.9 243 1.1
Louisiana PARCC 193 1.8 221 1.0
Maine SBAC 230 1.1 250 1.1
Maryland PARCC 237 1.1 260 1.4
Massachusetts PARCC — † — †
Michigan SBAC 225 1.1 245 1.0
Minnesota 224 1.0 236 0.7
Mississippi PARCC 234 1.0 251 1.0
Missouri SBAC 220 1.4 240 0.9
Montana SBAC — † — †
Nebraska 198 1.7 223 1.1
Nevada SBAC — † — †
New Hampshire SBAC 230 1.2 250 1.1
New Jersey PARCC 233 1.0 254 1.0
New Mexico PARCC 237 1.1 256 0.7
New York 241 1.1 243 1.0
North Carolina 232 0.9 246 0.7
North Dakota SBAC — † — †
Ohio PARCC 208 1.9 234 1.0
Oklahoma 209 1.1 226 1.5
Oregon SBAC 224 1.2 244 1.1
MAPPING STATE PROFICIENCY STANDARDS ONTO THE NAEP SCALES:Results From the 2015 NAEP Reading and Mathematics Assessments10
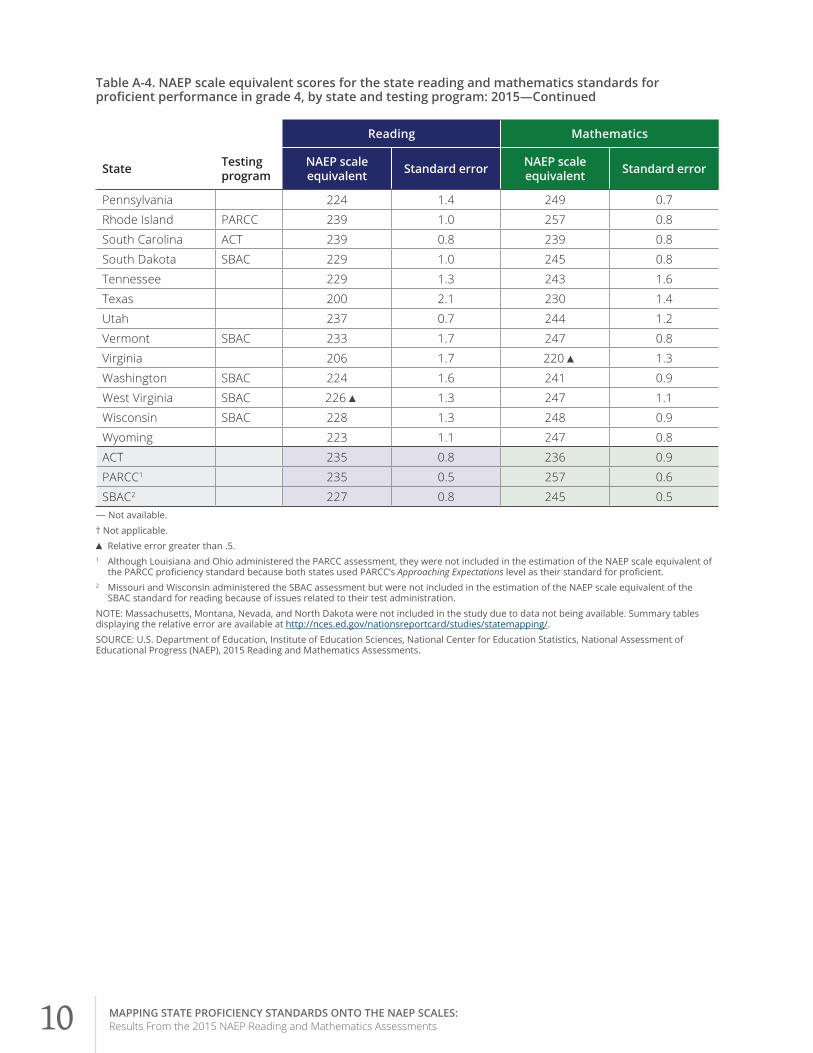
Table A-4. NAEP scale equivalent scores for the state reading and mathematics standards for proficient performance in grade 4, by state and testing program: 2015—Continued
Reading Mathematics
State Testing program
NAEP scale equivalent Standard error NAEP scale
equivalent Standard error
Pennsylvania 224 1.4 249 0.7
Rhode Island PARCC 239 1.0 257 0.8
South Carolina ACT 239 0.8 239 0.8
South Dakota SBAC 229 1.0 245 0.8
Tennessee 229 1.3 243 1.6
Texas 200 2.1 230 1.4
Utah 237 0.7 244 1.2
Vermont SBAC 233 1.7 247 0.8
Virginia 206 1.7 220 ▲ 1.3
Washington SBAC 224 1.6 241 0.9
West Virginia SBAC 226 ▲ 1.3 247 1.1
Wisconsin SBAC 228 1.3 248 0.9
Wyoming 223 1.1 247 0.8
ACT 235 0.8 236 0.9
PARCC1 235 0.5 257 0.6
SBAC2 227 0.8 245 0.5 — Not available.
† Not applicable.
▲ Relative error greater than .5. 1 Although Louisiana and Ohio administered the PARCC assessment, they were not included in the estimation of the NAEP scale equivalent of
the PARCC proficiency standard because both states used PARCC’s Approaching Expectations level as their standard for proficient.2 Missouri and Wisconsin administered the SBAC assessment but were not included in the estimation of the NAEP scale equivalent of the
SBAC standard for reading because of issues related to their test administration.
NOTE: Massachusetts, Montana, Nevada, and North Dakota were not included in the study due to data not being available. Summary tables displaying the relative error are available at http://nces.ed.gov/nationsreportcard/studies/statemapping/.
SOURCE: U.S. Department of Education, Institute of Education Sciences, National Center for Education Statistics, National Assessment of Educational Progress (NAEP), 2015 Reading and Mathematics Assessments.
MAPPING STATE PROFICIENCY STANDARDS ONTO THE NAEP SCALES:Results From the 2015 NAEP Reading and Mathematics Assessments 11
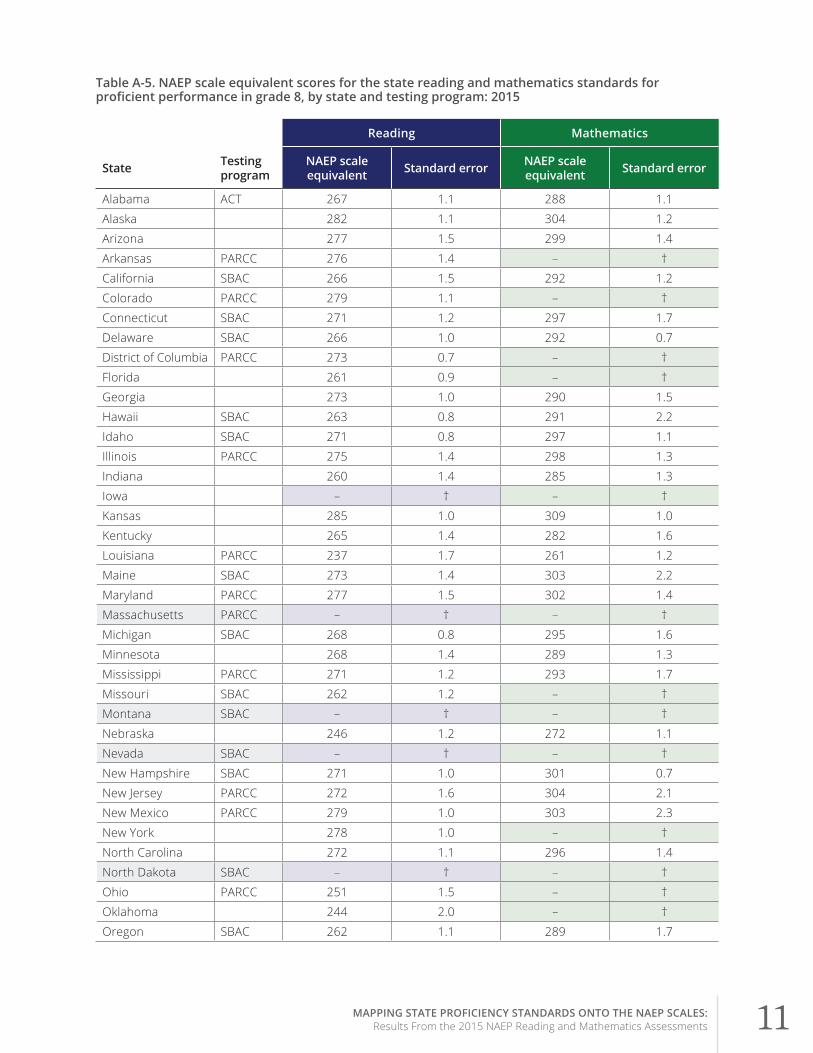
Table A-5. NAEP scale equivalent scores for the state reading and mathematics standards for proficient performance in grade 8, by state and testing program: 2015
Reading Mathematics
State Testing program
NAEP scale equivalent Standard error NAEP scale
equivalent Standard error
Alabama ACT 267 1.1 288 1.1
Alaska 282 1.1 304 1.2
Arizona 277 1.5 299 1.4
Arkansas PARCC 276 1.4 – †
California SBAC 266 1.5 292 1.2
Colorado PARCC 279 1.1 – †
Connecticut SBAC 271 1.2 297 1.7
Delaware SBAC 266 1.0 292 0.7
District of Columbia PARCC 273 0.7 – †
Florida 261 0.9 – †
Georgia 273 1.0 290 1.5
Hawaii SBAC 263 0.8 291 2.2
Idaho SBAC 271 0.8 297 1.1
Illinois PARCC 275 1.4 298 1.3
Indiana 260 1.4 285 1.3
Iowa – † – †
Kansas 285 1.0 309 1.0
Kentucky 265 1.4 282 1.6
Louisiana PARCC 237 1.7 261 1.2
Maine SBAC 273 1.4 303 2.2
Maryland PARCC 277 1.5 302 1.4
Massachusetts PARCC – † – †
Michigan SBAC 268 0.8 295 1.6
Minnesota 268 1.4 289 1.3
Mississippi PARCC 271 1.2 293 1.7
Missouri SBAC 262 1.2 – †
Montana SBAC – † – †
Nebraska 246 1.2 272 1.1
Nevada SBAC – † – †
New Hampshire SBAC 271 1.0 301 0.7
New Jersey PARCC 272 1.6 304 2.1
New Mexico PARCC 279 1.0 303 2.3
New York 278 1.0 – †
North Carolina 272 1.1 296 1.4
North Dakota SBAC – † – †
Ohio PARCC 251 1.5 – †
Oklahoma 244 2.0 – †
Oregon SBAC 262 1.1 289 1.7

MAPPING STATE PROFICIENCY STANDARDS ONTO THE NAEP SCALES:Results From the 2015 NAEP Reading and Mathematics Assessments12
Table A-5. NAEP scale equivalent scores for the state reading and mathematics standards for proficient performance in grade 8, by state and testing program: 2015—Continued
Reading Mathematics
State Testing program
NAEP scale equivalent Standard error NAEP scale
equivalent Standard error
Pennsylvania 267 1.0 307 1.1
Rhode Island PARCC 280 1.3 – †
South Carolina ACT 265 1.1 293 1.5
South Dakota SBAC 270 1.3 295 0.8
Tennessee 265 1.5 – †
Texas – † – †
Utah – † – †
Vermont SBAC 273 2.4 301 1.4
Virginia 246 1.2 – †
Washington SBAC 264 1.4 292 1.5
West Virginia SBAC 268 1.0 294 1.1
Wisconsin SBAC 268 1.5 299 3.0
Wyoming 270 0.7 289 0.9
ACT 266 1.1 290 1.0
PARCC1 275 0.5 300 0.5
SBAC2 266 0.8 294 0.7 — Not available.
† Not applicable.1 Although Louisiana and Ohio administered the PARCC assessment, they were not included in the estimation of the NAEP scale equivalent of
the PARCC proficiency standard because both states used PARCC’s Approaching Expectations level as their standard for proficient.2 Wisconsin administered the SBAC assessment but was not included in the estimation of the NAEP scale equivalent of the SBAC standard
for reading because of issues related to test administration.
NOTE: Massachusetts, Montana, Nevada, and North Dakota were not included in the study due to data not being available. States that did not have a general end-of-grade reading/English language arts or general mathematics assessment in grade 8 were not included in the analysis. Summary tables displaying the relative error are available at http://nces.ed.gov/nationsreportcard/studies/statemapping/.
SOURCE: U.S. Department of Education, Institute of Education Sciences, National Center for Education Statistics, National Assessment of Educational Progress (NAEP), 2015 Reading and Mathematics Assessments.
U.S. Department of Education Betsy DeVos Secretary
Institute of Education Sciences Mark Schneider Director
National Center for Education Statistics James L. Woodworth Commissioner
Assessment Division Peggy G. Carr Associate Commissioner
The National Center for Education Statistics (NCES) is the primary federal entity for collecting, analyzing, and reporting data related to education in the United States and other nations. It fulfills a congressional mandate to collect, collate, analyze, and report full and complete statistics on the condition of education in the United States; conduct and publish reports and specialized analyses of the meaning and significance of such statistics; assist state and local education agencies in improving their statistical systems; and review and report on education activities in foreign countries.
NCES activities are designed to address high-priority education data needs; provide consistent, reliable, complete, and accurate indicators of education status and trends; and report timely, useful, and high-quality data to the U.S. Department of Education, the Congress, the states, other education policymakers, practitioners, data users, and the general public. Unless specifically noted, all information contained herein is in the public domain.
We strive to make our products available in a variety of formats and in language that is appropriate to a variety of audiences. You, as our customer, are the best judge of our success in communicating information effectively. If you have any comments or suggestions about this or any other NCES product or report, we would like to hear from you.
Please direct your comments to:
National Center for Education Statistics Institute of Education Sciences U.S. Department of Education Potomac Center Plaza 550 12th Street NW Washington, DC 20202-0023
This report was prepared for the National Center for Education Statistics under Contract No. ED-IES-12-D-0002 with American Institutes for Research. Mention of trade names, commercial products, or organizations does not imply endorsement by the U.S. government.
May 2018 The NCES home page address is http://nces.ed.gov. The NCES Publications and Products address is http://nces.ed.gov/pubsearch.
This publication is only available online. To download, view, and print the report as a PDF file, go to the NCES Publications and Products address shown above.
Suggested Citation Bandeira de Mello, V., Rahman, T., and Park, B.J. (2018). Mapping State Proficiency Standards Onto NAEP Scales: Results From the 2015 NAEP Reading and Mathematics Assessments (NCES 2018-159). U.S. Department of Education, Washington, DC: Institute of Education Sciences, National Center for Education Statistics. Retrieved [date] from http://nces.ed.gov/pubsearch.
Content Contact Taslima Rahman (202) [email protected]

www.ed.gov | ies.ed.gov
The Department of Education’s mission is to promote student achievement and preparation for global competitiveness by fostering education
excellence and ensuring equal access.