Mapping & Measuring Community Networks - VermontMapping & Measuring Community Networks October 2014...
24
Mapping & Measuring Community Networks October 2014 Maurine Gilbert for The Vermont Blueprint for Health
Transcript of Mapping & Measuring Community Networks - VermontMapping & Measuring Community Networks October 2014...

Mapping & Measuring Community Networks
October 2014Maurine Gilbert for The Vermont Blueprint for Health
Today’s Agenda
• Research introduction / recap
• What’s new for 2014

The Original Challenge
• Objective: quantity health networks
– Quantity and describe the network of organizations that has emerged in each Blueprint HSA to support population and individual health, focusing on modes of collaboration and relationships between organizations
• A first step towards key questions about the Blueprint:
– What role did investment in core CHTs have in seeding these larger networks?
– How are the relationships maintained and reinforced – how durable are they?
– What characteristics do the most successful networks share?
– What is the impact of these networks on population health?

Focus on Organization Relationships
• Relationships between organizations are the unit of analysis
• Which organizations? In 2013, Project Managers id’ed:
• Relying on people for the data: leadership, direct service providers, others

Network Survey v1
• Fall 2013
• 422 participants, representing organizations in 15* HSAs
• 54% response rate!
• We asked about:
– Perceptions of “teamness”
– Benefits and drawbacks of working together
– How respondents’ organizations interact with each other
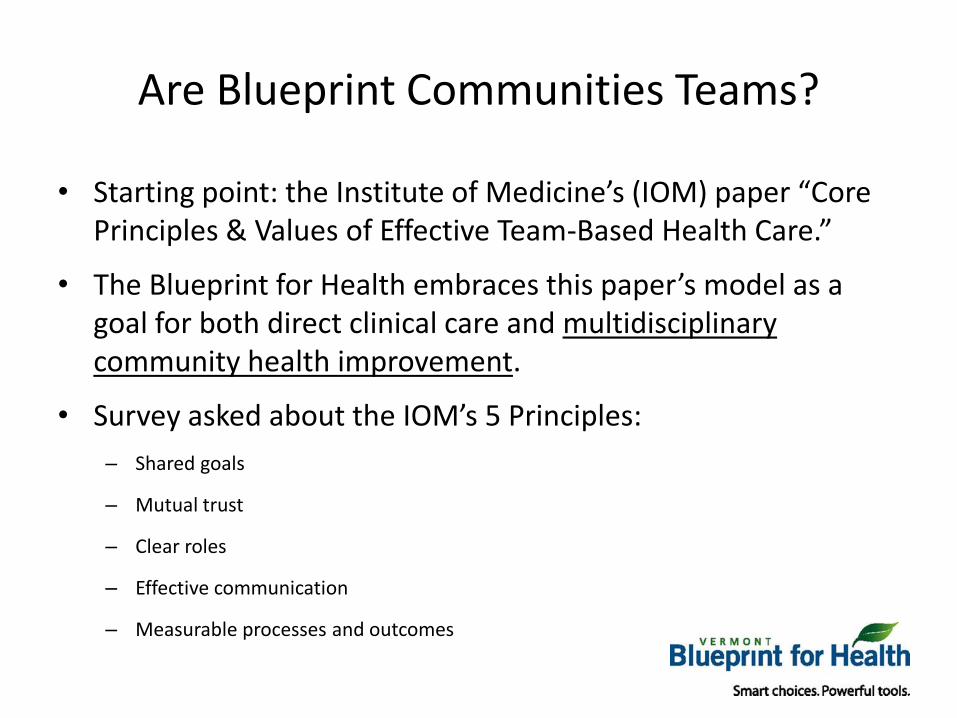
Are Blueprint Communities Teams?
• Starting point: the Institute of Medicine’s (IOM) paper “Core Principles & Values of Effective Team-Based Health Care.”
• The Blueprint for Health embraces this paper’s model as a goal for both direct clinical care and multidisciplinary community health improvement.
• Survey asked about the IOM’s 5 Principles:
– Shared goals
– Mutual trust
– Clear roles
– Effective communication
– Measurable processes and outcomes

Yes! Blueprint Communities are Teams.
79% 76% 69% 68% 38%0%
10%
20%
30%
40%
50%
60%
70%
80%
90%
Shared Goals Mutual Trust EffectiveCommunications
Clear Roles MeasurableProcesses
and Outcomes
Average % of Respondents Who "Agree" or "Strongly Agree" that the Group of Organizations in their HSA Exhibit the
Following Characteristics of Team-Based Care
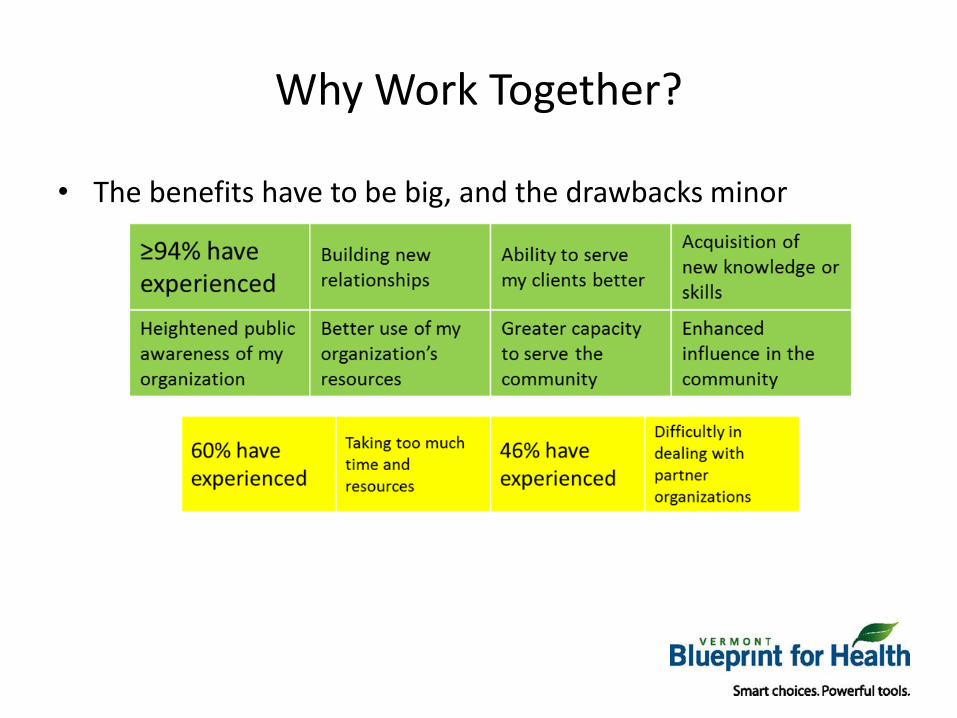
Why Work Together?
• The benefits have to be big, and the drawbacks minor

Network Connections
• We asked respondents to indicate whether their organization has interacted with other organizations in these ways:
– Sharing information
– Sharing resources
– Sending referrals
– Receiving referrals
• This data, a simple list of connections between organizations, is the basis for our network analysis.

What is Network Analysis?
• Network Analysis is mapping and measuring relationships
• For the first time, we can see how organizations work together
• The analysis also quantifies these networks – how big, how connected, how cliquish, and more
• A few caveats
– A partial picture
– A single point in time
– Shows how (but not why)

What you’re about to see
• Nodes (dots) represent organizations and edges (lines) represent connections between them
• The network analysis software (we used Gephi) maps organizations and their relationships using a force-based algorithm – nodes that are connected attract each other and nodes that are not connected are pushed further apart
• We’ve chosen to
– Size the nodes based on betweenness centrality
– Color the full graphs based on sub-network/neighborhood membership

SAMPLE NETWORK: RUTLAND

Rutland HSAInformation network

Rutland HSAResources network

Rutland HSAReferrals network

Rutland HSAFull network

SELECTED ADDITIONAL NETWORKS

Shows Vs.
Many high-centrality orgs
Centralized leadership
Full participation of primary care offices
Primary care offices not represented
Morrisville HSAFull network

Shows Vs.
A BIG network
A small network
Clustering /modularity
No sub-networks
Sub-networks follow populations served
Sub-networks follow geography or other factors
Burlington HSAFull network
Elder Care
Underprivileged
Healthcare services
WHAT’S NEW: 2014 STUDY

New and Improved! Questionnaire
• Updated methodology
– Dropped a few questions to make it as short as possible (still not short)
– Double-down on network connections questions
– More nuance: from 4 connections 6 connections
1. My organization sends referrals to this organization
2. My organization receives referrals from this organization
3. Our organizations share resources (e.g. joint funding, shared equipment, personnel or facilities)
4. Our organizations have clients/patients in common
5. Our organizations share information about specific clients/patients
6. Our organizations share information about programs, services and policy
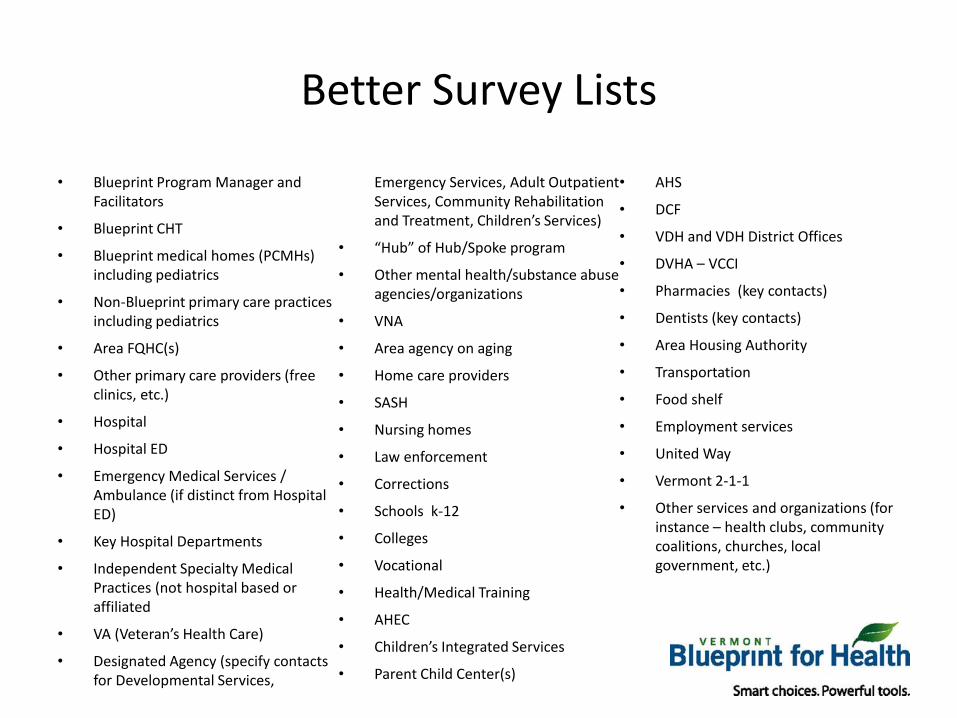
Better Survey Lists
• Blueprint Program Manager and Facilitators
• Blueprint CHT
• Blueprint medical homes (PCMHs) including pediatrics
• Non-Blueprint primary care practices including pediatrics
• Area FQHC(s)
• Other primary care providers (free clinics, etc.)
• Hospital
• Hospital ED
• Emergency Medical Services / Ambulance (if distinct from Hospital ED)
• Key Hospital Departments
• Independent Specialty Medical Practices (not hospital based or affiliated
• VA (Veteran’s Health Care)
• Designated Agency (specify contacts for Developmental Services,
Emergency Services, Adult Outpatient Services, Community Rehabilitation and Treatment, Children’s Services)
• “Hub” of Hub/Spoke program
• Other mental health/substance abuse agencies/organizations
• VNA
• Area agency on aging
• Home care providers
• SASH
• Nursing homes
• Law enforcement
• Corrections
• Schools k-12
• Colleges
• Vocational
• Health/Medical Training
• AHEC
• Children’s Integrated Services
• Parent Child Center(s)
• AHS
• DCF
• VDH and VDH District Offices
• DVHA – VCCI
• Pharmacies (key contacts)
• Dentists (key contacts)
• Area Housing Authority
• Transportation
• Food shelf
• Employment services
• United Way
• Vermont 2-1-1
• Other services and organizations (for instance – health clubs, community coalitions, churches, local government, etc.)

New Opportunities to Use Network Data
• Analytics team looking for relationships between network characteristics and health outcomes
• Engaging communities to understand why networks look the way they do and
• Asking what next? – helping create purposeful, planned networks

We Need Your Help
• Survey launches mid-November
• Please take it, and encourage your colleagues to take it
• Let us know if someone didn’t receive the survey who should have – we’ll send one their way (Maurine Gilbert / 802-488-0688 / [email protected] )
• Stay tuned for results in the new year . . .