Mapping Long Term Trends of Submerged Aquatic Vegetation...
23
Mapping Long Term Trends of Submerged Aquatic Vegetation in Mississippi Patrick Biber Department of Coastal Sciences Gulf Coast Research Laboratory University of Southern Mississippi SAV & Seagrass Workshop May 24, 2011
Transcript of Mapping Long Term Trends of Submerged Aquatic Vegetation...

Mapping Long Term Trends of Submerged Aquatic Vegetation in
Mississippi
Patrick Biber
Department of Coastal Sciences
Gulf Coast Research Laboratory
University of Southern Mississippi
SAV & Seagrass Workshop
May 24, 2011
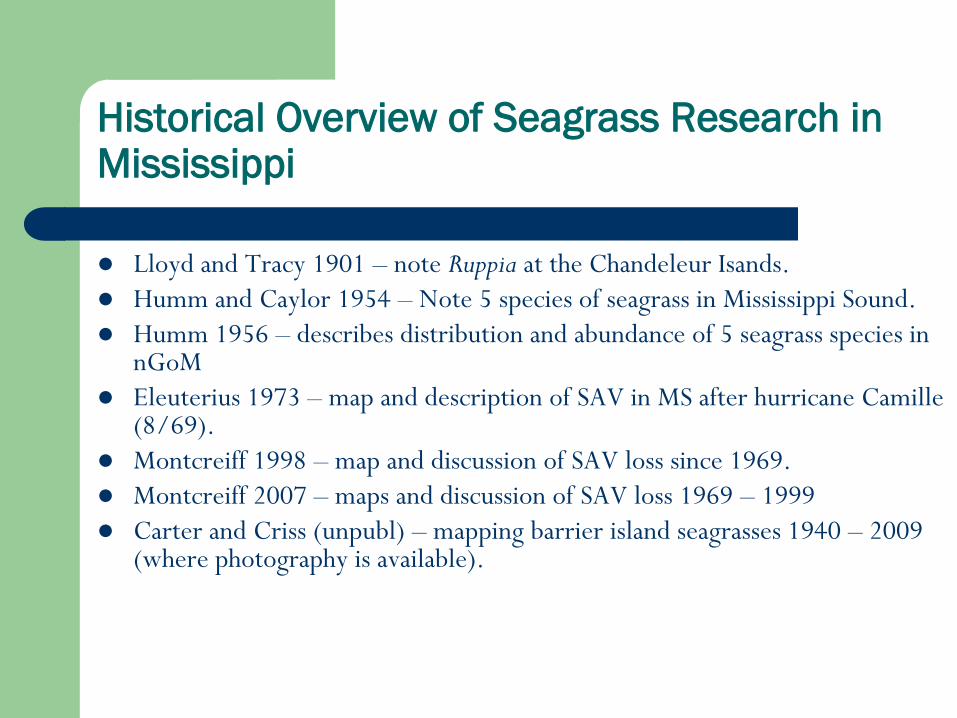
Historical Overview of Seagrass Research in Mississippi
Lloyd and Tracy 1901 – note Ruppia at the Chandeleur Isands.
Humm and Caylor 1954 – Note 5 species of seagrass in Mississippi Sound.
Humm 1956 – describes distribution and abundance of 5 seagrass species in nGoM
Eleuterius 1973 – map and description of SAV in MS after hurricane Camille (8/69).
Montcreiff 1998 – map and discussion of SAV loss since 1969.
Montcreiff 2007 – maps and discussion of SAV loss 1969 – 1999
Carter and Criss (unpubl) – mapping barrier island seagrasses 1940 – 2009 (where photography is available).


1955
Publications of the Institute of Marine Science, vol 4, Port Aransas, Univ of TX


1957 Bull. Mar Sci 6:305-308

Seagrass Species Historically Recorded in Mississippi Sound
Ruppia maritima L.(Widgeon Grass)
Halodule wrightii Asch.(Shoal Grass)
Thalassia testudinum Banks & Sol. ex K.D. Koenig(Turtle Grass)
Syringodium filiforme Kutz.(Manatee Grass)
Sources:http://ian.umces.edu/imagelibraryhttp://www.dep.state.fl.ushttp://myfwc.com
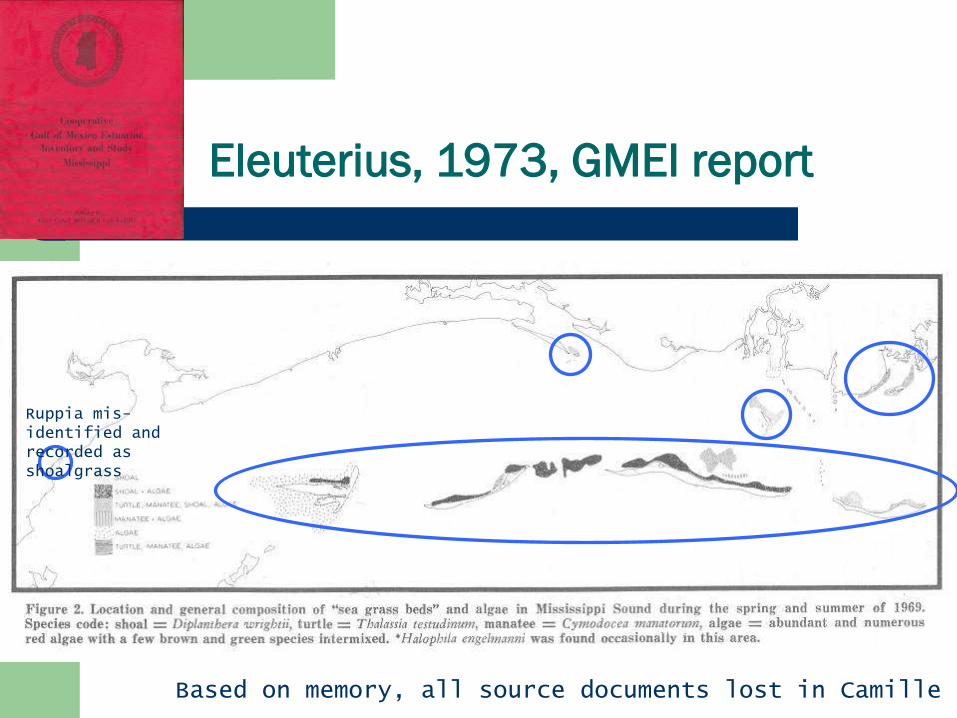
Eleuterius, 1973, GMEI report
Based on memory, all source documents lost in Camille
Ruppia mis-identified and recorded as shoalgrass

Montcreiff, 1998 Tidelands Report
Potential seagrass habitat (PSGH) – based on 1992 USGS photography
X
X

Montcreiff 2007 – USGS report
X
X
X
X

Montcreiff 2007 – USGS report
78.13% loss between 1969 and 1999

However, there are some problemswith comparing different studies tocalculate loss of SAV over time.
Image and polygonsfrom Carter and Criss

1992 Data

1999 Data

Oct 15, 2004 Oct 28, 2006
Note: misclassification rates are similar in both images, courtesy of Greg Carter, GCGC
Coarse polygons miss importantinformation about seagrass change.

Figure 2. Seagrass maps developed from mosaics of 1940 and 2007 vertical aerial imagery. Various types of image datawere used in the study, ranging from digitized black-and-white photographs (e.g., 1940) to hyperspectral imagery(2007 data, CASI 570 nm band). Where spectral data were available, seagrass mapping was based solely on the use ofgreen-band data (Peneva et al., 2008).
Carter and Criss – unpublished data
200.7 ha
55.5 ha
38.1 ha
16.7 ha
81.02% loss 1940 - 2007
69.91% loss 1940 - 2007

Other SAV collections and mapping
Grand Bay NERR (2005, 2006-2009) –
J. Cho/Chris May, others
Recent Research at Botany Section, GCRL:– Mapping from HGCRL Herbarium specimens:
collected between 1970 - 2005
– Mapping and research on Ruppia at Waveland, MS.
– SAV inventory in rivers and bayous south of I-10 (2008-2010, w J. Cho, funded
by MASGC).
– Comprehensive mapping inventory and implementation into ArcGIS (Linh
Pham)

Data from Herbarium specimens
Species State County/
Parish
Location Date Collector/
Collector #
Herbarium
#
Ruppia
maritima L.
MS Hancock In MS sound near
Clermont Harbor. Close
to Poor John’s
Campground and
Bordaches St.
29 June 01 C.
Moncreiff &
B. Libby
#79
09852
Ruppia
maritima L.
MS Hancock In MS sound near
Clermont Harbor. Close
to Poor John’s
Campground and
Bordaches St.
29 June 01 C.
Moncreiff &
B. Libby
#79
09568
Ruppia
maritima L.
MS Hancock Clermont Harbor along
Beachshore Dr.
20 Nov.
1997
J. Caldwell
& T.
Randall
#4596
08144
Ruppia
maritima L.
MS Hancock Clermont Harbor along
Beachshore Dr.
20 Nov.
1997
J. Caldwell
& T.
Randall
#4596
08143
Ruppia
maritima L.
MS Hancock Clermont Harbor along
Beachshore Dr.
20 Nov.
1997
J. Caldwell
& T.
Randall
#4596
08142
Ruppia
maritima L.
MS Hancock Clermont Harbor along
Beachshore Dr.
20 Nov.
1997
J. Caldwell
& T.
Randall
#4596
08141

Data from Herbarium specimens

Pascagoula River
Eleocharis
PotamogetonCeratophyllum
Utricularia
Potamogeton

SAV mapping in bays and bayous
Pascagoula
Biloxi Back Bay

Why is mapping important?
Rate of SAV loss is speeding up globally since 1980
Conclusions:
Data on SAV distribution in MS since 1940’s
Mapping done at different scales and with changing technology, can’t compare studies directly.
Loss of 3 species in MS Sound post-Camille (1969). Not recovered – why?
No one-stop data repository – needed for management and research (e.g. BP oil spill)