Mapping eWOM effectiveness for Generation Z consumers: an ...
92
Mapping eWOM effectiveness for Generation Z consumers: an integrative approach Panu Alanko Department of Marketing Hanken School of Economics Helsinki 2018
Transcript of Mapping eWOM effectiveness for Generation Z consumers: an ...

Mapping eWOM effectiveness for Generation Z consumers: an integrative approach
Panu Alanko
Department of Marketing
Hanken School of Economics
Helsinki
2018

HANKEN SCHOOL OF ECONOMICS
Department of:
Marketing
Type of work: Master’s Thesis
Author:
Panu Alanko
Date:
8.5.2018
Title of thesis:
Mapping eWOM effectiveness for Generation Z consumers: an integrative approach
Abstract: The effectiveness of word-of-mouth (WOM) keeps intriguing both researchers and practitioners as it remains one of the most powerful forces influencing consumer behaviour beyond the direct promotional activities of marketers. Along with the era of the internet, electronic word-of-mouth (eWOM) has further extended this information exchange among consumers due to new communication platforms that enable faster dissemination of information and immediate access to consumer networks online. Being such a prevalent source of information among digital natives, such as Generation Z consumers, eWOM also provides opportunities for businesses to use it to their advantage. However, before exploiting eWOM commercially, practitioners must first understand the determinants of its effectiveness.
Based on the findings of existing research, this thesis provides a holistic view of the impact of eWOM on consumer behaviour. By classifying eWOM effectiveness factors according to the three dimensions of social communication, the study explains the combined effect of both communicator, receiver and stimuli characteristics on the purchase intention of Generation Z consumers. To meet its objectives, the study employs a quantitative research design in which formal hypotheses and a cross-sectional survey technique are used to answer the research questions. As the representatives of Generation Z, a sample of 133 Finnish students is drawn from closed-membership groups of a social networking site to collect individual-level data through a structured online questionnaire. Finally, the relationship between consumer purchase intention and six eWOM effectiveness predictors is statistically analysed by applying hierarchical multiple regression.
In conclusion, a significant relationship between eWOM and purchase intention is found. The findings imply that the effectiveness of eWOM is determined by the interplay among several factors that, however, differ in terms of their individual contribution. In descending order of importance, the receiver’s attitude towards eWOM information, the similarity between the communicator and the receiver, eWOM quality and eWOM quantity all contribute positively to Generation Z consumers’ purchase intention. Thus, the study empirically illustrates relations between the dimensions of the social communication framework and advances a holistic understanding of eWOM effectiveness for both researchers and practitioners.
Keywords: eWOM, word-of-mouth, effectiveness, Generation Z, consumer behaviour, purchase intention

CONTENTS
1 INTRODUCTION....................................................................................... 1
1.1. Context of the study .............................................................................................. 2
1.1.1. Generation Z ............................................................................................. 2
1.1.2. Relevance of product type ........................................................................ 4
1.1.3. Relevance of communication platform ................................................... 5
1.2. Research problem ................................................................................................. 5
1.3. Research aim ......................................................................................................... 7
1.4. Delimitations......................................................................................................... 7
1.5. Thesis structure..................................................................................................... 8
1.6. Key concepts and definitions ................................................................................ 8
2 THEORETICAL BACKGROUND ........................................................... 10
2.1. WOM in marketing literature ............................................................................. 10
2.2. eWOM in marketing literature ........................................................................... 12
2.3. Effectiveness of eWOM communication ............................................................ 14
2.4. Hypotheses development ................................................................................... 16
2.4.1. Effectiveness of eWOM: responses ........................................................ 18
2.4.2. Impact of communicator characteristics ............................................... 19
2.4.3. Impact of stimuli characteristics ........................................................... 20
2.4.4. Moderating effect of receiver characteristics ........................................ 22
2.5. Theoretical framework for the study .................................................................. 23
3 RESEARCH METHODOLOGY .............................................................. 26
3.1. Research design .................................................................................................. 26
3.1.1. Data collection ........................................................................................ 26
3.1.2. Sampling and accessing data ................................................................. 27
3.1.3. Questionnaire design ............................................................................. 29
3.1.4. Construct operationalization ................................................................. 31
3.1.5. Pilot testing and translation of the questionnaire ................................ 34
3.2. Data analysis ....................................................................................................... 35
3.3. Assessing the quality of research ....................................................................... 36
4 EMPIRICAL FINDINGS ......................................................................... 40
4.1. Data screening .................................................................................................... 40
4.2. Descriptive statistics ........................................................................................... 41

4.3. Assessing the reliability of scales ....................................................................... 44
4.4. Assessing statistical assumptions....................................................................... 46
4.5. Correlation analysis ............................................................................................ 47
4.6. Regression analysis ............................................................................................. 49
4.6.1. Testing the assumptions for multiple regression analysis .................... 50
4.6.2. Assessing the regression models ........................................................... 52
4.6.3. Results ................................................................................................. 53
5 DISCUSSION .......................................................................................... 58
5.1. Key findings ........................................................................................................ 58
5.1.1. Relations between eWOM effectiveness factors and purchase intent .. 58
5.1.2. Significance of eWOM effectiveness factors to purchase intent ........... 59
5.1.3. Impact of receiver characteristics on eWOM effectiveness .................. 62
5.1.4. Revised framework ................................................................................. 63
5.2. Theoretical contributions ................................................................................... 64
5.3. Managerial implications ..................................................................................... 66
5.4. Limitations and further research ....................................................................... 70
5.5. Conclusions ......................................................................................................... 72
REFERENCES ............................................................................................ 73
APPENDICES
Appendix 1 Questionnaire in English ....................................................................... 78
Appendix 2 Questionnaire in Finnish ....................................................................... 83
TABLES
Table 1 Key characteristic differences between WOM and eWOM communication.... 13
Table 2 Individual-level research focusing on the influence of eWOM .........................15
Table 3 eWOM effectiveness constructs involved in the study ..................................... 25
Table 4 Summary of the variables related to eWOM communicator and stimuli dimensions ....................................................................................................... 33
Table 5 Summary of the variables related to eWOM receiver and response dimensions ....................................................................................................... 34

Table 6 Results of independent-samples t-test: comparing males and females on the individual items of eWOM quality scale ................................................... 38
Table 7 Sample characteristics ....................................................................................... 41
Table 8 Internet usage in spare time .............................................................................. 42
Table 9 Frequency of online information search according to service category .......... 43
Table 10 The most popular online platforms for searching information about services ............................................................................................................. 44
Table 11 Reliability of scales ........................................................................................... 45
Table 12 Correlations among variables (Pearson’s r) .................................................... 48
Table 13 Results of hierarchical regression analysis for predicting purchase intention ........................................................................................................... 54
Table 14 Findings from the empirical research ............................................................. 57
FIGURES
Figure 1 An integrative framework of the impact of eWOM communication (Cheung & Thadani, 2012) ................................................................................ 17
Figure 2 Theoretical framework to study the impact of eWOM on consumer purchase intention (adapted from Cheung & Thadani, 2012). ...................... 24
Figure 3 Revised empirical framework for studying the impact of eWOM on consumer purchase intention. (Adapted from Cheung & Thadani, 2012) .... 64

1
1 INTRODUCTION
In an age when anyone can easily reach thousands of people by sharing and publishing
content online, the digital media space is becoming more saturated with information
than ever before. In fact, as pointed out by Kelly et al. (2010), a significant part of the
information clutter is caused both by consumer-generated media and traditional media
in which advertisements and other commercial messages are customary. As a result,
marketers are struggling to stand out from the crowd while trying to remedy the
decreasing effectiveness of conventional “push” tactics in digital marketing (Kelly et al.,
2010). According to extant studies, the underlying challenge is in the modern
consumers’ negative attitude towards advertising (Truong & Simmons, 2010) and their
desire to decide on sources of information (Kelly et al., 2010) which has led to an
increasing reluctance in receiving commercial messages. Instead of being merely
passive receivers, consumers prefer to take an active role as they source and adopt
information relevant for their needs while disregarding the “push” information of
advertising (Kelly et al., 2010). This shift in power relations is largely facilitated by
technology, such as the internet, ad blocking software, search engines and the variety of
digital platforms that have enabled increasingly non-linear communication between
consumers and companies while allowing the consumers to “pull” relevant information
from the widely accessible online sources (Truong & Simmons, 2010).
Along with this development, new technology has not only allowed consumers to avoid
intrusive advertising from marketers, it has also created an opportunity for digital
influencers to emerge and take marketing space from brands through means of
electronic word-of-mouth (eWOM) (Djafarova et al., 2017; Erkan & Evans, 2016;
Weinswig, 2016; Zangeneha, et al., 2014). On the one hand, digital influencers, such as
bloggers, video bloggers, celebrities and active members of online communities, are
taking advantage of digital media channels to endorse brands, goods and services and
to encourage purchase decisions in their followership (Djafarova et al., 2017). On the
other hand, consumers are also looking up similar advice and expressions of approval
from peer networks, review sites and digital communities of like-minded consumers
when they need information about products and services to support their purchase
decisions (Cheung & Thadani, 2012; Fan et al., 2013; Kozinets et al. 2010). This online
information appears in a variety of forms, such as written texts (e.g. reviews), pictures,
videos and social posts (e.g. tweets, likes, pins) about products and services that appear
on websites, blogs, mobile applications, forums and social media (Rosario et al., 2016).

2
More commonly, this type of consumer-to-consumer communication has been
conceptualized as word-of-mouth (WOM) in the marketing literature (Hennig-Thurau
et al., 2004: Kozinets et al., 2010) or as electronic word-of-mouth (eWOM) to separate
between information exchange that occurs online and offline (Cheung & Thadani, 2012;
Rosario et al., 2016).
1.1. Context of the study
Following the aforementioned trends, more and more consumers are becoming “web-
fortified decision makers” (Rosario et al., 2016: 297) with the help of widely accessible
eWOM information, while their exposure to corporate messages and their dependence
on firm-generated information sources is reduced due to advertising avoidance
behaviour and the increasingly non-linear communication between consumers and
firms (Kelly et al., 2010; Truong & Simmons, 2010). Thus, it is worthwhile to further
explore the role of eWOM communication in consumer behaviour and, in particular, its
effectiveness as an information source. However, before presenting the specific
research questions of the study, a few contextual factors need to be considered. First,
the demographic context of this study is discussed and justified with supporting
arguments from media articles and research literature. Second, consumer purchase
behaviour and the role of the product type are deliberated in the context of eWOM
effectiveness. Third, the significance of communication platform type is reflected while
discussing findings from extant eWOM literature.
1.1.1. Generation Z
Given that Generation Z is currently entering the market as the first consumer segment
born during the digital era, firms are eager to learn more about the needs and
behaviours of this particular demographic group. Thus, it offers researchers a fruitful
context to advance such understanding. However, before further exploring the
characteristics of Generation Z consumers, we must first define the concept of
generation. Although definitions vary to some extent, Chaney et al. (2017) remark that
a generation has been historically outlined by the time and space in which a group of
people happen to live in simultaneously. This again, may create a shared sense of
belonging to an entire society that ends up characterising the generational cohort
(Chaney et al., 2017). Some contemporary definitions, however, are more culturally-
inclined. According to Turner (1998, as cited in Chaney et al., 2017), generation is

3
defined as “a cohort of persons passing through time who come to share a common
habitus and lifestyle… [and] has a strategic temporal location to a set of resources as a
consequence of historical accident and the exclusionary practices of social closure”.
Therefore, the age of individuals is merely the starting point for observing generational
differences (Chaney et al., 2017).
While ambiguous definitions exist regarding the age range of Generation Z, it is often
described as the demographic group of young adults born in 1995 and later (Chaney et
al., 2017), which makes the age spectrum of Generation Z rather wide. So far, the end of
the said generation has not yet been officially defined thus even children born in the
2010’s may be considered to belong to Generation Z. As such, Generation Z holds a
huge spending power in the future since they are estimated to form 40% of US
consumers already by 2020 (Finch, 2015). As a group of consumers, Generation Z is
typically described as highly educated, mobile, technologically savvy, creative and
highly connected through memberships in various online networks (Chaney et al.,
2017; Ozkan & Solmaz, 2015; Priporas et al., 2017). What is more important,
Generation Z tends to behave differently than earlier generations which is reflected in
their consumer behaviour as well. In fact, Generation Z consumers have been
characterised by higher social consciousness, higher risk aversion, higher expectations
of retailers and lower level of brand loyalty compared to their predecessors (Chaney et
al., 2017; Priporas et al., 2017) which makes them a demanding target segment for
marketers. With such characteristics, marketers may face long-term challenges in
persuading and convincing Gen Z consumers to make large scale purchase decisions
and repeated purchases due to their high perceived risk of making a purchase and low
commitment towards a single provider.
In news media, consumers of Generation Z are reported to avoid online advertising
significantly more than preceding generations while also being identified as avid users
of ad blocker and similar technology (CNBC, 2017). Moreover, as Generation Z
consumers show signs of being more selective by their nature, they are likely to form
tightly bound digital communities and peer networks that are based on shared interests
and values (Fromm, 2016). Thus, they seem to rely more on social reputation and
opinions of the virtual communities than face-to-face recommendations when making
decisions (The Global Consumer Commerce Centre, 2016).
Finally, as pointed out by Chaney et al. (2017), the individuals of Generation Z can
access more information than any other generational cohort before thanks to being

4
constantly connected through mobile devices and the Internet of Things. Being
accustomed to such vast amounts of online content, they also prefer to communicate in
written form instead of speaking out loud (Chaney et al., 2017). Therefore, Generation
Z consumers have a high likelihood of becoming engaged and affected by various forms
of electronic word-of-mouth (eWOM), such as written online reviews and
recommendations from peers and other consumers, while intentionally disregarding
the digital marketing messages put forth by firms.
1.1.2. Relevance of product type
In existing literature, various contextual factors have been found to influence the
effectiveness of eWOM. Among the most cited factors is the specific type of product of
which the consumers communicate to each other (Ismagilova et al., 2017; Rosario et al.,
2016). The connection between the product characteristics and eWOM is discussed by
Sweeney et al. (2008), who argue that the importance of WOM to consumers’ decision-
making process is significantly explained by its risk-reducing capabilities. These apply
to different forms of perceived risk which include both product-focused and
performance-related risks, such as functional, time and financial risks. In addition,
WOM can also reduce consumer-focused risks such as psychological and social risks
(Sweeney et al., 2008). Hence, the proportional importance of WOM is likely to be
more significant when the purchase process requires high involvement. Although the
risk of making a purchase decision is prevalent in various situations, the impact of
WOM has been recognized to be greater in the final stages of the buying process and
especially in the context of services due to the intangible and indivisible nature of the
product, which makes the evaluation of product quality difficult without the
experienced opinion of a fellow consumer (Sweeney et al., 2008; Sweeney et al., 2014:
Ismagilova et al., 2017: 12).
Following a similar logic, Zhang et al. (2010) expect WOM to have a bigger impact on
consumers’ perceptions when the quality of a product or a service is dominated more by
an interaction process than a technical outcome. Based on the concept of value co-
creation (See-To et al., 2014) and the interaction between a consumer and a product
during the consumption process, Zhang et al. (2010) deduced that WOM is highly
influential in service contexts in which the perceived quality is more affected by
interaction processes than in goods contexts. Thus, this study is embedded in the
service context in order to collect more meaningful data from the population.

5
1.1.3. Relevance of communication platform
Besides the product type, further contextual considerations involve typically the
platform which facilitates eWOM communication because it is one of the key factors
separating online WOM from offline WOM (Cheung & Thadani, 2012; Rosario et al.,
2016). In particular, previous studies have found that the type of platform, e.g. a
discussion forum, a review website or a social networking site, may even moderate the
influence of eWOM (Rosario et al., 2016). This is partially explained by credibility
issues related to potentially unfamiliar eWOM communicator that drives the receivers
to lean on other cues embedded in both the message and the platform to assess the
overall quality of the communication (Cheung & Thadani, 2012). Nonetheless, the
nature of this potential moderating effect is not fully conclusive and extant studies have
ended up with mixed results. On the one hand, the study by Tsao and Hsieh (2015)
found out an interaction effect in which positive eWOM with high-quality content had a
more significant influence on purchase intention when it was published on
independent platforms instead of corporate platforms. However, the result was the
opposite when the quality of eWOM communication was not controlled (Tsao & Hsieh,
2015). On the other hand, some studies have simply identified that the impact of
product reviews is more evident on established platforms than on under-established
platforms (Cheung & Thadani, 2012). Due to these inconclusive results in past studies,
no formal hypothesis regarding the effect of the platform is presented in this study.
Instead, the communication platform is included in the study only as a contextual
factor that is analysed in a descriptive manner.
1.2. Research problem
Although the concept of word-of-mouth, its drivers and motivators, and its influence on
consumer behaviour have been studied to vast extent, the exact mechanism of WOM
effectiveness – i.e. the factors that set a particular reaction in the receiver, keep
intriguing researchers and marketing practitioners (Cheung & Thadani, 2012; Rosario
et al., 2016; Sweeney et al., 2008). For instance, while aiming to quantify the effects of
WOM, Trusov et al. (2009) argue that the true effects of WOM are not yet fully
understood despite its acknowledged significance to the marketing communications
mix. Based on a rigorous analysis of eWOM effectiveness literature, Cheung and
Thadani (2012) argue in similar fashion as they urge researchers to approach the topic
more comprehensively and systematically. They conclude that various theoretical
models and eWOM variables have been studied in a plethora of research contexts but

6
the conclusions of eWOM effectiveness nonetheless seem ambiguous. In fact, the focus
of extant research has been on the impact of particular elements of communication,
such as the message, the platform or the information-seeking and information-sharing
consumers, but not necessarily on the combination of all of these elements (Cheung &
Thadani, 2012). Thus, the field of eWOM effectiveness research remains rather
fragmented, despite the remarkable amount of studies, which makes it challenging to
understand the larger picture.
Moreover, previous eWOM studies have mostly represented the current consumers in
the market, such as consumers belonging to generation X and Y (i.e. the millennials),
while our understanding of eWOM influence on Generation Z is still rather limited. As
Generation Z represents the first consumer segment that has fully grown up during the
digital age, they are characterised e.g. by their avid use of the internet (Chaney et al.,
2017). Thus, individuals belonging to Generation Z have a high likelihood of engaging
in eWOM – an online phenomenon that has been prevalent throughout their lives and
to which they are likely to rely as an information source about services. Supporting this
demographical scope, Chaney et al. (2017) discuss the importance of a generational
marketing approach that reflects on the behaviour, the values and the shared culture of
each generational cohort to gain more in-depth understanding of buying decisions in
different consumer segments. In particular, the authors suggest a future research
agenda for generational marketing in which studies should be dedicated to specific
generational cohorts to create typologies that allow comparison of generational
characteristics over time (Chaney et al., 2017).
To conclude, besides shifting the marketing focus from individuals to generational
cohorts (Chaney et al., 2017), it is increasingly important for managers to better
understand the metrics that contribute to eWOM effectiveness if they aim to induce,
monitor and manage eWOM as part of their marketing strategy (Rosario et al., 2016;
Trusov et al., 2009). What is more pressing, however, is that current knowledge of
eWOM effectiveness should be advanced towards a more comprehensive
understanding (Cheung & Thadani, 2012). Thus, with these notions in mind, this study
contributes to an ongoing topic of interest within current marketing research and
creates relevant insights for both marketing researchers and practitioners.

7
1.3. Research aim
The aim of the study is to examine the impact of eWOM communication on Generation
Z consumers’ purchase intention in a service context. In other words, the purpose is to
better understand the conditions in which Generation Z consumers base their buying
behaviour on other people’s recommendations and opinions that appear online. Hence,
the study contributes to our understanding of eWOM effectiveness on an individual
level in which consumers communicate with each other. The secondary aim is to learn
more about the nature of the determinants of eWOM effectiveness, namely the message
characteristics and the personal characteristics related to the communicator and the
receiver, while taking a holistic approach to better understand the determinants’
interrelationships. These issues fall under the following research questions.
RQ1: What kind of relationships exist between the determinants of eWOM effectiveness
and the purchase intention of Generation Z consumers?
RQ2: Which determinants of eWOM effectiveness are relatively the most important in
terms of Generation Z consumers’ purchase intention?
RQ3: How do the characteristics of the receiver influence the other determinants of
eWOM effectiveness?
1.4. Delimitations
Although the topic of the study is global, it has some demographical and geographical
delimitations to it. First of all, the research focuses on Generation Z consumers that are
of legal age in Finland because they can give their consent to participate in the survey.
This will avoid any ethical questions concerning the study of minors while removing the
need to obtain a guardian’s permission for research. In addition, adult consumers have
full control over their spending, enabling them to better assess their own consumption
and purchasing behaviour. In practice, the sample is limited to respondents born in
between 1995 and 1999, thus representing the older end of the generation Z age
spectrum. Second, the sample is drawn from a native Finnish-speaking population,
thus the study also represents a rather homogeneous group of consumers in a specific
cultural area. Lastly, the study is embedded in a service context because extant research
(e.g. Racherla & Friske, 2012; Sweeney et al., 2014) has indicated that WOM has a
greater influence on purchase decisions regarding intangible products, such as services.
This effect is mainly explained by the intangible and indivisible nature of experience

8
goods that does not allow the assessment of quality in advance. Therefore, the service
experiences that are expressed through WOM help the individual to assess the quality
of services before the purchase decision (Racherla & Friske, 2012; Sweeney et al.,
2014).
1.5. Thesis structure
The study is structured as follows. First, an introduction to the topic is given to provide
contextual information and motivation for the study. In addition, the research aim and
the purpose of study are discussed. Second, the literature review and theoretical
framework for the study are presented together with the hypotheses. Third, research
methods are discussed. More specifically, the reasons for choosing a quantitative
research design are explained in addition to the choices made regarding data collection
process and statistical data analysis techniques. In the fourth chapter, the empirical
findings are reported together with the different phases of statistical data analysis.
Lastly, the contribution and implications of the study are presented in a conclusive
manner from both the researcher’s and practitioner’s perspectives. Moreover, the
limitations of the study are discussed alongside with the opportunities for further
research in the field of eWOM effectiveness.
1.6. Key concepts and definitions
Some of the key concepts that relate to the research topic are briefly described below.
The purpose of the list is to facilitate understanding and help the reader follow the
logic, core literature and argumentation right from the beginning. The definitions are
based on the literature available hence they can also be found within the following
chapters of the thesis.
Word-of-mouth (WOM) refers to the information exchange about products, brands
and services that typically occurs between consumers in a dialogical manner (Kozinets
et al., 2010). As WOM has been found to influence consumer attitudes and behaviour, it
may e.g. increase or decrease the likelihood of purchase depending on the
communication context (Sweeney et al., 2008). According to marketing literature,
WOM is defined as “oral, person-to-person communication, between a receiver and a
communicator, whom the receiver perceives as non-commercial, concerning a brand,
product, service or organization” (Ismagilova et al., 2017: 7).

9
Electronic Word-of-mouth (eWOM) extends the concept of conventional WOM
beyond the physical boundaries of the participants. Simply put, eWOM involves
consumer-to-consumer communication that occurs online (Cheung & Thadani, 2012).
It has been described as any statement about a product or company, which is made
available on the internet (Hennig-Thurau et al., 2004). These include e.g. written
reviews, social posts, pictures and videos that consumers publish on websites, blogs,
mobile applications, forums and social media (Rosario et al., 2016).
Word-of-mouth marketing (WOMM) refers to a specific tactic that is used to
create competitive advantage through generating word-of-mouth and affecting the
course of the communication (Kozinets et al., 2010). Simply put, any business activity
that encourages customers to give positive word-of-mouth about products, brands and
services could be considered as WOMM. More recently, electronic WOMM may also
refer to viral marketing in which people share and distribute commercial content online
without being paid to do so (Ho & Dempsey, 2010).
In a context where eWOM represents another form of social communication, receiver
and communicator refer to the different opinion-seeking and opinion-sharing actors
of the online dialogue, whereas stimuli refers to the vehicle of communication
(message) (Cheung & Thadani, 2012). Response, on the other hand, is defined as the
outcome of communication, i.e. the change in the behaviour or mindset of the receiver
(Cheung & Thadani, 2012: Sweeney et al., 2008). Therefore, the effectiveness of
eWOM is determined by the interplay of the receiver, communicator and stimuli
characteristics and their proportional contribution to producing a specific outcome
(Cheung & Thadani 2012), such as purchase intention.
Platform or digital platform refers to the specific online channel that facilitates the
communication between the receiver and the communicator (Cheung & Thadani,
2012). Although the number and diversity of online platforms is constantly evolving,
most eWOM studies focus only on a single type of platform (Ismagilova et al., 2017:
26), that include e.g. review websites (Zhang et al., 2010), social networking sites (Chu
& Kim, 2011) and social media (Erkan & Evans, 2016; Djafarova & Rushworth, 2017).

10
2 THEORETICAL BACKGROUND
The following chapter discusses the theoretical background of the study. First, the
broader concepts of word-of-mouth (WOM) and electronic word-of-mouth (eWOM) are
presented together with findings from extant literature. Then, the scope is narrowed
down to discuss the impact of eWOM and its various constituents while developing the
hypotheses of the study. Finally, the theoretical framework is summarized for the
specific context of this study. The literature for this study was retrieved by searching
electronic databases, including EBSCOhost, ScienceDirect and Google Scholar, to find
scholarly journals that discuss the effectiveness of WOM and eWOM. Search terms,
such as “word-of-mouth”, “electronic word-of-mouth”, “online recommendations” and
“reviews” were used together with sub-search terms such as “effectiveness”, “influence”
and “impact”. To narrow down the number of sources, peer-reviewed journal articles
focusing on either WOM or eWOM were primarily selected for the review.
2.1. WOM in marketing literature
Being one of the oldest information sources between people, word-of-mouth (WOM)
has intrigued scientists already for decades (Ismagilova et al., 2017: 5–7) while its
significance to consumer decision-making has been widely recognized by both
marketing researchers and practitioners (Chu et al., 2011; Kozinets et al., 2010;
Sweeney et al., 2008). Traditionally, WOM has been conceptualized as naturally
occurring information exchange among consumers that heavily influences their buying
decisions (Kozinets et al., 2010). In essence, WOM involves different forms of
consumer-to-consumer communications in which the interpersonal influence of the
sender may change the receiver’s behaviour and attitudes towards products and
services, thus leading to an increased likelihood of purchase (Sweeney et al., 2008).
Although the exact definitions of WOM vary among researchers, Ismagilova et al.
(2017) proposed a comprehensive definition based on their review of existing WOM
literature. Hence, word-of-mouth is outlined as “oral, person-to-person
communication between a receiver and a communicator, whom the receiver perceives
as non-commercial, concerning a brand, product, service or organization”
(Ismagilova et al., 2017: 7). As described above, consumers tend to lean on the opinions
of peer consumers due to higher perceived trustworthiness of WOM information,
instead of purely relying on commercial or other company-generated communications
such as advertising (Chu et al., 2011; Rosario et al., 2016; Tsao & Hsieh, 2015).

11
However, companies and marketers may also become involved in WOM generation by
intentionally targeting consumers with commercial messages. More specifically, this is
referred as word-of-mouth-marketing (WOMM) that entails various marketing
techniques that aim to affect the mutual communication between consumers (Kozinets
et al., 2010). Therefore, WOM should not be used interchangeably with WOMM as a
term to describe both consumer-generated WOM and company-generated WOM, such
as viral marketing messages (Ho & Dempsey, 2010). Thus, in the context of this study,
WOM is referred to as communication that flows directly from one consumer to
another. In the following section, the marketer’s role in the circulation of WOM
communication is further discussed.
On the one hand, WOM can be seen as naturally occurring dialogue involving only
consumers. Among the theoretical frameworks presented by Kozinets et al. (2010), the
organic inter-consumer influence model reflects this view, while it is perceived to be the
earliest and the simplest understanding of WOM where product and brand-related
messages are exchanged “between one consumer and another without direct
prompting, influence, or measurement by marketers” (Kozinets et al., 2010: 72). On the
other hand, WOM can be seen as communication involving both consumers and firms
that enter the dialogue either indirectly or directly. Hence, Kozinets et al. (2010)
discuss the differences between the linear marketer influence model and the network
co-production model. In the first model, the marketer aims to affect supposedly
influential consumers, i.e. opinion leaders (Sweeney et al. 2008), through indirect
means of advertising and promotions. This again, multiplies the reach of WOM as the
assumed opinion leaders spread product and brand-related messages to more than one
consumer at a time. In the latter model, consumers are assumed to be co-producers of
WOM thus forming consumer networks where market messages and meanings flow to
multiple directions. In this context, marketers aim to directly influence consumers or
opinion leaders through personal, one-to-one messages that eventually get circulated
within the network (Kozinets et al., 2010). According to Kozinets et al. (2010), all of the
abovementioned WOM influence models currently coexist, although the network co-
production model reflects the most recent understanding of WOM in the current era of
digitalization. This is mainly for two reasons. Firstly, the internet has increased the
speed of information diffusion while the same technology has also enabled firms to
actively manage and measure their WOMM activities at an unprecedented level.
Secondly, due to the introduction of the internet and especially social media,

12
consumers are increasingly connected to each other through online communities that
allow multidirectional communication (Kozinets et al., 2010).
2.2. eWOM in marketing literature
In recent years, electronic word-of-mouth (eWOM) has attracted more and more
attention and it has been considered an impactful marketing force (Cheung & Thadani,
2012; Erkan & Evans, 2016). According to Rosario et al. (2016), this is largely due to the
emergence of new digital media platforms that have provided consumers with
numerous ways of exchanging information about products and services – for example,
by consuming and generating online reviews, tweets, blog posts, likes, pins, images and
video testimonials. The digital platforms themselves include, but are not limited to,
communication channels such as online discussion forums, consumer review sites,
blogs, microblogs, chat rooms and social networking sites (Rosario et al., 2016). Hence,
the consumption of conventional word-of-mouth has become more diverse thus
increasing its significance as a source of product information and a phenomenon of
contemporary consumer behaviour (Cheung & Thadani, 2012; Chu et al., 2011).
As said, electronic word-of-mouth can occur in many forms and in various settings
within the online environment, which has led some researchers to study and define
specific type of eWOM in depth. For instance, Tsao and Hsieh (2015) argue that one of
the most influential presentations of eWOM communication is an online consumer
review that aims to inform about a product. By definition, an informative review
includes more detailed information about the qualities and performance of a product,
whereas a recommendation review provides either positive or negative assessment of
the product. These again, may occur in a diverse set of media that vary according to
their level of interactivity (synchronous vs. asynchronous) and scope of communication
(one-to-one vs. many-to-many) (Tsao & Hsieh, 2015). However, to approach eWOM
holistically, a more general definition is required. Thus, for the rest of the study, I refer
to the widely accepted definition to describe eWOM communication as “any positive or
negative statement made by potential, actual or former customers about a product or
company, which is made available by a multitude of people and institutions via the
internet” (Hennig-Thurau et al., 2004: 39).
Although a majority of WOM-related studies have been conducted before the age of the
internet, similar core concepts and theoretical principles have also been adapted in
later studies that focus on consumer-to-consumer communication in an online context

13
(Cheung & Thadani, 2012). Thus, at its core, eWOM is another form of word-of-mouth
in which consumers exchange information about products and companies online. In
other words, eWOM can be seen as an extension to conventional WOM where various
digital platforms serve as the mediator of consumer-to-consumer communication
(Cheung & Thadani, 2012; Chu et al., 2011). However, despite the many similarities
that eWOM and WOM share with each other, some significant differences do exist
between the two types of communication. In fact, both Cheung and Thadani (2012) and
Tsao and Hsieh (2015) identified four differentiating dimensions that are characteristic
of eWOM communication. The main differences between WOM and eWOM are
summarized in table 1.
Table 1 Key characteristic differences between WOM and eWOM communication
Key characteristic
WOM eWOM
Form of communication
Linear Nonlinear
Dissemination One-to-one Many-to-many
Scalability Low High
Accessibility Temporal Continuous
Measurability Low High
Anonymity Low High
Adapted from Cheung and Thadani (2012) and Tsao and Hsieh (2015).
First, as pointed out in literature (Cheung & Thadani, 2012; Tsao & Hsieh, 2015),
eWOM enables multi-way communication, higher scalability and faster distribution of
information than traditional WOM. For instance, the sender and the receiver of eWOM
do not need to share the same space at the same time while they are also able to
forward the information to multiple directions within their own networks. Thus,
eWOM is more likely to reach a larger number of people than conventional WOM
(Cheung & Thadani, 2012; Tsao & Hsieh, 2015). Second, eWOM communication can be
accessed on a continuous basis, since a piece of online information is archived after it
has been created (Cheung & Thadani, 2012). Thus, eWOM is more persistent than
offline WOM (Hennig-Thurau et al., 2004).
Third, the authors (Cheung & Thadani, 2012; Tsao & Hsieh, 2015) continue that eWOM
communication is more observable than traditional WOM which enables a more

14
detailed measurement and analysis of information. For example, online WOM
information can be retrieved and studied based on its volume and message
characteristics. Lastly, the identity of eWOM sender is not always known by the receiver
thus making communication less contingent upon social cues. Compared to traditional
WOM communication, in which the participants of offline dialogue are known and
present in the same space, both sides of eWOM communication may remain
anonymous to each other throughout the information exchange. Due to this
characteristic, however, the importance of other contextual cues is emphasized in
evaluating overall eWOM credibility. As mentioned above, an examination of message
characteristics such as the quality of information (e.g. valence, choice of words,
justification of arguments) may provide the receiver with relevant indications of source
credibility (Cheung & Thadani, 2012; Tsao & Hsieh, 2015).
2.3. Effectiveness of eWOM communication
While some past studies have concluded that WOM affects the majority of all purchase
decisions (Kozinets et al., 2010), others state that it still remains one of the least
understood forms of communication despite its acknowledged effectiveness (Trusov et
al., 2009). Due to the decreased consumer trust in organizations (Sweeney et al.,
2008), the increasingly negative attitudes towards advertisements and the subsequent
reduction in the effectiveness of traditional marketing communication efforts (Trusov
et al., 2009), marketers have become especially interested in studying WOM in their
search for a cost-efficient marketing tool. Moreover, the rise of the internet has brought
up new opportunities, venues and means of communication for both consumers and
firms to engage in WOM (Sweeney et al., 2008; Trusov et al., 2009). Thus, the ongoing
digitalization is emphasizing the need to understand the conditions in which WOM
influences consumer behaviour the most.
Along with this line of thought, a plethora of studies focusing on the influence of eWOM
communication has emerged during the last few years. Although not being an entirely
separate phenomenon from offline WOM, the electronically facilitated information
exchange has provided a more recent context for researchers to study the effects of
consumer-to-consumer communication. In particular, from their review of existing
studies concerning eWOM impact, Cheung and Thadani (2012) deduced that current
research has been conducted mainly on two levels. First, market-level research has
studied eWOM impact by measuring market-level parameters, such as the relationship

15
of online review valence, i.e. the ratio of positively and negatively laden words
(Ismagilova et al., 2017: 52), and product sales. Second, individual-level research has
focused on the impact of eWOM as a process of personal influence thus examining the
impact of communication between a sender and a receiver (Cheung & Thadani, 2012).
Hence, this study adds to the findings of the latter school of research by focusing on the
effects of information exchange within an individual. Such an approach is also
represented in the example studies described in table 2.
Table 2 Individual-level research focusing on the influence of eWOM
Author Topic Context Explanatory factors
Chu & Kim, 2011 Social factors that
influence consumer’s engagement in eWOM
Social networking sites as a mediator
for eWOM communication
Tie strength, Homophily, Trust, Interpersonal
influence
Fan et al., 2013
Factors affecting perceived eWOM
credibility and information adoption
Customer reviews in an online shopping
context
Source credibility, eWOM quantity, eWOM quality,
Consumer expertise, Consumer involvement
See-To et al., 2014
Interaction effect of trust, value co-creation and
eWOM to purchase intention
Social networking sites as a mediator
for eWOM communication
Source of eWOM, Value co-creation, Trust
Tsao & Hsieh, 2015 Factors of eWOM quality
affecting consumer’s purchase intention
Different types of products and online
platforms as a mediator for eWOM
communication
eWOM quality, eWOM credibility, eWOM
platform, product type
Erkan & Evans, 2016
Key factors of eWOM source that affect
consumer’s purchase intention
Social media networks as a
mediator for eWOM communication
Information quality, Information credibility, Needs of information,
Attitude towards information
To describe a few of these examples, Chu and Kim (2011) studied empirically how social
networking sites serve as a vehicle for consumers to engage in eWOM behaviour. More
specifically, they examined how the personal characteristics of both communicator and
receiver affected opinion-seeking, opinion-giving and opinion-passing behaviour in the
given online platform, while applying a theory of interpersonal influence. As a result,
they found that the communicator’s trustworthiness and the tie strength between the
two parties increased the receiver’s engagement in eWOM behaviour. In addition, the
findings indicated that the receiver’s susceptibility to both normative influence and
informational influence were positively associated with his or her engagement in

16
eWOM (Chu & Kim, 2011). Similarly, Fan et al. (2013) studied the impact of
communicator, message and receiver characteristics on perceived eWOM credibility
but with different variables and a theoretical framework reflecting the Elaboration
Likelihood Model. As a result, they found that both communicator and message
characteristics, i.e. source credibility, eWOM quality and eWOM quantity, significantly
contributed to eWOM credibility, while the receiver characteristics, i.e. expertise and
involvement, did not (Fan et al., 2013). On the other hand, Tsao and Hsieh (2015)
focused on the relationship between eWOM quality, eWOM credibility and purchase
intention, while also examining the moderating effect of the platform and the product
type. Their findings provide further evidence of the positive relationship between
eWOM quality and eWOM persuasiveness as they deduce that online reviews of greater
detail increase the receiver’s trust in the information. However, the hypothesized
influence of the eWOM platform type on eWOM persuasiveness did not occur in the
findings, although an interaction effect between eWOM quality and eWOM platform
was significant. Lastly, they concluded that the product type influences the
persuasiveness of eWOM after finding that online reviews of credence goods – whose
quality is difficult to estimate – are more persuasive than reviews of search goods (Tsao
& Hsieh, 2015).
Based on the review of literature, it seems that many existing studies have chosen to
work with a few specific eWOM effectiveness variables that relate to either message
characteristics and receiver characteristics (e.g. Erkan & Evans, 2016), communicator
characteristics (e.g. Chu & Kim, 2011; Fan et al. 2013) or the platform and product
characteristics (e.g. Tsao & Hsieh, 2015), but not necessarily all of them
simultaneously. While some studies are more holistic than others, existing research
seems to provide rather specialised insights about eWOM effectiveness instead of a
general view over the phenomenon. Therefore, a need for more comprehensive studies,
that illustrate the big picture behind eWOM effectiveness, is reasonably justified.
2.4. Hypotheses development
As argued by Kozinets et al. (2010), it is important to consider the various components
of WOM holistically in order to better understand its effectiveness. Therefore,
researchers should not focus only on individual factors, but rather on a set of factors
and the internal relationships within it. Reflecting this thought, the literature analysis
and the subsequently proposed framework (figure 1) by Cheung and Thadani (2012)

17
calls for a comprehensive approach as it integrates existing research by identifying and
grouping together the different dimensions of eWOM effectiveness. More specifically,
their approach is organized according to the dimensions of social communication – a
theoretical concept originally presented by Carl Hovland (1948, as cited by Cheung &
Thadani, 2012). Thus, it is proposed that the influence of eWOM is determined by the
interplay of the communicator, the receiver, the stimuli (message), the
response, and the related factors within them. Similar to the approach by Cheung and
Thadani (2012), and the classification presented by Sweeney et al. (2008), these four
dimensions of social communication are adapted in this study to form an integrative
and diverse view of the determinants of eWOM effectiveness. Contrary to the rather
dispersed field of existing research that has traditionally focused on the factors of only
one or two of the abovementioned dimensions, this study aims to incorporate relevant
factors from each of them for a broader empirical view. However, acknowledging the
limited resources of this research and the complexity of eWOM phenomenon, creating
a fully comprehensive study model is not deemed viable.
Figure 1 An integrative framework of the impact of eWOM communication (Cheung & Thadani, 2012)

18
In figure 1, a conceptual framework originally proposed by Cheung and Thadani (2012)
is presented. The framework draws from the findings of extant eWOM research in an
attempt to model the mechanics of communication effectiveness. The main elements of
the model are the four dimensions of social communication, including the
communicator, the receiver, the stimuli (message) and the response, that each may
involve numerous subsets of factors respectively (Cheung & Thadani, 2012). As follows,
each dimension of eWOM communication is discussed together with the related factors
and hypotheses before presenting the theoretical framework for this study.
2.4.1. Effectiveness of eWOM: responses
In this framework, response is determined by the receiver’s reaction to the online
information exchange as outlined by Cheung & Thadani (2012). Thus, the response is
the outcome of an interplay among the other elements of eWOM communication.
Namely, the receiver characteristics, the sender characteristics and the message
characteristics that all affect the response either directly or indirectly (Cheung &
Thadani, 2012). In the existing literature, a positive relationship between eWOM and
consumers’ purchase intentions has been well established (Tsao & Hsieh, 2015; Zhang
et al., 2010), while other widely studied eWOM responses include information
adoption, information usefulness and purchase decision (Cheung & Thadani, 2012).
Purchase intention refers to the potential willingness to purchase a product or a service
during an undefined period of time, while purchase decision is based on the actualized
choice of buying a product or a service (Coyle & Thorson, 2001). On the other hand,
information adoption refers to the process of accepting given eWOM communication
and applying it to make decisions (Cheung & Thadani, 2012), which has been found to
have a positive relationship with purchase intention (Erkan & Evans, 2016).
As noted by Cheung and Thadani (2012), the majority of eWOM studies have only
considered one or two response variables while the interrelationships between them
have been left with little attention. Among the most studied response variables is
consumer purchase intention (e.g. Coyle & Thorson, 2001; Prendergast et al., 2010)
which is also adopted for the purpose of this study. This is done mainly for two reasons.
First, the relationship between consumer purchase intention and the other variables
applied in this study has not yet been studied extensively. Thus, the impact of both
communicator, receiver and message characteristics on purchase intention can be
better understood. Second, examining how eWOM communication affects consumer

19
purchase intention will provide managerial insights that can help identify opportunities
for the firms’ marketing strategy (e.g. leveraging WOMM tactics to drive business
outcomes).
2.4.2. Impact of communicator characteristics
In the context of eWOM, communicator refers to the source of information, thus
making it a key element in determining the overall communication effectiveness. As
discussed by Cheung and Thadani (2012), a communicator is identified as the person
sharing his or her opinion about a product to an online audience. Whereas in
traditional WOM both the receiver and the communicator share the same physical
space in an offline dialogue, the participants of eWOM can share information in a
virtual environment beyond their personal social networks. Thus, the identity and
credibility of the communicator are not always verifiable which can raise several
concerns for the receiver. (Cheung & Thadani, 2012).
First, the potentially unfamiliar communicator can raise concerns regarding source
credibility, which has been found to be among the key factors affecting eWOM
effectiveness (Cheung & Thadani, 2012). According to definition, source credibility
describes whether the communicator, not the message itself, is believable and
competent enough to transfer product or service knowledge to the receiver of
communication (Cheung & Thadani, 2012). Among the frequently studied attributes of
source credibility are expertise (Sweeney et al., 2008) and trustworthiness (Cheung et
al., 2008) that are subjectively evaluated by the receiver after a piece of information has
been shared online by the communicator. On the one hand, credibility can be
understood as something that a source already has due to e.g. a public status of an
industry expert. On the other hand, as a result of the accumulated eWOM information
that is archived online, the communicator can also develop his or her credibility by
sharing truthful and knowledgeable information over time. Either way, sources with
higher credibility have been empirically shown to have a more significant impact on
information adoption than sources with low-credibility (Cheung et al., 2008).
Therefore, the first hypothesis of the study is formulated as:
H1) Credibility of the eWOM communicator is positively associated with purchase
intention.

20
Second, concerns regarding other interpersonal characteristics, such as source
similarity, can also have an impact on WOM effectiveness (Sweeney et al., 2008). As
interpersonal characteristics have been found to be important in traditional WOM
(Sweeney et al., 2008), they continue to play a role in eWOM even if the participants of
the dialogue no longer meet face-to-face. In fact, interpersonal characteristics are
mediated by the online platform (Chu & Kim, 2011; Shan & King, 2015). Among the
attributes of source similarity are homophily and social ties that were classified as being
characteristics of the communicator by Cheung and Thadani (2012). As proposed in the
studies by Chu and Kim (2011) and Shan and King (2015), social ties, i.e. tie strength
can be categorized either as strong or weak depending on the relative closeness of the
bond between groups of individuals. In brief, strong social ties are established through
personal relationships, such as family and friends, whereas weak social ties constitute
less personal relationships that involve a variety of acquaintances (Chu & Kim, 2011;
Shan & King, 2015). Hence, stronger social ties are likely to positively impact eWOM
adoption due to higher perceived reliability and rapport.
Moreover, the concept of homophily is defined as an individual tendency to interact
with other people that are “congruent or similar in certain attributes” (Chu & Kim,
2011: 54) thus contributing to our understanding of overall source similarity. In other
words, high levels of homophily among a group of people would indicate they share
similar attributes related to e.g. gender, age, values, lifestyle and attitudes. Previous
studies have found that individuals with high levels of homophily tend to socialize with
each other more often, thus they are more likely to transfer knowledge and accept
information from each other (Chu & Kim, 2011; Sweeney et al., 2014). Based on these
theoretical notions, the second hypothesis of the study is:
H2) Source similarity is positively associated with purchase intention.
2.4.3. Impact of stimuli characteristics
According to the definition by Cheung and Thadani (2012), stimuli refers to the
information or the message that is forwarded from the communicator to the receiver, as
also illustrated in the framework. Due to the distinct characteristics of eWOM, the
message itself plays an essential role in determining the final impact of communication.
Compared to traditional WOM dialogue, the non-linear and anonymous nature of
eWOM communication may prevent the receiver from sufficiently assessing the
communicator’s credibility. Thus, the online message may reveal a variety of cues that
21
affect the decision to either adopt or ignore the information provided (Cheung &
Thadani, 2012).
Although previous research has established various factors related to message
characteristics, among the most frequently studied factors are eWOM quality and
eWOM quantity (Cheung & Thadani, 2012). In essence, the quality of information is
determined by the nature of message (Sweeney et al., 2008) and the validity of
argumentation (Cheung et al., 2009) that have been measured by e.g. information
content, accuracy, timeliness and comprehensiveness in past studies (Cheung &
Thadani, 2012). As argued by Park et al. (2007), online reviews have no predefined
format hence their content can reveal important cues to the receiver about the author of
the message. If the identity of the communicator is unknown, the level of logical and
credible reasoning used in the review becomes even more important in deciding
whether to accept or reject the information (Park et al., 2007). In conclusion, if the
quality of argumentation is perceived to be robust enough, the receiver is likely to react
either positively or negatively towards the information depending on the valence of
argument (Cheung et al., 2009). Related to argumentation, previous studies have also
found that eWOM messages providing two-sided comments (i.e. for and against the
product or service) add to the integrity of the information (Cheung & Thadani, 2012;
Cheung et al., 2009). Thus, a balanced ratio of eWOM sidedness, i.e. both positive and
negative comments included in the message, is expected to contribute to the overall
credibility and quality of communication. Considering these findings, the following
hypothesis is proposed.
H3) eWOM quality is positively associated with purchase intention.
Similarly, the bare volume of information – i.e. “the total number of eWOM units sent
about a particular object” (Rosario et al., 2016: 301) may lead to increased eWOM
effectiveness as consumers tend to perceive high quantities of reviews as a sign of
popularity (Park et al., 2007). Some studies have found that high quantities of eWOM
create a positive awareness effect even if the valence of reviews is perceived to be
negative (Cheung & Thadani, 2012), which highlights the so called “bandwagon” effect
(Rosario et al., 2016). Thus, high eWOM quantity is expected to have a positive
relationship with purchase intention.
H4) eWOM quantity is positively associated with purchase intention.

22
2.4.4. Moderating effect of receiver characteristics
According to the framework, receiver refers to the individual that is affected by the
information (Cheung & Thadani, 2012). In other words, eWOM receiver is the person
responding to the product- or brand-related communication from other consumers
online. However, the influence of eWOM varies according to the personal
characteristics of the receiver and his or her previous experiences with the discussed
product or service (Cheung & Thadani, 2012). Thus, the factors related to individual
characteristics should be considered together with the other determinants of eWOM
effectiveness to see how they interact.
Among other personal factors, such as consumer expertise, consumer involvement (Fan
et al., 2013) and information needs (Erkan & Evans, 2016), previous research has also
studied the receiver’s overall attitude towards eWOM information (Park & Kim,
2008; Park et al., 2007). In fact, the consumer’s attitude towards eWOM information
has been empirically demonstrated to have a positive relationship with consumer
purchase intention (Chang et al., 2005; Erkan & Evans, 2016) which makes it an
interesting factor for this study. In addition, extant studies (e.g. Chu & Kim, 2011; Tsao
& Hsieh, 2015) have referred to social influence when explaining eWOM effectiveness
on consumer decision-making as it “tends to amplify the influence that eWOM has on
consumers” (Tsao & Hsieh, 2015: 516). Hence, the more consumers are susceptible to
interpersonal influence, the more they are expected to engage in their eWOM
intentions (Chu & Kim, 2011). In essence, such influence accounts for “the changes in
an individual’s reaction to given matters in response to or in deference to other people’s
opinions” (Tsao & Hsieh, 2015: 512). More specifically, interpersonal influence consists
of two dimensions: normative and informational influence. On the one hand, normative
influence affects attitudes, norms and values, and it is defined by the level of conformity
to others’ expectations (Chu & Kim, 2011; Tsao & Hsieh, 2015). On the other hand,
informative influence affects adoption of knowledge, thus it is defined by the level of
information acceptance from others (Chu & Kim, 2011; Tsao & Hsieh, 2015). However,
the two dimensions of interpersonal influence are not mutually exclusive thus they can
overlap and affect consumer decision-making in parallel. For example, a consumer
more susceptible to normative influence would be more dependent on the acceptance of
peers and other social circles than on the information of knowledgeable others,
although both knowledge and social acceptance may have an effect on the final
decision.

23
Given these findings from previous research, it can be deduced that the receiver’s
characteristics are likely to moderate the relationship between the determinants of
eWOM effectiveness and eWOM response. In other words, the better the attitude
towards eWOM and the higher the sensitivity to interpersonal influence, the greater the
impact of other eWOM attributes on the outcome. While both the receiver’s attitude
towards eWOM information and susceptibility to interpersonal influence are expected
to regulate the proportional impact of the other determinants on purchase intention, it
remains to be explored whether either of the moderators is stronger than the other.
Therefore, the following hypotheses are presented:
H5) As the receiver’s attitude towards eWOM information increases, the relationship
between eWOM communicator variables, eWOM stimuli variables and purchase
intention also increases.
H6) As the receiver’s susceptibility to interpersonal influence increases, the
relationship between eWOM communicator variables, eWOM stimuli variables and
purchase intention also increases.
2.5. Theoretical framework for the study
As follows, a theoretical framework for examining the impact of eWOM communication
on consumer’s purchase intention is presented in figure 2. The framework adopts an
integrative approach similar to the theoretical model proposed by Cheung & Thadani
(2012), to involve variables related to the different determinants of eWOM
effectiveness. Although the proposed framework is less comprehensive than the
original model and employs alternative variables, it follows a similar line of thought by
combining ideas from past research to form an overview of eWOM effectiveness. In
particular, the original framework was streamlined by focusing on only one response
variable while using various composite variables as predictors, e.g. susceptibility to
interpersonal influence, source similarity and eWOM quality, that better capture the
multidimensionality of the complex constructs. Nonetheless, this framework draws
from the same notion of social communication (Cheung & Thadani, 2012) in which
overall eWOM persuasiveness is a function of “who says what to whom with what
effect” (Racherla & Friske, 2012: 551).

24
Figure 2 Theoretical framework to study the impact of eWOM on consumer purchase intention (adapted from Cheung & Thadani, 2012).
In the framework, specific eWOM variables related to the receiver, the sender and
the stimuli are involved and their relationship to the response element is examined.
Based on the findings of previous research, both communicator and stimuli
characteristics are tested for a direct effect to eWOM response whereas the receiver
characteristics are tested for both direct effect and moderating effect which was also
proposed by Cheung and Thadani (2012). Logically, a moderating effect can be
expected as the receiver is in the middle of the online information exchange – i.e. being
exposed to the information that he or she evaluates according to its content and the
characteristics of the sender before deciding on the subsequent action. Thus, depending
on the receiver’s attitude and susceptibility to interpersonal influence, the magnitude
and direction of the relationship between communicator characteristics and eWOM
response and/or message characteristics and eWOM response may change. According
to the objectives of this study, the eWOM response element is defined as purchase
intention, which has also been the focus of most studies in the past (e.g. Erkan & Evans,
2016; Park et al., 2007). However, since the relationship between consumer purchase
intention and the other variables used in this study has not been comprehensively
studied, the combined impact of these predictors on purchase intention can be better
understood with the help of this framework. In addition, the role of the goods type is
eWOM stimuli
eWOM communicator
H1.
H2.
H3.
.
H4.
.
H5.
H6.
eWOM response
eWOM receiver
Source
credibility
Source similarity
Purchase intention:
Gen Z consumers in a service
context
eWOM quality
eWOM quantity
Direct effect
Moderating effect
Susceptibility to
interpersonal
influence
Attitude towards
eWOM
information

25
considered by anchoring the framework to a service context in which eWOM has been
found to be most useful for consumer’s decision-making (e.g. Sweeney et al., 2014).
Table 3 eWOM effectiveness constructs involved in the study
Source credibility
Source similarity
eWOM quality
eWOM quantity
Receiver susceptibility
to interpersonal
influence
Receiver attitude towards eWOM
information
The expertise and
trustworthiness of the
communicator
The homophily
and tie strength
between the communicator
and receiver
The credible reasoning and
objective argumentation embedded in the message
The volume of eWOM messages
available in online
archives
The extent to which the receiver is
affected by social influence
(normative and informative)
The personal stance the
receiver has adopted towards eWOM
information
In accordance with the findings from existing literature, this study employs the above
mentioned conceptual constructs that contribute to eWOM effectiveness: source
credibility, source similarity, eWOM quality, eWOM quantity, receiver susceptibility to
interpersonal influence and receiver attitude towards eWOM information (table 3).
These effectiveness constructs are based on one or more representative sub-scales that
each relate to one of the main dimensions of eWOM communication (communicator,
receiver, stimuli). Based on this approach, the study provides an integrative view over
some of the key factors that contribute to eWOM effectiveness in terms of consumer’s
purchase intention while clarifying the relative importance of these factors for a specific
consumer segment, i.e. the Generation Z. Hence, each of the effectiveness constructs is
used as an independent variable while the purchase intention is used as the dependent
variable in the upcoming analysis. As a result, our understanding of the importance of
eWOM in consumer’s decision-making process is improved by applying a previously
identified theoretical approach in an empirical context and testing the six hypotheses
about the interrelationships of various eWOM effectiveness constructs.

26
3 RESEARCH METHODOLOGY
In the following chapter, the methodological choices for conducting the empirical
research are explained. Both research design and data collection are discussed together
with the proposed measures and data analysis techniques.
3.1. Research design
Although the impact of eWOM can be examined both quantitatively (e.g. Park et al.,
2007; Trusov et al., 2009; Zhang et al., 2010) and qualitatively (e.g. Sweeney et al.,
2008), statistical methods are better suited for answering the specific research
questions of this thesis because they enable the description, measurement and
comparison of relationships between variables. Hence, this thesis is based on a
quantitative research design that draws upon theoretical concepts and measures
available in previous research. According to this deductive approach, insights generated
by the literature review are used to form relevant topics, conceptual constructs and
specific scales for the investigation. In this case, investigation is based on an online
survey which will provide the required dataset for conducting further analysis. That is,
identifying relationships between the selected constructs to make statistical inferences
regarding eWOM effectiveness. In conclusion, this study aims to examine the
relationships between previously identified conceptual constructs while generalizing
the results to a specific population.
3.1.1. Data collection
According to the objectives of the study, the data were collected among young
consumers of Generation Z that forms approximately one fourth of the total population
in Finland alone (Statistics Finland, 2017). As advised by Saunders et al. (2009: 217–
220) and Hair et al. (2010: 175–176), a sufficiently representative sample is required to
make confident generalisations about the population. Thus, a critical mass of at least
100 respondents was targeted by using a cross-sectional survey instrument online
which allowed convenient data collection from such a big population. The target sample
size was determined according to the guidelines by Pallant (2010: 150) and Hair et al.
(2010: 175–176), who propose an approximate sample of 90–120 respondents for a
study with six independent variables, thus yielding roughly 15–20 observations per
predictor.

27
Although some eWOM studies have conducted designed experiments with simulated
eWOM scenarios (e.g. Smith et al., 2005; Park & Kim, 2008) or analysed WOM
effectiveness based on actual online information and consumer activity (e.g. Trusov et
al., 2009), other studies have also used traditional surveys as the instrument for data
collection (e.g. Sweeney et al., 2014). While the first-mentioned artificial experiments
provide high precision, designing them for a larger sample can become costly and they
are often conducted in a laboratory environment that is unlikely to be related with the
real world (Saunders et al., 2009: 142–144). On the contrary, recall-based survey
methods provide a more cost-effective way of collecting quantitative data in a natural
context while enabling the researcher to statistically analyse particular relationships
between variables (Saunders et al., 2009: 144–145). Thus, a survey instrument was
deemed appropriate for the purpose of the study. However, its limitations in describing
real-world behaviour should also be acknowledged. For example, the respondent may
experience a lack of memory or knowledge regarding a particular event while an
interpretive bias could also occur when answering the questionnaire (Saunders et al.,
2009: 363–365). In addition, the ability of a survey to understand a specific context is
always limited by the number of variables involved in the study (Saunders et al., 2009:
144–146). Therefore, compared to live observation of the subjects, a questionnaire-
based survey may only provide an estimation of the reported behaviour, which in this
case refers to receiving and reacting to eWOM communication.
3.1.2. Sampling and accessing data
Generation Z consumers were specifically chosen as the target group of the study due to
their extensive experience with the online environment, in which they choose to spend
an increasing amount of time. As the youngest generation currently in the market –
born in 1995 and after (Chaney et al., 2017), they have grown up during the age of the
internet while becoming highly familiar with various platforms in which eWOM may
occur. As a result, this group of consumers has a high likelihood of engaging in eWOM
thus increasing the probability for extracting meaningful data.
As it stands, the oldest Generation Z consumers turned 22 at the time of the data
collection (December 2017), thus it could be assumed that students were widely
represented in the total population. For this reason, the researcher considered a sample
of students to be appropriate. However, to avoid any ethical controversy, a minimum
age limit of 18 years was set for the study. Only adults were involved in the sample

28
because they are able to give their consent for participation. As a result, the youngest
individuals of Generation Z (born 2000 and after) were disregarded thus limiting the
scope of the study. However, a sufficient amount of the total population is eligible for
the research according to this criterion hence enabling fluent data collection. This
sampling approach is also supported by the fact that consumers of legal age have full
control over their spending and financial resources. Thus, they are more capable to
evaluate their own consumption and buying behaviour than minors who are still
dependent on their guardians and do not possess as much experience in the market as
an adult consumer.
To access data, the researcher decided to draw the sample from closed community
groups within a social networking site. For this purpose, Facebook was chosen as the
most suitable platform since it involves the majority of Finnish users. Here, the term
‘closed group’ refers to a private group that has limited access to members only and in
which all members and group publications need to be approved by dedicated
administrators. As followed, the administrators of 30 individual Facebook groups were
contacted in order to negotiate access and a permission to publish the survey within the
closed group. The closed groups were filtered according to specific keywords that
allowed to find groups with newly enrolled freshmen members from both universities
and universities of applied sciences. In addition, the administrators of 5 other groups
were approached. These closed groups included final year students in upper secondary
schools which allowed the younger end of the sample to be reached. The
aforementioned search engine criteria were specifically used to find relevant Facebook
groups that have a high likelihood of having members within the desired age cohort.
As a result of the Facebook inquiry, the study was granted access by the administrators
of 11 closed groups consisting of first-year students in universities and universities of
applied sciences. In addition, the study was granted access by the administrators of 2
closed Facebook groups that included senior upper secondary students. According to
plan, a direct link to the questionnaire and a covering note was posted to a total of 13
groups during weeks 49-51 in December 2017. In four of the groups, the researcher was
allowed to join the group as a new member and publish the post himself while the
remaining posts were directly published by the administrators. The questionnaire was
accessible online for four weeks until the minimum sample size (N=100) was
surpassed. During this time, reminders were sent to the participating groups to
motivate the potential respondents. Since the respondents themselves eventually
29
decided whether to answer to the questionnaire or not, a self-selective sample was
formed (Saunders et al., 2009: 362–363). Finally, the questionnaire was closed on 31st
December 2017.
In conclusion, the online questionnaire was posted to a total of 13 Facebook groups that
had student members from both secondary and tertiary educational institutes. All of
the groups involved Finnish-speaking students. The first 11 groups included first-year
students and their tutors from universities and universities of applied sciences. Among
them were KIK-fuksit 2017 (162 members), LUT fuksit 2017 – kauppatieteet
(244 members), Vaasan yliopiston fuksit 2017-2018 (449 members), Preemion
fuksit 2017 (119 members), Lapin oikeustieteellisen fuksit 2017 (204 members),
Laurea Lohjan fuksit syksy 2017 (110 members), Laurea Tikkurila fuksit
kevät ’17 (146 members), Tekun fuksit 2017 (163 members), PT-fuksit 2017 (207
members), Gulis 2017 (227 members), TiTe-fuksit 2017 (99 members). The last 2
groups included senior upper secondary students. Among them were Torkkelin abit
2018 (94 members) and Linnankosken abit 2017-2018 (161 members). As a result,
the sampling pool involved a total of 2 385 students. Out of these 191 students took the
survey and filled in the questionnaire. After filtering out the eligible respondents (see
3.1.3. for filtering questions), the final sample size was 135 thus yielding a response rate
of 5.6%.
3.1.3. Questionnaire design
The quantitative scales employed in the study were adapted from existing studies to
ensure sufficient validity. Hence, a cross-sectional survey instrument was compiled by
using relevant measures that relate to the conceptual constructs previously identified in
the literature. The questionnaire included statements regarding the determinants of
eWOM effectiveness and the respondent’s intention to purchase. In addition,
demographic information was collected together with some general data related to
consumption of services and internet usage.
Furthermore, the questionnaire was anchored in a service context in order to collect
more meaningful data. As pointed out in the literature, eWOM is likely to have a
significant influence on purchase decisions regarding experience goods, such as
services, rather than tangible goods (Racherla & Friske, 2012; Sweeney et al., 2014).
Hence, the respondents were asked to consider situations in which they typically

30
searched for online information about services and to identify the types of services they
sought information about.
In addition, the respondents were asked to categorize the online channels in which
eWOM communication had previously occurred to them in order to allow an
examination of the communication platform. As there is a wide range of different
online platforms, the study was not tied to any specific online channel. Instead, this
contextual factor was addressed by outlining three platform categories that represented
some of the typical venues for online information exchange – namely social networking
sites, review websites and discussion forums. In addition, a fourth category was left
open for any additional platforms not included under the three main categories. As a
result, the respondents were able to indicate the most relevant eWOM platforms based
on their own experience – either by selecting a pre-determined category or describing
any platform in their own words. The decision to include these platform options was
done mainly for three reasons. First, the potential effect of the platform can be
examined to some extent by comparing scores in between the groups of different
platform users if desired. Second, there are numerous alternative platforms available
online, but not all of them can be outlined individually. Hence, categorization is
deemed appropriate. Third, the presented platform categories are wide enough to
facilitate online information exchange with both existing personal connections and
other connections. Thus, a wide range of communicators, such as friends, opinion
leaders, influencers and unknown consumers, is included under the scope of the study.
Both of the abovementioned contextual factors were outlined in the first two sections of
the questionnaire (Q1-Q7, see Appendix 1 & 2) before proceeding to the questions that
relate to the theoretical constructs. In these sections, there were also general questions
about the respondents’ age, gender, education level and time spent online. The two
screening questions employed in the questionnaire were respondent’s age (Q1) and
his/her previous experience with receiving eWOM about services (Q5). The following
six sections (Q8–Q15, see Appendix 1 & 2) of the questionnaire were arranged
according to the main constructs and the related 35 items respectively. In other words,
each individual section had an amount of 7-point Likert-scale items related to each of
the main eWOM dimensions – the communicator, the stimuli, the receiver or the
response, but none of them were mixed in between sections. This was done to ensure a
conceptually cohesive structure, to improve overall clarity and keep the respondent as

31
engaged as possible. After designing the first draft of the questionnaire, an online
version of the questionnaire was built and published using Webropol 3.0 software.
By framing the questionnaire into lived events, the research adopts a recall approach
that has been used in similar survey-based WOM studies (e.g. Sweeney et al., 2014).
However, this specific approach can also be criticised because it is highly contingent on
the respondent’s memory and provides only a general view of the studied phenomenon.
Hence, a weak memory of a specific event could distort the results and increase the
probability of response bias. Another approach widely employed in eWOM studies is a
simulated decision-making task (e.g. Smith et al., 2005) in which a factorial experiment
is usually created to control the effect of different variables in a laboratory
environment. Nonetheless, such an approach is rather resource-intensive and more
demanding since the researcher him- or herself is required to create hypothetical
scenarios for the experiment which increases the likelihood of experimenter bias.
Therefore, a self-administered and recall-based questionnaire, which allows cost-
efficient data collection in a natural context, was perceived to be the most feasible data
collection tool for this study.
3.1.4. Construct operationalization
Based on the proposed research model, the eWOM effectiveness variables listed below
and their interrelationships were studied together with the purchase intention variable.
All of the variables were measured on Likert-type scales that were retrieved from past
studies and adapted to fit the specific context of this study. Only minor changes were
made to the translations of individual items while the overall meaning of each item was
kept as close to the original as possible. More specifically, in the source credibility scale
(Cheung et al., 2008), the online platform that was pre-specified in the original items
was simply replaced by the word ‘online’ since this study was not delimited to a specific
platform. In addition, the words ‘product’ and ‘brand’ that appeared in the items of
several scales (Cheung et al., 2008; Chu & Kim, 2011; Coyle & Thorson, 2001; Park &
Kim, 2008) were replaced by the word ‘service’ because this study was solely focused on
purchase intention regarding services. Finally, the attitude scale by Park and Kim
(2008) was adjusted by omitting the word ‘online’ from each item since this study was
not limited only to purchases made on the internet but purchases in general (both
offline and online). Thus, all of the abovementioned changes were justified by the
contextual scope of the study.
32
In the context of this study, source credibility is based upon the communicator’s
expertise and trustworthiness that both include two items adapted from Cheung et al.
(2008). On the other hand, source similarity involves both a 4-item homophily scale
adapted from Sweeney et al. (2014) and a 5-item tie strength scale adapted from Shan
& King (2015). Both eWOM (message) quantity and quality are measured on 2-item
and 4-item scales adapted from Park, Lee and Han (2007), while a 2-item scale is
adapted for eWOM sidedness (Cheung et al., 2009) as part of the quality construct. The
receiver’s susceptibility to interpersonal influence is examined through the
measures of normative influence (4 items) and informational influence (2 items)
adapted from Chu & Kim (2011). Moreover, the receiver’s overall attitude towards
eWOM information employs a 4-item scale adapted from Park and Kim (2008).
Finally, purchase intention is studied with three items adapted from Coyle and
Thorson (2001).
All of the 35 items were measured on a 7-point Likert-type scale (Strongly disagree–
Strongly Agree) which allowed for more variance among the responses than e.g. 5- or 6-
point scales. Two of the adapted items employed a reverse-coded scale. All of the
adapted scales are summarized in tables 4 and 5 while the final version of the
questionnaire is attached in appendices (see Appendix 1 & 2 for language versions).

33
Table 4 Summary of the variables related to eWOM communicator and stimuli dimensions
Construct Variable Adapted items Author
Source credibility
Expertise (source_EXP)
The person who left comments online is knowledgeable in evaluating the quality of
service.
Cheung et al., 2008
The person who left comments online is an expert in evaluating the quality of service.
Trustworthiness (source_TRUST)
The person who left comments online is trustworthy.
Cheung et al., 2008
The person who left comments online is
reliable.
Source similarity
Homophily (source_HPHLY)
You and the person who gave WOM have a close relationship.
You and the person who gave WOM have a similar outlook on life.
You and the person who gave WOM share common interests.
You and the person who gave WOM have similar likes and dislikes.
Sweeney et al., 2014
Interpersonal Tie
Strength (source_TIE) I am committed to maintain my relationship
with this person. Shan & King,
2015
I want our relationship to last for a long time.
I feel very strongly linked to this person.
I would not feel very upset if our relationship were to end in the near future.
I am oriented towards continuing this relationship in the long term.
The relationship with this person is important
to me.
eWOM quality
Overall quality (message_QUAL)
Each review has sufficient reasons supporting the opinion.
Each review is objective.
Each review is understandable.
Each review is credible.
Park, Lee & Han, 2007
Recommendation
sidedness (message_SDNES)
The review includes both pros and cons of the discussed service.
Cheung et al., 2009
The review includes only one-sided comments.
eWOM quantity
Volume (message_VOL)
The number of recommendations is large.
The quantity of review information is large.
Park, Lee & Han, 2007

34
Table 5 Summary of the variables related to eWOM receiver and response dimensions
Construct Variable Adapted items Author
Susceptibility to interpersonal
influence
Normative influence
(receiver_NORM)
When buying services, I generally purchase those brands that I think others will approve of.
If other people can see me using a service, I often purchase the brand they expect me to buy.
I achieve a sense of belonging by purchasing the same services and brands that others purchase.
Chu & Kim, 2011
Informational influence
(receiver_INFO)
If I have little experience with a service, I often ask my friends about it.
I often consult other people to help choose the best alternative available among services.
I frequently gather information from friends or family about a service before I buy.
Attitude towards eWOM
information
Attitude
(receiver_ATT)
When I buy services, I always read reviews presented online.
Park & Kim, 2008
When I buy services, the reviews presented online are helpful for my decision making
When I buy services, the reviews presented online make me confident in purchasing the product.
If I don’t read the reviews online when I buy services, I worry about my decision.
eWOM Response Purchase intention
(response_PUR)
It is very likely that I will buy the service. Coyle & Thorson,
2001
I will purchase the service the next time I need it.
I will definitely try the service.
3.1.5. Pilot testing and translation of the questionnaire
Along with the process of finalising the questionnaire, pilot tests were conducted
among a small convenience sample of 10 university students to see whether the
contents of the questionnaire were sufficiently comprehensible. Several test rounds
were conducted in an iterative manner and written feedback was collected each time to
improve the flow and clarity of the questionnaire. As followed, the feedback was mainly
concerned with the number of different questionnaire sections and the order in which
the questions were presented. Thus, the questionnaire was divided into dedicated
sections according to the individual scales, allowing the researcher to direct the
respondent’s attention to a single subject at a time.

35
As per plan, the questionnaire was first designed in English and then translated into
Finnish to enable data collection from a Finnish population. The translation process
was conducted in an iterative manner in which the source content (items in English)
and the target content (items in Finnish) were compared side by side, translated, tested
and then improved to reach sufficient internal equivalence. The contents of the original
items and the adapted items were evaluated and refined based on the feedback from
both pilot test participants and thesis supervisor. Most of the feedback was concerned
in clearly separating similar items from each other and using consistent terminology
throughout the questionnaire.
3.2. Data analysis
The survey data were statistically analysed using SPSS software. Before exploring data
in depth, the dataset was screened to verify that the basic assumptions for statistical
analysis were met. For example, the distribution of variables, missing values and
outliers were checked (Pallant, 2010: 43–50). Furthermore, as advised by Hair et al.
(2010: 125–127) the scales involved in the questionnaire were examined by using
Cronbach’s alpha which provides an approximation of each scale’s internal consistency.
In other words, each scale was entered separately into reliability analysis by calculating
the Cronbach’s alpha, which is based on the scale-specific items’ ability to measure the
desired phenomena. This procedure ensures that the interpretation of the combined
items within each scale is feasible. In case the Cronbach’s alpha of a specific scale falls
below the desired level, less consistent items can be excluded from the scale (Hair et al.,
2010: 125–127: Pallant, 2010: 97–101).
To study the relationships between several eWOM constructs and their ability to
predict a single eWOM response (purchase intention), a multiple regression analysis
was applied. According to Hair et al. (2010: 161–167), multiple regression analysis
provides a statistical tool to illustrate and measure the strength of linear relationships
between many independent variables and one dependent variable. In addition, it allows
an assessment of the independent variables’ relative importance and predictive power
both independently and collectively (Hair et al., 2010: 169–173) thus the applied
technique is in line with the objectives of the study.
However, as pointed out in methodology literature, multiple regression analysis is
dependent on using metric variables (Hair et al., 2010: 161–162, 181–182). Hence, the
mean of each multi-item scale was calculated by summating items that connected

36
conceptually (Hair et al., 2010: 124–127). This computation procedure allowed the
scales to be treated as continuous although the single items were measured on an
ordinal, Likert-type scale. As a result, the eWOM scales related to the communicator,
the receiver and the stimuli were used as independent variables and the scale related to
eWOM response (purchase intention) was used as the dependent variable in the
regression model. To test interaction effects between the variables, different models
with and without the moderator variable were constructed and compared to see which
of them provided the most accurate explanation in variance regarding the outcome
(purchase intention).
Lastly, the specific assumptions related to statistical applications of multiple regression
analysis were examined to ensure the model provides grounds for viable
interpretations. Thus, statistical tests to detect any issues with multicollinearity were
used together with observations of normality and homoscedasticity to validate the
model (Hair et al., 2010: 181–186, 200–205).
3.3. Assessing the quality of research
As the sampling, measurement operationalization and data collection processes have
been made as transparent as possible, the repeatability of the study is improved.
According to Saunders et al. (2009: 156–157), repeatability and equivalence increase
the overall reliability of the research if another experiment could be conducted with a
similar sampling method in the future. However, there were few other inherent factors
in the data collection process that affect the overall quality of the research. First, it is
recognized that a homogeneous sample involving only students from a small
geographical area, such as Finland, may lead to biased results. Thus, the results may
not be generalizable to total population within the scope of this study. Second, the final
sample size of 135 may be sufficient for meaningful statistical analysis, but it might not
provide enough grounds to make confident generalizations either. With the total
population of Finnish Generation Z consumers being approximately 1,375 million
(Statistics Finland, 2017), a more confident sample size would have been in the range of
500–1000 (confidence level 95%, margin of error < 5%).
In terms of data quality, it is also a concern that the link of the online questionnaire was
public to the members of the selected Facebook groups. Thus, it could have been
accessed multiple times by the same respondent, which creates an opportunity for
duplicate answers among the dataset. This issue could have been avoided by

37
distributing the questionnaire directly through a traceable email link, but due to
restrictions with data access it was not a feasible option.
Since the online survey was in fact based on self-reporting of the respondents, the
potentially underlying response bias should also be addressed to decrease sample error
while increasing the external validity i.e. the accuracy of the research in generalizing
results. Existing literature suggests various ways to assess this issue, such as analysing
non-response bias or non-response error (Lindner et al., 2001). According to
Armstrong and Overton (1977), non-response bias may occur when a specific group of
potential survey respondents are unwilling to provide answers. With low response rates
within the sample, this phenomenon creates a suspicion of whether the persons who
responded are significantly different from those who did not. If indeed there was a
substantial gap between the two groups, the results would not directly reflect the way
the entire sample would have answered the survey (Armstrong & Overton, 1977).
Although the best remedy against non-response bias is to increase the overall response
rate of the study, other approaches have been suggested as well. To assess the effect of
potential non-response bias, Armstrong and Overton (1977: 2) discuss extrapolation as
a method in which the “subjects who respond less readily” are assumed to be “more like
nonrespondents”. In similar manner, Lindner et al. (2001) discuss a method in which
the early respondents are compared to the late respondents. More specifically, it is
noted that studies that have previously addressed non-response bias have primarily
used a technique that splits the sample in two distinctive sub-samples while testing
whether any significant differences exist between the early and late respondents on any
given variable (Lindner et al., 2001: 51). To illustrate the method, Lindner et al. (2001:
45) cite Connors and Elliot (1994: 16): “Respondents were grouped as early or late
respondents. The two groups were compared on their responses to the Likert scale
questions using t-tests”. Hence, a similar approach is deemed appropriate and adopted
for the purpose of this study.
As follows, the entire dataset (N=133) was split in two groups: early (N=66) and late
respondents (N=67). In this case, the latter group represents the respondents that did
not take the survey but belong to the population nonetheless. By running an
independent-samples t-test with the split dataset, the potential differences among the
two groups were analysed on all of the seven scales that were previously combined into
the following composite variables: source credibility, source similarity, eWOM quality,
eWOM quantity, susceptibility to interpersonal influence, attitude towards eWOM

38
information and purchase intention. As a result, the Levene’s test returned a
significance level p>.05 for all of the variables except for Purchase intention which
yielded a significance level p=.027, thus implying that the variance for early and late
respondents is not equal regarding this specific variable. To verify whether the groups
differed significantly from each other, the results of the t-test were then examined on
each variable. However, no evidence was found regarding significant differences (p>.05
for all variables) (Pallant 2010: 241–242).
Alongside with non-response bias, the effect of the gender was investigated. As noted in
section 4.2, the division between male (N=39) and female respondents (N=94) was
rather unequal in the sample. Hence, an independent-samples t-test was conducted to
see whether any significant differences existed in between men and women (Pallant
2010: 241–242). The results implied a highly significant difference between the groups
regarding the scores of eWOM quality variable (p=.004), while the there was no
evidence of group differences regarding the other variables (p>.05 for all variables).
Thus, a further inspection of the eWOM quality variable was conducted by running an
independent-samples t-test with the six individual items belonging to that specific scale
(table 6).
Table 6 Results of independent-samples t-test: comparing males and females on the individual items of eWOM quality scale
Male
(N=39)
Female
(N=94)
Scale item
(eWOM quality)
M SD M SD t-test
Each review has sufficient reasons supporting the opinion.
6.00 1.30 5.46 1.47 2.02*
Each review is objective. 4.97 1.95 4.47 1.66 1.52
Each review is understandable. 5.82 1.12 5.15 1.59 2.40*
Each review is credible. 5.33 1.83 4.93 1.67 1.25
The review includes both pros and cons of the discussed service.
5.97 1.11 5.32 1.42 2.57*
The review includes only one-sided comments.
5.77 1.27 5.61 1.25 .683
*Significant when p < .05 (2-tailed)

39
Overall, the descriptive analysis reveals that men (M=5.65, SD=.87) perceive the
quality of eWOM messaging slightly more important than women (M=5.15, SD=.88; t
(131) =2.95, p=.004). When looking at the individual items, the group means differ on
three occasions that imply a stronger emphasis on the strength and clarity of
argumentation among male respondents. Thus, the effect of the gender should be
considered when interpreting the results of the research.

40
4 EMPIRICAL FINDINGS
In the following chapter, the results of the empirical research are examined. The
descriptive statistics and statistical assumptions are first discussed, which is followed
by a reliability evaluation of the scales and a correlation analysis. Lastly, multiple
regression analysis is applied to examine the linear relationships between the variables.
4.1. Data screening
Before proceeding to statistical analysis, the dataset was screened for potential errors,
cleaned and prepared for further inspection. As advised in the methodology literature,
data screening should be conducted to confirm that data are reliable and valid for
testing theory (Hair et al., 2010: 33–37).
First of all, the respondents were screened for eligibility to ensure that all of the cases in
the dataset provide meaningful insights. Out of the 192 individuals who took the
survey, 135 respondents were eligible according to the pre-determined sample criteria
that were measured with two filtering items in the questionnaire. The first filtering
question (Q1) targeted consumers in the desired age group of 18–22, while the second
filtering question dismissed respondents who had not received eWOM in the service
context (Q5). Hence, only those respondents who had experienced eWOM were
included in the dataset. As a result of the preliminary screening, 57 invalid cases were
removed from the dataset thus leading to a sample size of 135.
Second, all of the variables in the dataset were checked for any errors, such as missing
values or out-of-range values. As a result of the descriptive analysis, all values in the
dataset were within the expected range except for two cases. For an unknown reason,
there were two responses in which the value of a single Likert-type item was recorded
zero (on a scale from 1–7). Given the extremely small amount of the cases with out-of-
range units (1,5% of total sample), the two responses were omitted from the dataset
instead of unit imputation, thus leading to a reduced sample size of 133. This approach
is supported by Hair et al. (2010: 44–49) who suggest deletion as an option when low
levels of missing data (<15% of the data) occur. No other errors or missing values were
identified.
Third, duplicate cases were also inspected because the online questionnaire could have
been entered and answered multiple times by a single respondent. Such potentially

41
problematic cases were examined by using the Identify Duplicate Cases -function in
SPSS. All 35 Likert-type items were entered into the analysis to check whether 100%
duplicates exist in the dataset. However, fully matching cases were not discovered.
Lastly, the negatively framed questionnaire items were examined and re-coded. The
first item belonged to the Social tie scale (I would not feel very upset if our relationship
were to end in the near future) while the other item measured the Quality of the eWOM
message (The review includes only one-sided comments). Both items were reverse
coded before proceeding with the analysis.
4.2. Descriptive statistics
After cleaning the dataset, the total sample size was 133. In addition to the Likert-type
items, some categorical data were also collected to outline the sample demographics.
The key characteristics of the sample are presented in table 7.
Table 7 Sample characteristics
Gender
Frequency Percentage
Male 39 29.3%
Female 94 70.7%
Age
Frequency Percentage
18 12 9.0%
19 26 19.5%
20 44 33.1%
21 33 24.8%
22 18 13.5%
Employment
Frequency Percentage
Full-time student 130 97.7%
Employed part-time 3 2.3%
Total (N) 133 100%
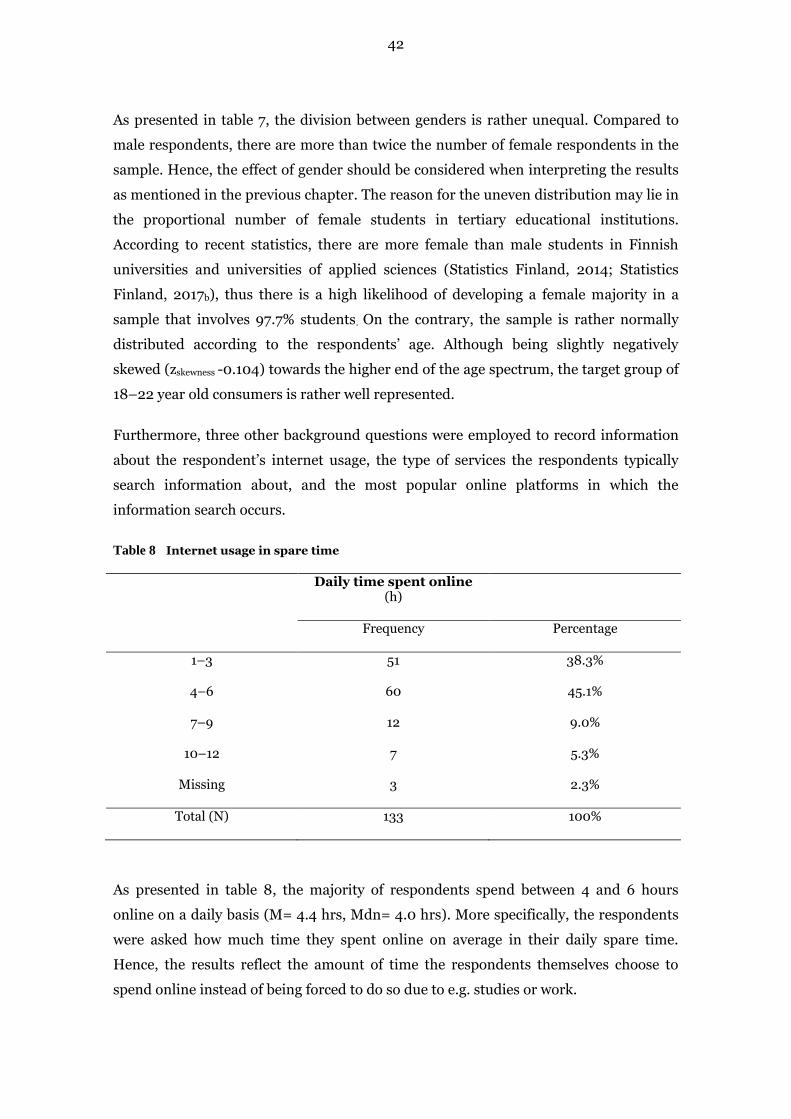
42
As presented in table 7, the division between genders is rather unequal. Compared to
male respondents, there are more than twice the number of female respondents in the
sample. Hence, the effect of gender should be considered when interpreting the results
as mentioned in the previous chapter. The reason for the uneven distribution may lie in
the proportional number of female students in tertiary educational institutions.
According to recent statistics, there are more female than male students in Finnish
universities and universities of applied sciences (Statistics Finland, 2014; Statistics
Finland, 2017b), thus there is a high likelihood of developing a female majority in a
sample that involves 97.7% students. On the contrary, the sample is rather normally
distributed according to the respondents’ age. Although being slightly negatively
skewed (zskewness -0.104) towards the higher end of the age spectrum, the target group of
18–22 year old consumers is rather well represented.
Furthermore, three other background questions were employed to record information
about the respondent’s internet usage, the type of services the respondents typically
search information about, and the most popular online platforms in which the
information search occurs.
Table 8 Internet usage in spare time
Daily time spent online
(h)
Frequency Percentage
1–3 51 38.3%
4–6 60 45.1%
7–9 12 9.0%
10–12 7 5.3%
Missing 3 2.3%
Total (N) 133 100%
As presented in table 8, the majority of respondents spend between 4 and 6 hours
online on a daily basis (M= 4.4 hrs, Mdn= 4.0 hrs). More specifically, the respondents
were asked how much time they spent online on average in their daily spare time.
Hence, the results reflect the amount of time the respondents themselves choose to
spend online instead of being forced to do so due to e.g. studies or work.

43
To highlight the range of services that are relevant in the young consumers life, the
respondents were asked to identify the type of service(s) they typically searched online
while looking for information. The most frequently mentioned services included leisure
items such as entertainment, food and restaurants, travel and accommodation, while
the likes of banking, public transport and housing were mentioned less than 10 times
each. Such miscellaneous services that received less than 10 mentions each were
labelled under ‘Other’. All of the mentioned services are presented by category in table
9.
Table 9 Frequency of online information search according to service category
Type of service
Frequency Percentage
Entertainment 65 30.8%
Food and restaurants 51 24.2%
Travel and accommodation 45 21.3%
Electronics and technology 13 6.2%
Health and beauty care 11 5.2%
Other (misc.) 26 12.3%
Total 211 100%
As follows, the respondents were also asked about the type of platforms in which their
information search usually occurs. In the questionnaire, the respondents were able to
choose one or more categories that represent the type of online platforms that
effectively enable consumer-to-consumer communication. Since there are various
online platforms that could potentially be relevant for the respondents, only the
broader categories were presented in the questionnaire to entail as many options as
possible. Moreover, the respondents were able to choose another option in which they
could fill in any platform they saw relevant.

44
Table 10 The most popular online platforms for searching information about services
Online platforms
Frequency Percentage
Review websites 86 64.7%
Social networking sites 85 63.9%
Discussion forums 52 39.1%
Other 18 13.5%
Based on the results in table 10, the most popular type of platforms for searching
information about services were review websites (e.g. TripAdvisor, Yelp) and social
networking sites (e.g. Facebook, Instagram, YouTube) that both gathered a nearly equal
proportion of users. This could be explained by the added credibility in review websites
and social networking sites in which users more typically post and discuss using their
own name and profile picture, while discussion forums may favour more anonymous
communication that entail only nicknames and avatars. The last category ‘Other’ was
chosen by 18 respondents who also provided a description of the type of platform they
used. The most frequently mentioned platforms were Google and search engines (N=7)
that allowed to read other consumer’s comments about a service by typing in the
service provider’s name and relevant keywords such as “kokemuksia” (experiences). In
addition, some mentioned the service provider’s own website or online store (N=5) in
which other customer’s comments and reviews may be displayed. Further mentions
were given to the online community Reddit (N=2), the anonymous mobile
communication platform Jodel (N=2) and blog portals (N=1). One respondent had also
argued that the choice of platform is dependent on the type of product or service.
4.3. Assessing the reliability of scales
Based on the theoretical framework presented in Chapter 2, the study employed six
independent variables and a single dependent variable that were measured by 35
Likert-type items in the questionnaire. To construct the variables for further analysis,
all of the 35 items were combined into individual composite measures i.e. averaged
total scores that serve as substitute variables (Hair et al., 2010: 124–125). Hence, seven
scales were created respectively: source credibility, source similarity, eWOM quality,
eWOM quantity, susceptibility to interpersonal influence, attitude towards eWOM

45
information and purchase intention. As outlined in the theoretical framework, the first
six scales relate to the various determinants of eWOM effectiveness while the last scale
reflects the receiver’s response to eWOM communication. Since the scales are based on
items adopted from previous research, they have been tested and validated at least
once, thus ensuring sufficient content validity. However, the reliability of the scales still
needs to be established through testing the scales’ internal consistency (Hair et al.,
2010: 125). For this purpose, the Cronbach’s alpha coefficient was calculated.
Table 11 Reliability of scales
Summated scale(1
Number of items
Mean Std. deviation Cronbach’s
alpha
Source credibility
4 5.12 .91 .69
Source similarity 10 2.50 .86 .86
eWOM quality 6 5.30 .90 .63
eWOM quantity 2 5.04 1.08 .51
Susceptibility to interpersonal
influence 6 4.22 1.02 .77
Attitude towards eWOM
information 4 4.98 1.02 .71
Purchase intention (eWOM
response)
3 4.93 1.01 .79
1) Measured on 7-point Likert-scale
As presented in table 11, the reliability of each scale varied significantly according to the
analysis. While source similarity, susceptibility to interpersonal influence, attitude
towards eWOM information and purchase intention scales exceeded the acceptable
critical value of .70 (Hair et al., 2010:125), the three other scales did not. According to
the widely accepted understanding, the result implies that the reliability of source
credibility, eWOM quality and eWOM quantity scales may be contested. Thus, the
aforementioned scales should be treated with caution for their internal consistency may
be of lower quality. However, it has been argued that even a lower limit of .60 is
acceptable for the Cronbach’s alpha coefficient (Hair et al., 2010: 125) thus implying
moderate reliability for source credibility and eWOM quality scales. Nonetheless, the

46
scale measuring eWOM quantity is considered to have extremely low internal
consistency (Cronbach’s alpha=.51) which may be partially explained by the small
number of items in the scale. In fact, the uneven reliability values among variables may
be explained by the varying number of items in each sub-scale, since Cronbach’s alpha
coefficient is very sensitive to both the number of items and the sample size (Hair et al.,
2010:124-126). Thus, increasing either the number of items or the sample size could
have remedied the problem and yielded a more balanced result.
When examining the Item-Total statistics in SPSS, the option of reducing items of a
single scale was also considered. Depending on the case, this procedure can improve
the Cronbach’s alpha coefficient by eliminating poorly correlated items from a total
scale with low reliability scores (Pallant, 2010: 97–100). However, further investigation
revealed that deleting items from the scales that scored low would not have improved
the scales’ reliability enough to exceed the critical value of .70, thus the original scales
were retained for further analysis.
4.4. Assessing statistical assumptions
Before proceeding to regression analysis, the composite variables (summated scales)
were entered into univariate analysis to examine the distribution, kurtosis, skewness
and potential outliers in the data. As a result of the statistical tests for normality, all of
the composite variables returned a p-value < .05 in Kolmogorov-Smirnov test thus
rejecting the null hypotheses of normality. On the other hand, only three composite
variables (Source similarity, eWOM quality, eWOM quantity) returned a p-value < .05
in Shapiro-Wilk test, thus providing mixed results regarding the normality of the
variables. In literature, it is noted that even though both statistical tests are commonly
used to evaluate normal distribution (Hair et al., 2010: 73–74: Pallant, 2010: 63), they
might yield different results within the same sample. Hence, other indicators of
normality should also be assessed.
When examining the skewness and kurtosis values of the composite variables, it was
noted that all values were within an acceptable range of -.56 and .19 except for the
source similarity variable that was more positively skewed (S=1.02) and had a
significantly higher peak (K=2.00) than the other variables. According to Hair et al.
(2010: 72–73) the suggested limit for both values is ±1.96 (.05 significance level), thus
a slight deviation from normality may exist based on these numbers.

47
However, according to Hair et al. (2010: 72–74) and Field (2009: 345), both statistical
tests and graphical plots should be used to estimate whether severe deviations from
normality occur since it is the shape of the distribution that may reveal underlying
problems. Furthermore, Pallant (2010:59–65) argues that none of the aforementioned
criteria should be employed alone but they should be evaluated together to form an
overview and better understand whether the distribution of data is problematic. Hence,
the visual data of the histograms, normal quantile-quantile plots and boxplots were
assessed. All histograms showed a distribution that followed a bell-shaped curve
reasonably well, while the data on the normal plots followed a fairly straight line. From
the boxplots it could be seen that all variables except the receiver attitude towards
eWOM information had one outlier within the data while the source similarity variable
had also a single data point with an extreme value. However, the effect of the outliers
was found negligible when the values between the variable mean and 5% trimmed
mean (Pallant, 2010:62–63) were contrasted. The largest difference between the two
values was .04 hence the outliers are not likely to have a significant influence on the
mean.
To conclude, lack of normality is a more pressing issue in smaller samples (N<50)
while its effects are disputable in reasonably large samples (Hair et al., 2010: 72). This
view is also supported by Field (2010: 45), who argues that in larger samples (N>30)
the sampling distribution can be taken as normal based on the central limit theorem.
Considering the sample size (N=133) and the abovementioned evidence, the data are
deemed approximately normally distributed.
4.5. Correlation analysis
To examine the relationships between the composite variables, a correlation analysis
was used. More specifically, Pearson correlation coefficient was applied to quantify and
describe the linear relationships since it is the most suitable measure for studying the
interval data at hand (Pallant, 2010:128). Here, the correlation coefficient (r) implies
the strength and the direction of association among metric variables on a range from 0
to ±1 (Hair et al., 2010: 156-157). Since all of the independent variables were expected
to have a positive relationship with the dependent variable according to hypotheses, a
one-tailed test was seen appropriate.
According to Pallant (2010: 134, 157–158), at least a moderate association (r>.30)
between the predictors and the response variable is deemed ideal to conduct multiple

48
regression analysis. However, an overly strong association (r>.70) between the
independent variables could result in undesirable multicollinearity issues in the final
model (Pallant, 2010: 134, 157–158). The results of the correlation analysis are
presented in table 12.
Table 12 Correlations among variables (Pearson’s r)
Source
credibility Source
similarity eWOM quality
eWOM quantity
Susceptibility to
interpersonal influence
Attitude towards eWOM
information
Purchase intention
Source credibility
1
Source similarity
.228*** 1
eWOM quality
.421*** .098 1
eWOM quantity
.208*** .211*** .125* 1
Susceptibility to
interpersonal influence
.167** .308*** .303*** .216*** 1
Attitude towards eWOM
information
.159** .182** .245*** .319*** .162** 1
Purchase intention
.108 .270*** .277*** .327*** .284*** .452*** 1
Note: N=133, ***p<.01, **p<.05, *p<.10 (one-tailed) From the index we can see that the strength of the correlations vary from small to
medium (Pallant, 2010: 134) while all of the relationships are also positive. While the
correlations were statistically significant (p<.05) among almost every variable, the
source credibility variable (predictor) was not significantly correlated with the purchase
intention variable (response). With its overall low score (r=.108, p=.109), source
credibility suggests only 1.2% shared variance with purchase intention thus making it
the weakest predictor of the group. On the other hand, source credibility is moderately
correlated with another predictor, eWOM quality (r=.421, shared variance 17.7%),
which suggests that the two constructs are connected – the higher the quality of the
message, the higher the communicator’s credibility. However, no preliminary signs of
multicollinearity were identified between the two variables according to the correlation

49
coefficient criteria (r<.70). Nonetheless, since the following regression model is not
restricted to choosing only one independent variable, the lowest scoring variable
(source credibility) is not dropped from analysis but instead it is included to examine
the combined effect of the assumed predictors.
4.6. Regression analysis
To examine the relationships between the determinants of eWOM effectiveness and
purchase intention, hierarchical multiple regression analysis was applied to study the
predictors’ main effects and interaction effects. This dependence technique was
specifically chosen since it describes and quantifies the strength of linear relationships
between many independent (predictor) variables and one dependent (response)
variable, while it also allows an assessment of the independent variables’ relative
importance and predictive power (Hair et al., 2010: 161–162).
As presented in the literature review, the division between independent and dependent
variables is based on theoretical considerations and empirical findings that emerge
from previous research. While the response variable is defined as purchase intention,
the predictors include the following scales: (1) source credibility, (2) source similarity,
(3) eWOM quality, (4) eWOM quantity, (5) attitude towards eWOM information and
(6) susceptibility to interpersonal influence. Out of these, the last two variables were
also hypothesized to moderate the relationships between the other four predictors and
the response variable. For this reason, the main predictors, the moderators and the
interaction terms were added to the model in a hierarchical manner. This approach
allowed for a comparison between the models and their relative contribution to
predicting the outcome.
Drawing from the original research questions, the purpose of the regression analysis
was to describe the relationships between the determinants of eWOM effectiveness
(RQ1) and eWOM response, and study the extent to which these determinants can
predict the eWOM response (RQ2). Furthermore, adding the moderator effect into the
analysis allows an examination of the effects of the receiver’s characteristics (RQ3). To
summarize, the following questions are answered by the analysis:
1) What kind of associations exist between the predictors and the eWOM response?
2) How much variance in eWOM response is accounted by the predictors?

50
3) Among the given set of variables, which is the best predictor of eWOM response?
4) Are the relationships between the predictors and the response significantly affected
by the assumed moderators?
Regarding the generalizability of the results, the ratio between the number of cases and
the number of independent variables should also be considered when multiple
regression analysis is conducted. As argued by Pallant (2010: 150), different authors
provide researchers with varying guidelines about sample size requirements. While
some have suggested a minimum of 15 cases per predictor, others have proposed a
different formula for calculating the optimal ratio of cases vs. predictors. For instance,
the minimum sample size N could be estimated by N > 50 + 8m, in which m is the
number of independent variables (Pallant, 2010: 150). With all of the six predictors
included, the first approach would imply a minimum sample size of 90 respondents
while the second formula would suggest a sample larger than 98 respondents. In
addition, Hair et al. (2010: 175–176) propose a minimum sample size of 100 for most
research contexts while a ratio of 20 observations per variable is argued to be desirable.
Based on these principles, the minimum sample size would be approximately 120 cases.
Therefore, the total sample size (N=133) is deemed sufficient for conducting multiple
regression analysis with the intended six independent variables. However, it is noted
that the sample may be undersized for a regression model with all the main predictors
(6 variables) and interaction terms (8 variables) included. That said, an ideal sample
size would be closer to 200 cases according to guidelines.
Before entering into regression analysis, all of the variables were centred without fully
standardizing them. As advised by Field (2009: 740–741), the mean was subtracted
from the raw data to set the mean of each scale to zero. This procedure was conducted
to reduce potential collinearity issues and improve the interpretation of the regression
coefficients when both the interaction and main effects are present (Jaccard et al.,
1990).
4.6.1. Testing the assumptions for multiple regression analysis
Since the regression analysis was conducted in a hierarchical manner, four models were
created to estimate each model’s relative contribution to predicting the eWOM
response (purchase intention). More specifically, the analysis was conducted in the
following sequence. Model 1 included the four main independent variables, namely
51
source credibility (IV1), source similarity (IV2), eWOM quality (IV3) and eWOM
quantity (IV4). In Model 2, attitude towards eWOM information (IV5) was added to
examine its direct effect before analysing its hypothesized moderation effect. In model
3 the second hypothesized moderator, susceptibility to interpersonal influence (IV6),
was included. Lastly, all interaction terms were added to model 4 that involved 14
independent variables in total. This model entailed the four main predictors (IV1–IV4),
the two moderators (IV5 and IV6) and eight interaction terms. As advised by Hair et al.
(2010: 180–181), the interaction terms were aggregated as a product of the predictor X1
and the assumed moderator X2. Hence, each of the main predictors (IV1–IV4) was
multiplied by attitude towards eWOM information (IV5) and susceptibility to
interpersonal influence (IV6).
Before examining the goodness of fit and model accuracy, the assumptions for multiple
regression analysis were assessed. First, the multicollinearity diagnostics in SPSS were
observed but they did not show any problematic correlations among independent
variables in any of the four models. Both Tolerance and VIF values were clean and
within the critical limits (TOL > .10, VIF < 10) (Pallant, 2010: 157–160). Hence, the
original interpretation of the correlation analysis was supported and all predictors were
deemed sufficiently independent of each other. Second, the normal probability plot of
regression standardized residual showed data points that were approximately following
the diagonal line, while the points in the scatterplot were arranged around the zero line
in the shape of a random cloud. Similarly, the distribution on histogram followed a bell
shaped curve as expected. Thus, no severe deviations from normality, linearity or
homoscedasticity were observed based on the visual analysis of the charts (Hair et al.,
2010: 220–221; Pallant, 2010: 157–160). Third, the regression residuals, i.e. the
observed values subtracted from the predicted values, were further analysed by plotting
each independent variable against the standardized residuals. Although some partial
regression plots were better defined than the others, none of them showed systematic
pattern or curvature that would imply a deviation from linearity (Hair et al., 2010: 221-
222).
Based on the results from data screening, the potentially outlying cases were not
considered an issue (see Chapter 4.4). To ensure that the regression model was not
significantly affected by outliers, the standardized regression residuals on the
scatterplot were yet again examined. The chart revealed only few possible outliers that,
however, were not removed from the dataset because all cases were found to be within
52
the intended range (1–7 on a Likert-scale). Hence, the outliers represented real values
on the higher end of the scale as deduced previously. Furthermore, none of the
potentially outlying data points exceeded a standardised residual of ±3.3 that is used as
the critical limit for defining influential outliers (Pallant 2010: 159).
To conclude, all the main assumptions for regression analysis were met according to
the aforementioned evidence. In other words, no sign of violating normality, linearity
or homoscedasticity was identified.
4.6.2. Assessing the regression models
In model 1, the coefficient of determination R square returned a value of .209 (p<.01)
while the value of adjusted R square was only slightly lower at .184. Out of the four
predictors, all but one made a statistically significant unique contribution to predicting
purchase intention. Both eWOM quality (Beta=.269) and quantity (Beta=.271) were
highly significant to the model (p<.01) while source similarity (Beta=.212) was also
significant on a lower level (p<.05) However, it turned out that source credibility
(Beta=-.111) was not significant even at the lowest significance threshold of p < .10.
Compared to the first block of predictors, model 2 had an R square of .331 (p<.01) thus
making the increase (ΔR2=.122, p<.01) highly significant. Although R square increases
every time a new predictor is added, the results reveal that including attitude towards
eWOM information (Beta=.313, p<.01) actually made a significant unique contribution
although the interaction variables did not. However, it was noted that two of the
interaction variables (IV1: source credibility x IV5: attitude towards eWOM
information and IV3: eWOM quality x IV5: attitude towards eWOM information)
made a unique contribution to predicting the response on the lowest significance
threshold of p < .10, but the effects were deemed negligible since the desired
significance level for the study had been set to p < .05. Thus, only the direct
relationships were found to be significant instead of the hypothesized moderator
relationships between the predictors and the response. The findings were supported by
the comparative measure of adjusted R square, in which the increment (Adjusted
ΔR2=.098) was also evident. Therefore, the overall model accuracy was improved from
model 1 despite the alternative combinations of variables.
In model 3, the second hypothesized moderator, susceptibility to interpersonal
influence, and the related interaction terms were included respectively thus yielding an
53
R square of .246 (p<.01). However, neither the new predictor nor the interaction terms
made a significant unique contribution to the model which made the increment
(ΔR2=.038) clearly smaller compared to the first two models. This conclusion was also
supported by the relatively small increase in adjusted R square (Adjusted ΔR2=.007)
that provides a comparative measure for models 1 and 3 that each have a different
amount of variables. Therefore, the model accuracy was not significantly improved by
adding the sixth variable and its interaction terms.
Lastly, all predictors (IV1: source credibility, IV2: source similarity, IV3: eWOM
quality, IV4: eWOM quantity, IV5: attitude towards eWOM information, IV6:
susceptibility to interpersonal influence) and all of the eight interaction terms were
included in model 4 (R2=.358, p<.01) – i.e. the full model. Yet again, the increase in R
square was rather small in magnitude (ΔR2=.027) when compared to model 2 and the
total amount of variables added. Moreover, the difference between R square (.358) and
adjusted R square (.281) was greater in model 4 thus increasing the gap from .49 to .77
when compared with model 2. In other words, the proportional change in the
explanatory power of the model was not significant compared to model 2, while none of
the interaction terms had made a significant unique contribution either. The full model
was deemed redundant because it did not add any value to the analysis above the first
three models.
4.6.3. Results
The overall results from the regression analysis and the first three models are
summarized in table 13. However, as explained above, the fourth model was not
reported in the table because the interaction terms were not found statistically
significant. Thus, adding the last model to the results table would not have increased
the informativeness of the report.

54
Table 13 Results of hierarchical regression analysis for predicting purchase intention
Variables
Model 1: Std. Beta
coefficients (t-values)
TOL
Model 2: Std. Beta
coefficients (t-values)
TOL
Model 3: Std. Beta
coefficients (t-values)
TOL
Direct effects
IV1: Source credibility
-.111 (-1.237) .773 -.101 (-1.191) .761 -.140 (-1.515) .718
IV2: Source similarity
.212 (2.583)** .920 .201 (2.557)** .880 .164 (1.829)* .759
IV3: eWOM quality
.269 (3.098)*** .821 .194 (2.303)** .765 .238 (2.620)** .740
IV4: eWOM quantity
.271 (3.323)*** .927 .191 (3.375)** .844 .274 (3.305)*** .889
IV5: Attitude
towards eWOM
information
.313 (3.776)*** .794
IV1 x IV5 -.173 (-1.870)* .638 IV2 x IV5 -.057 (-.687) .797 IV3 x IV5 .152 (1.670)* .660 IV4 x IV5 .065 (.818) .869
IV6:
Susceptibility to
interpersonal influence
.135 (1.489) .740
IV1 x IV6 -.100 (-1.083) .720 IV2 x IV6 .074 (.849) .815 IV3 x IV6 -.042 (-.455) .734 IV4 x IV6 -.081 (-.916) .788
F 8.433*** 6.759*** 4.463*** R2 .209 .331 .246
ΔR2 .209 .122*** .038 Adjusted R2 .184 .282 .191
Note: N=133, ***p<.01, **p<.05, *p<.10 TOL = Tolerance
Although the explained variance in purchase intention was highest in model 4, the
result has to be reflected against the alternative combinations of variables to facilitate
meaningful comparison. As discussed previously, the only significant leap from the
explanatory power of model 1 was achieved in model 2 (ΔR2=.122, Adjusted ΔR2=.098)
in which the fifth predictor (IV5: attitude towards eWOM information) was added
along with the interaction terms. On the contrary, the overall comparison implied a
lower fit for models 3 and 4 in which the gap between R square and adjusted R square
increased more than the total increment in the models’ explanatory power. In fact, the
adjusted R square was roughly the same in models 2 and 4, because neither the second
hypothesized moderator (IV6: susceptibility to interpersonal influence) nor the

55
interaction terms were statistically significant in the last full model. Hence, the
inclusion of the fifth predictor alone made a relatively stronger contribution in model 2
than the other additional predictors together in models 3 and 4. As a result, it can be
inferred that the goodness-of-fit in model 2 (R2=.331, p<.01) is relatively the highest of
all models which implies that approximately 33% of the variance in the predicted
behaviour is explained by this particular model.
As always, the results of any study should also be reflected against the specific research
context. Predicting human behaviour differs significantly from mathematical and
natural sciences in which high precision in prediction is typically more attainable. On
the contrary, when human behaviour and social interactions are involved, even models
with lower prediction accuracy are more than acceptable. Therefore, similarly
conducted studies may provide an appropriate point of comparison for the output of
this research. Given the results of the regression analysis, model 2 yielded a fairly
moderate R square of .331 which is, in fact, quite well in line with some other studies of
the same field. Although the results cannot be directly compared, they provide some
direction of the outcome that other researchers have achieved in eWOM effectiveness
studies by using the same kind of statistical technique. For instance, Racherla and
Friske (2012) analysed the usefulness of consumer reviews by applying multiple
regression analysis (R2=.29) while Fan and Miao studied the adoption of eWOM
information (2013) and its effect on purchase intention (2012) by constructing several
regression models where the R squared landed within a range of .35 < R2 < .58. Hence,
the model created for this study is placed along the “mid-range” in terms of its
predicting accuracy when compared with the aforementioned studies.
Beyond the statistical significance and the goodness-of-fit, the substantive significance
of model 2 can also be estimated by the complementary measures of effect size and
statistical power (Cohen, 1988; Selya et al., 2012). Here, the first measure indicates the
magnitude of the effect while the latter presents the likelihood of making significant
findings in the data if they exist. According to Cohen’s guidelines (1988), the effect size
can be calculated for regression as follows: 𝑓2 =𝑅2
1−𝑅2. Hence, model 2 reaches a
moderate effect size (f2=.49) with an R squared of .331. Furthermore, the model’s
statistical power reaches a high level of .99, thus there is a high probability of
recognizing the effect if it exists in the data.

56
To examine the individual contribution of the predictors, the Beta coefficients that
made a significant unique contribution to predicting purchase intention were compared
in model 2. As presented in table 13, all five main predictors were positively associated
with purchase intention except for source credibility which had a negative association
with the response variable. As presumed from the results of the correlation analysis,
source credibility did not make a strong unique contribution either (Beta=-.111,
p=.203). Therefore, H1. was not supported. Among all predictors, the most significant
unique contribution was made by the receiver’s attitude towards eWOM information
(Beta=.313, p=.000). The second best unique contribution was made by source
similarity (Beta=.201, p=.012), while eWOM quality (Beta=.194, p=.023) and eWOM
quantity (Beta=.191, p=.019) were ranked third and fourth according to their unique
contribution in the model. Thus, H2., H3. and H4. were all supported. The results
imply that the receiver’s personal stance towards other consumers’ reviews, statements
and recommendations is in a key role in determining the strength of purchase
intention. In fact, attitude towards eWOM information predicts the outcome over 1.5
times more than eWOM quantity. From the relationship between source similarity and
purchase intention, it can be interpreted that the likelihood of purchase is significantly
influenced by the closeness of the relationship between the communicator and the
receiver, and their similarity in taste, lifestyle and interests. Finally, the results indicate
that the likelihood of purchase is positively affected by higher quality of argumentation
and message content online, while the higher volume of eWOM information also has a
similar effect.
Overall, since the analysis provided statistically significant results for examining the
relationships between the determinants of eWOM effectiveness and the eWOM
response, the main goals of the study were met. However, not all of the hypothesized
relationships were found to be significant. Based on the results of statistical analysis,
both H1. and H6. were rejected while the following hypotheses H2.–H4. were
supported. Due to slightly weaker statistical evidence, H5. was only partially
supported. All original hypotheses and the subsequent results of the statistical analysis
are presented in table 14.

57
Table 14 Findings from the empirical research
Hypothesis Result
H1. Credibility of the eWOM communicator is positively associated with
purchase intention. Not supported
H2. Source similarity is positively associated with purchase intention Supported
H3. eWOM quality is positively associated with purchase intention. Supported
H4. eWOM quantity is positively associated with purchase intention. Supported
H5. As the receiver’s attitude towards eWOM information increases, the
relationship between eWOM communicator variables, eWOM stimuli
variables and purchase intention increases.
Partially supported
H6. As the receiver’s susceptibility to interpersonal influence increases,
the relationship between eWOM communicator variables, eWOM
stimuli variables and purchase intention increases.
Not supported
As outlined in table 14, the hypothesized moderator relationships were not supported
by the empirical findings. In models 2 and 3, the interaction terms were included in the
analysis but none of them made a truly significant unique contribution. Even though
two of the interaction terms (IV1: source credibility x IV5: attitude towards eWOM
information and IV3: eWOM quality x IV5: attitude towards eWOM information) in
model 2 made a small unique contribution (Beta=-.173, p=.064 and Beta=.152, p=.098)
on the lowest significance threshold (p<.10), the empirical evidence provides only
partial if any support to hypothesis H5. Due to these small interaction effects, statistical
evidence for the moderator relationships was neither provided by the final model 4
which combined a total of 14 variables including the interaction terms. The reasons for
such a result are manifold. Testing moderation with such many variables can be
challenging, hence the result may indicate a problem of overfitting the model in which
the differences between variables are no longer detected. Nonetheless, the model
involved only those relationships that were justified by underlying theory which leaves
room for further discussion and post hoc -analysis regarding the potentially latent
relationships in between variables. Given the scope of the research, however, such
analyses are not included in this report.
58
5 DISCUSSION
In this chapter, the results and implications of the research are discussed. First, the key
findings of the empirical study are presented. Second, the results are reviewed from
both theoretical and managerial perspectives. Lastly, the final conclusions of the study
are summarized after discussing the limitations of the study and the opportunities for
future research.
5.1. Key findings
In order to close the loop and conclude the study in an iterative manner, the final result
should always be connected with the starting point of the research. Therefore, the key
findings of this study are reflected against the findings from extant literature and the
research questions that were presented alongside with the research problem. Moreover,
the findings are explained through a revised theoretical framework that bridges theory
and empirical evidence by illustrating the discovered relationships between the
conceptual constructs.
5.1.1. Relations between eWOM effectiveness factors and purchase intent
Although past research has provided a vast base of knowledge and empirical evidence
about the impact of eWOM on consumer behaviour (e.g. Park et al., 2007; Sweeney et
al., 2008; Cheung & Thadani, 2012), the influence mechanism of the said consumer-to-
consumer communication keeps intriguing researchers even today (e.g. Erkan & Evans,
2016; Djafarova & Rushworth, 2017). Continuing this tradition and building on the
findings of extant eWOM literature, a theoretical framework originally proposed by
Cheung & Thadani (2012) was adapted and tested empirically in a new demographical
context to answer the research questions of this study. Hence, the study further
strengthens our current understanding of the relationship between eWOM and
consumer purchase intention while focusing on the determinants of eWOM
effectiveness.
The first research question was specifically aimed to describe the relationships between
the determinants of eWOM effectiveness and the eWOM response. In this case, the
determinants of eWOM effectiveness were classified into four main predictors, namely
source credibility, source similarity, eWOM quality, eWOM quantity, and two
moderators defined as receiver’s attitude and susceptibility to interpersonal influence.

59
Furthermore, the eWOM response was defined as purchase intention of Generation Z
consumers. According to findings, the relationships between the determinants and the
response were mainly direct and positive except for source credibility which was
negatively associated with purchase intention. This implies that source credibility
contributes significantly less to predicting purchase intention than the other
determinants involved in this study. However, despite this result, only four
relationships between the aforementioned determinants and purchase intention were
statistically significant. In fact, only receiver’s attitude towards eWOM information,
source similarity, eWOM quality and eWOM quantity made a significant unique
contribution to predicting the respondents’ eWOM intention. Regarding the indirect
relationships that were hypothesized to exist between the two moderators and the four
main predictors, only weak statistical evidence was found.
5.1.2. Significance of eWOM effectiveness factors to purchase intent
The second research question aimed to identify the determinants of eWOM
effectiveness that are relatively the most important in determining the strength of
purchase intention. In other words, the goal was to rank the determinants according to
their individual contribution in the regression model. Even though the model itself was
found significant, some of the regression coefficients did not make a significant
contribution to predicting the response variable. Thus, the hypotheses were only
partially supported. Given these empirical results, some of the findings are in line with
previous research while some of them are not.
Firstly, the results of the regression analysis indicated that the most important
determinant out of the six alternatives was in fact receiver’s attitude towards eWOM
information. Thus, the receiver’s thoughts and feelings about the relevance and
usefulness of review information are emphasized in the overall results due to the large
proportional contribution of the attitude variable. The second most important factor
proved to be source similarity which shifts attention from the receiver towards the
communicator. More specifically, attention is drawn to the characteristics of the
relationship between the two actors – their interpersonal closeness and similarity
which increases consumer purchase intention. On the one hand, the significance of
source similarity has been acknowledged rather well in studies related to conventional
WOM (Brown & Reingen, 1987; Sweeney et al., 2008), but on the other hand, its role
has not been as clear in the context of eWOM communication. The reason for this lies

60
mainly in the differences between offline and online communication: it is usually easier
to assess the similarity of the communicator in a live situation whereas it might be
impossible to find cues about source similarity on the internet (Cheung & Thadani,
2012). Therefore, its relevance for digital conversations could be questioned. However,
as presented in the findings of this study, source similarity does play a role in eWOM as
well.
By looking at extant studies on the impact of eWOM, a similar finding was made by
Rosario et al. (2016) who argued that source homophily influences the effectiveness of
eWOM stronger than source trustworthiness. Similarly, Chu and Kim (2011) found that
tie strength – another dimension of source similarity, was positively associated with
consumers’ overall eWOM behaviour. Along with the same school of thought, Sweeney
et al. (2014) discovered that homophily between the receiver and the sender enhanced
the influence of eWOM message although positive eWOM was less dependent on other
conditional factors than negative eWOM. In addition, the findings of this study also
complement the work of Djafarova and Rushworth (2017), who concluded that lower
scale influencers, such as bloggers and other social media personalities, are more
powerful than traditional celebrities in influencing the buying decision of young
females (18–30 years old). In fact, in their study about the credibility of online
influencers, lower scale influencers were perceived to be more credible and relevant
because the respondents could better relate to them (Djafarova & Rushworth, 2017).
Thus, it can be concluded that the ability to identify with the information source has a
significant role in determining the effect of eWOM among Generation Z consumers.
The third and the fourth most important factors, eWOM quality and eWOM quantity,
were both related to the stimuli i.e. message characteristics. Although both factors were
almost equally important according to statistics, profound, clear and objective
argumentation was ranked slightly more significant than the amount of such
information. Therefore, the results emphasize quality over quantity in terms of eWOM
content and its influence on consumer purchase intention. This, however, is not
completely in line with findings from previous research. The importance of eWOM
quantity was pointed out by Rosario et al. (2016), who found the positive volume of
information to be the most significant determinant of eWOM effectiveness for service
products. Here, the authors stated that the bandwagon effect best explains the
dynamics of such communication effectiveness, which, nonetheless, was not evident in
the results of this study. As stated previously, eWOM quantity made a smaller

61
contribution in predicting purchase intention than eWOM quality and, in fact, it was
the least significant contributor of the four key determinants of eWOM effectiveness
found in this study. This indicates that Generation Z consumers are less affected by the
volume of online information than the other factors involved, which could be explained
by the fact that they have grown in a data-rich environment where online information
has always been abundant. Thus, the weight of other factors than volume is greater
when separating relevant and influential information from the rest.
Nonetheless, the contribution of the remaining factors was still far behind the effect of
eWOM quantity. In fact, the least important determinants of eWOM effectiveness were
source credibility and receiver’s susceptibility to interpersonal influence that did not
make a statistically significant unique contribution to purchase intention. As credibility
has been found to be among the key factors that predict consumer activity online
(Cheung et al., 2009; Fan et al., 2013), the conclusions of this study are somewhat
controversial. For example, the finding about the low significance of source credibility
is in conflict with the study by Racherla and Friske (2012), who discovered that the
usefulness of online reviews is enhanced by the reviewers’ high expertise and high
reputation – both of which represent the dimensions of source credibility. However, it
has been argued that source credibility is not only build upon the communicator
characteristics, but also on the quality of the argument and strength of persuasion
(Djafarova & Rushworth, 2017). Thus, the interplay among the message and
communicator characteristics is emphasized in providing cues about source credibility
online. This could also explain the result of this study since quality of eWOM was
operationalized as a separate variable from source credibility. If source credibility and
eWOM quality were not distinctive enough conceptually but rather different
dimensions of the same effectiveness factor, it would make more sense why the former
variable did not make a significant unique contribution to predicting purchase
intention, but the latter did.
Considering this surprising outcome and the possibility that source credibility was in
fact outweighed by other predictors, the first suspect would typically be collinearity
between variables. However, the multicollinearity diagnostics in SPSS did not show
alarming signals which suggests that the two factors were in fact independent, not
adjacent. Moreover, the correlations between all independent variables were below the
critical threshold of r < .70 (Pallant, 2010: 157–158). Nonetheless, we should consider
this scenario since correlations among independent variables can affect the explanation

62
of regression results even at lower thresholds when their mutual correlation is greater
than their individual correlation with the dependent variable (Hair et al. 2010: 203–
204). Thus, the unexpectedly reversed and nonsignificant relationship between source
credibility and purchase intention is perhaps influenced by the relatively high
correlation (r=.421, 17.7% shared variance) between source credibility and eWOM
quality which is higher than either predictor’s correlation with the response variable
(r=.108 and r=.277). Therefore, it is concluded that the importance of source credibility
is relative of the other predictors included in the model and the result can be
interpreted only in the context of this study (Hair et al., 2010: 199–200). In fact, if
source credibility had been studied in isolation of the other variables, the result might
have been different or even close to extant studies that have employed a different set of
variables. The findings of this study do not imply that neither source credibility nor
receiver’s susceptibility to interpersonal influence matter at all. Instead, the results can
be interpreted in such a way that the influence of eWOM is better explained by the
other factors involved in this specific model.
5.1.3. Impact of receiver characteristics on eWOM effectiveness
The third research question aimed to find out whether the characteristics of the
receiver influence the remaining determinants of eWOM effectiveness. Thus, the
hypotheses (H5. and H6.) about moderating relationships between the variables was
tested. The results of the regression analysis, however, indicate that the chosen
measures of receiver characteristics, attitude towards eWOM information and
susceptibility to interpersonal influence, do not significantly moderate the other
determinants except for source credibility and eWOM quality that were both influenced
by the receiver’s attitude to some extent. More specifically, the negative relationship
between source credibility and purchase intention increased while the positive
relationship between eWOM quality and purchase intention decreased. Since the
statistical evidence was not unanimous about the moderation effect, the influence of
receiver characteristics on source and message characteristics is rather negligible and
should be studied further.
Nonetheless, the findings do indicate that the receiver’s attitude towards eWOM
information is single-handedly the most significant determinant out of the six
effectiveness determinants involved in the study. Therefore, the receiver’s
characteristics play an important role in defining the influence of eWOM exposure and

63
the following behavioural reaction, but not in the way that was originally hypothesized.
In fact, the relationship between the receiver’s attitude and purchase intention proved
to be direct not a moderating one. Given this result, the findings are in line with the
study by Erkan and Evans (2016) who also discovered a significant, positive
relationship between attitude and purchase intention in their study about the influence
of eWOM. On the contrary, the receiver’s susceptibility to interpersonal influence was
not found to be among the determinants of eWOM effectiveness although extant
research (Chu & Kim, 2011) has found a statistically significant linkage between
consumers’ susceptibility to interpersonal influence and their engagement in eWOM
behaviour, such as opinion seeking. Therefore, the findings of this study indicate that
Generation Z consumers’ confidence in buying is driven more by the receiver’s personal
stance and own assessment of the helpfulness of information than his or her need of
social acceptance, belongingness and conformity to external information. Thus it can be
interpreted that the influence of eWOM is not as much based on their dependence on
other consumers’ opinions but more on their positive perception of such opinions as a
useful source of information.
5.1.4. Revised framework
The theoretical framework of this study involved six hypothesized determinants of
eWOM effectiveness that were regressed on a purchase intention variable. As expected,
the empirical analysis revealed that the influence of eWOM is based on both the
characteristics of the communicator, the stimuli and the receiver that each have
different subsets of variables. Therefore, the results illustrate the underlying logic of
social communication in which the communication process is explained by the
interplay among these three dimensions and the response. This principle is similarly
represented in the early works of Carl Hovland (1948, as cited by Cheung & Thadani,
2012) that summarized social communication as the function of “who says what to
whom and with what effect” (Cheung & Thadani, 2012: 463; Racherla & Friske, 2012:
551).

64
Figure 3 Revised empirical framework for studying the impact of eWOM on consumer purchase intention. (Adapted from Cheung & Thadani, 2012)
However, as a result of the empirical research, the framework of the study was slightly
revised (Figure 3). The main differences with the original framework were related to
the hypothetical relationship between source credibility and purchase intention (H1.)
and the moderating effect of receiver’s susceptibility to interpersonal influence (H6.)
that both proved to be less significant than expected. Therefore, susceptibility to
interpersonal influence was removed from the illustration as it did not increase the
informativeness of the model. On the contrary, source credibility remained in the
model because of its moderator relationship with receiver’s attitude towards eWOM
information. Another change to the original framework was done when the receiver’s
attitude towards eWOM information turned out to have a significant direct relationship
with purchase intention. Thus, the hypothesized moderator (H5.) became the most
significant main predictor of eWOM response.
5.2. Theoretical contributions
Based on the aforementioned key findings, this study contributes to the existing
literature of eWOM effectiveness in three different ways. First, the study advances our
understanding of eWOM effectiveness factors in a holistic manner. Instead of focusing
solely on a single dimension of eWOM communication, the complementary dimensions
eWOM stimuli
eWOM communicator
-.101
.201**
.194**
. .191**
.
.330***
.
eWOM receiver
R2=.331***
Note: N=133, ***p<.01, **p<.05, *p<.10
.152*
-.173*
eWOM response
Source credibility
Source similarity
Purchase intention: Gen Z consumers in a service
context
eWOM quality
eWOM quantity
Attitude towards eWOM
information
Direct effect
Moderating effect

65
of both communicator, receiver and stimuli characteristics are integrated to understand
their impact on consumer behaviour as a whole. By exploring empirically all of the
dimensions, the study is among the first to develop current knowledge towards a more
comprehensive understanding as requested by Cheung & Thadani (2012). The strength
of this approach is its ability to evaluate the joint contribution of various determinants
of eWOM effectiveness as well as the determinants’ interrelationships and their relative
contribution to eWOM outcomes. Based on the findings, it is concluded that the
statistical differences between the studied determinants of eWOM effectiveness were
rather small, except for receiver attitude towards eWOM information which stood out
as the most significant predictor in the regression model. Hence, the importance of
receiver characteristics should not be neglected when examining the influence of
eWOM. However, the final outcome is hardly explained by any single factor, thus it is
essential to consider eWOM effectiveness as a complex interplay of many factors that
may vary in their relative weight depending on the context.
Second, the study incorporates the perspective of Generation Z consumers – an
emerging consumer group that has not been studied extensively in the context of
eWOM effectiveness. Contrary to their predecessors, Generation Z represents the first
generational cohort that has been born and raised during the digital age which makes
them a relevant subject for studies. After all, they have had a constant access to online
information sources unlike the older generations who have experienced eWOM only at
a later stage. The internet, social media and apps being an essential part of their life,
eWOM is likely to remain an important information source among Generation Z in the
future as well. Thus, this study offers researchers a way to better understand how this
online information exchange affects their purchase behaviour.
Third, the results of the empirical study show source credibility in a different light than
before. In fact, the impact of source credibility on consumer purchase intention was
significantly lower than the other factors employed in this study although it has been
conventionally identified as a strong antecedent of eWOM influence. Given the
surprisingly low significance of source credibility and its inverse relationship to
consumer purchase intention, this study encourages researchers to further explore
source credibility dimensions to better understand its role in eWOM context and the
reason behind its unexpectedly negative association. As noted previously, the
importance of source credibility is relative of the other predictors included in the model
(Hair et al., 2010: 199–200) and the result does not imply that source credibility per se

66
would be insignificant. Instead, a more meaningful interpretation would be that the
dimensions of source credibility (i.e. expertise and trustworthiness) are more
frequently assessed by the quality of the content (i.e. argumentation and sidedness) as
pointed out by Djafarova and Rushworth (2017). On the one hand, this is explained by
the distinct characteristics of eWOM communication in which anonymity between
participants is rather common (Cheung & Thadani, 2012), thus the receiver has to look
for other cues of credibility when the source is unknown to the receiver. On the other
hand, in a situation where identity cues about the source are available or the source is
personally known to the receiver, relatability plays an important role in determining
the credibility of eWOM (Djafarova & Rushworth, 2017). Thus, in this research context,
it seems that the impact of credibility might not be explainable by two dimensions only
but rather a combination of dimensions that overlap with both stimuli and
communicator characteristics.
Finally, as reported in the analysis chapter, the respondents had also indicated the
types of services of which they used to search online information about. Therefore, as a
theoretical sidenote, the results may provide some relevant insights even if the data
were analysed only descriptively. In fact, the most frequently mentioned services
included various leisure items, e.g. entertainment, food and restaurants, travel and
accommodation, while the likes of banking, public transport and housing were
mentioned less frequently. Following a similar line of thought as Zhang et al. (2010),
the findings may imply that eWOM information is more useful and relevant for certain
type of services. More specifically, services in which interaction processes and
experiential outcomes are more dominant than technical outcomes (Zhang et al., 2010).
Therefore, the potential impact of the service category on eWOM effectiveness should
be further studied to confirm whether such an association actually exists.
5.3. Managerial implications
In the modern business landscape, companies aiming to reach Generation Z consumers
simply cannot refrain themselves from online marketing activity because the digital
space is widely populated by their target audience. In fact, somewhere in the digital
marketplace, the brands, the products and the services are being assessed in an ongoing
dialogue in which information flows from one consumer to another. Hence, companies
should become aware of the effects of such information exchange and proactively
engage in the discussion.

67
As has been shown in previous research, such consumer-to-consumer communication
i.e. eWOM affects the perception and behaviour of the receiver in a way that has direct
managerial implications (e.g. Park et al., 2007; Prendergast et al. 2010) especially to
firms in service business that co-create value together with their customers through
intangible assets (e.g. Sweeney et al., 2014). This understanding has been further
supported and improved by the results of this study which elaborated on the
interrelationships of the underlying eWOM effectiveness constructs among a group of
young consumers in a service context. Given the ever increasing importance of service
economy, the undiscovered potential of Generation Z consumers as the emerging
consumer group, and the continuously growing amount of public WOM information
recorded and archived online, marketers should be motivated to track, monitor and
engage in eWOM whenever possible. In fact, marketers can use the existing product
reviews, forum discussions and other relevant consumer generated content in their
advantage by retrieving such publicly available data and analysing the success factors
behind it. Similarly, managers can use the results of the research in planning their
digital marketing strategies. A deeper understanding of the effectiveness and
mechanisms of eWOM communication provides practitioners with opportunities to
improve their digital outreach within the Generation Z segment.
First, we can find an interesting perspective on the subject by juxtaposing source
credibility with source similarity. Here, credibility is defined as the perceived expertise
and trustworthiness of the communicator (Cheung et al., 2008; Sweeney et al., 2008)
while similarity refers to closeness of the tie (Sweeney et al., 2014) and homophily
(Shan & King 2015) between the communicator and the receiver. In light of the
findings, formal expertise is less important than the ability to identify oneself with the
communicator. Hence, the shorter the “mental” distance between the two, the more
effective the message. Communicators who share the same taste, interests, lifestyle and
values as the receiver are likely to contribute more to purchase intention of Generation
Z consumers than communicators who are less similar than their audience. In other
words, the communication from peer consumers (e.g. a specific demographic group),
friends and family members is likely to be more influential than communication from
people that perhaps do not belong to the inner social circle, but represent another
demographic group or lead a different lifestyle.
Given these results, marketers aiming to leverage word-of-mouth marketing (WOMM)
through influencer partnerships should consider an alternative source of information in

68
the field of online advocates that is typically crowded by celebrities, journalists,
commercial brand ambassadors, bloggers and industry-specific thought leaders –
individuals that have typically become influential through their formal expertise and
public status. Instead, more focus should be given to regular consumers and small-scale
(micro) influencers who are more relatable – people who pass on opinions and
experiential knowledge about the services, products and brands they encounter in
everyday life. Therefore, marketers who wish to promote and encourage eWOM among
their customers need not only consider celebrity influencers but also the vast crowd of
micro influencers that may emerge within the target group. For example, an active
member of a digital community or a discussion forum, in which like-minded consumers
may exchange information with each other, could rise above the power of a public
influencer as long as the communicators profile resonates enough with the receiver.
Considering the reasons behind this phenomenon, the following interpretation can be
made: Generation Z consumers seek the opinion of “a peer” because they share the
same taste and interests. On average, an expert or a heavy-user might have different
needs and requirements than the regular consumer which creates an expectation gap.
For example, the expert might be looking for a specific quality in a service that the
regular consumer does not value as much. Hence, there is likely to be a better match
when the information is exchanged between two persons with similar needs. Another
interpretation is more or less related to the characteristics of online communication:
source similarity may also mitigate the problem of inauthentic communicators and fake
information that occurs all around the internet. Hence, Generation Z consumers would
be more receptive to an advice from an individual they know personally or from an
individual they can relate to and identify with. Given this source similarity aspect, a
simple rule of thumb can be proposed to practitioners who wish to apply WOMM
tactics in creating awareness among Generation Z. If the marketing activities target e.g.
young and sporty male consumers, practitioners should encourage and facilitate
communication that flows from such male communicators to male receivers. The same
principal applies whether the target group is female students or teenagers – eWOM
communication from a similar reference group is likely to contribute to the purchase
intention of the target group.
Secondly, further managerial insights can be gained by comparing the quantity and
quality of eWOM information. As defined in the literature section, quantity is simply
defined as the volume of eWOM information available online (Rosario et al., 2016),

69
while quality refers to the depth and breadth of argumentation and objectivity of the
information (Cheung & Thadani, 2012; Cheung et al., 2009). According to the findings
of the study, both quantity and quality matter to Generation Z consumers. Therefore,
marketers should encourage and facilitate eWOM whenever and wherever possible by
providing the consumers with tools to express and exchange information with each
other.
The quantity of eWOM communication can be increased e.g. through well-managed
brand communities and social media channels, but also through enabling online
comments and reviews on corporate websites and online stores. Overall, managers
should consider how to embed opportunities for increasing eWOM in their service
process. That is, encouraging their customers to publish and share reviews,
recommendations and experiences about the service. This could be done, for example,
by posting a review after the service encounter and inviting friends to try the service to
earn a free service voucher. However, as pointed out by Trusov et al. (2009),
stimulating the creation of eWOM among customers through financial incentives may
decrease the effectiveness of such communication. Therefore, managers should not rely
only on paid referral programs but plan alternative ways to generate “organic” eWOM
around their services.
As a rule of thumb, the more there are reviews available online, the higher the quantity
of eWOM information and the stronger the impact on purchase intention. The
reasoning behind the effect has been previously presented as a sense of added trust in
the receiver that is created by high amounts of eWOM information (Cheung & Thadani,
2012). For Generation Z, it can be similarly interpreted that the high volume of
information creates “safety in numbers” i.e. the bandwagon effect (Rosario et al., 2016)
which primarily reduces the risk of making a wrong purchase decision. However, bare
volume is not enough in determining the impact of eWOM communication on purchase
intention. Actually, as a third implication for practitioners, high quality of eWOM
information is even more influential for Generation Z. Thus, practitioners should also
consider ways of enhancing the content of communication – for example, by
encouraging and facilitating the use of pictures, videos and illustrative arguments. In
fact, marketers should not censor the contents of critical reviews, since objectivity is
also one of the quality criteria that adds to the overall effectiveness of the
communication.

70
Finally, in a time when a wide variety of fake information and scams prevail over the
internet, it might seem strange that trustworthiness, which is one of the dimensions of
source credibility, was not represented stronger in the results. Instead, similarity
between the receiver and the communicator was highlighted as a particularly
influential factor. Thus, it seems that identifying oneself with the communicator is a
better way in reducing the risk of purchase decision. As pointed out by Rosario et al.
(2016), the receivers of eWOM can evaluate similarity between themselves and the
communicator by observing various cues available online: e.g. real usernames,
geographic location, profile pictures and other information disclosed by the
communicators. Therefore, managers should facilitate these sort of identification
functionalities on their own platforms, such as websites and online stores, in which
customer reviews can be posted.
5.4. Limitations and further research
Regarding the limitations of the research, one of the key issues arises from the cultural
and demographical context of the study. Since the sample was drawn from a Finnish
population, it may not reflect the effectiveness of eWOM communication in other
cultural contexts although eWOM is considered a global phenomenon. It is also noted
that not all members of Generation Z consumers were represented in the study.
Instead, only the adult members (over 18 years old) of this specific demographic group
were represented for the reasons previously described in the sampling strategy. In fact,
the boundaries of Generation Z still remain rather undefined while the end of the said
generation has not been officially stated. Hence, the demographical representativeness
of the study is limited and appropriate consideration should be used when interpreting
the results. Another demographical limitation is related to the unequal division
between male and female respondents. Since women were represented stronger than
men in the sample, the effect of the gender was analysed in chapter 3. The results
indicated that the quality of eWOM message (i.e. rational argumentation and the clarity
of messaging) was slightly more important to male respondents than female
respondents. Hence, the relative significance of the eWOM quality variable might have
been further increased if more men would have participated.
Overall, the measurement scales constructed for this study should be further improved
to ensure a sufficient validity and decrease measurement error. Future research could
even use alternative scales that employ a different set of existing items or develop and

71
test new scales in order to measure the variables better. The most significant challenge,
however, lies in the process of selecting the most suitable variables to begin with. The
decision to apply only seven variables in this study can also be considered a limitation
since failing to choose the most relevant measures increases the chance of false
conclusions. After all, there is a wide variety of factors affecting eWOM and a decision
to include some variables while excluding others should not be made lightly. Since a
fully comprehensive model has not yet been attained, a thorough literature review is
recommended to avoid potential researcher bias when selecting the variables.
Looking forward, the study provides a theoretical framework to be further developed
and tested by other researchers in the field. As we are only beginning to see the end of
Generation Z somewhere in the near future, a similar study could be replicated with
another sample that is more representative of the whole generational segment. In
addition, the various determinants of eWOM effectiveness may be studied further to
estimate their relative importance in affecting the consumer’s behaviour since only a
fraction of potential determinants were included in this study. For example, it would be
interesting to look deeper into the similarity factor and its potential role in creating
social media bubbles that strengthen the confirmation bias of like-minded people.
Moreover, the interplay among multiple response variables could be studied further as
suggested by Cheung and Thadani (2012). Such research could improve the integrative
model of eWOM effectiveness by connecting eWOM communication with behavioural
patterns that precede the final outcome: e.g. mapping the steps of information adoption
before a purchase decision.
Another perspective to studying eWOM effectiveness is provided by the variety of
technology and communication platforms that continue to develop as we speak. In fact,
the technology that facilitates consumer-to-consumer communication is inevitably
going to affect the way we perceive and exchange information online, thus widening the
gap between conventional WOM and electronic WOM. Since the effect of the platform
or the format of the messaging (e.g. text, image, video, endorsement by like and share)
were not thoroughly discussed in this study, there is still room to dig deeper into these
aspects of eWOM communication. Along with the new ways of sharing our experiences
and expressing our opinions, new challenges could emerge. For example, future
researchers may revisit the current studies about the determinants of eWOM
effectiveness while considering other situational factors such as virtual reality

72
platforms, the ever increasing information clutter online and fake online reviews
manufactured by artificial intelligence.
5.5. Conclusions
In conclusion, this study provides further evidence about the significant relationship
between electronic word-of-mouth and consumer purchase intention. The findings
support our current understanding of the phenomenon through considering the eWOM
effectiveness mechanism from three different perspectives that were brought to a new
demographic context. More specifically, the characteristics of the receiver, the
communicator and the message were reflected against the outcome to evaluate the
effectiveness factors for Generation Z consumers. The results were clear: in addition to
the receiver’s positive stance towards eWOM information, the closeness and
identifiability of the communicator anticipate the consumers’ desire to buy. Regarding
the content of communication, however, quality is more important than quantity
although both factors have a significant impact on the young consumers’ buying
behaviour.
As the study provides arguments and empirical evidence to highlight the effectiveness
mechanism of eWOM, its main contribution is in explaining the factors that drive
purchase intention. Therefore, both researchers and practitioners are able to improve
their understanding about the phenomenon in the context of Generation Z consumers.
However, the study provides less details about the marketer’s role in facilitating such
communication. In a nutshell, managers should adopt an integrative view of marketing
to create an outstanding customer experience which ultimately feeds positive eWOM
about their business. As noted by Meyer and Schwager (2007), such a result is best
achieved by establishing transparency and facilitating seamless cooperation between
the organizational capabilities, thus transforming marketing into a customer-focused
way of doing business in which the customer experience becomes a shared
responsibility. After all, the primary concern of marketing is not only to put out alluring
promises to create demand in the audience, but to ensure such promises are redeemed
every day in every customer interaction (Grönroos, 2006). Through harnessing the
power of these internal marketing resources, marketers can best leverage the power of
eWOM and facilitate the creation of “external marketing forces” – their satisfied
customers that turn into influencers as they spread the word about their positive
experiences online.

73
REFERENCES
Armstrong, J.S., & Overton, T.S. (1977). Estimating nonresponse bias in mail surveys. Journal of Marketing Research, 14(3), 396–402.
Brown, J.J., & Reingen, P.H. (1987). Social ties and word-of-mouth referral behavior. Journal of Consumer Research, 14(December 1987), 350–362.
Chaney, D., Touzani, M., & Slimane, K.B. (2017). Marketing to the (new) generations: Summary and perspectives. Journal of Strategic Marketing, 25(3), 179–189.
Chang, M.K., Cheung, W., Lai, V.S. (2005). Literature derived reference models for the adoption of online shopping. Information management, 42(4), 543–559.
Cheung, C.M.K., Lee, M.K.O., & Rabjohn, N. (2008). The impact of electronic word-of-mouth: The adoption of online opinions in online communities. Internet Research, 18(3), 229–247.
Cheung, C.M.K., & Thadani, R.T. (2012). The impact of electronic word-of-mouth communication: A literature analysis and integrative model. Decision Support Systems, 54(1), 461–470.
Cheung M.Y., Luo C., Sia, C.L., & Chen, H. (2009). Credibility of electronic word-of-mouth: Informational and normative determinants of on-line consumer recommendations. International Journal of Electronic Commerce, 13(4), 9–38.
Chu, S., & Kim, Y. (2011). Determinants of consumer engagement in electronic word-of-mouth (eWOM) in social networking sites. International Journal of Advertising, 30(1), 47–75.
CNBC (2017, January 11), Generation Z likely to avoid advertising, use ad block and skip content: Study. CNBC, Retrieved from: http://www.cnbc.com/2017/01/11/generation-z-avoids-advertising-uses-ad-blockers-and-skips-content.html. Accessed 13.2.2017.
Cohen, J. (1988). The statistical power analysis for the behavioral sciences (2nd edition). New Jersey: Erlbaum.
Coyle, J.R., & Thorson, E. (2001). The effects of progressive levels of interactivity and vividness in web marketing sites. Journal of Advertising, 30(3), 65–77.
Djafarova, E., & Rushworth, C. (2017). Exploring the credibility of online celebrities' Instagram profiles in influencing the purchase decisions of young female users. Computers in Human Behaviour, 68(March 2017), 1–7.

74
Erkan, I., & Evans, C. (2016). The Influence of eWOM in social media on consumers’ purchase intentions: An extended approach to information adoption. Computers in Human Behavior, 61(August 2016), 47–55.
Fan, Y.W., Miao, Y.F., Fang, Y.H., & Lin, R.Y. (2013). Establishing the adoption of electronic word-of-mouth through consumer’s perceived credibility. International Business Research, 6(3), 58–65.
Fan, Y.W., & Miao, Y.F. (2012). Effect of electronic word-of-mouth on consumer purchase intention: The perspective of gender differences. International Journal of Electronic Business Management, 10(3), 175–181.
Finch, J. (2015, May 4). What is Generation Z and what does it want? Fast Company, Retrieved from: https://www.fastcompany.com/3045317/what-is-generation-z-and-what-does-it-want.
Field, A. (2009). Discovering statistics using SPSS (3rd Edition). London: Sage Publications.
Fromm, J. (2016, December 19). What marketers need to know about social media and gen Z. Forbes, Retrieved from: http://www.forbes.com/sites/jefffromm/2016/12/19/what-marketers-need-to-know-about-social-media-and-gen-z/#1ad8513256a7.
Gasca, P. (2014, July 7). Start preparing your business for the generation after Millennials. Entrepreneur, Retrieved from: https://www.entrepreneur.com.
Global Consumer Commerce Centre. (2016). Gen Z are focused on social reputation and rely more heavily on virtual communities than face-to-face recommendations. Retrieved from: http://www.iorma.com/news/gen-z-are-focused-on-social-reputation-and-rely-more-heavily-on-virtual-communities-over-face-to-face-for-recommendations.
Grönroos, C. (2006). Adopting a service logic for marketing. Marketing Theory, 6(3), 317–333.
Hair, J.F., Black, W.C., Babin, B.J., & Anderson, R.E. (2010). Multivariate data analysis: A global perspective (7th edition). New Jersey: Pearson Education.
Hennig-Thurau, T., Gwinner, K.P., Walsh, G., & Gremler, D. (2004). Electronic word-of-mouth via consumer opinion platforms. Journal of Interactive Marketing, 18(1), 18–52.
Ho, J.Y.C., & Dempsey, M (2010).Viral marketing: Motivations to forward online content. Journal of Business Research, 63(9), 1000–1006.

75
Ismagilova, E., Dwivedi, Y.K., Slade, E., Williams, M.D. (2017). Electronic word of mouth (eWOM) in the marketing context. http://dx.doi.org/10.1007/978-3-319-52459-7_1
Jaccard, J., Wan, C.K., & Turrisi, R. (1990). The detection and interpretation of interaction effects between continuous variables in multiple regression. Multivariate Behavioral Research, 25(4), 467–478.
Lindner, J.R., Murphy, T.H., & Briers, G.E. (2001). Handling nonresponse bias in social science research. Journal of Agricultural Education, 42(4), 42–53.
Kelly, L., Kerr, G., & Drennan, J. (2010). Avoidance of advertising in social networking sites: The teenage perspective. Journal of Interactive Advertising, 10(2), 16–27.
Kozinets, R.V., de Valck, K., Wojnicki, A.C., & Wilner, S.J.S. (2010). Networked narratives: Understanding word-of-mouth marketing in online communities. Journal of Marketing, 74(March 2010), 71–89.
Meyer, C., & Schwager, A. (2007). Understanding customer experience. Harvard Business Review, 85(2), 116–126.
Mishra, A., Maheswrappa, S.S., Maity, M., & Samu, S. (2017). Adolescent’s eWOM intentions: An investigation into the roles of peers, the Internet and gender. Journal of Business Research. https://doi.org/10.1016/j.jbusres.2017.04.005
Nowak, K.L., & McGloin, R. (2014). The influence of peer reviews on source credibility and purchase intention. Societies, 4(December 2014), 689–705.
Ozkan, M., & Solmaz, B. (2015). Mobile addiction of Generation Z and its effects on their social lives. Procedia – Social and Behavioral Sciences, 205(May 2015), 92–98.
Park, D., & Kim, S. (2008). The effects of consumer knowledge on message processing of electronic word-of-mouth via online consumer reviews. Electronic Commerce Research and Applications, 7(4), 399–410.
Park, D., Lee, J., & Han, I. (2007). The Effect of On-line Consumer reviews on Consumer Purchasing Intention: The Moderating Role of Involvement. International Journal of Electronic Commerce, 11(4), 125–148.
Pallant, J. (2010). SPSS Survival Manual (4th edition). Berkshire: McGraw-Hill Education.
Prendergast, G., Ko, D., & Yuen, S.Y.V. (2010). Online word of mouth and consumer purchase intentions. International Journal of Advertising, 29(5), 687–708.

76
Priporas, C.V., Stylos, N., & Fotiadis, A.K. (2017). Generation Z consumer’s expectations of interactions in smart retailing: A future agenda. Computers in Human Behavior, 77(December 2017), 374–381.
Racherla, P., & Friske, W. (2012). Perceived usefulness of online consumer reviews: An exploratory investigation across three service categories. Electronic Commerce Research and Applications, 11(6), 548–559.
Rosario, A.B., Sotgiu, F., De Valck, K., & Bijmolt, T.H.A. (2016). The effect of electronic word of mouth on sales: A meta-analytic review of platform, product, and metric factors. Journal of Marketing Research, 53(June 2016), 297–318.
Saunders, M., Lewis, P., & Thornhill, A. (2009). Research methods for business students (5th edition). Harlow: Pearson Education Limited.
See-To, E.W.K., & Ho, K.K.W. (2014). Value co-creation and purchase intention in social network sites: The role of electronic Word-of-Mouth and trust – A theoretical analysis. Computers in Human Behavior, 31(February 2014), 182–189.
Selya, A.S., Rose, J.S., Dierker, L.C., Hedeker, D., & Mermelstein, R.J. (2012). A practical guide to calculating Cohen’s f2, a measure of local effect size from proc mixed. Frontiers in Psychology, 3(April 2012), 1–6.
Shan, Y., & King, K.W. (2015). The effects of interpersonal tie strength and subjective norms on consumer’s brand-related eWOM referral. Journal of Interactive Advertising, 15(1), 16–27.
Smith, D., Menon, S., & Sivakumar, K. (2005). Online peer and editorial recommendations, trust, and choice in virtual markets. Journal of Interactive Marketing, 19(3), 15–37.
Statistics Finland. (2017)a. Population. Retrieved from: http://www.tilastokeskus.fi/tup/suoluk/suoluk_vaesto_en.html.
Statistics Finland. (2017)b. Number of university degrees fell by 3 per cent from the previous year. Retrieved from: https://www.stat.fi/til/yop/2016/yop_2016_2017-05-10_tie_001_fi.html.
Statistics Finland. (2014). Korkeakouluissa opiskelevat naiset valmistuvat miehiä todennäköisemmin ja nopeammin. Retrieved from: https://www.stat.fi/artikkelit/2014/art_2014-09-29_002.html.
Sweeney, J.C., Soutar, G.N., & Mazzarol, T. (2008). Factors influencing word of mouth effectiveness: receiver perspectives. European Journal of Marketing, 42(3/4), 344–364.

77
Sweeney, J., Soutar, G., & Mazzarol, T. (2014). Factors enhancing word-of-mouth influence: positive and negative service-related messages. European Journal of Marketing, 48(1/2), 336–359.
Trusov, M., Bucklin, R.E., & Pauwels, K. (2009). Effects of word-of-mouth versus traditional marketing: findings from an internet social networking Site. Journal of Marketing, 73(September 2009), 90–102.
Truong, Y., & Simmons, G. (2010). Perceived intrusiveness in digital advertising: strategic marketing implications. Journal of Strategic Marketing, 18(3), 239–256.
Tsao, W.C., & Hsieh, M.T. (2015). eWOM persuasiveness: Do eWOM platforms and product type matter? Electronic Commerce Research, 15(4), 509–541.
Weinswig, D. (2016, October 5). Influencers are the new brands. Forbes, Retrieved from: http://www.forbes.com.
Wong, K. (2016, December 13). How millennials and generation Z transformed tourism marketing through sharing. Forbes, Retrieved from: http://www.forbes.com.
Zangeneha, S.K., Mohammadkazemib, R., & Rezvanib, M. (2014). Investigating the effect of electronic word of mouth on customer’s purchase intention of digital products. Management Science Letters, 4(11), 2433–2440.
Zhang, J.Q., Craciun, G., & Shin, D. (2010). When does electronic word-of-mouth matter? A study of consumer product reviews. Journal of Business Research, 63(12), 1336–1341.

78
APPENDIX 1 QUESTIONNAIRE IN ENGLISH
Welcome to the survey! This study is conducted for a Master’s thesis in the Business & Management program at Hanken.
The study aims to examine the effectiveness of online consumer-to-consumer communication among 18–22 year old individuals. Hence, the term “word-of-mouth” has been established to describe the information exchange regarding products and services that occurs in between consumers. The focus of this research is in the various determinants of electronic word-of-mouth effectiveness that relate to the communicator, the message and the receiver.
In the questionnaire, you will find seven sections that are all answered anonymously. The estimated length of the questionnaire is 5–7 minutes. After you have filled in all of the sections, you will be guided from a thank you -page to another online form in which you can choose to participate in a lottery for gift cards. NB! Your contact information will be remain confidential and they cannot be connected with any of the answers you have given in the questionnaire.
If you have any questions regarding the survey, feel free to contact me.
Panu Alanko MSc Student, HANKEN [email protected] +358 50 414 2001
1. Age
18
19
20
21
22
23 or older
2. Gender
Male Female
3. Choose the option that best describes your current situation.
Full-time employment
Part-time employment

79
Student
Unemployed
4. How many hours do you spend online in your spare time?
The average amount of time I spend online (hours per day): __________
5. Regarding services, have you read reviews, experiences and opinions of other consumers online?
Yes No
6. About which services do you most often search information online?
Please identify the type of service (e.g. travel, accommodation, restaurant, telecommunications, banking, entertainment):__________________
7. Please identify one or more online platforms in which you mostly seek information about services.
Social networking site (e.g. Facebook, YouTube, Instagram)
Discussion forum (e.g. Suomi24, MuroBBS)
Review website (e.g. Yelp, TripAdvisor, Vertaa.fi)
Other, please identify____________
8. When you receive information about services from other consumers online, it is important that…
The person who left comments online is knowledgeable in evaluating the quality of service.
Strongly Disagree 1
2 3 4 5 6 7 Strongly Agree
The person who left comments online is an expert in evaluating the quality of service.
1
2 3 4 5 6 7
The person who left comments online is trustworthy.
1
2 3 4 5 6 7
The person who left comments online is reliable.
1
2 3 4 5 6 7

80
9. When you consider the relationship between you and the person who commented the service online, to what extent to do you agree with the following statements?
I am committed to maintain my relationship with this person.
Strongly Disagree 1
2 3 4 5 6 7 Strongly Agree
I want our relationship to last for a long time.
1
2 3 4 5 6 7
I feel very strongly linked to this person.
1
2 3 4 5 6 7
I would not feel very upset if our relationship were to end in the near future.
1
2 3 4 5 6 7
I am oriented towards continuing this relationship long term.
1
2 3 4 5 6 7
The relationship with this person is important to me.
1
2 3 4 5 6 7
10. When you receive information about services from other consumers online, it is important that…
You and the person who gave WOM have a close relationship.
1
2 3 4 5 6 7
You and the person who gave WOM have a similar outlook on life.
1
2 3 4 5 6 7
You and the person who gave WOM share common interests.
1
2 3 4 5 6 7
You and the person who gave WOM have similar likes and dislikes.
1
2 3 4 5 6 7
11. When you consider the online reviews and comments about services from other consumers, it is important that…
Each review has sufficient reasons supporting the opinion.
Strongly Disagree 1
2 3 4 5 6 7 Strongly Agree
Each review is objective. 1
2 3 4 5 6 7
Each review is understandable. 1
2 3 4 5 6 7
Each review is credible. 1
2 3 4 5 6 7
The review includes both pros and cons of the discussed service.
1
2 3 4 5 6 7
81
The review includes only one-sided comments.
1
2 3 4 5 6 7
12. When you consider the online reviews and comments about services from other consumers, it is important that…
The number of reviews is large. 1
2 3 4 5 6 7
The quantity of review information is large.
1
2 3 4 5 6 7
13. If the comments, reviews and opinions I read about the service support the purchase decision…
It is very likely that I will buy the service.
Strongly Disagree 1
2 3 4 5 6 7 Strongly Agree
I will purchase the service the next time I need a service.
1
2 3 4 5 6 7
I will definitely try the service. 1
2 3 4 5 6 7
14. When you consider your own purchase behaviour in general, to what extent do you agree with the following statements?
When buying services, I generally purchase those services that I think others will approve of.
Strongly Disagree 1
2 3 4 5 6 7 Strongly Agree
If other people can see me using a service, I often purchase the brand they expect me to buy.
1
2 3 4 5 6 7
I achieve a sense of belonging by purchasing the same services that others purchase.
1
2 3 4 5 6 7
If I have little experience with a service, I often ask my friends about it.
1
2 3 4 5 6 7
I often consult other people to help choose the best alternative available among services.
1
2 3 4 5 6 7
I frequently gather information from friends or family about a service before I buy.
1
2 3 4 5 6 7

82
15. When you consider your own purchase behaviour in general, to what extent do you agree with the following statements?
When I buy services, I always read reviews available online.
1
2 3 4 5 6 7
When I buy services, the reviews available online are helpful for my decision making.
1
2 3 4 5 6 7
When I buy services, the reviews available online make me confident in purchasing the product.
1
2 3 4 5 6 7
If I don’t read the reviews available online when I buy services, I worry about my decision.
1
2 3 4 5 6 7
Thank you for taking the survey!
Contact information for the lottery
If you want to participate in a lottery for S-group gift cards (à 10 EUR), please fill in your name and email in the below questionnaire. Your contact information are retained confidential and they will only be used to pick the winners of the lottery. There are five gift cards raffled among all respondents. The winners will be contacted individually.
The lottery will be conducted by 31st December 2017.

83
APPENDIX 2 QUESTIONNAIRE IN FINNISH
Tervetuloa vastaamaan kyselyyn! Tutkimus toteutetaan osana pro gradu -tutkielmaa Hanken Business & Management -koulutusohjelmassa.
Tutkimuksen tavoitteena on selvittää verkossa käytävän vertaisviestinnän vaikuttavuutta 18–22-vuotiaiden kuluttajien keskuudessa. Ilmiötä on vakiintunut kuvaamaan englanninkielinen termi sähköinen ”word-of-mouth”, joka viittaa kuluttajien väliseen tiedonvaihtoon Internetissä koskien tuotteita ja palveluita. Tutkimus keskittyy vertaisviestinnän eri vaikuttavuustekijöiden välisiin suhteisiin sekä viestin lähettäjän, viestin sisällön että vastaanottajan osalta.
Kyselyssä on seitsemän osiota, joihin vastataan anonyymisti. Kyselyn arvioitu kesto on 5-7 minuuttia. Täytettyäsi kaikki osiot, sinut ohjataan kiitos-sivulta lomakkeelle, jossa voit halutessasi osallistua S-ryhmän lahjakorttien arvontaan. Huom! Yhteystietosi säilytetään luottamuksellisesti, eikä niitä ole mahdollista yhdistää kyselyssä antamiisi vastauksiin.
Mikäli sinulla on kysyttävää tutkimuksesta, otathan ystävällisesti yhteyttä.
Panu Alanko MSc Student, HANKEN [email protected] +358 50 414 2001
1. Ikä*
18
19
20
21
22
23 tai yli
2. Sukupuoli
Mies Nainen
3. Valitse vaihtoehto, joka kuvaa parhaiten nykyistä tilannettasi.
Kokoaikatyö
Osa-aikatyö

84
Opiskelija
Työtön
4. Kuinka paljon aikaa vietät verkossa vapaa-ajallasi?
Keskimäärin verkossa viettämäni aika (tuntia per päivä) (____)
5. Oletko lukenut verkossa muiden kuluttajien antamia arvioita, kokemuksia tai mielipiteitä palveluista?*
Kyllä Ei
6. Mistä palveluista etsit useimmiten tietoa verkossa?
Kirjoita kenttään palvelutyyppi (esim. matkailu, majoitus, ravintola, televiestintä, pankki- ja vakuutuspalvelut, viihde):______________
7. Valitse alla olevista vaihtoehdoista yksi tai useampi verkkoalusta, jonka kautta etsit useimmiten tietoa palveluista.
Yhteisöpalvelu (esim. Facebook, YouTube, Instagram)
Keskustelupalsta (esim. Suomi24, MuroBBS)
Arviointisivusto (esim. Yelp, TripAdvisor, Vertaa.fi)
Muu, mikä? _________________________
8. Kun mietit palveluista lukemiasi kommentteja verkossa, on tärkeää että…
Henkilö, joka kommentoi palvelua verkossa on pätevä arvioimaan palvelun laatua.
Vahvasti eri mieltä 1
2 3 4 5 6 7 Vahvasti samaa mieltä
Henkilö, joka kommentoi palvelua verkossa on asiantuntija palvelun laadun arvioinnissa.
1
2 3 4 5 6 7
Henkilö, joka kommentoi palvelun laatua verkossa on totuudenmukainen.
1
2 3 4 5 6 7
Henkilö, joka kommentoi palvelun laatua verkossa on luotettava.
1
2 3 4 5 6 7

85
9. Koskien sinun ja palvelua kommentoineen henkilön välistä suhdetta, mitä mieltä olet seuraavista väittämistä?
Olen sitoutunut säilyttämään suhteeni tähän henkilöön.
Vahvasti eri mieltä 1
2 3 4 5 6 7 Vahvasti samaa mieltä
Haluan suhteemme kestävän pitkään.
1
2 3 4 5 6 7
Tunnen olevani vahvasti yhteydessä tähän henkilöön.
1
2 3 4 5 6 7
En olisi juurikaan harmissani, jos suhteemme päättyisi lähitulevaisuudessa.
1
2 3 4 5 6 7
Olen asennoitunut jatkamaan suhdettamme pitkällä tähtäimellä.
1
2 3 4 5 6 7
Suhteeni tähän henkilöön on minulle tärkeä.
1
2 3 4 5 6 7
10. Kun mietit palveluista lukemiasi kommentteja verkossa, on tärkeää että…
Palvelua kommentoineella henkilöllä on läheinen suhde sinuun.
1
2 3 4 5 6 7
Palvelua kommentoineella henkilöllä ja sinulla on samanlainen elämänkatsomus.
1
2 3 4 5 6 7
Palvelua kommentoineella henkilöllä ja sinulla on samanlaiset kiinnostuksen kohteet.
1
2 3 4 5 6 7
Palvelua kommentoineella henkilöllä ja sinulla on samanlainen maku.
1
2 3 4 5 6 7
11. Kun mietit palveluista lukemiasi kommentteja ja arvioita verkossa, on tärkeää että…
Jokaiselle arviolle on annettu riittävät perustelut, jotka tukevat esitettyä mielipidettä.
Vahvasti eri mieltä 1
2 3 4 5 6 7 Vahvasti samaa mieltä
Jokainen arvio on puolueeton. 1
2 3 4 5 6 7
Jokainen arvio on ymmärrettävä. 1
2 3 4 5 6 7
Jokainen arvio on uskottava. 1
2 3 4 5 6 7
Arvio sisältää sekä hyviä että huonoja puolia palvelusta.
1 2 3 4 5 6 7

86
Arvio sisältää vain yksipuolisia kommentteja.
1
2 3 4 5 6 7
12. Kun mietit palveluista lukemiasi kommentteja ja arvioita verkossa, on tärkeää että…
Palvelua koskevien arviointien määrä on suuri.
Vahvasti eri mieltä 1
2 3 4 5 6 7 Vahvasti samaa mieltä
Arviointien sisältämän tiedon määrä on suuri.
1
2 3 4 5 6 7
13. Mikäli palveluista lukemani kommentit, arviot ja mielipiteet tukevat ostopäätöstä…
On erittäin todennäköistä, että ostan palvelun.
Vahvasti eri mieltä 1
2 3 4 5 6 7 Vahvasti samaa mieltä
Ostan palvelun seuraavalla kerralla kun tarvitsen sitä.
1
2 3 4 5 6 7
Tulen ehdottomasti kokeilemaan palvelua.
1
2 3 4 5 6 7
14. Kun mietit yleisesti omaa ostokäyttäytymistäsi, miten hyvin seuraavat väittämät kuvaavat sinua?
Kun ostan palveluita, ostan yleensä niitä merkkejä jotka uskon muiden ihmisten hyväksyvän.
Vahvasti eri mieltä 1
2 3 4 5 6 7 Vahvasti samaa mieltä
Jos muut ihmiset voivat nähdä minun käyttävän palvelua, ostan usein merkkiä, jonka he odottavat minun ostavan.
1
2 3 4 5 6 7
Koen yhteenkuuluvuuden tunnetta ostamalla samoja palveluita ja merkkejä, joita muut ostavat.
1
2 3 4 5 6 7
Jos minulla on vain vähän kokemusta tietystä palvelusta, kysyn siitä usein ystäviltäni.
1
2 3 4 5 6 7
Kysyn usein neuvoa muilta ihmisiltä valitakseni parhaan vaihtoehdon tietyn tyyppisten palveluiden joukosta.
1
2 3 4 5 6 7
Hankin palveluista usein tietoa ystäviltä tai perheenjäseniltä ennen ostopäätöstä.
1
2 3 4 5 6 7

87
15. Kun mietit yleisesti omaa ostokäyttäytymistäsi, miten hyvin seuraavat väittämät kuvaavat sinua?
Kun ostan palveluita, luen niistä aina arvioita verkossa.
Vahvasti eri mieltä 1
2 3 4 5 6 7 Vahvasti samaa mieltä
Kun ostan palveluita, verkossa esitetyt arviot ovat hyödyllisiä oman päätökseni kannalta.
1
2 3 4 5 6 7
Kun ostan palveluita, saan verkossa olevista arvioista varmuutta ostoksen tekemiseen.
1
2 3 4 5 6 7
Jos en lue verkossa olevia arvioita kun ostan palveluita, huolehdin tekemästäni päätöksestä.
1
2 3 4 5 6 7
Kiitos vastauksesta!
Yhteystiedot arvontaa varten
Jos haluat osallistua arvontaan S-ryhmän lahjakorteista (à 10 EUR), täytäthän alla olevalle lomakkeelle nimesi ja sähköpostiosoitteesi. Yhteystietosi säilyvät luottamuksellisena ja niitä käytetään vain arvonnan voittajien valitsemiseen kaikkien osallistujien joukosta. Yhteensä lahjakortteja arvotaan viisi kappaletta. Voittajiin otetaan henkilökohtaisesti yhteyttä palkinnon toimittamiseksi.
Arvonta suoritetaan 31.12.2017 mennessä.