Mapping ecosystem services and trade-offs
28
Mapping ecosystem services and trade-offs Mohammed Said, Shem Kifugo, Tom Otieno, Enoch Ontiri and Bernard Bett International Livestock Research Institute Workshop on Dynamics Drivers of Diseases in Africa, Naivasha 24 th – 26 th June 2014
Transcript of Mapping ecosystem services and trade-offs

Mapping ecosystem services and trade-offs
Mohammed Said, Shem Kifugo, Tom Otieno, Enoch Ontiri and Bernard Bett
International Livestock Research Institute
Workshop on Dynamics Drivers of Diseases in
Africa, Naivasha 24th – 26th June 2014
Study Area The study site is has been identified as a biodiversity hotspot • supporting a unique plant taxonomy
and a recorded 262 bird species and 57 mammal species
• including two highly endangered primates: the Red Colobus (Colobus badius rufomitratus) and the Crested Mangabey (Cercocebus galeritus galeritus)
• The Tana River delta site was officially declared a Ramsar site, under the Ramsar Convention, in October 2012
• About 5000 birds use the delta for breeding
Source: KSS, ILRI
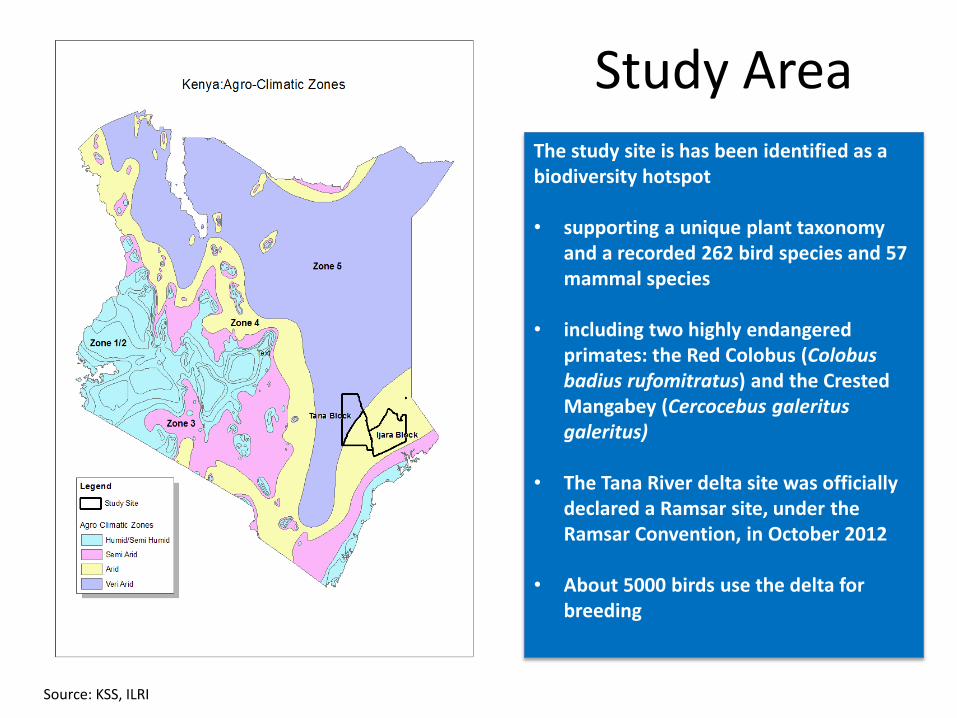
Study Site Tana River
Source: KSS, ILRI
!.
!.Bura
Hola
0 10 20 30 405Kilometers
´
Legend
Settlements
Irrigation Schemes
permanent
mixed
temporary
!. Towns
Study Block
Tana River County
Tana River
Other Rivers
Riverrine Forests
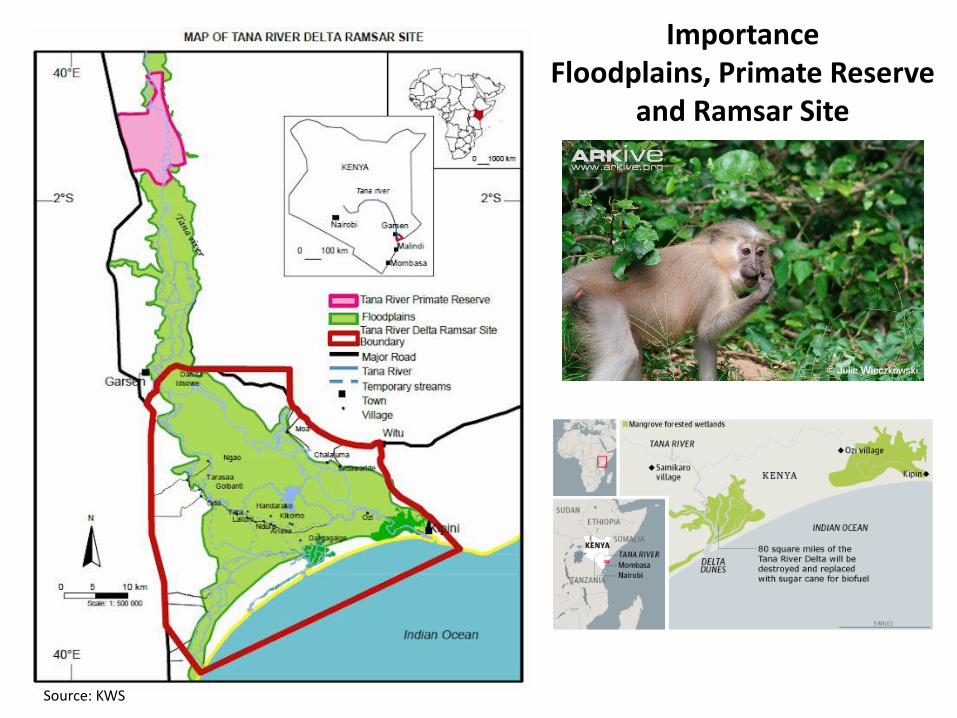
Importance Floodplains, Primate Reserve
and Ramsar Site
Source: KWS

Rainfall and climate
Source: ILRI, KMD
0
100
200
300
400
Jan
uar
y
Feb
ruar
y
Mar
ch
Ap
ril
May
Jun
e
July
Au
gust
Sep
tem
be
r
Oct
ob
er
No
vem
be
r
De
cem
ber
Rai
nfa
ll (m
m)
Ijara
0
50
100
150
200Ja
nu
ary
Feb
ruar
y
Mar
ch
Ap
ril
May
Jun
e
July
Au
gust
Sep
tem
be
r
Oct
ob
er
No
vem
be
r
De
cem
ber
Rai
nfa
ll (m
m)
Bura
50 0 50 100 Kilometers
Month
Jan
Feb
Mar
Apr
May
Jun
Jul
Aug
Sep
Oct
Nov
Dec
a) Start of the growing season b) End of the growing season
d) LGP - 2nd Seasonc) LGP - 1st Season
LGP (days)
30 - 60
60 - 90
90 - 120
120 - 150
150 - 180
180 - 210
210 - 240
240 - 270
270 - 300

Human population changes
FACTS • There are two major irrigation schemes– Bura and Hola.
• Bura Irrigation Scheme was started in 1978 to settle landless
farmers. It covers an area of 2500 Ha with a tenant population of 2245 farmers settled in 10 villages
• Hola Irrigation Scheme started in 1953. It has a gazetted area of 4,800 hectares of which only 900 hectares are under cultivation.

Mapping Ecosystem Service
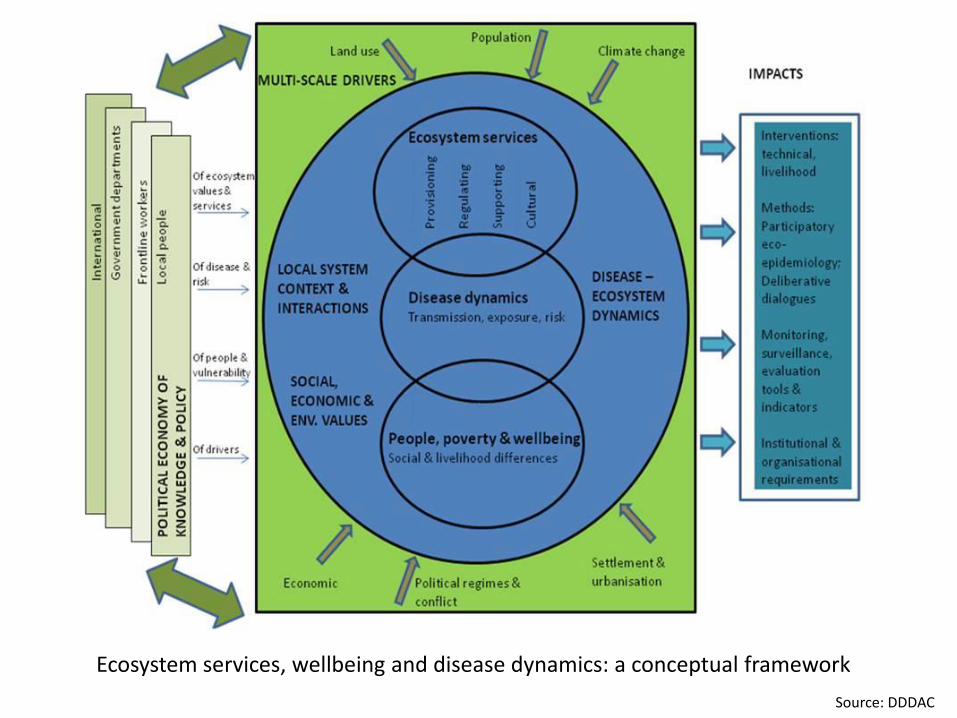
Ecosystem services, wellbeing and disease dynamics: a conceptual framework
Source: DDDAC
Storyline • Ecosystem changes have great implications on human health and
wellbeing; these relationships are complex and might vary from system to systems.
• In general, ecological changes degrade disease regulatory services or increase the vulnerability of human and animal populations to infectious diseases.
• For instance, irrigation increases food production in a given area but standing water pools in farms and watersheds provide good breeding grounds for the development of diverse species of arthropod vectors.
• These drainages also serve as valuable watering points for both livestock and wildlife, particularly in the dry season, enabling faster transmission of infectious diseases.
Source: DDDAC

InVEST St
ake
ho
lde
r En
gage
me
nt
Staging Scenarios
(A Management, Climate, Population)
Models Biodiversity Provisioning Regulating Cultural Supporting
Species Food Climate Recreation Pollination Habitats Timber Stability Tradition
Fresh Water Community Flood
Control
Outputs ~ Biophysical, Economic, Cultural
Maps Trade-off Curves
Balance Sheets
Source: InVEST Documentation

Example - Biodiversity InVEST Data and Model Inventory
Step Data requirements Process Outputs
Biodiversity: Habitat Quality and Rarity (Tier 0)
Required Supply
Current Land use/land cover
Calculate habitat quality and degradation based on threat intensity and sensitivity
Habitat degradation index; Habitat quality index
Threat impact distance
Relative threat impact weights
Form of threat decay function
Threat maps
Habitat suitability (optional: by species group)
Habitat sensitivity to threats
Half saturation constant
Protected status
Optional Supply
Baseline land use/land cover
Calculates rarity of current and/or future habitat types relative to baseline; calculates quality and degradation of baseline based on threat intensity and sensitivity
Relative habitat rarity index for current and/or future land use/land cover; Degradation and quality for baseline
Future land use/land cover
Calculates quality and degradation of future scenario based on threat intensity and sensitivity; optionally calculates habitat rarity relative to baseline
Habitat degradation, quality and optionally rarity for future scenario
Source: InVEST Documentation
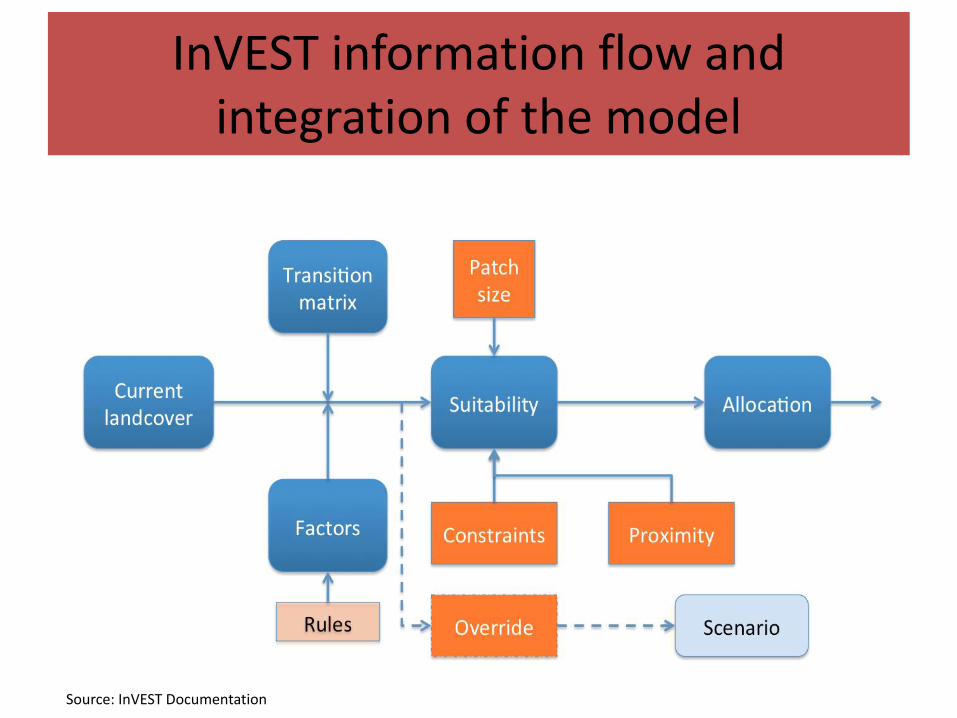
InVEST information flow and integration of the model
Source: InVEST Documentation

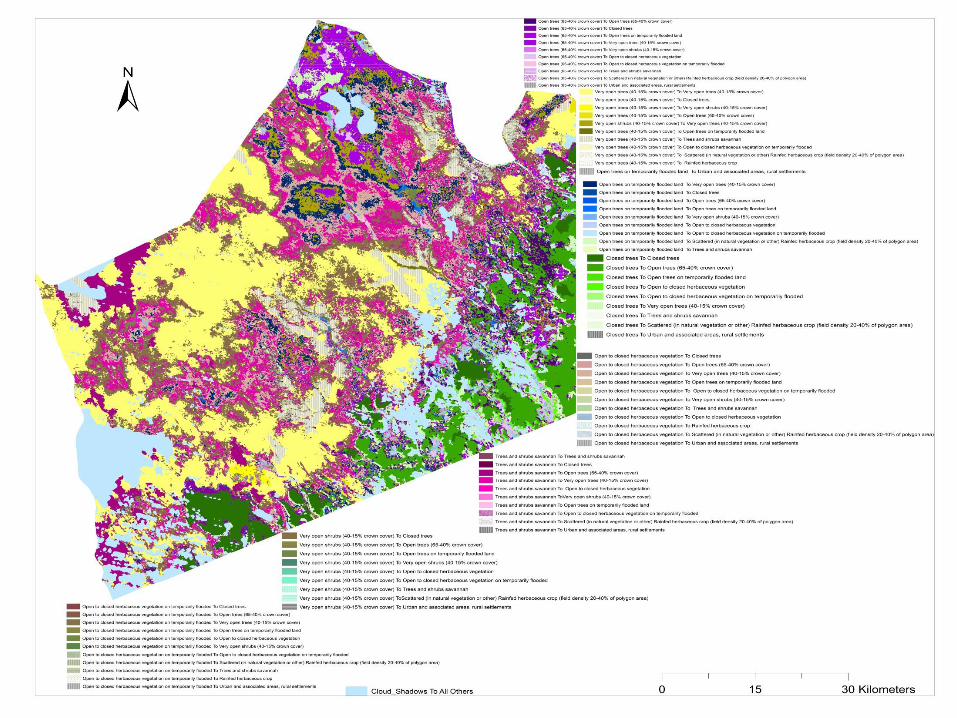
Land cover changes and
Transition matrix

Land Cover Map for
Ijara
1985
Source: ILRI, Kifugo in prep

Land Cover Map for
Ijara
2008
Source: ILRI
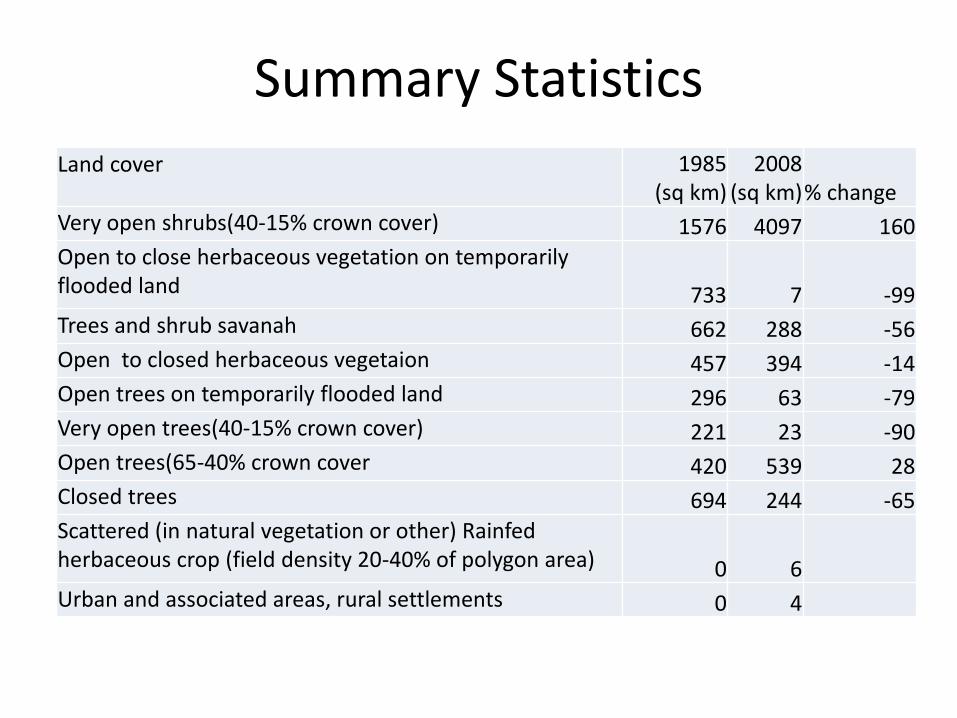
Summary Statistics
Land cover 1985 (sq km)
2008 (sq km) % change
Very open shrubs(40-15% crown cover) 1576 4097 160
Open to close herbaceous vegetation on temporarily flooded land 733 7 -99
Trees and shrub savanah 662 288 -56
Open to closed herbaceous vegetaion 457 394 -14
Open trees on temporarily flooded land 296 63 -79
Very open trees(40-15% crown cover) 221 23 -90
Open trees(65-40% crown cover 420 539 28
Closed trees 694 244 -65
Scattered (in natural vegetation or other) Rainfed herbaceous crop (field density 20-40% of polygon area) 0 6
Urban and associated areas, rural settlements 0 4

Transition Matrix- Ijara
Clo
sed trees
Op
en
tree
s (65
-40
% cro
wn
cover)
Ve
ry op
en
tree
s (40
-15
% cro
wn
cover)
Op
en
tree
s on
tem
po
rarily floo
ded
land
Tree
s and
shru
bs savan
nah
Very o
pen
shru
bs (4
0-1
5%
crow
n co
ver
Op
en
to clo
sed
he
rbace
ou
s vege
tation
on
temp
orarily flo
od
ed
Op
en
to clo
sed
herb
aceou
s vegetation
Clo
sed
tree
s To U
rban
and
associate
d areas, ru
ral settlem
en
ts
chan
ge
Prio
rity
Pro
ximate
Closed trees 0 23 0 17 12 0 2 22 0
Open trees (65-40% crown cover) 11 0 15 11 11 8 8 13 9
Very open trees (40-15% crown cover) 35 9 0 11 18 17 5 0 0
Open trees on temporarily flooded land 0 16 10 0 15 11 13 11 9
Trees and shrubs savannah 13 0 16 13 0 9 12 13 11
Very open shrubs (40-15% crown cover 3 22 22 13 8 0 4 21 4
Open to closed herbaceous vegetation on temporarily flooded 12 5 7 18 19 5 0 0 3
Open to closed herbaceous vegetation 10 11 17 10 11 9 8 15 0
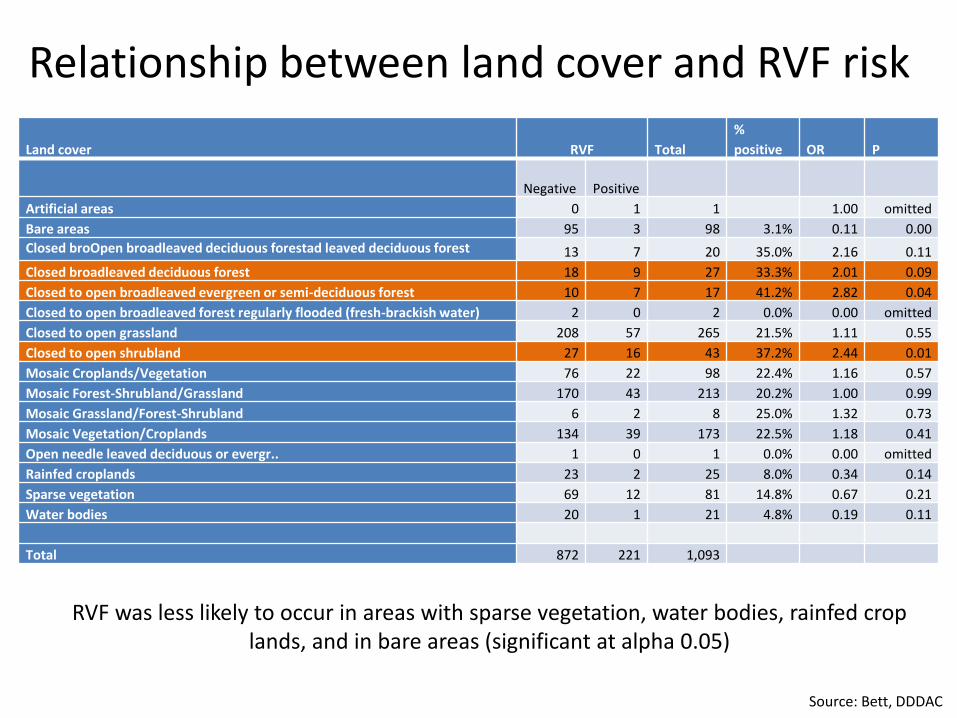
Land cover RVF Total
%
positive OR P
Negative Positive
Artificial areas 0 1 1 1.00 omitted
Bare areas 95 3 98 3.1% 0.11 0.00
Closed broOpen broadleaved deciduous forestad leaved deciduous forest 13 7 20 35.0% 2.16 0.11
Closed broadleaved deciduous forest 18 9 27 33.3% 2.01 0.09
Closed to open broadleaved evergreen or semi-deciduous forest 10 7 17 41.2% 2.82 0.04
Closed to open broadleaved forest regularly flooded (fresh-brackish water) 2 0 2 0.0% 0.00 omitted
Closed to open grassland 208 57 265 21.5% 1.11 0.55
Closed to open shrubland 27 16 43 37.2% 2.44 0.01
Mosaic Croplands/Vegetation 76 22 98 22.4% 1.16 0.57
Mosaic Forest-Shrubland/Grassland 170 43 213 20.2% 1.00 0.99
Mosaic Grassland/Forest-Shrubland 6 2 8 25.0% 1.32 0.73
Mosaic Vegetation/Croplands 134 39 173 22.5% 1.18 0.41
Open needle leaved deciduous or evergr.. 1 0 1 0.0% 0.00 omitted
Rainfed croplands 23 2 25 8.0% 0.34 0.14
Sparse vegetation 69 12 81 14.8% 0.67 0.21
Water bodies 20 1 21 4.8% 0.19 0.11
Total 872 221 1,093
Relationship between land cover and RVF risk
RVF was less likely to occur in areas with sparse vegetation, water bodies, rainfed crop lands, and in bare areas (significant at alpha 0.05)
Source: Bett, DDDAC

Tana River – land cover changes

20 0 20 40 60 80 Kilometers
N
Open shrubs (65-40% crown cover)
Very open shrubs (40-15% crown cover)
Closed herbaceous vegetation on
permanently flooded land
Open to closed herbaceous vegetation
on temporarily flooded
Open to closed herbaceous vegetation
Irrigated land / Cropland
Clouds
Tana River-Waterbodies
Urban and Rural Settements
Open trees on temporarily flooded land
Trees and shrubs savannah
Very open trees (40-15% crown cover)
Open trees (65-40% crown cover)Closed trees
Legenda) 1975 b) 2010
Land cover changes
Source: Said, Kifugo et al. (in prep)

1975 2010
Area
Change (%)
Land cover
Area
(km2)
Area
(%)
Area
(km2)
Area
(%)
Closed trees 62 1 0 0 -100
Open trees (65-40% crown cover) 370 7 68 1 -81
Very open trees (40-15% crown cover) 741 13 636 11 -14
Trees and shrubs savannah 744 13 439 8 -41
Open trees on temporarily flooded land 169 3 199 4 18
Open shrubs (65-40% crown cover) 836 15 699 12 -16
Very open shrubs (40-15% crown cover) 1516 27 1604 29 6
Sparse Shrubs 0 0 642 11 11
Open to closed herbaceous vegetation 244 4 0 0 -100
Closed herbaceous vegetation on permanently flooded land 181 3 244 4 35
Open to closed herbaceous vegetation on temporarily flooded 675 12 811 14 20
Cropland//irrigated 14 0 209 4 1359
Tana river-water bodies 50 1 42 1 -18
Urban and associated areas, rural settlements 0 0 9 1 1
Land cover changes statistics
Source: Said, Kifugo et al. (in prep)
Livestock and wildlife trends 1977 - 2011
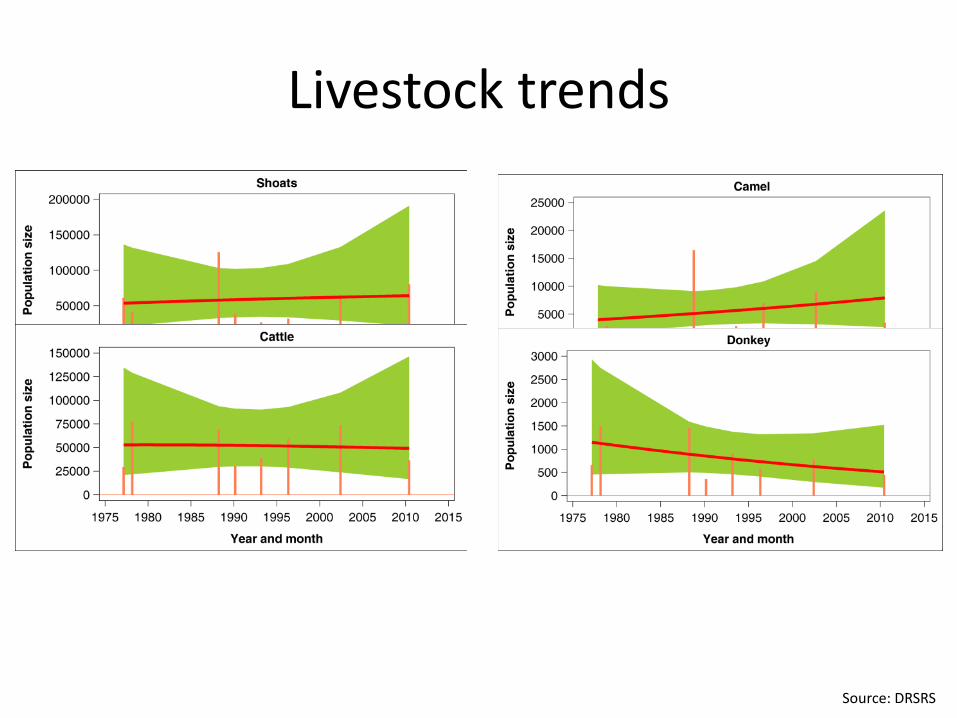
Livestock trends
Source: DRSRS
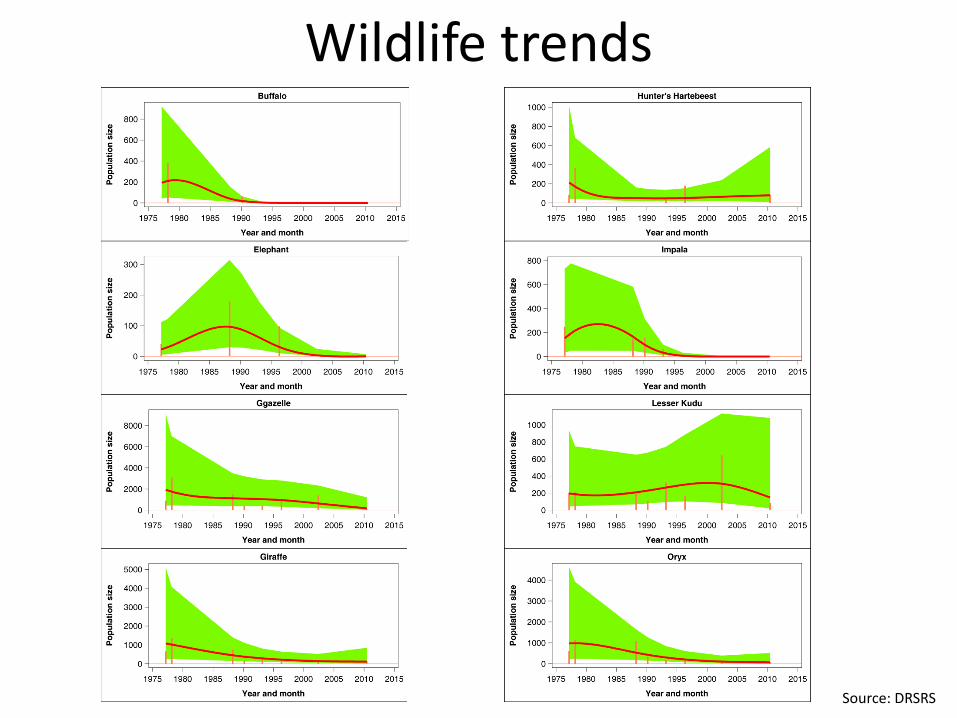
Wildlife trends
Source: DRSRS
Trade-off Analysis - next steps
Ecosystem services and diseases Ecosystem Services and
biodiversity
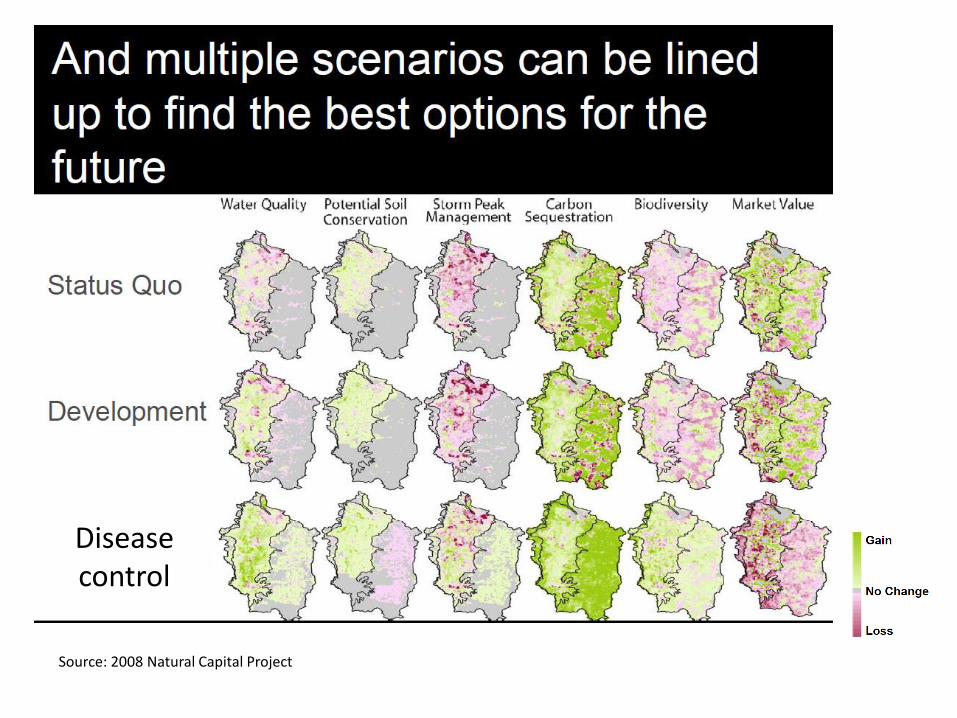
Source: 2008 Natural Capital Project
Disease control

Thank you