
Mapping ecosystem service supply, demand and …esanalysis.colmex.mx/Sorted Papers/2012/2012 BGR DEU...
13
Ecological Indicators 21 (2012) 17–29 Contents lists available at ScienceDirect Ecological Indicators jo ur nal homep age: www.elsevier.com/locate/ecolind Mapping ecosystem service supply, demand and budgets Benjamin Burkhard a,∗ , Franziska Kroll a , Stoyan Nedkov b , Felix Müller a a Institute for the Conservation of Natural Resources, Department of Ecosystem Management, Ecology Centre, Christian Albrechts University Kiel, Olshausenstr. 40, 24098 Kiel, Germany b Institute of Geophysics, Geodesy and Geography, Bulgarian Academy of Sciences, Acad. G. Bonchev Street, bl. 3, 1113 Sofia, Bulgaria a r t i c l e i n f o Keywords: Ecosystem functions Ecological integrity Ecosystem service footprint CORINE land cover Ecosystem service maps GIS a b s t r a c t Among the main effects of human activities on the environment are land use and resulting land cover changes. Such changes impact the capacity of ecosystems to provide goods and services to the human society. This supply of multiple goods and services by nature should match the demands of the society, if self-sustaining human–environmental systems and a sustainable utilization of natural capital are to be achieved. To describe respective states and dynamics, appropriate indicators and data for their quantifi- cation, including quantitative and qualitative assessments, are needed. By linking land cover information from, e.g. remote sensing, land survey and GIS with data from monitoring, statistics, modeling or inter- views, ecosystem service supply and demand can be assessed and transferred to different spatial and temporal scales. The results reveal patterns of human activities over time and space as well as the capac- ities of different ecosystems to provide ecosystem services under changing land use. Also the locations of respective demands for these services can be determined. As maps are powerful tools, they hold high potentials for visualization of complex phenomena. We present an easy-to-apply concept based on a matrix linking spatially explicit biophysical landscape units to ecological integrity, ecosystem service supply and demand. An exemplary application for energy supply and demand in a central German case study region and respective maps for the years 1990 and 2007 are presented. Based on these data, the concept for an appropriate quantification and related spatial visualization of ecosystem service supply and demand is elaborated and discussed. © 2011 Elsevier Ltd. All rights reserved. 1. Introduction There is no doubt about the increasing popularity of the ecosys- tem service concept in contemporary science (Seppelt et al., 2011; Fisher et al., 2009). The longer the conceptual orientation phase of the ecosystem service approach has been lasting, the more obvi- ous become the needs for practical applications of the concept (Daily et al., 2009; Burkhard et al., 2010). These applications are necessary in order to improve the concept and make it an acknowl- edged tool for natural resource management (Kienast et al., 2009). The quantification and implementation of ecosystem goods and services have been among the biggest challenges of current ecosys- tem science (Wallace, 2007). Monetary approaches like cost-benefit analyses, contingent valuations or willingness-to-pay assessments are useful attempts (Farber et al., 2002) but their outcomes are often disappointing due to the economic focus and the lack of appropriate pricing methods, e.g. for non-marketed goods and services (Ludwig, 2000; Spangenberg and Settele, 2010). The provision of ecosystem services depends on biophysical conditions and changes over space and time due to human induced ∗ Corresponding author. Tel.: +49 431 880 1230; fax: +49 431 880 4083. E-mail address: [email protected] (B. Burkhard). land cover, land use and climatic changes. Spatial patterns of land cover and land cover change can be linked to large regions and provide direct measures of human activity (Riitters et al., 2000). Because of the spatial peculiarity of ecosystem services, mapping their distributions and changes over time has the potential to aggre- gate complex information. This visualization of ecosystem services can be used by decision makers, e.g. land managers, as a power- ful tool for the support of landscape sustainability assessments (Swetnam et al., 2010). Unfortunately, there is a clear lack of infor- mation relevant to local scale decision making (Turner and Daily, 2008). Therefore, the explicit quantification and mapping of ecosys- tem services are considered as one of the main requirements for the implementation of the ecosystem services concept into envi- ronmental institutions and decision making (Daily and Matson, 2008). In recent years, many new ecosystem service mapping approaches have been developed and applied at different spa- tial scales by several authors. For a more detailed review of recent approaches to ecosystem service mapping at different spa- tial scales we refer to Burkhard et al. (2009). Novel studies and approaches on ecosystem service mapping are presented in this special issue (e.g. Schneiders et al., 2012; Koschke et al., 2012; Haines-Young et al., 2012; Nedkov and Burkhard, 2012; Scolozzi et al., 2012). 1470-160X/$ – see front matter © 2011 Elsevier Ltd. All rights reserved. doi:10.1016/j.ecolind.2011.06.019
Transcript of Mapping ecosystem service supply, demand and …esanalysis.colmex.mx/Sorted Papers/2012/2012 BGR DEU...
M
Ba
b
a
KEEECEG
1
tFto(neTstaadp2
c
1d
Ecological Indicators 21 (2012) 17–29
Contents lists available at ScienceDirect
Ecological Indicators
jo ur nal homep age: www.elsev ier .com/ locate /eco l ind
apping ecosystem service supply, demand and budgets
enjamin Burkharda,∗, Franziska Krolla, Stoyan Nedkovb, Felix Müllera
Institute for the Conservation of Natural Resources, Department of Ecosystem Management, Ecology Centre, Christian Albrechts University Kiel, Olshausenstr. 40, 24098 Kiel, GermanyInstitute of Geophysics, Geodesy and Geography, Bulgarian Academy of Sciences, Acad. G. Bonchev Street, bl. 3, 1113 Sofia, Bulgaria
r t i c l e i n f o
eywords:cosystem functionscological integritycosystem service footprintORINE land covercosystem service mapsIS
a b s t r a c t
Among the main effects of human activities on the environment are land use and resulting land coverchanges. Such changes impact the capacity of ecosystems to provide goods and services to the humansociety. This supply of multiple goods and services by nature should match the demands of the society, ifself-sustaining human–environmental systems and a sustainable utilization of natural capital are to beachieved. To describe respective states and dynamics, appropriate indicators and data for their quantifi-cation, including quantitative and qualitative assessments, are needed. By linking land cover informationfrom, e.g. remote sensing, land survey and GIS with data from monitoring, statistics, modeling or inter-views, ecosystem service supply and demand can be assessed and transferred to different spatial andtemporal scales. The results reveal patterns of human activities over time and space as well as the capac-ities of different ecosystems to provide ecosystem services under changing land use. Also the locationsof respective demands for these services can be determined. As maps are powerful tools, they hold high
potentials for visualization of complex phenomena. We present an easy-to-apply concept based on amatrix linking spatially explicit biophysical landscape units to ecological integrity, ecosystem servicesupply and demand. An exemplary application for energy supply and demand in a central German casestudy region and respective maps for the years 1990 and 2007 are presented. Based on these data, theconcept for an appropriate quantification and related spatial visualization of ecosystem service supplyand
and demand is elaborated. Introduction
There is no doubt about the increasing popularity of the ecosys-em service concept in contemporary science (Seppelt et al., 2011;isher et al., 2009). The longer the conceptual orientation phase ofhe ecosystem service approach has been lasting, the more obvi-us become the needs for practical applications of the conceptDaily et al., 2009; Burkhard et al., 2010). These applications areecessary in order to improve the concept and make it an acknowl-dged tool for natural resource management (Kienast et al., 2009).he quantification and implementation of ecosystem goods andervices have been among the biggest challenges of current ecosys-em science (Wallace, 2007). Monetary approaches like cost-benefitnalyses, contingent valuations or willingness-to-pay assessmentsre useful attempts (Farber et al., 2002) but their outcomes are oftenisappointing due to the economic focus and the lack of appropriatericing methods, e.g. for non-marketed goods and services (Ludwig,
000; Spangenberg and Settele, 2010).The provision of ecosystem services depends on biophysicalonditions and changes over space and time due to human induced
∗ Corresponding author. Tel.: +49 431 880 1230; fax: +49 431 880 4083.E-mail address: [email protected] (B. Burkhard).
470-160X/$ – see front matter © 2011 Elsevier Ltd. All rights reserved.oi:10.1016/j.ecolind.2011.06.019
discussed.© 2011 Elsevier Ltd. All rights reserved.
land cover, land use and climatic changes. Spatial patterns of landcover and land cover change can be linked to large regions andprovide direct measures of human activity (Riitters et al., 2000).Because of the spatial peculiarity of ecosystem services, mappingtheir distributions and changes over time has the potential to aggre-gate complex information. This visualization of ecosystem servicescan be used by decision makers, e.g. land managers, as a power-ful tool for the support of landscape sustainability assessments(Swetnam et al., 2010). Unfortunately, there is a clear lack of infor-mation relevant to local scale decision making (Turner and Daily,2008). Therefore, the explicit quantification and mapping of ecosys-tem services are considered as one of the main requirements forthe implementation of the ecosystem services concept into envi-ronmental institutions and decision making (Daily and Matson,2008).
In recent years, many new ecosystem service mappingapproaches have been developed and applied at different spa-tial scales by several authors. For a more detailed review ofrecent approaches to ecosystem service mapping at different spa-tial scales we refer to Burkhard et al. (2009). Novel studies and
approaches on ecosystem service mapping are presented in thisspecial issue (e.g. Schneiders et al., 2012; Koschke et al., 2012;Haines-Young et al., 2012; Nedkov and Burkhard, 2012; Scolozziet al., 2012).
1 ical In
awsMebbsdwsotfrmsoshm(
df2FtbfsWtetdMtTewtto
ov2sscaa2ile
dHfsira
8 B. Burkhard et al. / Ecolog
However, the direct comparison of ecosystem service supplynd demand in spatially explicit maps is rather rare in spite of theide agreement about the importance of including the demand
ide into ecosystem service assessments (van Jaarsveld et al., 2005;cDonald, 2009). Paetzold et al. (2010) note that the status of an
cosystem service is influenced not only by its provision, but alsoy human needs and the desired level of provision for this servicey the society, which connects supply and demand of ecosystemervices inseparably (Syrbe and Walz, 2012). Paetzold et al. (2010)eveloped a framework for the assessment of ecological qualityhich considers the supply as well as the demand of ecosystem
ervices. van Jaarsveld et al. (2005) present a practical applicationf ecosystem supply and demand mapping at the subcontinen-al scale for Africa, whereas (Kroll et al., 2012) provide a methodor the quantification and mapping of ecosystem services at theegional scale for a rural-urban region in eastern Germany. Theseaps can be used by decision makers for the identification of
upply–demand mismatches across landscapes and their changesver time (Paetzold et al., 2010). However, caution and patience aretill needed as the expectations from practitioners are already veryigh, but most of the maps might still need further refinement withore detailed spatial data and better socio-economic information
Kienast et al., 2009).When assessing and mapping ecosystem service supply and
emand, the problem of a clear distinction between ecosystemunctions, services and benefits is of high relevance (de Groot et al.,010; Haines-Young and Potschin, 2010; Burkhard et al., 2010).or several practical reasons, the commonly used definition fromhe Millennium Ecosystem Assessment “ecosystem services are theenefits humans obtain from nature” (MA, 2005) and the relatedour categories of supporting, provisioning, regulating and culturalervices are not always appropriate (Seppelt et al., 2011, 2012;
allace, 2007). As Fisher and Turner (2008) point out, we haveo delineate between ends and means if we want to operationalizecosystem services. Therefore, Boyd and Banzhaf (2007) introducedhe term final ecosystem services which are components of natureirectly enjoyed, consumed or used to yield human well-being.ost of the other components and functions of an ecosystem would
hen be intermediate products respectively intermediate services.his goes along with Fisher and Turner (2008) who propose thatcosystem services’ benefits must have a direct relation to humanell-being. For example, nutrient cycling is an ecological func-
ion, not an ecosystem service (Boyd and Banzhaf, 2007). However,he distinction between intermediate and final services is oftenbserver-based and depending on rather subjective decisions.
Therefore, we follow a framework which integrates the conceptf ecological integrity as the base for the supply of regulating, pro-isioning and cultural ecosystem services (Müller and Burkhard,007). Ecological integrity means the preservation against non-pecific ecological risks that are general disturbances of theelf-organizing capacity of ecological systems. This self-organizingapacity is based on structures and processes in ecosystems, andppropriate indicators for their description have been defined andpplied in several case studies (Müller, 2005; Burkhard and Müller,008). Land use and related land cover modifications have a strong
mpact on ecological integrity. Alterations of ecological integrityead to increasing or decreasing supplies of selected or bundles ofcosystem services, on which human societies depend.
If the supply of ecosystem services is changed, human societies’emands for ecosystem services might not be fulfilled anymore.owever, it is difficult in today’s complex and globalized world to
ollow the tracks and define the origin of goods and services con-
umed by people in a certain region. Many goods and services aremported from more or less remote places. In this way, the envi-onmental impacts of ecosystem service generation are exportednd leave a biodiversity and ecosystem service footprint elsewheredicators 21 (2012) 17–29
(Burkhard and Kroll, 2010). Finding an acceptable and equitablelevel of ecosystem service footprints and an appropriate balanceof local ecosystem service supply and demand are important stepstoward sustainability. So far, few approaches exist which deal withthe relations between local demands and ecosystem service provi-sion elsewhere (Seppelt et al., 2011).
The following definitions are the conceptual background of ourapproach:
• Supply of ecosystem services refers to the capacity of a par-ticular area to provide a specific bundle of ecosystem goodsand services within a given time period. Here, capacity refersto the generation of the actually used set of natural resourcesand services. Thus, it is not similar to the potential supplyof ecosystem services in a certain ecosystem, which wouldbe the hypothetical maximum yield of selected optimizedservices.
• Demand for ecosystem services is the sum of all ecosystemgoods and services currently consumed or used in a partic-ular area over a given time period. Up to now, demands areassessed not considering where ecosystem services actuallyare provided. These detailed provision patterns are part ofthe:
• Ecosystem service footprint which (closely related to the eco-logical footprint’s concept; Rees, 1992) calculates the areaneeded to generate particular ecosystem goods and servicesdemanded by humans in a certain area in a certain time.Different aspects of ecosystem service generation are con-sidered (production capacities, waste absorption, etc.).
According to our definitions, the regional supply of ecosystemgoods and services is directly determined by the regional ecolog-ical integrity which is influenced by human actions and decisionssuch as land cover change, land use and technical progress. Humanwell-being (economic, social and personal well-being) is basedon benefits derived from the people’s actual use of ecosystemgoods and services. This actual use of ecosystem goods and ser-vices is the demand side of this supply and demand chain (EEA,2010). The impacts on the demand side are manifold and caninclude policies, population dynamics, economic factors, market-ing, trends, advertising, cultural norms and governance (Curranand de Sherbinin, 2004). Fig. 1 illustrates the conceptual frame-work which the ecosystem service supply–demand assessmentsand mapping have been developed upon.
In this context, the following aims were defined for this paper:
- to present a clear and easy-to-apply concept to map ecosystemservice supply and demand as well as supply and demand bud-gets, to derive a concept that is applicable at different scales forvarious case study regions and that allows for comparison of dif-ferent ecosystem services, and
- to support the development of simple tools for landscape man-agers to support sustainability assessments.
2. Materials and methods
We propose a non-monetary evaluation scheme based on indi-cators which are categorized and mapped in relation to relativesupply/demand scales. The applied method of ecosystem service
supply mapping has been presented before in Burkhard et al.(2009). The ecosystem service demand mapping and the finalecosystem service budgeting are added as new components toecosystem service mapping approaches.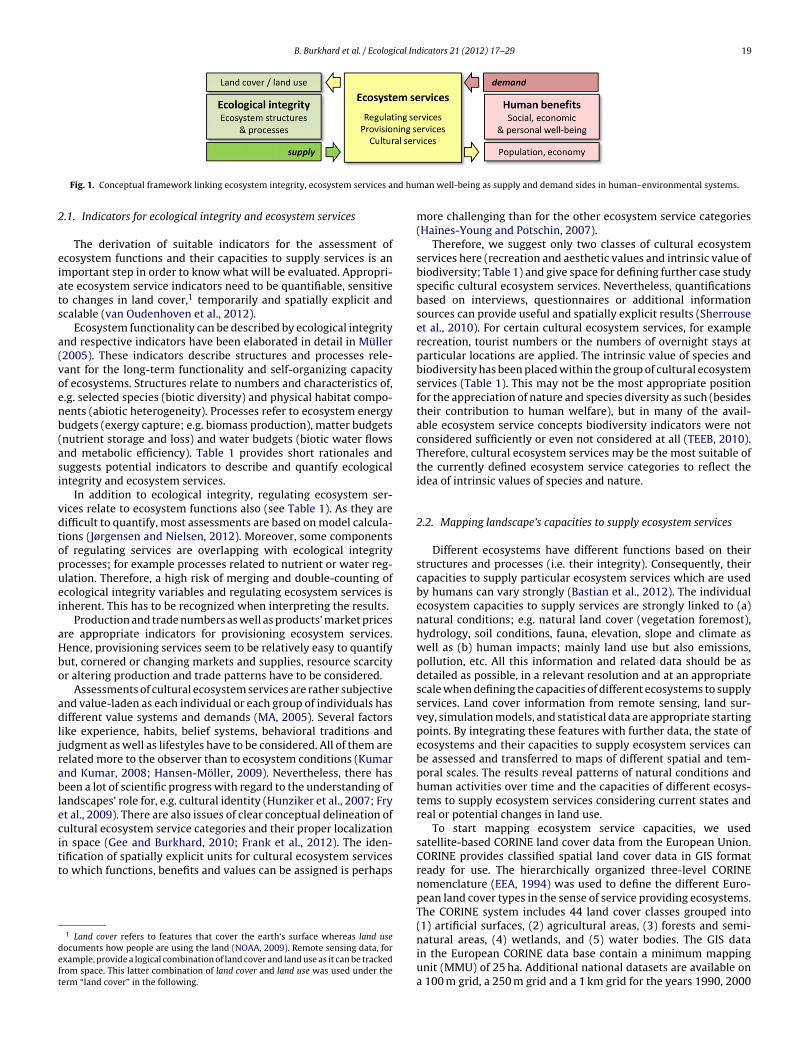
B. Burkhard et al. / Ecological Indicators 21 (2012) 17–29 19
nd hu
2
eiats
a(voenb(asi
vdtopuei
aHbo
adljrablecitt
deft
Fig. 1. Conceptual framework linking ecosystem integrity, ecosystem services a
.1. Indicators for ecological integrity and ecosystem services
The derivation of suitable indicators for the assessment ofcosystem functions and their capacities to supply services is anmportant step in order to know what will be evaluated. Appropri-te ecosystem service indicators need to be quantifiable, sensitiveo changes in land cover,1 temporarily and spatially explicit andcalable (van Oudenhoven et al., 2012).
Ecosystem functionality can be described by ecological integritynd respective indicators have been elaborated in detail in Müller2005). These indicators describe structures and processes rele-ant for the long-term functionality and self-organizing capacityf ecosystems. Structures relate to numbers and characteristics of,.g. selected species (biotic diversity) and physical habitat compo-ents (abiotic heterogeneity). Processes refer to ecosystem energyudgets (exergy capture; e.g. biomass production), matter budgetsnutrient storage and loss) and water budgets (biotic water flowsnd metabolic efficiency). Table 1 provides short rationales anduggests potential indicators to describe and quantify ecologicalntegrity and ecosystem services.
In addition to ecological integrity, regulating ecosystem ser-ices relate to ecosystem functions also (see Table 1). As they areifficult to quantify, most assessments are based on model calcula-ions (Jørgensen and Nielsen, 2012). Moreover, some componentsf regulating services are overlapping with ecological integrityrocesses; for example processes related to nutrient or water reg-lation. Therefore, a high risk of merging and double-counting ofcological integrity variables and regulating ecosystem services isnherent. This has to be recognized when interpreting the results.
Production and trade numbers as well as products’ market pricesre appropriate indicators for provisioning ecosystem services.ence, provisioning services seem to be relatively easy to quantifyut, cornered or changing markets and supplies, resource scarcityr altering production and trade patterns have to be considered.
Assessments of cultural ecosystem services are rather subjectivend value-laden as each individual or each group of individuals hasifferent value systems and demands (MA, 2005). Several factors
ike experience, habits, belief systems, behavioral traditions andudgment as well as lifestyles have to be considered. All of them areelated more to the observer than to ecosystem conditions (Kumarnd Kumar, 2008; Hansen-Möller, 2009). Nevertheless, there haseen a lot of scientific progress with regard to the understanding of
andscapes’ role for, e.g. cultural identity (Hunziker et al., 2007; Fryt al., 2009). There are also issues of clear conceptual delineation ofultural ecosystem service categories and their proper localizationn space (Gee and Burkhard, 2010; Frank et al., 2012). The iden-
ification of spatially explicit units for cultural ecosystem serviceso which functions, benefits and values can be assigned is perhaps1 Land cover refers to features that cover the earth‘s surface whereas land useocuments how people are using the land (NOAA, 2009). Remote sensing data, forxample, provide a logical combination of land cover and land use as it can be trackedrom space. This latter combination of land cover and land use was used under theerm “land cover” in the following.
man well-being as supply and demand sides in human–environmental systems.
more challenging than for the other ecosystem service categories(Haines-Young and Potschin, 2007).
Therefore, we suggest only two classes of cultural ecosystemservices here (recreation and aesthetic values and intrinsic value ofbiodiversity; Table 1) and give space for defining further case studyspecific cultural ecosystem services. Nevertheless, quantificationsbased on interviews, questionnaires or additional informationsources can provide useful and spatially explicit results (Sherrouseet al., 2010). For certain cultural ecosystem services, for examplerecreation, tourist numbers or the numbers of overnight stays atparticular locations are applied. The intrinsic value of species andbiodiversity has been placed within the group of cultural ecosystemservices (Table 1). This may not be the most appropriate positionfor the appreciation of nature and species diversity as such (besidestheir contribution to human welfare), but in many of the avail-able ecosystem service concepts biodiversity indicators were notconsidered sufficiently or even not considered at all (TEEB, 2010).Therefore, cultural ecosystem services may be the most suitable ofthe currently defined ecosystem service categories to reflect theidea of intrinsic values of species and nature.
2.2. Mapping landscape’s capacities to supply ecosystem services
Different ecosystems have different functions based on theirstructures and processes (i.e. their integrity). Consequently, theircapacities to supply particular ecosystem services which are usedby humans can vary strongly (Bastian et al., 2012). The individualecosystem capacities to supply services are strongly linked to (a)natural conditions; e.g. natural land cover (vegetation foremost),hydrology, soil conditions, fauna, elevation, slope and climate aswell as (b) human impacts; mainly land use but also emissions,pollution, etc. All this information and related data should be asdetailed as possible, in a relevant resolution and at an appropriatescale when defining the capacities of different ecosystems to supplyservices. Land cover information from remote sensing, land sur-vey, simulation models, and statistical data are appropriate startingpoints. By integrating these features with further data, the state ofecosystems and their capacities to supply ecosystem services canbe assessed and transferred to maps of different spatial and tem-poral scales. The results reveal patterns of natural conditions andhuman activities over time and the capacities of different ecosys-tems to supply ecosystem services considering current states andreal or potential changes in land use.
To start mapping ecosystem service capacities, we usedsatellite-based CORINE land cover data from the European Union.CORINE provides classified spatial land cover data in GIS formatready for use. The hierarchically organized three-level CORINEnomenclature (EEA, 1994) was used to define the different Euro-pean land cover types in the sense of service providing ecosystems.The CORINE system includes 44 land cover classes grouped into(1) artificial surfaces, (2) agricultural areas, (3) forests and semi-
natural areas, (4) wetlands, and (5) water bodies. The GIS datain the European CORINE data base contain a minimum mappingunit (MMU) of 25 ha. Additional national datasets are available ona 100 m grid, a 250 m grid and a 1 km grid for the years 1990, 2000
20 B. Burkhard et al. / Ecological Indicators 21 (2012) 17–29
Table 1List of ecological integrity and ecosystem service components with rationales and potential indicators.
Rationales Potential indicators
Ecological integrityAbiotic heterogeneity The provision of suitable habitats for different species, for
functional groups of species and for processes is essentialfor the functioning of ecosystems.
Abiotic habitat components’ diversity indices;Heterogeneity indices, e.g. humus contents in the soil;Number/area of habitats
Biodiversity The presence or absence of selected species, (functional)groups of species, biotic habitat components or speciescomposition.
Indicator species representative for a certain phenomenonor sensitive to distinct changes
Biotic water flows Referring to the water cycling affected by plant processesin the system.
Transpiration/total evapotranspiration
Metabolic efficiency Referring to the amount of energy necessary to maintain aspecific biomass, also serving as a stress indicator for thesystem.
Respiration/biomass (metabolic quotient)
Exergy capture The capability of ecosystems to enhance the input ofusable energy. Exergy is derived from thermodynamicsand measures the energy fraction that can be transformedinto mechanical work. In ecosystems, the captured exergyis used to build up biomass (e.g. by primary production)and structures.
Net primary production; Leaf area index LAI
Reduction of nutrient loss Referring to the irreversible output of elements from thesystem, the nutrient budget and matter flows.
Leaching of nutrients, e.g. N, P
Storage capacity Is referring to the nutrient, energy and water budgets ofthe system and the capacity of the system to store themwhen available and to release them when needed.
Solved organic matter; N, Corg in the soil; N, C in biomass
Regulating ecosystem servicesLocal climate regulation Changes in land cover can locally affect temperature, wind,
radiation and precipitation.Temperature, albedo, precipitation, wind; Temperatureamplitudes; Evapotranspiration
Global climate regulation Ecosystems play an important role in climate by eithersequestering or emitting greenhouse gases.
Source-sink of water vapour, methane, CO2
Flood protection Natural elements dampening extreme flood events Number of floods causing damagesGroundwater recharge The timing and magnitude of runoff, flooding, and aquifer
recharge can be strongly influenced by changes in landcover, including, in particular, alterations that change thewater storage potential of the system, such as theconversion of wetlands or the replacement of forests withcroplands or croplands with urban areas.
Groundwater recharge rates
Air quality regulation The capacity of ecosystems to remove toxic and otherelements from the atmosphere.
Leaf area index; Air quality amplitudes
Erosion regulation Vegetative cover plays an important role in soil retentionand the prevention of landslides.
Loss of soil particles by wind or water; vegetation cover
Nutrient regulation The capacity of ecosystems to carry out (re)cycling of, e.g.N, P or others.
N, P or other nutrient turnover rates
Water purification Ecosystems have the capacity to purify water but can alsobe a source of impurities in fresh water.
Water quality and quantity
Pollination Ecosystem changes affect the distribution, abundance, andeffectiveness of pollinators. Wind and bees are in charge ofthe reproduction of a lot of culture plants.
Amount of plant products; Distribution of plants;Availability of pollinators
Provisioning ecosystem servicesCrops Cultivation of edible plants. Plants/ha; kJ/haLivestock Keeping of edible animals. Animals/ha; kJ/haFodder Cultivation and harvest of animal fodder. Fodder plants/ha; kJ/haCapture fisheries Catch of commercially interesting fish species, which are
accessible for fishermen.Fishes available for catch/ha; kJ/ha
Aquaculture Animals kept in terrestrial or marine aquaculture. Number of animals/ha; kJ/haWild foods Harvest of, e.g. berries, mushrooms, wild animal hunting
or fishing.Plant biomass/ha; Animals available/ha; kJ/ha
Timber Presence of trees or plants with potential use for timber. Wood/ha; kJ/haWood fuel Presence of trees or plants with potential use as fuel. Wood or plant biomass/ha; kJ/haEnergy (biomass) Presence of trees or plants with potential use as energy
source.Wood or plant biomass/ha; kJ/ha
Biochemicals and medicine Production of biochemicals, medicines. Amount or number of products; kg/haFreshwater Presence of freshwater. Liters or m3/ha
Cultural ecosystem services (selection)Recreation & aesthetic values Refers specifically to landscape and visual qualities of the
resp. case study area (scenery, scenic beauty). The benefitis the sense of beauty people get from looking at thelandscape and related recreational benefits.
Number of visitors or facilities; Questionnaires on personalpreferences
Intrinsic value of biodiversity The value of nature and species themselves, beyondeconomic or human benefits.
Number of endangered, protected or rare species orhabitats
Based on de Groot et al. (2010), Burkhard et al. (2009), Müller and Burkhard (2007) and MA (2005).+ further case study specific cultural ecosystem services and indictors.
B. Burkhard et al. / Ecological Indicators 21 (2012) 17–29 21
Table 2List of established ecosystem service case studies used as information source for the derivation of the ecosystem service supply and demand assessment; including spatialscales, relative data availability (+++ = excellent, ++ = good, + = sufficient) and References.
Study site Spatial scale Data availability References
Finnish Lapland Regional ++ Vihervaara et al. (2010)Malki Iskar basin, Bulgaria Regional ++ Nedkov and Burkhard, 2012German North Sea Regional +++ Lange et al. (2010); Gee and Burkhard (2010)Schleswig-Holstein (Kielstau, Bornhöved, Ritzerau, Sylt), Germany Local – regional ++ Schmidt (2008)Leipzig-Halle, Germany Regional +++ Kroll et al. (2012)Himalaya, Nepal Regional ++ Tamang (2011)
al regio regio
aErag
tb2oa2oscydtsi(thow
a(wtetTcAtuscesrv
stshoaavc
Thailand RegionThree Gorges Dam, China Local –South East Asia (Vietnam, Malaysisa, Philippines) Local –
nd 2006. Basic CORINE data can be downloaded for free from theEA website (http://dataservice.eea.europa.eu/). Data with higheresolution can be purchased at marginal costs. For the mappingpproach presented in this paper, CORINE data sets in ArcGIS poly-on format with 25 ha MMU were applied.
One main problem in almost all ecosystem service evaluations ishe identification of appropriate indicators and data to quantify theroad range of ecosystem services (Seppelt et al., 2011; Wallace,007). One solution can be to make use of expert evaluations inrder to gain an overview and see trends for ecosystem servicessessments (Burkhard et al., 2009; Scolozzi et al., 2012; Busch et al.,012). The general assessment approach presented here is basedn values which were derived mainly by the authors as hypothe-es linking different land cover types with ecosystem service supplyapacities and demands for ecosystem services. In subsequent anal-ses, the expert evaluation values can successively be replaced byata from monitoring, measurements, computer-based modeling,argeted interviews or statistics. This has been done successfully ineveral case studies on regional scales; like the example presentedn Section 2.5, in Vihervaara et al. (2010), Nedkov and Burkhard2012) or Burkhard et al. (2009). Table 2 provides an overview onhe case studies where comparable ecosystem service assessmentsave been carried out. Maes et al. (2011) applied a similar approachn a continental scale, developing an ecosystem service atlas forhole Europe.
We suggest a matrix linking 7 ecological integrity indicatorsnd 22 ecosystem services (on the x-axis) to 44 land cover typeson the y-axis). The selection of the ecological integrity indicatorsas based on Müller (2005); because these indicators represent
he main components of ecosystem functionality. Our selection ofcosystem services is based on a combination of different ecosys-em service lists provided in recent literature (de Groot et al., 2010;EEB, 2010; Müller and Burkhard, 2007; MA, 2005). The 44 landover classes originate from the CORINE nomenclature (EEA, 1994).t the intersections (altogether 1276), the different land cover
ypes’ capacities to support ecological integrity or to provide partic-lar services were assessed (first qualitatively; in the following casetudy also quantitatively) on a scale consisting of: 0 = no relevantapacity of the particular land cover type to support the selectedcological integrity component or to supply the selected ecosystemervice, 1 = low relevant capacity, 2 = relevant capacity, 3 = mediumelevant capacity, 4 = high relevant capacity and 5 = very high rele-ant capacity (Fig. 2).
The matrix values are based on experience from different casetudies in different European regions (see list in Table 2) and haveo be considered as hypotheses of possible capacities of ecosystemervice provision (Burkhard et al., 2009). Naturally, there is aigh dependence on the observer’s experience, knowledge andbjectivity which service supplies are supposed to be relevant
nd how to value them. However, this relative 0–5 scale offersway of evaluating alternatively to monetary accounting oralue-transfer methods. Nevertheless, the values will be checkedarefully in further case studies and substituted by numbers
+++ Graterol (2011)nal + Still to be writtennal + Still to be written
from respective research, monitoring or statistics wheneveravailable.
Fig. 2 reveals rather high capacities of many near-natural landcover types (forests, wetlands, water bodies, green urban areas,certain agricultural areas) to support ecological integrity. Highcapacities to provide several ecosystem services can be foundfor the different forest land cover types, peatlands, moors andheathlands. The highly human-modified land cover types (urbanfabric, industrial or commercial areas, mineral extraction and dumpsites) have very low or no relevant capacities to support ecologi-cal integrity or to provide regulating and provisioning ecosystemservices. A similar trend was found for cultural ecosystem serviceswhich is consistent with several studies on human perception andpreferences of landscapes. For instance, Hartig and Staats (2006)carried out experiments on human preferences of landscapes forrecreation (i.e. recovery, reflection and social stimulation). Theyfound a clear preference of natural landscapes (forests in theirstudy) compared to urban areas. Palmer (2004) applied land-scape metrics (landscape composition and configuration) to predictpeople’s perception of landscapes, thus adding behavioral and per-ceptual components into landscape pattern analyses. The resultsshowed a clear preference of “natural-appearing” landscapes withcomplex patterns of edges.
By linking the 0–5 values to appropriate spatial data in GIS,estimates of ecosystem service supply can be mapped in spatiallyexplicit units of similar biophysical settings (e.g. land cover types incombination with soil types, hydrological and climatic conditions).In the GIS, the ecosystem service supply matrix (Fig. 2) was joinedwith the polygon attribute table using the CORINE land cover codefield as common identifier field. The following case study applica-tion will apply the procedure described above for an example ofenergy provisioning ecosystem services.
2.3. Mapping human demands for ecosystem services
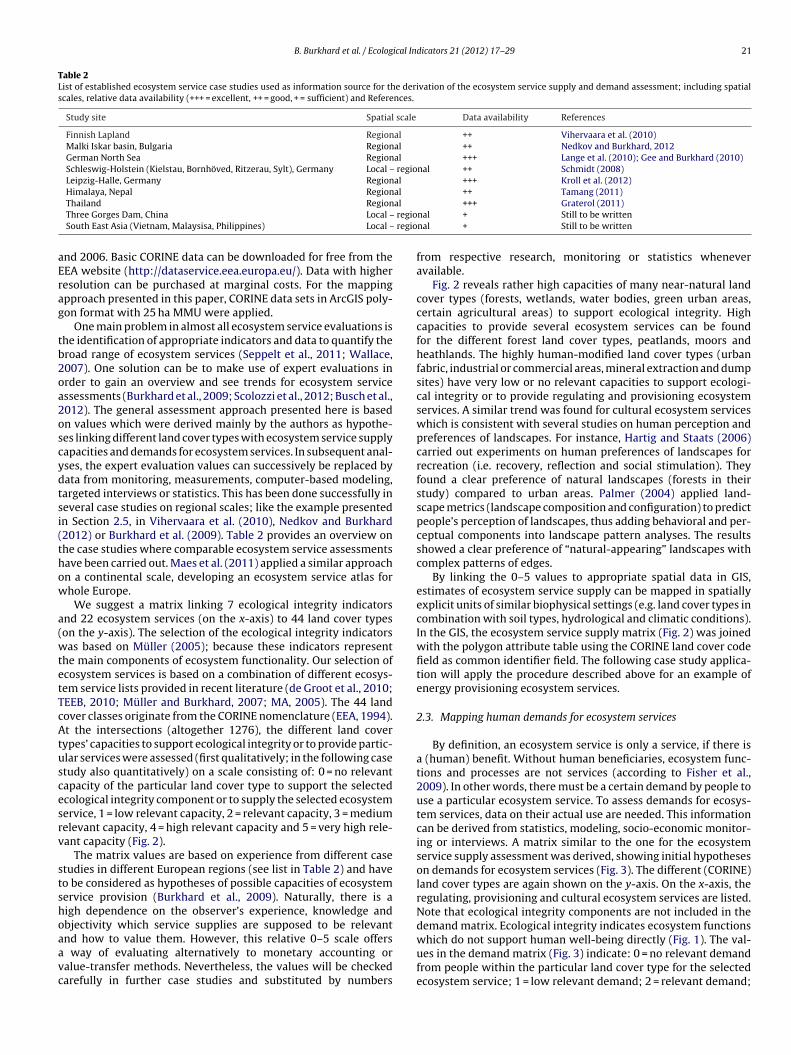
By definition, an ecosystem service is only a service, if there isa (human) benefit. Without human beneficiaries, ecosystem func-tions and processes are not services (according to Fisher et al.,2009). In other words, there must be a certain demand by people touse a particular ecosystem service. To assess demands for ecosys-tem services, data on their actual use are needed. This informationcan be derived from statistics, modeling, socio-economic monitor-ing or interviews. A matrix similar to the one for the ecosystemservice supply assessment was derived, showing initial hypotheseson demands for ecosystem services (Fig. 3). The different (CORINE)land cover types are again shown on the y-axis. On the x-axis, theregulating, provisioning and cultural ecosystem services are listed.Note that ecological integrity components are not included in thedemand matrix. Ecological integrity indicates ecosystem functions
which do not support human well-being directly (Fig. 1). The val-ues in the demand matrix (Fig. 3) indicate: 0 = no relevant demandfrom people within the particular land cover type for the selectedecosystem service; 1 = low relevant demand; 2 = relevant demand;
22 B. Burkhard et al. / Ecological Indicators 21 (2012) 17–29
F to sup( rosy =
c apaci
35
t(cmlalipet
2
ooabngttw(
ig. 2. Assessment matrix illustrating the capacities of different land cover classes
the three columns at right). The values/colors indicate the following capacities:0/apacity; 3/yellow green = medium relevant capacity; 4/blue green = high relevant c
= medium relevant demand; 4 red = high relevant demand; and = very high relevant demand.
The matrix of Fig. 3 clearly shows that demands for ecosys-em services are highest in human-dominated land cover typesin the upper part of the matrix). The highest demand valuesan be found in the urban, industrial and commercial areas. Theore near-natural land cover types are characterized by generally
ower population numbers and less ecosystem service-consumingctivities and consequently, lower demand rates. The agriculturaland cover types show characteristic high demands for regulat-ng ecosystem services (e.g. nutrient regulation, water purification,ollination). Using similar spatially explicit units as during thecosystem service supply assessment, respective maps of ecosys-em services demands can be produced.
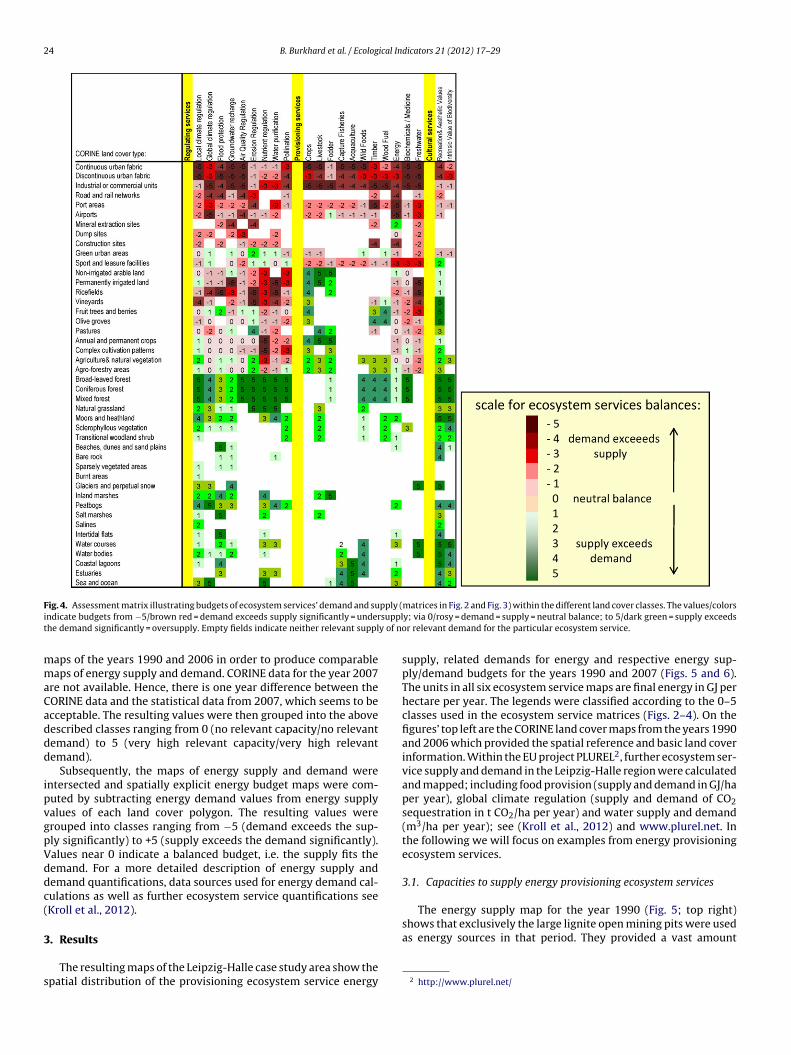
.4. Mapping budgets of ecosystem services’ supply and demand
For analyzing source and sink dynamics and to identify flowsf goods and services, the information in the matrixes and mapsf ecosystem service supply and demand can be merged. Supplynd demands have to be quantified in the same units in order toe comparable. If the same units are not applicable, different unitseed to be reclassified into the relative 0–5 scale. As a result weet budgets of ecosystem service supply and demand. Fig. 4 shows
he corresponding matrix of ecosystem service budgets withinhe different land cover classes. Each field in the budget matrixas calculated based on the corresponding field in the supplyFig. 2) and the demand matrix (Fig. 3). The scale ranges from
port ecological integrity (column at the left side) and to supply ecosystem servicesno relevant capacity; 1/grey green = low relevant capacity; 2/light green = relevantty; and 5/dark green = very high relevant capacity (after Burkhard et al., 2009).
−5 = demand exceeds supply significantly = strong undersupply;via 0 = demand = supply = neutral balance; to 5 = supply exceeds thedemand significantly = strong oversupply. Empty fields indicatethat there is neither a relevant supply of nor a relevant demand forthe particular ecosystem service. For more detailed information onactual supply–demand patterns including specific areas of supplyand demand, an ecosystem service footprint could be calculated.
The pattern emerging in Fig. 4 indicates that there is an obvi-ous undersupply of ecosystem services in the human-dominatedland cover types, especially in the urban, industrial or commercialareas. The more near-natural land cover types again, and especiallythe forested areas, are characterized by many ecosystem services’supplies exceeding their demands.
2.5. Exemplary quantification of energy supply and demand inthe rural-urban region Leipzig-Halle
As an example for a detailed quantitative assessment ofecosystem service supply and demand, we calculated the pro-visioning ecosystem service “energy” for the rural-urban regionLeipzig-Halle in Eastern Germany. Rural-urban regions reflecttoday’s complex interactions and dependencies between differentspatial categories within urban agglomerations. They are definedas being composed of the urban area, the peri-urban area and
the rural hinterland (Ravetz et al., 2010). Being situated in theformer German Democratic Republic, the Leipzig-Halle regionexperienced severe societal, economic, demographic and land userelated changes during the post-socialist transition period after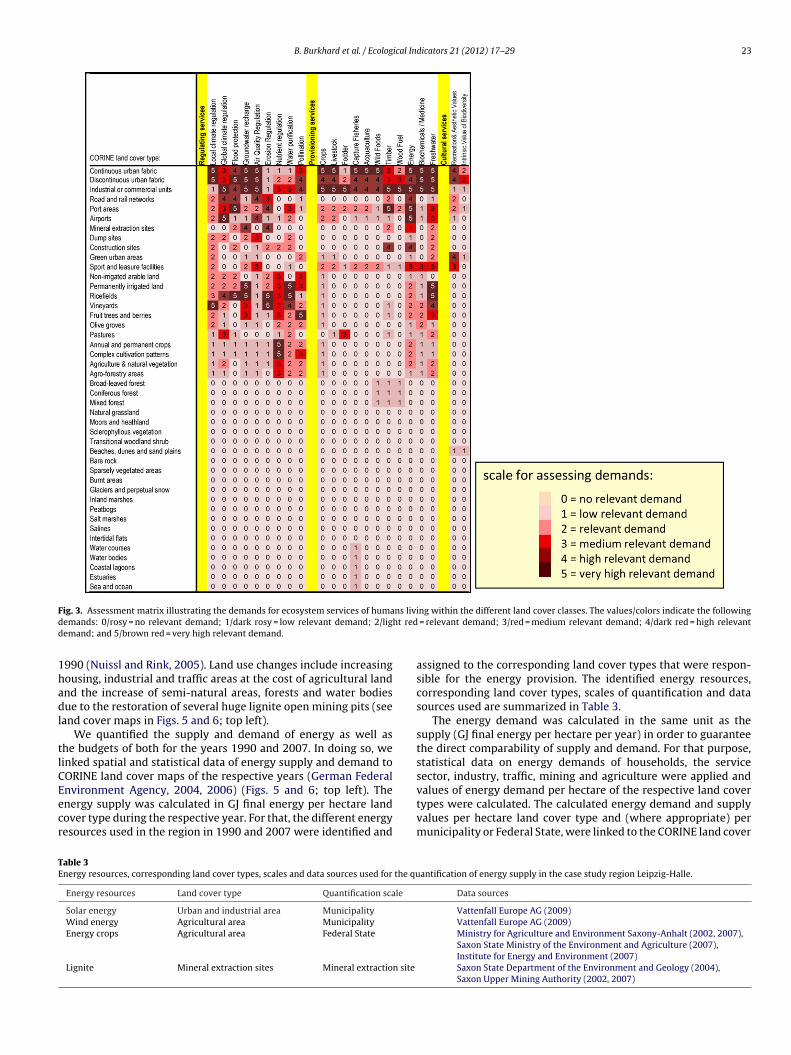
B. Burkhard et al. / Ecological Indicators 21 (2012) 17–29 23
F ns livid ht redd
1hadl
tlCEecr
TE
ig. 3. Assessment matrix illustrating the demands for ecosystem services of humaemands: 0/rosy = no relevant demand; 1/dark rosy = low relevant demand; 2/ligemand; and 5/brown red = very high relevant demand.
990 (Nuissl and Rink, 2005). Land use changes include increasingousing, industrial and traffic areas at the cost of agricultural landnd the increase of semi-natural areas, forests and water bodiesue to the restoration of several huge lignite open mining pits (see
and cover maps in Figs. 5 and 6; top left).We quantified the supply and demand of energy as well as
he budgets of both for the years 1990 and 2007. In doing so, weinked spatial and statistical data of energy supply and demand toORINE land cover maps of the respective years (German Federal
nvironment Agency, 2004, 2006) (Figs. 5 and 6; top left). Thenergy supply was calculated in GJ final energy per hectare landover type during the respective year. For that, the different energyesources used in the region in 1990 and 2007 were identified andable 3nergy resources, corresponding land cover types, scales and data sources used for the qu
Energy resources Land cover type Quantification scale
Solar energy Urban and industrial area Municipality
Wind energy Agricultural area Municipality
Energy crops Agricultural area Federal State
Lignite Mineral extraction sites Mineral extraction site
ng within the different land cover classes. The values/colors indicate the following = relevant demand; 3/red = medium relevant demand; 4/dark red = high relevant
assigned to the corresponding land cover types that were respon-sible for the energy provision. The identified energy resources,corresponding land cover types, scales of quantification and datasources used are summarized in Table 3.
The energy demand was calculated in the same unit as thesupply (GJ final energy per hectare per year) in order to guaranteethe direct comparability of supply and demand. For that purpose,statistical data on energy demands of households, the servicesector, industry, traffic, mining and agriculture were applied and
values of energy demand per hectare of the respective land covertypes were calculated. The calculated energy demand and supplyvalues per hectare land cover type and (where appropriate) permunicipality or Federal State, were linked to the CORINE land coverantification of energy supply in the case study region Leipzig-Halle.
Data sources
Vattenfall Europe AG (2009)Vattenfall Europe AG (2009)Ministry for Agriculture and Environment Saxony-Anhalt (2002, 2007),Saxon State Ministry of the Environment and Agriculture (2007),Institute for Energy and Environment (2007)Saxon State Department of the Environment and Geology (2004),Saxon Upper Mining Authority (2002, 2007)
24 B. Burkhard et al. / Ecological Indicators 21 (2012) 17–29
F pply (i supplt y of no
mmaCaddd
ipvgpVddc(
3
s
The energy supply map for the year 1990 (Fig. 5; top right)shows that exclusively the large lignite open mining pits were used
ig. 4. Assessment matrix illustrating budgets of ecosystem services’ demand and sundicate budgets from −5/brown red = demand exceeds supply significantly = underhe demand significantly = oversupply. Empty fields indicate neither relevant suppl
aps of the years 1990 and 2006 in order to produce comparableaps of energy supply and demand. CORINE data for the year 2007
re not available. Hence, there is one year difference between theORINE data and the statistical data from 2007, which seems to becceptable. The resulting values were then grouped into the aboveescribed classes ranging from 0 (no relevant capacity/no relevantemand) to 5 (very high relevant capacity/very high relevantemand).
Subsequently, the maps of energy supply and demand werentersected and spatially explicit energy budget maps were com-uted by subtracting energy demand values from energy supplyalues of each land cover polygon. The resulting values wererouped into classes ranging from −5 (demand exceeds the sup-ly significantly) to +5 (supply exceeds the demand significantly).alues near 0 indicate a balanced budget, i.e. the supply fits theemand. For a more detailed description of energy supply andemand quantifications, data sources used for energy demand cal-ulations as well as further ecosystem service quantifications seeKroll et al., 2012).
. Results
The resulting maps of the Leipzig-Halle case study area show thepatial distribution of the provisioning ecosystem service energy
matrices in Fig. 2 and Fig. 3) within the different land cover classes. The values/colorsy; via 0/rosy = demand = supply = neutral balance; to 5/dark green = supply exceedsr relevant demand for the particular ecosystem service.
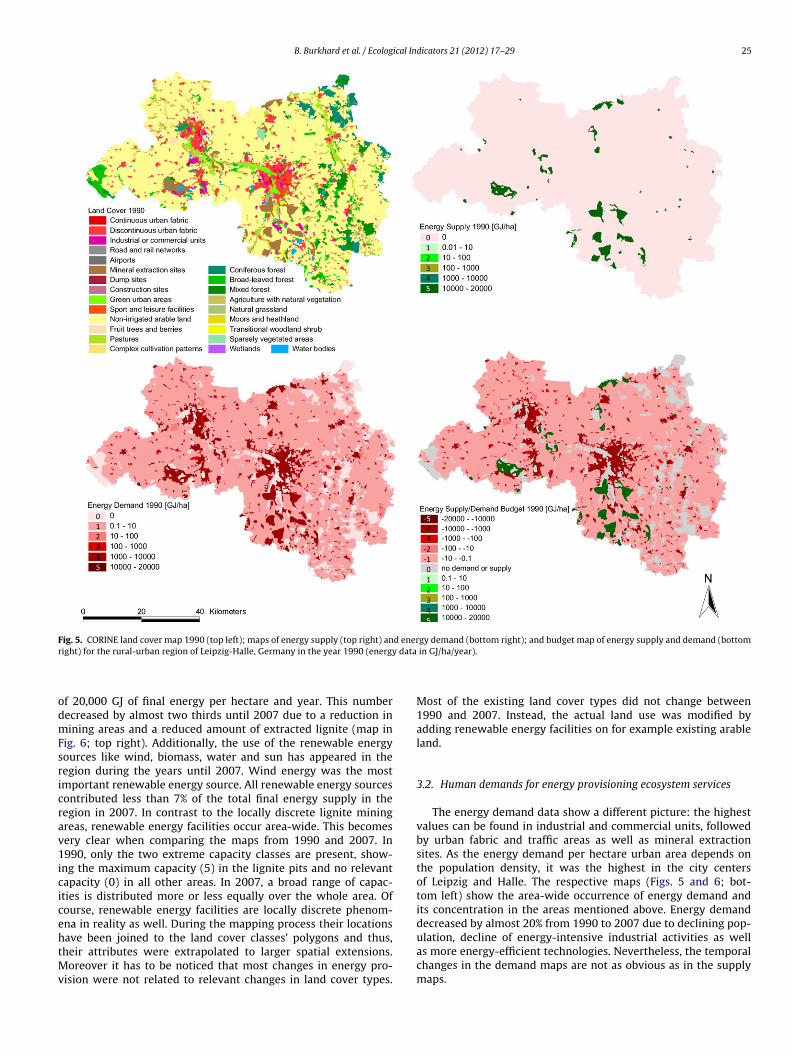
supply, related demands for energy and respective energy sup-ply/demand budgets for the years 1990 and 2007 (Figs. 5 and 6).The units in all six ecosystem service maps are final energy in GJ perhectare per year. The legends were classified according to the 0–5classes used in the ecosystem service matrices (Figs. 2–4). On thefigures’ top left are the CORINE land cover maps from the years 1990and 2006 which provided the spatial reference and basic land coverinformation. Within the EU project PLUREL2, further ecosystem ser-vice supply and demand in the Leipzig-Halle region were calculatedand mapped; including food provision (supply and demand in GJ/haper year), global climate regulation (supply and demand of CO2sequestration in t CO2/ha per year) and water supply and demand(m3/ha per year); see (Kroll et al., 2012) and www.plurel.net. Inthe following we will focus on examples from energy provisioningecosystem services.
3.1. Capacities to supply energy provisioning ecosystem services
as energy sources in that period. They provided a vast amount
2 http://www.plurel.net/
B. Burkhard et al. / Ecological Indicators 21 (2012) 17–29 25
Fig. 5. CORINE land cover map 1990 (top left); maps of energy supply (top right) and energy demand (bottom right); and budget map of energy supply and demand (bottomr data
odmFsricrav1icicehtMv
ight) for the rural-urban region of Leipzig-Halle, Germany in the year 1990 (energy
f 20,000 GJ of final energy per hectare and year. This numberecreased by almost two thirds until 2007 due to a reduction inining areas and a reduced amount of extracted lignite (map in
ig. 6; top right). Additionally, the use of the renewable energyources like wind, biomass, water and sun has appeared in theegion during the years until 2007. Wind energy was the mostmportant renewable energy source. All renewable energy sourcesontributed less than 7% of the total final energy supply in theegion in 2007. In contrast to the locally discrete lignite miningreas, renewable energy facilities occur area-wide. This becomesery clear when comparing the maps from 1990 and 2007. In990, only the two extreme capacity classes are present, show-
ng the maximum capacity (5) in the lignite pits and no relevantapacity (0) in all other areas. In 2007, a broad range of capac-ties is distributed more or less equally over the whole area. Ofourse, renewable energy facilities are locally discrete phenom-na in reality as well. During the mapping process their locations
ave been joined to the land cover classes’ polygons and thus,heir attributes were extrapolated to larger spatial extensions.oreover it has to be noticed that most changes in energy pro-ision were not related to relevant changes in land cover types.
in GJ/ha/year).
Most of the existing land cover types did not change between1990 and 2007. Instead, the actual land use was modified byadding renewable energy facilities on for example existing arableland.
3.2. Human demands for energy provisioning ecosystem services
The energy demand data show a different picture: the highestvalues can be found in industrial and commercial units, followedby urban fabric and traffic areas as well as mineral extractionsites. As the energy demand per hectare urban area depends onthe population density, it was the highest in the city centersof Leipzig and Halle. The respective maps (Figs. 5 and 6; bot-tom left) show the area-wide occurrence of energy demand andits concentration in the areas mentioned above. Energy demanddecreased by almost 20% from 1990 to 2007 due to declining pop-
ulation, decline of energy-intensive industrial activities as wellas more energy-efficient technologies. Nevertheless, the temporalchanges in the demand maps are not as obvious as in the supplymaps.
26 B. Burkhard et al. / Ecological Indicators 21 (2012) 17–29
F d enerr data
3a
brrabvaiyasoadst
ig. 6. CORINE land cover map 2006 (top left); maps of energy supply (top right) anight) for the rural-urban region of Leipzig-Halle, Germany in the year 2007 (energy
.3. Budgets of energy provisioning ecosystem services’ supplynd demand
The energy provisioning ecosystem services supply–demandudget maps indicate dynamics in the production-consumptionespectively source-sink patterns. In the year 1990 (Fig. 5; bottomight), when lignite was the only energy supplier in the region,ll areas in the region (except the mineral extraction sites) cane characterized as sinks of energy provisioning ecosystem ser-ices. Especially the urban, industrial and commercial areas butlso the rural regions were dependent on flows of energy suppliedn only one land cover type. A different pattern emerges for theear 2007 (Fig. 6; bottom right). Even though the urban, industrialnd commercial areas are still remarkable sinks of energy provi-ioning services, the amount and spatial extension of areas withversupply of energy have been increasing significantly due to the
rea-wide use of renewable energy sources. In combination withecreasing energy demands, the former dependence on only oneource of energy supply could be reduced on the one hand. Onhe other hand, several open pit mining areas were closed downgy demand (bottom right); and budget map of energy supply and demand (bottom in GJ/ha/year).
between 1990 and 2007 (compare the CORINE land cover maps inFigs. 5 and 6; top left), reducing the energy supply by lignite.
4. Discussion
The maps illustrate the temporal dynamics of the spatial supplyand demand distributions in the case study area using the exampleof energy provisioning ecosystem services for 1990 and 2007. Forsome land cover types, the case study capacity values do not matchexactly with the initial hypotheses values provided for energy pro-vision in the ecosystem service supply matrix (Fig. 2; for examplegreen urban areas). However, the majority of hypotheses valueswere corroborated.
Supplementary data from statistics can improve the interpreta-tion of the maps. For example, calculations of supply/demand ratiosfor the energy provisioning ecosystem services provide information
on the total budget and the energy self-sufficiency of the wholecase study region. The supply/demand ratio was above 1 in 1990,indicating that the energy supply (solely based on lignite) in theregion was higher than the demand (data references can be found
ical In
ibFad(
rdeaa(efptabipah
erpmppboaar(sttw
iocTswbotoaefcputle
sniit
B. Burkhard et al. / Ecolog
n Table 3). Then, several open pit mining areas were closed downetween 1990 and 2007 (compare the CORINE land cover maps inigs. 5 and 6; top left) and the lignite output has been reduced. As
consequence, the whole case study region’s supply/demand ratioeclined to 0.5, indicating a clear dependence on energy importsdata references in Table 3).
There is an ongoing debate within the ecosystem serviceesearch community on whether natural resources are to beenoted as ecosystem services or not. Lignite (fossil fuels in gen-ral), wind as well as solar energy have for example been denoteds usually non-renewable abiotic resources which can neither bettributed to specific ecosystems nor be called ecosystem servicesde Groot et al., 2002). We do not agree with this as wind and solarnergy are renewable inexhaustible natural services. In the case ofossil fuels we conclude that it is actually depending on the tem-oral perspective (exchangeable by or in combination with higheremperature and pressure), whether a resource is called renew-ble or not. The production function “raw materials” was definedy de Groot et al. (2002; p. 396) as “the conversion of solar energy
nto biomass for human use”, which is exactly what initially tooklace during fossil fuel formation. Therefore we suggest denotingll goods and services provided by every natural system to benefituman well-being as ecosystem goods and services.
Looking at our ecosystem service mapping approach in gen-ral, several points worth discussing emerge. One major issue, noteally addressed yet, refers to questions related to spatial and tem-oral scales. Considering our approach to be a generic conceptualodel, it can be applied at any scale and would use data appro-
riate to the scale of analysis. Nevertheless, resolutions reflectingeculiarity of the given habitats and temporal dynamics have toe chosen. It seems like the CORINE data set and statistics basedn annual values are suitable starting points. For more detailednalyses, further data with higher spatial (e.g. land survey data,irphotos, topographic maps) and temporal (seasonal or monthly)esolution could be used. With regard to the values in the matricesFigs. 2–4), it has to be taken into account that no real weightingystem between the different services was applied. Therefore, alsohe calculated sums for the different ecosystem service groups inhe matrices provide only an overview on total service provisionith only limited accuracy when used for detailed interpretation.
One major shortcoming in the maps presented for our case studys the inherent scale mismatch between supply and demand. On thene hand, the supply of energy provisioning ecosystem servicesould explicitly be related to respective supplying spatial units.he demand for energy on the other hand was based on data onpatially explicit final energy consumption but did not considerhere this energy was actually generated. Hence, real energy flows
etween areas of supply and demands cannot be calculated basedn this information. Especially with today’s globalized trade sys-ems including intercontinental cables, pipelines and trade routes,rigins and transport paths of a broad range of ecosystem servicesre difficult to track. This is especially the case for provisioningcosystem goods and services (food, energy, material). Ecosystemunctions (ecological integrity) and regulating services are oftenharacterized by more or less physically connected areas of sup-ly and demand. Most of these functions and services have to betilized or consumed at the same or a nearby locality from wherehey are supplied, e.g. biomass production based on exergy capture,arge scale soil formation, (natural) pollination, nutrient regulation,rosion control or flood regulation; (Nedkov and Burkhard, 2012).
Nevertheless, there are also regulating ecosystem services withcale mismatches and delocalized causes and effects. One promi-
ent example is global climate regulation, where a global demands supplied by local ecosystem functions. Another tricky points the proper assessment of cultural ecosystem services. Despitehe rather common (but nevertheless still not solved) difficulties
dicators 21 (2012) 17–29 27
inherent to all intangible service assessments (Vejre et al., 2010;Gee and Burkhard, 2010), we encountered additional problemswhen defining spatial units of actual cultural ecosystem service“consumption”. Are benefits like recreation, education or spiritualenrichment consumed immediately at the place of their supply orare they taken home to the place where people live for the mosttime of the year? For the moment we decided to apply a consistentway of thinking as for the other ecosystem services. Thus, peo-ple’s home places are defined as spatial units of ecosystem servicebenefits, also with regard to cultural ecosystem services.
5. Conclusion
Mapping ecosystem service supply and demand and especiallythe quantifying information behind these maps are importantcontributions toward the applications of the ecosystem serviceapproach in science as well as in practice. Today’s ecosystem servicedemand and consumption are far from being driven by actual sup-ply; maps can help to visualize this mismatch. Certainly the demandside has been neglected in most ecosystem service studies so far,perhaps as data on demands are more difficult to collect than dataon production or costs (Ellis and Fisher, 1987). By adding ecosystemservice demand and budget matrices and corresponding maps toour approach on ecosystem service supply maps presented before(Burkhard et al., 2009), we hope to initiate further discussions andto foster the development of appropriate tools.
Starting with matrices (as presented above) which are filled byexpert evaluations provides a rather easy tool to begin the ecosys-tem service assessments with. Expert hypotheses deliver a goodoverview and “even imperfect measures of their [ecosystem ser-vices] value, if understood as such, are better than simply ignoringecosystem services altogether, as is generally done in decision mak-ing today” (Daily, 1997, p. 8). Levels of complexity and data accuracycan then be increased successively. By using a “neutral” relativescale (0–5), value-laden units (such as monetary terms) can beavoided and a variety of data sources (e.g. monitoring, statistics,expert judgment, literature review, on-site assessment) can be har-monized.
The selection of appropriate temporal and spatial scales as wellas appropriate system borders is crucial for ecosystem serviceassessments. For mainly imported services (e.g. in urban regions),a concept of ecosystem service footprints should be developed. Forlocal or regional decision making, trade-offs between the particularservices can be calculated. For example in our Leipzig-Halle casestudy, the increase of energy crop cultivation negatively impactsthe regional food production. The decreased lignite extractionagain negatively influences the energy, but positively influencesthe water supply (Kroll et al., 2012).
Besides the case study presented here, this assessment andmapping approach has already been applied in further case stud-ies (see Table 2). These applications showed that one mainobstacle in the evaluation of ecosystem services is the lack ofappropriate data for the quantification of the individual services’supply and demand. Therefore, the development of correspondingresearch projects, monitoring schemes, capacity building and fur-ther national ecosystem service assessments is suggested in orderto implement the concept of ecosystem services as a solution forhuman–environmental problems and to provide a better data basefor the mapping of ecosystem services.
Acknowledgement
The work on the Leipzig-Halle case study was financially sup-ported by the EU Integrated Project PLUREL (contract no. 036921).
2 ical In
R
B
B
B
B
B
B
B
C
D
D
D
d
d
E
E
E
F
F
F
F
F
G
G
G
G
H
H
H
H
H
H
8 B. Burkhard et al. / Ecolog
eferences
astian, O., Haase, D., Grunewald, K., 2012. Ecosystem properties, potentials andservices – The EPPS conceptual framework and an urban application example.Ecological Indicators 21, 7–16.
oyd, J., Banzhaf, S., 2007. What are ecosystem services? Ecological Economics 63(2–3), 616–626.
urkhard, B., Kroll, F., 2010. Maps of ecosystem services, supply and demand.In: Cleveland, C.J. (Ed.), Encyclopedia of Earth, Environmental Infor-mation Coalition,. National Council for Science and the Environment,Washington, D.C (accessed February 2011) http://www.eoearth.org/article/Maps of ecosystem services, supply and demand.
urkhard, B., Müller, F., 2008. Indicating human–environmental system properties:case study northern Fenno-Scandinavian Reindeer Herding. Ecological Indica-tors 8, 828–840.
urkhard, B., Kroll, F., Müller, F., Windhorst, W., 2009. Landscapes’ capacities toprovide ecosystem services – a concept for land-cover based assessments. Land-scape Online 15, 1–22.
urkhard, B., Petrosillo, I., Costanza, R., 2010. Ecosystem services – bridging ecology,economy and social sciences. Ecological Complexity 7, 257–259.
usch, M., La Notte, A., Laporte, V., Erhard, M., 2012. Potentials of quantitative andqualitative approaches to assessing ecosystem services. Ecological Indicators 21,89–103.
urran, S.R., de Sherbinin, A., 2004. Completing the picture: the challenges of bring-ing “consumption” into the population-environment equation. Population andEnvironment 26 (2), 107–131.
aily, G.C. (Ed.), 1997. Nature’s Services: Societal Dependence on Natural Ecosys-tems. Island Press.
aily, G.C., Matson, P.A., 2008. Ecosystem services: from theory to implementation.Proceedings of the National Academy of Sciences of the United States of America105 (28), 9455–9456.
aily, G.C., Polasky, S., Goldstein, J., Kareiva, P.M., Mooney, H.A., Pejchar, L., Ricketts,T.H., Salzman, J., Shallenberger, R., 2009. Ecosystem services in decision-making:time to deliver. Frontiers in Ecology and the Environment 7 (1), 21–28.
e Groot, R.S., Wilson, M.A., Boumans, R.M.J., 2002. A typology for the classification,description and valuation of ecosystem functions, goods and services. EcologicalEconomics 41 (3), 393–408.
e Groot, R.S., Alkemade, R., Braat, L., Hein, L., Willemen, L., 2010. Challenges inintegrating the concept of ecosystem services and values in landscape planning,management and decision making. Ecological Complexity 7, 260–272.
EA, 1994. Corine Land Cover Report – Part 2: Nomenclature. http://www.eea.europa.eu/publications/COR0-part2 (accessed January 2011).
EA, 2010. Ecosystem accounting and the cost of biodiversity losses. The case ofcoastal Mediterranean wetlands. EEA Technical report No 3/2010, Copenhagen.91pp.
llis, G.M., Fisher, A.C., 1987. Valuing the environment as input. Journal of Environ-mental Management 25, 149–156.
arber, S.C., Costanza, R., Wilson, M.A., 2002. Economic and ecological concepts forvaluing ecosystem services. Ecological Economics 41, 375–392.
isher, B., Turner, R.K., 2008. Ecosystem services: classification for valuation. Biolog-ical Conservation 141, 1167–1169.
isher, B., Turner, R.K., Morling, P., 2009. Defining and classifying ecosystem servicesfor decision making. Ecological Economics 68, 643–653.
rank, S., Fürst, C., Koschke, L., Makeschin, F., 2012. A ontribution towards a transferof the ecosystem service concept to landscape planning using landscape metrics.Ecological Indicators 21, 30–38.
ry, G., Tveit, M.S., Ode, Å., Velarde, M.D., 2009. The ecology of visual landscapes:exploring the conceptual common ground of visual and ecological landscapeindicators. Ecological Indicators 9, 933–947.
ee, K., Burkhard, B., 2010. Cultural ecosystem services in the context of offshorewind farming: a case study from the west coast of Schleswig-Holstein. EcologicalComplexity 7/3, 349–358.
erman Federal Environment Agency, DLR, DFD, 2004. CORINE Land Cover 2000.Daten zur Bodenbedeckung Deutschland (DVD; in German).
erman Federal Environment Agency, German Aerospace Center, 2010. CORINELand Cover 2006. [online] http://www.corine.dfd.dlr.de/intro de.html (accessedFebruary 2010).
raterol, R., 2011. The utility of the ecosystem services approach in disaster riskreduction: a case study in the Phang-Nga province, Thailand. M.Sc. Thesis, Uni-versity of Kiel. 163pp.
aines-Young, R., Potschin, M., 2007. The ecosystem concept and the identificationof ecosystem goods and services in the English policy context. Review Paper toDefra, Project Code NR0107.
aines-Young, R.H., Potschin, M.P., 2010. The links between biodiversity, ecosys-tem services and human well-being. In: Raffaelli, D., Frid, C. (Eds.), EcosystemEcology: a new synthesis. BES Ecological Reviews Series. CUP, Cambridge, 172pp.
aines-Young, R., Potschin, M., Kienast, F., 2012. Indicators of ecosystem servicepotential at European scales: mapping marginal changes and trade-offs. Ecolog-ical Indicators 21, 39–53.
ansen-Möller, J., 2009. Natursyns model: a conceptual framework and method foranalysing and comparing views of nature. Landscape and Urban Planning 89
(3–4), 65–74.artig, T., Staats, H., 2006. The need for psychological restoration as a determinant ofenvironmental preferences. Journal of Environmental Psychology 26, 215–226.
unziker, M., Buchecker, M., Hartig, T., 2007. Space and place – two aspects ofthe human–landscape relationship. In: Kienast, F., Ghosh, S., Wildi, O. (Eds.),
dicators 21 (2012) 17–29
A Changing World: Challenges for Landscape Research. Springer, Dordrecht, pp.47–62.
Institute for Energy and Environment, 2007. Schlüsseldaten Klimagasemissionen(online; in German). www.ufop.de/downloads/Bericht Klimagas.pdf (accessedJanuary 2009).
Jørgensen, S.E., Nielsen, S.N., 2012. Tool boxes for an integrated ecological and envi-ronmental management. Ecological Indicators 21, 104–109.
Kienast, F., Bolliger, J., Potschin, M., de Groot, R.S., Verburg, P.H., Heller, I., Wascher,D., Haines-Young, R., 2009. Assessing landscape functions with broad-scale envi-ronmental data: insights gained from a prototype development for Europe.Environmental Management 44, 1099–1120.
Koschke, L., Fürst, C., Frank, S., Makeschin, F., 2012. A multi-criteria approach foran integrated land cover based assessment of ecosystem services provision.Ecological Indicators 21, 54–66.
Kroll, F., Müller, F., Haase, D., Fohrer, N., 2012. Rural-urban gradient analysis ofecosystem services supply and demand dynamics. Land Use Policy 29 (3),521–535.
Kumar, M., Kumar, P., 2008. Valuation of the ecosystem services: a psycho-culturalperspective. Ecological Economics 64, 808–819.
Lange, M., Burkhard, B., Garthe, S., Gee, K., Kannen, A., Lenhart, H., Windhorst, W.(Eds.), 2010. Analyzing Coastal and Marine Changes: Offshore Wind Farming asa Case Study, vol. 36. LOICZ Research & Studies, p. 214.
Ludwig, D., 2000. Limitations of economic valuation of ecosystems. Ecosystems 3,31–35.
MA (Millennium Ecosystem Assessment), 2005. Ecosystems and Human Well-being:Synthesis. Island Press/World Resources Institute, Washington, DC.
Maes, J., Paracchini, M.L., Zulian, G., 2011. A European Assessment of the Provision ofEcosystem Services: Towards an Atlas of Ecosystem Services. Publications Officeof the European Union, Luxembourg, doi:10.2788/63557, p. 81.
McDonald, R., 2009. Ecosystem service demand and supply along the urban-to-ruralgradient. Journal of Conservation Planning 5, 1–14.
Ministry for Agriculture and Environment Saxony-Anhalt, 2002. EnergetischeBiomassenutzung in Sachsen-Anhalt. Magdeburg (in German).
Ministry for Agriculture and Environment Saxony-Anhalt, 2007. Biomassepotenzial-studie 2007 für das Land Sachsen-Anhalt. Magdeburg (in German).
Müller, F., 2005. Indicating ecosystem and landscape organisation. Ecological Indi-cators 5 (4), 280–294.
Müller, F., Burkhard, B., 2007. An ecosystem based framework to link landscapestructures, functions and services. In: Mander, Ü., Wiggering, H., Helming, K.(Eds.), Multifunctional Land Use – Meeting Future Demands for Landscape Goodsand Services. Springer, pp. 37–64.
Nedkov, S., Burkhard, B., 2012. Flood regulating ecosystem services – mapping sup-ply and demand in the Etropole Municipality. Bulgaria. Ecological Indicators 21,67–79.
NOAA, 2009. What is land cover data? Diving Deeper Podcast Episode 14. NOAACoastal Service Center. http://oceanservice.noaa.gov/facts/lclu.html (accessedMay 2011).
Nuissl, H., Rink, D., 2005. The ‘production’ of urban sprawl in eastern Germanyas a phenomenon of post-socialist transformation. Cities 22 (2), 123–134.
Paetzold, A., Warren, P.H., Maltby, L.L., 2010. A framework for assessing eco-logical quality based on ecosystem services. Ecological Complexity 7, 273–281.
Palmer, J.F., 2004. Using spatial metrics to predict scenic perception in a changinglandscape: Dennis, Massachusetts. Landscape and Urban Planning 69, 201–218.
Ravetz, J., Piorr, A., Tosics, I. (Eds.), 2010. Synthesis Report: Peri-urbanisationin Europe: Towards a European Policy to Sustain Urban-Rural Futures. ,http://www.plurel.net (accessed May 2011).
Rees, W.E., 1992. Ecological footprints and appropriated carrying capacity:what urban economics leaves out. Environment and Urbanization 4 (2),121–130.
Riitters, K.H, Wickham, J.D., Vogelmann, J.E., Jones, K.B., 2000. National land-coverpattern data. Ecology 81, 604.
Saxon State Department of the environment and geology, 2004. Der Braunkohle-bergbau im Südraum Leipzig, Bergbau in Sachsen Band 11. Dresden (in German).
Saxon State Ministry for the Environment and Agriculture, 2007. Energie für dieZukunft, Sachsens Potenzial an nachwachsenden Rohstoffen/Biomasse. Dresden(in German).
Saxon Upper Mining Authority, 2002. Jahresbericht 2002. Freiberg (in German).Saxon Upper Mining Authority, 2007. Jahresbericht 2007. Freiberg (in German).Schmidt, A., 2008. Integrative Bewertung der Auswirkungen touristischer Nutzun-
gen auf die Bereitstellung der Ecosystem Services auf der Insel Sylt. Diplomathesis Christian-Albrechts-University Kiel (in German).
Schneiders, A., Van Daele, T., Van Reeth, W., Van Landuyt, W., 2012. Biodiversityand ecosystem services: complementary visions on world’s natural capital?Ecological Indicators 21, 123–133.
Scolozzi, R., Morri, E., Santolini, R., 2012. Delphi-based change assessment in ecosys-tem service values to support strategic spatial planning in Italian landscapes.Ecological Indicators 21, 134–144.
Seppelt, R., Dormann, C.F., Eppink, F.V., Lautenbach, S., Schmidt, S., 2011. A quanti-tative review of ecosystem service studies: approaches, shortcomings and the
road ahead. Journal of Applied Ecology, doi:10.1111/j.1365-2664.2010.01952.x.Seppelt, R., Fath, B., Burkhard, B., Fisher, J.L., Grêt-Regamey, A., Lautenbach, S., Pert, P.,Hotes, S., Spangenberg, J., Verburg, P.H., van Oudenhoven, A.P.E., 2012. Form fol-lows function? Proposing a blueprint for ecosystem service assessments basedon reviews and case studies. Ecological Indicators 21, 145–154.
ical In
S
S
S
S
T
T
T
Vihervaara, P., Kumpula, T., Tanskanen, A., Burkhard, B., 2010. Ecosystem services
B. Burkhard et al. / Ecolog
herrouse, B.C., Clement, J.M., Semmens, D.J., 2010. A GIS application for assess-ing, mapping, and quantifying the social values of ecosystem services. AppliedGeography, doi:10.1016/j.apgeog.2010.08.002.
pangenberg, J.H., Settele, J., 2010. Precisely incorrect? Monetising the value ofecosystem services. Ecological Complexity 7, 327–337.
wetnam, R.D., Fisher, B., Mbilinyi, B.P., Munishi, P.K.T., Willcock, S., Ricketts, T.,Mwakalila, S., Balmford, A., Burgess, N.D., Marshall, A.R., Lewis, S.L., 2010.Mapping socio-economic scenarios of land cover change: a GIS method toenable ecosystem service modelling. Journal of Environmental Management,doi:10.1016/j.jenvman.2010.09.007.
yrbe, R.-U., Walz, U., 2012. Spatial indicators for the assessment of ecosystemservices: providing, benefiting and connecting areas and landscape metrics.Ecological Indicators 21, 80–88.
amang, B., 2011. An assessment of ecosystem services of the Everest Region, Nepal.Ph.D. Thesis. Christian Albrecht University, Kiel, pp. 194.
EEB, 2010. The economics of ecosystems and biodiversity: mainstreaming theeconomics of nature: a synthesis of the approach, conclusions and recommen-dations of TEEB.
urner, R.K., Daily, G.C., 2008. The ecosystem services framework and natural capitalconservation. Environmental and Resource Economics 39, 25–35.
dicators 21 (2012) 17–29 29
van Jaarsveld, A.S., Biggs, R., Scholes, R.J., Bohensky, E., Reyers, B., Lynam, T., Musvoto,C., Fabricius, C., 2005. Measuring conditions and trends in ecosystem servicesat multiple scales: the Southern African Millennium Ecosystem Assessment(SAfMA) experience. Philosophica Transactions of the Royal Society B 360,425–441.
van Oudenhoven, A.P.E., Petz, K., Alkemade, R., de Groot, R.S., Hein, L., 2012. Indi-cators for assessing effects of management on ecosystem services. EcologicalIndicators 21, 110–122.
Vattenfall Europe AG, 2009. EEG-Anlagenstammblatt (in German; online)www.vattenfall.de/cps/rde/xchg/trm de/hs.xsl/166.htm (accessed October2009).
Vejre, H., Søndergaard Jensen, F., Jellesmark Thorsen, B., 2010. Demonstrating theimportance of intangible ecosystem services from peri-urban landscapes. Eco-logical Complexity 7 (3), 338–348.
– a tool for sustainable management of human–environmental systems. Casestudy Finnish Forest Lapland. Ecological Complexity 7 (3), 410–420.
Wallace, K.J., 2007. Classification of ecosystem services: problems and solutions.Biological Conservation 139, 235–246.