Mapping genetic diversity of cherimoya (Annona cherimola ...

Mapping DiversityDeveloping a European Classifi cation of Higher Education Institutions

Mapping DiversityDeveloping a European Classifi cation of Higher Education Institutions
This project has been funded with support from the European Commission.
This publication content refl ects the views only of the authors. The Commission cannot be held responsible for any use which may be made of the information contained therein.
Project Identifi cation number 2006 – 1742 / 001 – 001 SO2 81 AWB


Contents
contentsintroduction
part ibuilding a european classifi cation of higher education institutions: concepts and approachanalyzing the results of the classifi cation surveyconclusions
part iioperational implementation
references
exploratory analysis of existing data sourcesthe case studiesthe pilot surveyThe CEICHE II survey
Mapping Diversity
COLOFON
Enschede, 2008
CHEPS(Center for Higher Education Policy Studies)
University of Twentep.o. box 217
7500 AE EnschedeThe Netherlands
Design & production: VMMP
Developing a European Classifi cation of Higher
Education Institutions
1
2
3
4
5
annex i:annex ii:annex iii:annex iv:
34
6
7
1621
2829
36
39455664

MA
PP
ING
DIV
ER
SIT
Y
4 Introduction1.
In August 2005 the report ‘Institutional Profi les, towards a Typology of Higher Education Institutions in Europe’ was published. This report was the result of the fi rst phase of a research project on the development of a European classifi cation of higher education institutions. In general terms, the objectives of this fi rst project were:
to assess the need for a European classifi cation of higher education institutions;• to develop a conceptual model upon which such a classifi cation could be based;• to propose an appropriate set of dimensions and indicators for such a classifi cation.•
The fi rst phase of the research project resulted in a set of principles for designing a classifi cation as well as a fi rst draft of the components of such a classifi cation (the draft-classifi cation). Both were produced in an elaborate process of consultation with identifi ed stakeholders. A wide range of stakeholders showed interest in the project and contributed to a constructive and fruitful exchange of ideas and views regarding the classifi cation.
This report ‘Mapping Diversity: Developing a European Classifi cation of Higher Education Institutions’ is an output of the second phase of the research project. The overall objectives of this second phase were:
to test the draft-classifi cation developed in phase I and to adapt it to the realities and needs of • the various stakeholders;to explore and enhance the legitimacy of a European classifi cation of higher education • institutions.
This report addresses these objectives. The fi rst part discusses the research instruments used to test the draft-classifi cation and presents their outcomes. It also presents the adapted second draft of the classifi cation. The second part discusses the process followed to explore and enhance the legitimacy of the classifi cation and makes a number of suggestions regarding its possible operational introduction.
As in the fi rst phase, the second phase of this research project was granted funding in the framework of the EU Socrates programme. It should be pointed out however that the research was carried out by an independent team of researchers.
The second phase of the project was carried out by the Center for Higher Education Policy Studies (CHEPS), University of Twente, the Netherlands in partnership with the University of Strathclyde, Glasgow, Scotland; The University of Aveiro, Portugal; and the German Rectors Conference (HRK).

MA
PP
ING
DIV
ER
SIT
Y
5The research project team consisted of the following members:
Mr. Prof. Dr. Frans van Vught (project leader) (1)Mr. Dr. Jeroen Bartelse (1)Mr. David Bohmert (5)Mr. Jon File (1)Mrs. Dr. Christiane Gaethgens (3)Mrs. Saskia Hansen (2)Mr. Frans Kaiser (1)Mr. Dr. Rolf Peter (3)Mrs. Dr. Sybille Reichert (5)Mr. Prof. Dr. Jim Taylor (†) (4)Mr. Dr. Peter West (2)Mrs. Prof. Dr. Marijk van de Wende (1)
1: CHEPS2: Strathclyde3: HRK4: Aveiro
5. Independent expert
In October 2008 the third and fi nal phase of the project will start, with fi nancial support within the framework of the EU Socrates Lifelong learning. In this phase we will evaluate and fi ne-tune the dimensions and their indicators and bring them into line with other relevant indicator initiatives; fi nalise a working on-line classifi cation tool; articulate this with the classifi cation tool operated by the Carnegie Foundation; develop a fi nal organisational model for the implementation of the classifi cation; and continue the process of stakeholder consultation and discussion that has been a hallmark of the project since its inception in 2005.
The major output of the Mapping Diversity project will be a fi rm proposal for a European classifi cation of higher education institutions. The fi nalisation and implementation of this classifi cation will be a major step in promoting the attractiveness of European higher education. It will create far greater transparency and reveal the rich diversity of the European higher education landscape - this in turn will help create a stronger profi le for European higher education on a global stage and contribute to the realisation of the goals of the Lisbon strategy and the Bologna process.
For more information about the project please see: www.cheps.org/ceihe
This project has been funded with support from the European Commission. This publication refl ects the views only of the author, and the Commission cannot be held responsible for any use which may be made of the information contained therein.

Part I

MA
PP
ING
DIV
ER
SIT
Y
72. Building a European Classifi cation of Higher Education Institutions: Concepts and Approach
2.1 Relevant concepts
2.1.1 DiversityThe concept of diversity has risen rapidly on the political agenda of European higher education during the last few years. The development of the European Higher Education Area (EHEA) and the European Research Area (ERA) have clearly contributed to the growing attention given to diversity. In addition the global debates about international competition in higher education, world class universities, and rankings and league tables have triggered an awareness that the diversity of European higher education may be seen as a strength, but that a better understanding of that strength is needed. The creation of a European classifi cation of higher education institutions is an attempt to contribute to better understanding the diversity of the European higher education landscape.
In general ‘diversity’ is a term indicating the variety of entities within a system. ‘Diversity’ is to be distinguished from ‘differentiation’ which can be defi ned as a process in which new entities emerge in a system. While differentiation denotes a dynamic process, diversity refers to the level of variety of the entities in a system at a specifi c point in time.
In the higher education literature several forms of diversity have been distinguished (Birnbaum 1983; Huisman 1995; van Vught 2008). Some crucial forms of diversity are:
systemic, structural or institutional diversity, referring to differences in types of institutions • within higher education systems;programmatic diversity, relating to the differences between programmes provided by higher • education institutions;reputational diversity, which refers to perceived differences in the prestige or status of higher • education institutions.
It is important to maintain a clear distinction between these different forms of diversity and to be clear about the form of diversity a specifi c analysis focuses on. In this report the focus is on the various differences between higher education institutions (one of which might be perceived differences in prestige). In order to underline this focus, we will use the term institutional diversity.
Institutional diversity is often seen as one of the major factors associated with the positive performance of higher education systems. The following arguments are developed in the literature regarding the positive impact of institutional diversity (van Vught 2008):
First, it is often argued that an increase in institutional diversity of a higher education system is • an important strategy to meet student needs. A more diversifi ed system is assumed to be better able to offer access to higher education to students with different educational backgrounds and with a range of academic and professional achievements. A second and related argument is that institutional diversity provides for social mobility. By • offering different modes of entry into higher education and by providing multiple forms of transfer, a diversifi ed system stimulates upward mobility as well as providing for honourable

MA
PP
ING
DIV
ER
SIT
Y
8 downward mobility. A diversifi ed system allows for corrections of errors of choice; it provides extra opportunities for success; it rectifi es poor motivations; and it broadens educational horizons. Third, institutional diversity is seen to meet the needs of the labour market. The point of view • here is that in modern society an increasing variety of specialisations on the labour marked is necessary to allow further economic and social development. A homogeneous higher education system is thought to be less able to respond to the diverse needs of the labour market than a diversifi ed system. A fourth argument is that institutional diversity serves the political needs of interest groups. • The idea is that a diverse system ensures the needs of different groups in society to have their own identity and their own political legitimation. In less diversifi ed higher education systems the needs of specifi c groups may remain unaddressed, which may cause internal debates in a higher education system and various kinds of disruptions. A fi fth, and well-known argument is that institutional diversity permits the crucial combination of • elite and mass higher education. Generally speaking, mass systems tend to be more diversifi ed than elite systems, as mass systems absorb a more heterogeneous clientele and attempt to respond to a wide range of demands from the labour market.A sixth reason why institutional diversity is an important objective for higher education systems • is that diversity is assumed to increase the level of effectiveness of higher education institutions. The argument is that institutional specialization allows higher education institutions to focus their attention and energy thus producing higher levels of effectiveness.Finally, institutional diversity offers opportunities for experimenting with innovation. In a diversifi ed • higher education system, institutions have the option to assess the viability of innovations created by other institutions, without necessarily having to implement these innovations themselves. Diversity offers the possibility to explore the effects of innovative behaviour without the need to implement the innovations at all institutions at the same time. Diversity permits low-risk experimentation.
These various arguments in favour of institutional diversity show that diversity is usually assumed to be a worthwhile objective for higher education systems. Diversifi ed higher educations systems are believed to produce higher levels of client-orientation (both regarding the needs of students and of the labour market), social mobility, effectiveness, fl exibility, innovativeness, and stability. More diversifi ed systems, generally speaking, are thought to be ‘better’ than less diversifi ed systems. Many governments have designed and implemented policies to increase the level of diversity of their higher education systems.
In the European context diversity is seen as both an important characteristic of the overall higher education system and a worthwhile policy objective. The diversity of the European higher education system is assumed to be large and this is argued to be a highly relevant condition for the future development of the system. However, unfortunately the level of this diversity has not yet been made transparent. It seems that our empirical knowledge about the institutional diversity of European higher education is still limited. The development of a European classifi cation of higher education institutions will address this lack of knowledge and transparency.
2.1.2 Rankings One of the most debated recent developments in higher education worldwide concerns the application of rankings of higher education institutions. Also in the academic literature on higher education, rankings are now being widely examined from conceptual, methodological and statistical points of view. The general consensus seems to be that although there are still serious problems
MA
PP
ING
DIV
ER
SIT
Y
9with university rankings, rankings are ‘here to stay’. We should try to improve them rather than fi ght them (Dill and Soo 2005; Van Dyke 2005; Marginson 2007; Marginson and van der Wende 2007; Sadlak and Liu 2007; Centre for Higher Education Research and Information, Open University et al. 2008; van der Wende 2008). Several issues have been identifi ed that should be addressed when improving the current ranking approaches.
A fi rst issue regards the distinction between aggregated and multi-dimensional rankings. In an aggregated ranking the information on a number of indicators regarding institutional performance is combined to create an overall institutional league table. In this approach certain weights are assigned to each indicator according to their perceived importance and a straight hierarchical ranking is produced. A multi-dimensional ranking provides multiple scores for each individual higher education institution, offering information on a set of different aspects without necessarily combining these in a unique hierarchy. The problem with aggregated rankings is that they hide signifi cant differences between higher education institutions and they cannot address the specifi c interests of stakeholders. In addition the choices regarding indicators and their weights in the overall score are made by the ranking organisation and the underlying rational for these choices is often unclear. Multi-dimensional rankings, on the other hand, recognize the diversity of higher education institutions and acknowledge that a single hierarchy cannot refl ect this diversity. In addition, multi-dimensional rankings tend to accept that the choices of indicators and weights should usually relate to the users’ or stakeholders’ points of view and that hence these users/ stakeholders should be involved in making these choices.
A second issue with respect to rankings concerns the fact that rankings usually appear to capture the prestige or reputation of higher education institutions, rather than their actual performance. Most international rankings are prestige rankings, largely focused on criteria like ‘excellence in research’ and subjective peer reputation. Particularly when prestige surveys amongst academics are used, the problem with these rankings are manifold. Academic peers cannot be assumed to have a comprehensive overview of the academic quality of all relevant institutions. In addition misleading ‘halo-effects’ will result from quality judgements based on reputations (with world famous universities being higher rated because of their reputation rather than their performance). Furthermore circularity effects occur as a result of historical reputation (with historically highly reputed institutions receiving positive judgements regarding their present or future rating).
A third issue regards the selection of the indicators to be used in rankings. Such a selection should satisfy attributes like relevance, comprehensiveness, comparability, validity and reliability. The indicators should refl ect the dimensions that are judged to be important by various stakeholders and provide reliable information. To date rankings are confronted with the problem of a lack of indicators that suffi ciently capture the performance of higher education institutions more widely. Especially in areas other than research, notably teaching and other forms of knowledge transfer, lifelong learning and innovation.
A fourth and fi nal issue regarding rankings concerns their impact on the behaviour of higher education institutions and on the dynamics of higher education systems. Rankings appear to trigger reactions by various stakeholders, often producing unintended effects. Higher education institutions for instance react to their ranking positions by increasing their investments in costly programmes and creating higher access selectivity barriers. Policy-makers stimulate institutions to improve their position on particular prestige rankings. Rankings are in this respect not neutral information instruments but rather highly ‘political’ tools that produce various reactions and effects (Salmi and Saroyan 2006).

MA
PP
ING
DIV
ER
SIT
Y
10 While rankings are criticized for their conceptual and methodological problems and for their potentially dysfunctional effects, they are nevertheless seen as ‘here to stay’. The challenge therefore is to offer constructive contributions to the process of improving the quality and effectiveness of rankings. This is one of the intentions of this project.
2.1.3 Classifi cations‘A classifi cation is a spatial, temporal or spatio-temporal segmentation of the world’ (Bowker and Star 2000, p.10). Or in simpler terms it is ‘… the general process of grouping entities by similarity’ (Bailey 1994, p.4).In the literature on classifi cations, a number of related terms are used, sometimes interchangeably, which can lead to confusion. In order to be explicit about the concepts used in this project we provide a short resumé of the relevant terms.
A classifi cation should be distinguished from a typology. A typology is a conceptual classifi cation. A classifi cation orders empirical cases while a typology addresses conceptual entities. The cells in a typology represent concepts rather than empirical cases. These concepts are generally defi ned in a monothetic way: they comprise entities that are all identical on all variables or dimensions measured.
A taxonomy is a special case of classifi cation with the main difference being that each cell (taxon) comprises an empirical case. This term is generally used in biological sciences.
In this project we are building a classifi cation: we develop a set of grouping criteria and use it to group empirical cases (in our case: higher education institutions). Classifi cations can be unidimensional or multi-dimensional. In this project a multi-dimensional classifi cation is aimed for.
Generally speaking, classifi cations help to describe a fi eld. They may contribute to the reduction of complexity and to increasing transparency. In addition they may be used to identify similarities and differences between entities. A classifi cation is also an instrument for information and communication. It intends to assist stakeholders in their decisions and actions.
As is the case with rankings, in classifi cations the selection of the entities to be classifi ed and particularly of the ‘grouping criteria’ to categorize these entities are crucial decisions. Building a classifi cation should therefore be a user-oriented process. The most crucial aspect of a classifi cation is to determine who the potential or intended users (stakeholders) are and what they want to use the classifi cation for.
Classifying entities is a process that consists of a number of steps. The fi rst one is to identify the entities to be classifi ed. The user-oriented perspective provides suffi cient guidance here. Once the entities for the classifi cation have been identifi ed the second step can be taken: the defi nition of relevant and adequate grouping criteria. The choice of the dimensions (as we shall call the grouping criteria or key characteristics from now on) should allow the users of the classifi cation to group the entities the way they want. The more dimensions are selected the more the entities can be grouped and described in detailed and different ways. Here again, the user-oriented perspective is crucial. Only when the relevant stakeholders are able to contribute to the selection and defi nition of dimensions can relevant classifi cations be produced. The fi nal step is to identify how the entities score on the different dimensions. During this step the entities are allocated to the cells of the classifi cation on the basis of empirical information.

MA
PP
ING
DIV
ER
SIT
Y
11Classifi cations use the principles of ordering and comparison to categorize. A European classifi cation of higher education institutions allows categorizations of these institutions according to the number of dimensions being applied in the classifi cation. As was indicated before, the classifi cation to be developed here is a multi-dimensional instrument, providing a number of categories in which institutions are grouped that show similar ‘scores’ on characteristics. The European classifi cation of higher education institutions thus differs from aggregated rankings in that it allows multiple scores for individual institutions. It also differs from rankings in general because it does not intend to create hierarchical comparisons, leading to one ‘league table’. However, this will not stop users from developing their own rankings of tailor made subsets of institutions within the classifi cation. This is not necessarily a bad thing. At least the use of subsets of institutions reduces the diversity within the group of institutions ranked and therefore reduces the risk that incomparable institutions are compared and unfairly ranked. In this sense the European classifi cation of higher education institutions is a relevant and signifi cant prerequisite for better rankings in higher education.
2.2 The draft-classifi cationDuring the fi rst phase of the classifi cation project the option of designing and constructing a European classifi cation of higher educations institutions was explored. The conclusion was that Europe would certainly profi t from a classifi cation of its many and diverse higher education institutions. As the Carnegie Classifi cation has done in the US since the early 1970s, a European classifi cation of higher education institutions would create a level of transparency in the European higher education area which would support the various stakeholders in this area.
Business and industry will better be able to identify the institutions they wish to relate to with • respect to hiring graduates, commissioning research, organizing knowledge transfer, etc.Policy makers (at various levels) will be better able to target policies and programmes.• Students will be better able to identify their preferred higher education institutions and to make • better choices regarding their study-programmes and labour market perspectives.Higher education institutions will be better able to develop their missions and profi les and to • engage in partnerships, benchmarking and networking.
A European classifi cation of higher education institutions will create transparency and reveal the rich diversity of European higher education. As was indicated before, we see the European classifi cation of higher education institutions as a descriptive tool, using principles of measurement, ordering and comparing to categorize higher education institutions in multi-dimensional ways.
During the fi rst phase of the project a set of so-called ‘design principles’ was formulated. These principles were the result of extensive communication with the various stakeholders. The design principles were the following:
the classifi cation should be inclusive of all European higher education institutions;• the classifi cation should be based on a • posterior information, describing the actual conditions and behaviour of higher education institutions,the classifi cation should be multi-dimensional and allow several ways of categorizing higher • education institutions;the classifi cation should be non-hierarchical in terms of dimensions, criteria and categories;• the classifi cation should be based as much as possible on ‘objective’, empirical and reliable • data;the classifi cation should be descriptive not prescriptive;•

MA
PP
ING
DIV
ER
SIT
Y
12 the classifi cation should allow fl exibility in the sense that institutions can ‘move’ between • categories and that dimensions, criteria and categories can be adapted;the classifi cation should be parsimonious regarding extra data-gathering needs;• the classifi cation should be related to the European policy on quality assurance, in particular • the European Quality Assurance Register in Higher Education (EQAR).
Based on these principles a draft-classifi cation was developed that consists of 14 dimensions and a set of indicators per dimension. The dimensions and indicators were selected in an interactive process with the stakeholders and experts and were developed to cover the crucial characteristics of higher education institutions in Europe and to allow relevant differentiation between these institutions.
Regarding the relationship between the European classifi cation and quality assurance, the following suggestions were made:
the classifi cation should not be seen as an instrument for ranking higher education institutions. • The multi-dimensional and non-hierarchical characteristics of the classifi cation imply that a number of different comparisons and categorizations of higher education institutions can be made, that cannot lead to one ‘league table’. However, the classifi cation instrument cannot prevent users from ranking institutions per dimension. Such rankings may be assumed to be more useful and fair than aggregated rankings;the classifi cation is not an instrument for institutional quality measurement. It does not generate • quality judgments about higher education institutions, nor about their educational and research programmes. It describes the ‘profi les’ of these institutions on the basis of ‘objective’, empirical and reliable data. These descriptions can of course be used in quality measurement and assurance processes, but in order to be able to do so criteria for the judgment of quality have to be added to the descriptions;in order to create a clear relationship with the European Register of Quality Assurance Agencies • (EQAR), only those higher education institutions whose programmes are successfully reviewed by a registered quality assurance or accreditation agency should be included in the classifi cation. In this way only reputable higher education providers will be included.
Table 1 offers an overview of the draft and classifi cation. As was indicated earlier this classifi cation consists of 14 dimensions and a set of indicators per dimension. The indicators make it possible to differentiate between institutions and to construct different categories per dimension. In the draft-classifi cation these categories were only provisionally developed.

MA
PP
ING
DIV
ER
SIT
Y
13Table 1: Draft and classifi cation (result of project phase I)Dimension Indicator
Types of degrees offereda) highest level of degree offeredb) number of qualifi cations granted in each type
Range of subjects offered number of subject areas covered by an institution using the UNESCO ISCED subject areas
Orientation of degrees institutions themselves indicate to what extent their institutional profi le corresponds to the categories ‘academic orientation’, ‘professional orientation’, ‘mixed orientation’, ‘not relevant’
European educational profi le
an institution’s fi nancial turn-over in European higher education programmes related to total turnover.
Research intensiveness number of peer reviewed publications relative to the total number of staff
Innovation driven research
a) number of start-up fi rmsb) number of patentsc) volume of research contracts
European research profi le an institution’s fi nancial turn-over in European research programmes (Framework Programmes and European Research Council) related to the total turnover.
International orientation
a) proportion of international students related to the total number of students in each type of degreeb) proportion of European students related to the total number of students in each type of degreec) proportion of international staff members related to total number of staff members
Involvement in life long learning
the proportion of adult learners (e.g. older than thirty years) per type of degree related to total student body.
Size a) number of students enrolled at the institutionb) number of staff members employed by the institution
Mode of delivery a) campus-based versus distance learningb) domestic versus abroad mode of delivering educational programmes.
Community services the percentage of staff time attributed to community services
Public/private character the proportion of an institution’s private funding related to its total funding base
Legal status the legal status of a higher education institution can either be public or private
2.3 Elaborating the draft-classifi cationDuring the second phase of the research project the draft-classifi cation has been elaborated and tested. The following activities have been undertaken:
an exploratory analysis of the existing (European) data sources in order to fi nd out whether the • relevant information for ‘fi lling the classifi cation’ could be collected from these sources;a number of in-depth case-studies have been undertaken in order to better understand the • needs and expectations of individual higher education institutions regarding the classifi cation;a survey was conducted amongst a number of higher education institutions in order to test the • relevance, validity and reliability of the elements of the classifi cation and to learn whether the necessary information can be supplied by the institutions.
2.3.1 Exploratory analysis of existing data sourcesIn an ideal world, a European classifi cation of higher education institutions would be based on readily available, trustworthy data that are defi ned and gathered at a European level or are at least comparable at that level. The advantages are obvious: defi nitions are spelt out, data are gathered

MA
PP
ING
DIV
ER
SIT
Y
14 and checked, consistency of analysis is ensured, and legitimacy secured. We explored to what extent this situation is already real. The availability, quality and relevance of the data required for the classifi cation’s indicators was explored. This analysis followed a three step procedure.
The fi rst step was the inventory of an extensive number of data sources.
The second step was to determine whether the data sources were relevant. We used the following criteria:
Does the data source comprise information on any of the indicators of the draft-classifi cation?• Is the information presented at the institutional level? • Does the data source comprise underlying data at the institutional level?• May the underlying data be used?• Can the conditions for use (privacy, costs etc.) be met?•
Third, once the relevance of the data source was determined, we assessed the quality of the data, on the basis of the following criteria:
Data must be up to date• Consistency through time/ reliability• Cost of data retrieval •
Views and opinions, as expressed by experts and in the Advisory Board and Stakeholder Group meetings, were used to complement the information regarding the most relevant data sources.
The results of this analysis are reported in Annex I.
The conclusion of the analysis is that international databases are only to a very limited extent available and suitable for a European classifi cation of higher education institutions. The major bottleneck is that these databases usually comprise system-level data or aggregate data that are not suffi ciently institution-specifi c. Therefore, part of the data would have to be collected from national data sources. A fi rst estimate is that about one third of the data can be retrieved that way. Most of the data thus has to be collected at the institutional level.
2.3.2 Case-studies and pilot-surveyFor the in-depth case-studies two levels were distinguished. In two institutions an elaborate on-site investigation took place into the potential strategic benefi ts of a European classifi cation. These institutions were:
the Norwegian University of Science and Technology in Trondheim, Norway;• the University of Strathclyde in Glasgow, Scotland, UK.•
The case study reports on these two institutions can be found in Annex II.
In addition to the two elaborate case-studies another six higher education institutions were analyzed regarding specifi c issues and aspects of the possible use of the classifi cation.
These institutions were:Budapest Tech, Hungary;• Fachhochschule Osnabrück, Germany;• Fachhochschule Vorarlberg, Austria ;•
MA
PP
ING
DIV
ER
SIT
Y
15Fontys Hogescholen, the Netherlands;• Ruprecht-Karls-Universität Heidelberg, Germany;• Universiteit Twente, the Netherlands.•
For this analysis a pilot survey was developed that was sent to these six institutions as well as to the two in-depth case study institutions.
The report on the pilot survey of the eight institutions is included as Annex III.
The case studies provided very positive reactions to the possible use of the classifi cation. All institutions appeared to be convinced that they would be able to work with the classifi cation as a tool for their own strategic management processes. The classifi cation was judged to be a relevant instrument for sharpening an institution’s mission and profi le. By focusing on the relevant dimensions and indicators of the classifi cation the institutions indicated that they would be able to strengthen their strategic orientation and develop and communicate their profi le. In addition the institutions in the case studies indicated that they would be highly interested in identifying and learning from other institutions comparable to them on a number of relevant dimensions and indicators. Developing and expanding partnerships and networks with these colleague institutions and setting up benchmarking processes were seen as important benefi ts of the classifi cation.
The case-studies also provided a number of suggestions for the adaptation and elaboration of the dimensions and indicators of the draft-classifi cation. These suggestions were incorporated in the adaptation of the classifi cation used in the survey amongst a larger number of higher education institutions.
2.3.3 The classifi cation surveyThe survey amongst a number of higher education institutions was the major element of the second phase of the research project. The survey was intended to test the (adapted) draft-classifi cation and to assess the relevance, validity, reliability and feasibility of the classifi cation instrument. The outcomes of this survey provide a clear set of indications for the further development of the classifi cation. These outcomes are reported in the next chapter of this report (chapter 3) and in Annex IV.

MA
PP
ING
DIV
ER
SIT
Y
16 3 Analyzing the Results of the Classifi cation Survey
3.1 Rationale for the surveyThe classifi cation is intended to be based on the actual behaviour of higher education institutions. The relevant aspects of that behaviour are organized in 14 dimensions and measured with 32 indicators. The information on these indicators at the institutional level is diffi cult to fi nd in international databases. National data sources usually have more relevant information but the use of such data sources is limited because of various practical, legal and methodological problems.Therefore a survey among higher education institutions was designed. This survey served three purposes:
to assess the relevance of the dimensions selected• to assess the quality of the indicators selected• to provide data that will allow further analyses of the dimensions and their clustering and of the • indicators and their potential and pitfalls.
A fuller report on the Survey can be found in Annex IV.
3.1.1 Survey designThe survey consisted of two questionnaires: a questionnaire on the dimensions, querying the relevance of the dimensions and the indicators selected, and a questionnaire on the indicators. The latter comprised questions regarding data on the indicators selected as well as an assessment of the indicators.
Draft questionnaires were developed based on the dimensions and indicators identifi ed and selected at the end of phase I of the project. These draft questionnaires were tested and discussed in the two sets of case studies, as described in chapter two. Based on the results of these tests, the questionnaires were adjusted and placed on-line for the survey1.
The intended size of the sample for the survey was 100 higher education institutions. To keep the non-response rate as low as possible, networks of higher education institutions as represented in the Advisory Board were asked to introduce the project and identify contact persons. Around 160 higher education institutions were contacted. A second channel through which potential participants to the survey were identifi ed was through an open web-based procedure. On the project website (www.cheps.org/ceihe) higher education institutions could express their interest in participating. Based on the information provided the project team decided whether an interested institution could participate. In total 16 higher education institutions were selected this way. A fi nal way to invite institutions to participate was through national and international conferences. On a number of occasions the project was presented and a call for participation was made.
To create the required diversity in the experimental data set, the sample was stratifi ed. The strata in age and size were based on the information on over 3000 higher education institutions in the database of the International Association of Universities (IAU). For the identifi cation of regions, the United Nations classifi cation of regions was used2. In this classifi cation Europe is divided into Eastern, Northern, Southern and Western Europe.
1 for pdf versions of the questionnaires see www.cheps.org//ceihe_dimension.pdf and www.cheps.org//ceihe_indicators.pdf.
2 http://unstats.un.org/unsd/methods/m49/m49regin.htm#europe

MA
PP
ING
DIV
ER
SIT
Y
173.1.2 Response to the survey67 Responses were received for the indicator questionnaire and 85 responses for the dimensions questionnaire. In terms of institutional age, the response appears to be skewed towards the younger categories. Compared to the IAU based size strata the sample is skewed towards larger higher education institutions. Apparently, larger higher education institutions had more resources, commitment or opportunities to participate in the survey. The responding higher education institutions are evenly distributed across the four European regions as distinguished in the UN classifi cation of European regions.
3.2 The dimensionsTable 2 presents an overview of the adapted list of dimensions and indicators of the classifi cation, as used in the survey. The changes to the original list (as presented in Table 1) have resulted from the fi ndings of case studies and the pilot-survey.

MA
PP
ING
DIV
ER
SIT
Y
18 Table 2: Overview of adapted indicators and dimensionsDimension Indicator
1: types of degrees offered1a: highest level of degree programme offered 1b: number of qualifi cations granted in each type of degree programme
2: range of subjects offered 2a: number of subject areas covered by an institution using UNESCO/ISCED subject areas1
3: orientation of degrees
3a: the number of programmes leading to certifi ed/ regulated professions as a % of the total number of programmes3b: the number of programmes offered that answer to a particular demand from the labour market or professions (as % of the total number of programmes)
4: involvement in life long learning
4a: number of adult learners as a % of total number of students by type of degree
5: research intensiveness5a: number of peer reviewed publications per fte academic staff5b: the ISI based citation indicator, also known as the ‘crown indicator’2
6: innovation intensiveness
6a: the number of start-up)6b: the number of patent applications fi led6c: annual licensing income6d: the revenues from privately funded research contracts as a % of total research revenues
7: international orientation: teaching and staff
7a: the number of degree seeking students with a foreign nationality, as % of total enrolment7b: the number of incoming students in European exchange programmes, as % of total enrolment7c: the number of students sent out in European exchange programmes7d: international staff members as % of total number of staff members7e number of programmes offered abroad
8: international orientation: research
8a: the institution’s fi nancial turn-over in European research programmes as % of total fi nancial research turn-over
9: size9a: number of students enrolled (headcount) 9b: number of staff members employed (fte)
10: mode of delivery
10a: number of distance learning programmes as % of total number of programmes10b: number of part-time programmes as % of total number of programmes10c: number of part-time students as % of total number of students
11: public/private character11a: income from (competitive and non-competitive) government funding as % of total revenues11b: income from tuition fees as % of total income
12: legal status 12a: legal status
13: cultural engagement
13a: number of offi cial concerts and performances (co)-organised by the institution13b: number of offi cial exhibitions (co)-organised by the institution
14: regional engagement
14a: annual turnover in EU structural funds as % of total turnover
14b: number of graduates remaining in the region as % of total number of graduates14c: number of extracurricular courses offered for regional labour market14d: importance of local/regional income sources3
3
3 http://unstats.un.org/unsd/methods/m49/m49regin.htm#europe4 http://www.socialsciences.leidenuniv.nl/cwts/

MA
PP
ING
DIV
ER
SIT
Y
19The question ‘this dimension is essential for the profi le of our institution’ is a central question for the project.For eight of the 14 dimensions more than 80% of the responding higher education institutions agreed on the relevance of the dimension. Dimensions 1, 2, 3, 5, 7, 9, 11 and 12). There was only one dimension (13) which less than 60% of respondents rated as being relevant.A lack of consensus on the relevance of a dimension is not a disqualifying characteristic. It merely means that the responding higher education institutions differ in their opinion regarding the relevance of this dimension for the profi le of their institution.
3.3 The indicatorsIn order to ‘score’ higher education institutions on the dimensions, 32 indicators were selected. These indicators can be seen as (quantitative) information that can be used to assess the positions of a higher education institution on the dimensions. In this section we focus on these indicators.
First we look into the validity of the indicators: do the responding higher education institutions think that the selected indicators measure the phenomena we are investigating? Do the indicators convey a ‘correct’ picture of the dimension?
The focus then shifts to the question of whether the information reported is trustworthy: the perceived reliability of the information reported. Since there are signifi cant differences in the status of the indicators (some are based on widely accepted standard statistics, whereas others have a more experimental character) the project team thought it imperative to check the perceived reliability of the information reported.
The fi nal characteristic of the indicators discussed is whether it is feasible for the responding higher education institutions to collect the required information. This issue was one of the main reasons for the survey. A large part of the information underlying the classifi cation has to come from individual higher education institutions. Given the growing survey fatigue and administrative burdens higher education institutions have to face, it is crucial to know how higher education institutions perceive the burden that a classifi cation might place on them. Four indications for feasibility are included: the time needed to fi nd and report the information, the perceived ease of fi nding the information, the use of existing sources and the percentage of valid responses received.
3.3.1 ValidityValidity is assessed by a question in the dimensions-questionnaire. The higher education institutions were asked to give their opinion regarding the statement: ‘indicator a is a valid indicator for this dimension’.There are fi ve dimensions where the validity of the indicators selected raises some doubts: 3 (orientation of degrees), 4 (involvement in life long learning), 6 (innovation intensiveness), 13 (cultural engagement), and 14 (regional engagement). These fi ve dimensions have something of an experimental status and need further development.
3.3.2 ReliabilityThe indicators selected differ in status. Some indicators are already used in different contexts and
5 did not appear in the dimensions questionnaire

MA
PP
ING
DIV
ER
SIT
Y
20 build on standard data, whereas other are ‘experimental’ and use information that is not included in the set of commonly reported data. For these indicators it might be the case that the data reported depend on the person or department reporting the data. To fi nd out whether this reliability problem is perceived to exist, the responding higher education institutions were asked to respond to the statement: ‘the information is reliable’.
The responses are very positive about the reliability of the information provided. For 25 indicators at least fi ve out of six responding higher education institutions reported that they (strongly) agreed with the statement that ‘the information is reliable’. The indicators on which slightly more responding higher education institutions had some doubts regarding reliability are: 3a and 3b (orientation of degrees), 6d (revenues from private contracts) and 14b and 14c (regional engagement).
3.3.3 FeasibilityTo assess the feasibility of the process of collecting and reporting the data we used four indications: the time needed to collect data on the indicator; the score on the scale ‘easy to collect’; whether the data were collected from an existing source; and the total number of valid cases.Based on this information an overall rank score was calculated. Calculating an overall rank score is a tricky exercise. There is no clear conceptual basis for weighting the rank scores on the individual feasibility scores. Yet there is an argument to make for weighting the fi rst two indicators stronger than the latter two. The fi rst two are self reported by the respondents, whereas at least the last indicator is indirectly derived from the sample.
3.3.4. Challenging dimensionsOne of the reasons to organise the survey was to fi nd out which dimensions and indicators would be useful in the classifi cation and which would not. To fi nd an answer to that question we combined the information on validity, feasibility and reliability of the indicators selected for each dimension. We do not use the scores on the perceived relevance of the dimensions since a high proportion of responding higher education institutions strongly disagreeing with the relevance of a dimension is not an indication of the quality of the dimension. We see such a lack of consensus as an indication of the diversity of the missions and profi les of the higher education institutions. Only if the vast majority of the responding higher education institutions disagreed with a dimension’s relevance would we reconsider the choice of this dimension. This was not the case for any of the fourteen dimensions.
To identify potential ‘challenging’ dimensions we selected those dimensions for which at least one indicator scored more than 5% ‘strongly disagree’ on the validity and reliability items and which was in the bottom fi ve of the overall feasibility ranking.Using these criteria, there are only two ‘challenging’ dimensions: dimension 4, ‘Involvement in live long learning’ and dimension 6 ‘innovation intensiveness’.

MA
PP
ING
DIV
ER
SIT
Y
214. Conclusions
In this chapter we draw conclusions on what we have learned from the case studies, the review of the existing databases and the survey. We particularly report the suggestions and remarks offered by the stakeholders and the institutions involved in the project. The issues are presented in three categories:
general issues on the development and use of the classifi cation; • the validity and feasibility of the indicators (Which indicators should be redefi ned, omitted or • added?);the relevance of the dimensions (Which dimensions should be retained or merged?).•
4.1General IssuesWe fi rst present an overview of a number of general suggestions regarding the further development of the classifi cation. These suggestions will lead to further adaptations of the current draft-classifi cation.
First of all, it was suggested by several stakeholders and higher education institutions to include an open question regarding the mission of the institution. Such a question, preferably in the dimensions questionnaire, will give the institution an opportunity to include its intentions and, where there is a large discrepancy with its ‘empirical’ profi le, to use this as a starting point for its further strategic development. This information should not be used to classify institutions but be presented as additional contextual information.
Secondly, there were several comments and suggestions that referred to the infl uence the national context has on the answers provided by the institution (1b, 2a, 3a, 4a, 5a, 6, 7d, 7e, 8a, 9b, 10a. 10b, 11a, 12a, 14a). There may also be some confusion/ bias caused by national differences in the reference period. Academic years are not always the same and the academic year (most frequently used for student related data) differs in many countries from the calendar year (most frequently used for fi nancial data). To address this issue, in the next version of the classifi cation the use of country specifi c background information will be considered. We conclude that the questions should remain the same for all countries; but the information behind the info-buttons (see the questionnaires) can be made country specifi c. The national information will be developed and checked with national experts.
Another general issue that was mentioned was the relation of the project with existing institution based comparative initiatives. On the one hand there are projects related to student surveys and student’s opinions on programmes (such as the German CHE ranking4). The suggestion was not to integrate this information into the classifi cation but to present the information as relevant background information. Such linkages may increase the use and usefulness of the classifi cation for students.
A similar recommendation followed from the analysis of existing data sources. Based on the results of that analysis it was recommended that the development of comprehensive, systematic and comparable data on the main functions and characteristics of higher education institutions should be fostered. To this end existing initiatives and centers of expertise in Europe should be stimulated to cooperate, thus enhancing the ongoing work on European frameworks and instruments that enable diversity to become more transparent. This will be a major and indispensable contribution to
6 http://www.che-ranking.de/cms/?getObject=2&getName=CHE-Ranking&getLang=de

MA
PP
ING
DIV
ER
SIT
Y
22 the strengthening of Europe’s performance in the areas of education, research and innovation (the knowledge triangle).
Fifth, the issue of how to ensure that the data provided by institutions are correct was mentioned both by responding higher education institutions and stakeholders. The project team underlines the importance of this issue but concrete action to develop procedures to ensure the reliability of the information provided has been postponed to the third phase of the project which will focus on operational aspects.
A fi nal general issue refers to the question ‘Who owns the data?’ In phase two of the project, the data provided by the institutions are owned by the project team. The project team has made it clear to the respondents that the data provided will only be used to develop the classifi cation. In a later stage of the project the data could also be used to classify institutions but the project team will only do so with specifi c consent from the individual institutions.
4.2 The indicators (by dimension)In this section we present the conclusions regarding the various indicators. The conclusions and remarks are presented in the sequence of dimensions and indicators as presented in table 2.
1. Types of degree offered
In addition to the two original indicators, two new indicators were suggested for this dimension. The fi rst was ‘dominant degree level’: the degree level at which more than 50% of all degrees at the institution are awarded. Due to the fact that there was a substantial number of higher education institutions with ‘no dominant degree level’, an alternative indicator was calculated using 40% as the cut-off point. The second new indicator was ‘graduate intensity’: the sum of master and doctorate degrees as a percentage of overall degrees.
2. Range of subjects offered
It was suggested that checking what subject areas are offered is not specifi c enough, although it provides a general idea of the scope of the institution’s activities. This might become more precise if information on the number of graduates per subject area was included, allowing the determination of predominant fi elds of study. This may be of particular interest to students.
3. Orientation of degrees
The link to the European list of regulated and certifi ed professions (used in the indicator questionnaire) did not work properly for all countries. It was suggested to include the lists for each country in the background information.Furthermore it was advised to include the number of student placements in fi rms, hospitals etc. as an indicator for this dimension. A high number of placements signals a strong professional orientation.
4. Involvement in life long learning (LLL)
The breakdown of enrolment by age group and level of programme proved to be problematic in terms of feasibility. It was suggested to take out the breakdown by level of degree and to include a breakdown by mode of enrolment (full-time versus part time). From the comments, we deduced that many LLL activities are taking place outside degree programmes. By limiting the questions to degree granting activities, a substantial part of LLL activities might become invisible. However, anticipated problems in comparability and interpretation

MA
PP
ING
DIV
ER
SIT
Y
23of information on non-degree offerings have convinced the project team to leave out non-degree offerings. In some systems, higher education institutions provide special products for the LLL market. Therefore it was suggested to include a question on students enrolled in specifi c LLL offerings.
5. Research intensiveness
The music and arts sector suggested including an indicator that would be more in-line with the research activities undertaken in this sector. There will be no follow-up of this suggestion because the introduction of such an indicator would reduce the legitimacy of the dimension for other institutions (especially the traditional research universities).It was strongly suggested to use ‘total research revenues’ as an additional indicator of research intensiveness. The information is already included but in many national systems direct government funding is provided as a lump sum for both teaching and research activities. To calculate total research income requires the research income part of the lump sum to be determined (which proves to be diffi cult).
6. Innovation intensiveness
It was suggested to use the indicator on start-up fi rms as an indicator for regional engagement as well.The way an institution is costing its activities may infl uence the results on the indicator on research contracts. Full academic costing (FAC) is not a common practice in all countries yet. It was suggested to introduce a checkbox on whether FAC is used.There were also comments on the narrow focus of the indicators chosen for this dimension. It was suggested that some indicators should be included to signal innovative activities in the set up of teaching and curricula and of research, as well as for the innovative character of artistic activities. For the latter the use of a community will be considered. A community is a group of institutions that is willing to invest in developing a more comprehensive set of indicators for a particular dimension. Such a community of interested institutions could play an active role in developing indicators and advise the project team on these particular indicators. Participation would be on a voluntary basis. Working with such a community could enhance the validity, feasibility and legitimacy of the indicators used.
7. International orientation: teaching and staff
It was suggested to introduce ‘academic staff by time spent abroad (study/work)’ as an additional indicator since nationality does not say enough about the real international orientation.The indicators on student mobility are mainly focused on EU exchange programmes. By broadening the scope of these indicators to all international exchange programmes this ‘EU-bias’ could be reduced. It was furthermore suggested to use the ‘nationality of the qualifying diploma’ (where the diploma of secondary education was awarded) instead of the ‘nationality of the student’ to distinguish national versus international students.It was recommended to the project team to set up a community of institutions that is willing to invest in developing a more comprehensive set of indicators for this dimension. The project team was advised to include an indicator on joint degree programmes or double degrees awarded.
8. International orientation: research
The scope of this indicator was seen by many as too limited. Expanding the scope from EU research programmes to all international research programmes would enhance the relevance and validity of this indicator.

MA
PP
ING
DIV
ER
SIT
Y
24 The indicator on the importance of regional sources of income does provide information on the relative importance of international sources of income as well.
9. Size
No comments were made regarding this dimension.
10. Mode of delivery
The issue of blended learning (combining on-campus and distance learning elements in one programme) was discussed by some respondents. However, due the methodological problems this
may cause, it was decided not to include an indicator on this item.
In the questionnaire there is a question on the provision of distance learning programmes, but there
is no question on the size of those programmes in terms of enrolment. Including such an indicator would enhance the validity of the set of indicators for this dimension.
11. Public/private character
It was suggested to breakdown public funding into direct lump sum public funding and indirect competitive public funding. It was suggested that the former was a better indicator of public character than the latter. Using the direct lump sum public funding would therefore increase the validity of the indicator. There were suggestions to include revenues from donations as an additional indicator in this dimension. Although this source of income may not be relevant in many higher education institutions yet, the project team decided to included the indicator in the list of suggested indicators. It is expected that the relative importance of this indicator (as an indicator that clearly differentiates groups of institutions from one another) will increase in the future.
12. Legal status
The few comments made regarding this dimension did not lead to any changes to the dimension or the indicators used.
13. Cultural engagement
The current indicators were criticized by the music and arts sector. It was recommended to the project team to set up a community of institutions that is willing to invest in developing a more adequate set of indicators for cultural engagement.
14. Regional engagement
The indicator ‘graduates in the region’ was dropped because of methodological problems. The other indicators were challenged but it was decided to keep these indicators in order to be able to distinguish institutions that invest in these activities (as part of their profi le). It was recommended to the project team to set up a community of institutions that is willing to invest in developing a more adequate set of indicators for regional engagement. It was suggested to use the indicator ‘number of extracurricular courses’ both as an indicator for the dimension ‘LLL’ and the dimension ‘mode of delivery’. It was furthermore suggested to include the number of partnerships with business and industry as an indicator in this dimension.

MA
PP
ING
DIV
ER
SIT
Y
254.3 Reduction of the number of dimensionsIn the survey 14 dimensions were distinguished. This was seen as too many by quite a number of respondents. When the higher education institutions are classifi ed on all 14 dimensions, the use of the classifi cation becomes very tedious and (for many intended users) too time consuming and confusing. It is also argued that when used as a ‘fi ltering device’ the selection of benchmark institutions based on all dimensions will very rarely result in a reasonable number of “hits” (if any).
In contrast to this ‘push’ towards a reduction of the number of dimensions there were also some comments to keep all dimensions, at least at this stage of the project. Reducing the number of dimensions leads to a reduction of information, which should be avoided during the developmental stage of the classifi cation. Diversity is best captured by as many (relevant) dimensions as possible. In a later stage of the project, there will always be the option of reducing the number of dimensions.The survey scores on the perceived relevance were not used to rearrange the dimensions or to reduce the number of dimensions. ’Low’ scores on relevance are seen as an indication of diversity among the responding higher education institutions: for many of the responding institutions a particular dimension may be irrelevant, but for a (limited) number of institutions it is relevant and distinguishes them from others.
There were some doubts regarding three dimensions. ‘Involvement in life long learning’ turned out to be a ‘challenging’ dimension: the validity, reliability and feasibility of the indicator, were considered to be problematic. The dimensions ‘Cultural engagement’ and ‘Regional engagement’ were challenged by a number of respondents. Instead of labelling these dimensions as ‘challenged’ and deleting them from the list of dimensions, the project team decided to label the dimensions as ‘challenging’. The relevance of these dimensions for particular groups of institutions is the main reason for keeping the dimensions and investing in developing better indicators for these. That is why the creation of ‘communities’ in the next phase of the project was suggested. Several groups of institutions (arts and music schools, universities of applied sciences) have already expressed their interest and willingness to form and join such communities. Depending on the outcomes of these communities, all dimensions will be reviewed in the next phase of the project which may possibly lead to a reduction of the number of dimensions.
4.4 The adapted classifi cationIn table 3 an overview is presented of the classifi cation as it has been adapted as a result of the outcomes of the survey and comments made on the results of the survey. The table shows the draft classifi cation at the end of phase II of the project. In the fi nal phase III, further adaptations are to be expected, resulting from new stakeholders’ inputs as well as further statistical analyses.
Table 3: Overview of dimensions and indicators in adapted classifi cationDimension Indicator new and suggested indicators
1: types of degrees offered
1a: highest level of degree programme offered
1b: number of qualifi cations granted in each type of degree programme
1c: dominant degree level: degree level in which at least 50% of the degrees were awarded. An alternative defi nition is considered: degree level in which at least 40% of the degrees were awarded

MA
PP
ING
DIV
ER
SIT
Y
26 Dimension Indicator new and suggested indicators1d: graduate intensity: the number of graduate degrees awarded as a percentage of all degrees awarded
2: range of subjects offered
2a: number of subject areas covered by an institution using UNESCO/ISCED subject areas
2b: number of degrees awarded by level of degree and by subject area
3: orientation of degrees
3a: the number of programmes leading to certifi ed/ regulated professions as a % of the total number of programmes
3c: the number of student placements in fi rms, hospitals etc. as a % of total enrolment
3b: the number of programmes offered that answer to a particular demand from the labour market or professions (as % of the total number of programmes)
4: involvement in life long learning
4a: number of adult learners as a % of total number of students by type of degree
4a1: number of adult learners as a % of total number of students (all degree levels combined)
4b: number of part-time adult learners as a % of total number of part-time students4c: number of students enrolled in specifi c LLL programmes4d: number of extracurricular courses offered for regional labour market (see 14b)
5: research intensiveness
5a: number of peer reviewed publications per fte academic staff
5c: total research income as a percentage of total income
5b: the ISI based citation indicator, also known as the ‘crown indicator’
6: innovation intensiveness
6a: the number of start-up) 6e: use of full academic costing (yes/no)
6b: the number of patent applications fi led6c: annual licensing income6d: the revenues from privately funded research contracts as a % of total research revenues
7: international orientation: teaching and staff
7a: the number of degree seeking students with a foreign nationality, as % of total enrolment
7a1 the number of degree seeking students with a foreign qualitying diploma as % of total enrolment
7b: the number of incoming students in European exchange programmes, as % of total enrolment
7b1: the number of incoming students in international exchange programmes, as % of total enrolment
7c: the number of students sent out in European exchange programmes
7c1: the number of students sent out in international exchange programmes
7d: international staff members as % of total number of staff members

MA
PP
ING
DIV
ER
SIT
Y
27Dimension Indicator new and suggested indicators7e number of programmes offered abroad
7f: the number of students in joint degree programmes as a % of total enrolment
8: international orientation: research
8a: the institution’s fi nancial turn-over in European research programmes as % of total fi nancial research turn-over
8a1: the institution’s fi nancial income from international research programmes as % of total fi nancial research income
8b: the importance of international sources of income (see 14d)
9: size 9a: number of students enrolled (headcount) 9b: number of staff members employed (fte)
10: mode of delivery 10a: number of distance learning programmes as % of total number of programmes
10a1: number students enrolled in distance learning programmes as % of total number of students
10b: number of part-time programmes as % of total number of programmes
10d: number of extracurricular courses offered for regional labour market (see 14b)
10c: number of part-time students as % of total number of students
11: public/private character
11a: income from (competitive and non-competitive) government funding as % of total revenues
11a1: income from direct government funding (lump sum) as a % of total income
11b: income from tuition fees as % of total income
11c: Income from donations as a % of total income
12: legal status 12a: legal status13: cultural engagement
13a: number of offi cial concerts and performances (co)-organised by the institution13b: number of offi cial exhibitions (co)-organised by the institution
14: regional engagement
14a: annual turnover in EU structural funds as % of total turnover
14e: the number of start-up fi rms (see 6a)
14b: number of graduates remaining in the region as % of total number of graduates
14b: this indicator will be dropped
14c: number of extracurricular courses offered for regional labour market
14f: the number of partnerships with business and industry
14d: importance of local/regional income sources

Part II

MA
PP
ING
DIV
ER
SIT
Y
295. Operational implementationPart II contains the fi ndings of the project on the operational implementation or institutionalisation of the European classifi cation of higher education institutions. The question of institutionalising the classifi cation has been discussed intensively with different stakeholders and experts on several occasions during the project. The views of the stakeholders and other relevant actors are reported in section 5.1. On the basis of these views, a set of indications for the institutionalisation of the classifi cation is formulated in section 5.2. These indications or design principles for institutionalisation are then related to four theoretical models of operational implementation (section 5.3). We conclude with a presentation of the most appropriate model for institutionalisation and some fi nal considerations in section 5.4.
5.1 The views of stakeholders and expertsFrom the very beginning, the project team has been acutely aware that the views and interests of stakeholders are crucial to successfully conceptualising and implementing a classifi cation. Bearing this in mind, the project team discussed issues related to institutionalising the classifi cation on several occasions. The feedback and views of the participants at these events are presented in this section. Finally, the views on the classifi cation project of the presidency of the Council of the European Union, the EC and the Carnegie Foundation are reported.
The project team discussed issues related to the institutionalisation of the classifi cation at the following events:
1− st Advisory Board meeting on 12th December 2006 in Brussels (Belgium);2− nd Advisory Board meeting on 31st March 2007 in Lisbon (Portugal);3− rd Advisory Board meeting on 25th April 2008 in Santander (Spain);1− st Stakeholder Group meeting on 12th December 2006 in Brussels (Belgium);2− nd Stakeholder Group meeting on 25th April 2008 in Santander (Spain);A visit to the Carnegie Foundation from 7− th to 9th April 2008 in Stanford (United States of America);Project conference‚ ‘Building a typology of higher education institutions in Europe’ on 24− th April 2008 in Santander (Spain);Bologna Seminar, ‘Unlocking Europe’s potential - Contributing to a better world’ on 19− th and 20th May 2008 in Ghent (Belgium);Project conference, ‘Transparency in Diversity – Towards a Classifi cation of European Higher − Education Institutions’ on 10th and 11th July 2008 in Berlin (Germany).
5.1.1 Advisory BoardThe participants in the Advisory Board meetings underlined that the primary purpose of the classifi cation should be to serve the needs of higher education institutions. They advised that the project should make the difference with ranking clear and should not result in (one-dimensional) rankings itself. The Advisory Board pointed out that the organisation carrying out the classifi cation has to be clearly independent from both market forces and governmental infl uence. The Board also stressed the need for voluntary participation. Taking notice of the way the Carnegie classifi cation is organised, the Board expressed a preference for an independent body to operate the classifi cation in the long run. Moreover, it expressed the need to place the classifi cation in a global context and to explore further cooperation with the Carnegie Foundation.
MA
PP
ING
DIV
ER
SIT
Y
30 5.1.2 Stakeholder GroupThe participants in the Stakeholder Group meetings suggested that the legitimacy of the classifi cation depends particularly on its acceptance among higher education institutions. They highlighted that the classifi cation is a prerequisite for better rankings. Many participants supported the project in its attempts to link the classifi cation to the creation of a European Higher Education Area (EHEA) and the aim of the Bologna process to create and enhance the transparency of the European higher education system. Moreover, they underlined its clear link to the external dimension of the EHEA and expressed their support for exploring further cooperation with the Carnegie Foundation.
5.1.3 Conference participantsThe participants in the various conferences advised the project team to further specify and underline the benefi ts for stakeholders of the development of a European classifi cation. The higher education institutions were perceived as the most important stakeholders, not least because they provide the data. Many institutions participating in the survey confi rmed their interest in the classifi cation. They identifi ed the following four advantages for higher education institutions and pointed to the need to communicate these as crucial opportunities for the institutions.
to mirror and verify institutional ambitions and perceptions;− to identify relevant partners for benchmarking on the European level;− to design institutional development strategies;− to make their specifi c institutional profi les explicit on the European level.−
Although students will be able to make better informed choices about enrolment, it was generally felt that the classifi cation is not primarily designed from their perspective. Students seem to be more interested in information at the programme level. The ranking of the Centrum für Hochschulentwicklung (CHE) was mentioned as a good tool and some participants advised linking CHE data to the classifi cation (see above).
The participants confi rmed that governments could develop better policies if they took into account the differences between higher education institutions. Participants also stated that a classifi cation would need the support of European governments if it were to be a success.
The institutionalisation and application of the classifi cation was seen to be clearly linked to its usefulness. The need to engage the relevant stakeholders was generally underlined, particularly when it comes to the linking of the classifi cation to the Bologna Process. In this respect, the proposal to only classify institutions that are accredited by agencies registered in the European Quality Assurance Register in Higher Education (EQAR) received much support. However, the participants perceived a stakeholder based organisation as unsuitable for the institutionalisation of the European classifi cation given the complexity of fi nding common ground and the complex issue of the representation of institutions at the European level.
5.1.4 Bologna Follow-Up GroupThe project team emphasised on several occasions the project’s goal to create more transparency within the European higher education system. Given the clear reference to such an undertaking in the Bologna Declaration, the project team argued for embedding the classifi cation within the Bologna-process beyond 2010 during the BFUG-seminar ‘Unlocking Europe’s potential – Contributing to a
MA
PP
ING
DIV
ER
SIT
Y
31better world’ from 19th to 20th May in Ghent (Belgium). There, the importance of the institutional diversity of the European higher education area and the value of the classifi cation as an instrument were clearly recognised. Several participants underlined the need for an independent body to operate the classifi cation rather than a model of ownership by the stakeholders. Whether the classifi cation will be included in the next phase of the Bologna process beyond 2010 will be on the agenda of the following ministerial meeting in April 2009 in Leuven (Belgium).
5.1.5 Presidency of the Council of the European UnionThe French presidency of the Council of the European Union has launched a discussion on benchmarks and indicators for better rankings in higher education and research. Through several contacts it has become clear that the French presidency is interested in a classifi cation project and it has invited the CEIHE project team to speak at the presidency conference in November 2008 in Nice (France).
5.1.6 European CommissionThe European Commission provided the funding for both the fi rst and second phase of this classifi cation project and has thus participated in the development of the classifi cation from the very beginning. The project team however has always emphasised its (scientifi c) independence and recognises that fi nancial support from the Directorate-General Education, Youth and Culture (EAC) for the project does not imply unconditional support of the EC for the classifi cation. The project team interprets the EC’s position as support for the underlying notions in the project of the importance of the institutional diversity of higher education institutions in Europe and the need for more transparency.
Many participants in the various meetings and conferences have underlined the importance of the continuation of the close cooperation with the EC in general and with EAC in particular when further developing and implementing the classifi cation. The project team agrees with this view and has expressed this intention on various occasions. Cooperation is also necessary with regard to the intention of the EC to explore additional data-collection on higher education and research institutions in Europe by the Statistical Offi ce of the European Communities (EUROSTAT).
5.1.7 Carnegie FoundationThe Carnegie classifi cation in the US higher education system is entirely run and funded by the Carnegie Foundation. The success of the Carnegie classifi cation is due to the fact that the Carnegie Foundation has the generally accepted authority as the implementing organisation of the US classifi cation. The Carnegie Foundation is not responsible for the data collection; the data are freely available at the federal level in the US. Carnegie also does not undertake any auditing of the quality of the data that higher education institutions provide to the relevant federal bodies.
The project team has established a fruitful working relationship with experts and managers of the Carnegie Foundation. The Carnegie colleagues appreciate the collaboration with the project team, particularly from a scholarly perspective. Relevant issues for further collaboration include: the comparability of the two classifi cations, the classifi cation dimensions and the relationships between classifi cations and rankings. The current management also indicated that the Carnegie Foundation is interested in exploring further collaboration concerning the implementation of a European classifi cation.

MA
PP
ING
DIV
ER
SIT
Y
32 5.2 Criteria for institutionalisationTaking into account the views, recommendations and concerns that were mentioned during the consultation process, the project team defi ned fi ve criteria as essential requirements for the institutional implementation of the classifi cation: inclusiveness, independence, professionalism, sustainability and legitimacy. These criteria are defi ned as follows:
InclusivenessThe classifi cation must be open to recognised higher education institutions of all types and all participating countries, irrespective of their membership of associations, networks or conferences.
IndependenceThe classifi cation must be administered independently of governments, funding organisations, representative organisations or business interests.
Professional approachThe classifi cation must be run by a professional, reliable and effi cient organisation. This will guarantee appropriate standards in the planning, implementation, communication and further development of the classifi cation, hence contributing to an impeccable reputation for the classifi cation which is essential to its success.
SustainabilityThe administration of the classifi cation must be properly funded on the basis of a long term fi nancial commitment. This will secure suffi cient capacity for carrying out the work at the required high level.
LegitimacyThe classifi cation must have the trust of participating institutions and stakeholders. This means that the organisation managing the classifi cation will be held accountable and will be subject to continuous evaluation and assessment.
5.3 Models for institutionalisationThroughout the meetings in the early stages of the project, four theoretical options evolved as possible models for implementation: market, government, stakeholder and independent organisation. In the following section the four models and the views of stakeholders on these models are presented in relation to the criteria mentioned in the previous section.
Market modelIn this model a (consortium of) private organisations would implement the classifi cation. Products and services would be made available to users at market-based tariffs. The strategy, further development and use of the classifi cation would be driven by market demands.
In a market model, the stakeholders we consulted assumed that the provider would only offer classifi cation services on those dimensions for which it expects suffi cient institutional demand. Hence some dimensions of the classifi cation are likely not to be included. Therefore full inclusiveness cannot be guaranteed. On the criterion of sustainability, stakeholders argued that in a market model the continuation of the classifi cation will depend on demand and will be subject to the volatility of the market. Hence, sustainability can not be guaranteed. Finally, the stakeholders raised concerns about the perceived legitimacy of this model.

MA
PP
ING
DIV
ER
SIT
Y
33Government model
In this model governments use their authority over higher education to organise the classifi cation of higher education institutions as an integral instrument of their steering capacity. As the tool to be developed is a Europe-wide classifi cation, it would operate either at the supranational level or within the framework of an inter-governmental agreement.
According to the stakeholders, governments could use their authority to ensure full participation of higher education institutions, therefore potentially ensuring a high level of inclusiveness. However, the stakeholders voiced clear concerns about the legitimacy of the classifi cation in such a model given the danger of the lack of ownership by the institutions.
Stakeholder model
In this model all major stakeholders, i.e. business, governments, students and institutions, would co-own the operation and administration of the classifi cation.
According to the stakeholders, this model might provide a good basis for a high level of legitimacy. Nevertheless, the fi nding of common ground in the stakeholder model is likely to be diffi cult. In addition, the lack of coherent representation of some types of institutions at the European level could lead to a bias in favour of better represented institutions. This would present a serious challenge to inclusiveness.
Independent organisation model
In this model an existing or new organisation independent of governmental or direct stakeholder interests would administer the classifi cation.
According to the stakeholders, this model in principle best meets the necessary conditions to fulfi l all fi ve criteria. One should however consider carefully what the responsibilities of the implementing organisation will be as its (additional) activities could greatly enhance its legitimacy in the larger societal context.
In the table below, we present in summary the assessment of the four models by the stakeholders against the criteria developed above.
Table 4: Assessment of four models for institutionalising the classifi cation Criteria
Model
Inclusiveness Independence Professionalism Sustainability Legitimacy
Market - +/- +/- - -
Government + +/- +/- +/- -
Stakeholder - +/- +/- +/- +
Independent organisation
+/- + +/- +/- +/-
The table shows that according to the stakeholders the independent organisation model scores highest, i.e. a ‘+’ on independence without any ‘–‘ on any other criterion. In addition, the stakeholder model would complement this model with a ‘+’ on legitimacy.

MA
PP
ING
DIV
ER
SIT
Y
34 5.4 Conclusion and considerationsIn this paragraph we present our conclusion on the preferred model for the operational implementation of the multi-dimensional classifi cation and offer some fi nal considerations.
The conclusions and considerations reached so far have only a provisional character given the fact that the research on classifi cation is still going on. The project team will only be able to come to more substantial and concrete recommendations with regard to institutionalisation after further development of the whole concept of classifi cation and more feedback from stakeholders.Nonetheless, a fi rst indication of the preferred model for the implementation of the classifi cation can be presented.
As a consequence of the above assessment, the project team recommends combining the independent organisation and the stakeholder models for the institutionalisation and implementation of the classifi cation. A way to operationalise this would be to create a legally independent organisation in which stakeholders have an important advisory role to play.
We propose the creation of a non-governmental and not-for-profi t organisation that operates independently from its funding constituencies or stakeholders (or the use of an existing organisation of this nature). Funding could come from public or private sources as long as independence from these sources and sustainability is guaranteed.
The operating organisation would have a board consisting of independent members and would be managed by a director supported by professional staff. The board of the organisation would be advised by a stakeholder advisory council and a scientifi c advisory committee. This organisation is refl ected in the organisational chart below:
Figure 1: Proposed organisational chart of the organisation responsible for the classifi cation
The project team also recommends the creation of communities to further develop ‘challenging’ dimensions and to seek better indicators (see section 4.3). The classifi cation organisation would interact with these communities of specifi c higher education institutions designing their operational procedures and processes.
In addition, several aspects of the implementation of the classifi cation need further attention.
Regarding the operational area of the classifi cation it is advised to focus on the European Higher Education Area (EHEA) and thus to relate the classifi cation to the Bologna Process. However, we
Board
Director
Professional Staff
Scientific Advisory Comittee Stakeholder Advisory Council
Board
Director
Professional Staff
Scientific Advisory Comittee Stakeholder Advisory Council

MA
PP
ING
DIV
ER
SIT
Y
35also underline the need for cooperation with other relevant organisations, not least the Carnegie Foundation.
Furthermore, the limited availability of data on the European level (see section 2.3.1) must be taken into account when assessing the staffi ng needs regarding implementation. This also applies to the necessity to organise audits and monitor the quality of the data provided.
Finally the project team recommends that all necessary provisions be made to ensure that the classifi cation organisation has the intellectual property rights regarding the data and the infrastructure for collecting, processing and presenting the classifi cation.

References

MA
PP
ING
DIV
ER
SIT
Y
37Bailey, K. D. (1994)
Typologies and taxonomies: an introduction to classifi cation techniques Thousand Oaks, Sage Publications.Birnbaum, R. (1983)
Maintaining diversity in higher education. San Francisco, Jossey-Bass.Bowker, G. C. and S. L. Star (2000)
Sorting things out: Classifi cation and its consequences. Cambridge, MIT.Centre for higher education research and information, Open University, et al. (2008)
Counting what is measured or measuring what counts? League tables and their impact on higher education institutions in England. London, HEFCE.Dill, D. D. and M. Soo (2005)
“Academic quality, league tables and public policy: a cross-national analysis of university ranking systems.” Higher Education 49(4): 495-534.Europa Publications (2006)
The World of Learning 2007. London.Huisman, J. (1995)
Differentiation, diversity and dependency in higher education. Utrecht, Lemma.Jongbloed, B., B. Lepori, et al. (2006)
Changes in university incomes and their impact on university-based research and innovation.Kelo, M., U. Teichler, et al., Eds. (2006)
EURODATA – Student mobility in European higher education. Bonn, Lemmens.Marginson, S. (2007)
“Global university rankings: implications in general and for Australia.” Journal of higher education policy and management 29(2): 131-142.Marginson, S. and M. van der Wende (2007)
“To rank or to be ranked: the impact of global rankings in higher education.” Journal of Studies in International Education 11(3-4): 306-329.OECD (2004)
Handbook for Internationally Comparative Education Statistics. Paris.Sadlak, J. and L. N. Liu, Eds. (2007)
The world-class university and ranking: Aiming beyond status. Paris, UNESCO-CEPES.Salmi, J. and A. Saroyan (2006)
“League tables as policy instruments: Uses and misuses.” Higher Education Management and Policy 19(2): 24-62.Van Dyke, N. (2005)
“Twenty years of university report cards, Higher education in Europe.” Higher Education in Europe 30(2): 103-125.van Vught, F. (2008)
“Mission diversity and reputation in higher education.” Higher education policy 21: 151-174.van der Wende, M. C. (2008)
Rankings and Classifi cations in Higher Education: A European Perspective. Higher Education: Handbook of Theory and Research. J. Smart, Springer. XXIII: 49-73.

Annexes
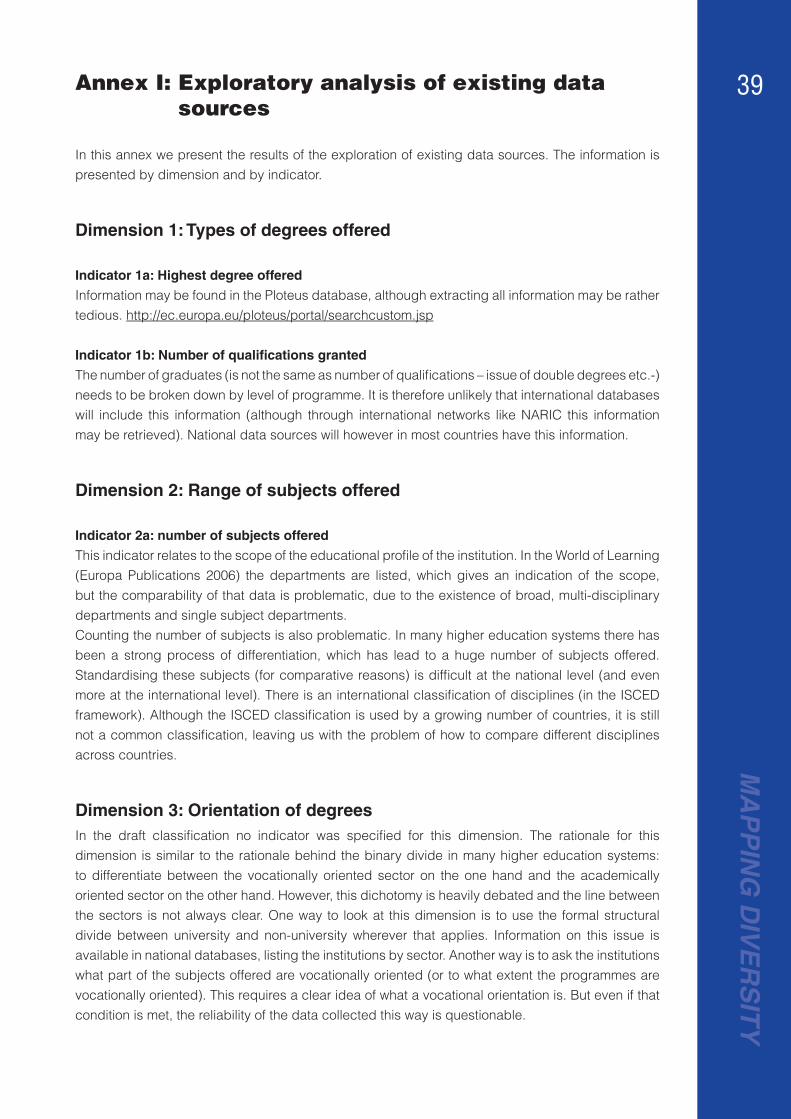
MA
PP
ING
DIV
ER
SIT
Y
39Annex I: Exploratory analysis of existing data sources
In this annex we present the results of the exploration of existing data sources. The information is presented by dimension and by indicator.
Dimension 1: Types of degrees offered
Indicator 1a: Highest degree offered
Information may be found in the Ploteus database, although extracting all information may be rather tedious. http://ec.europa.eu/ploteus/portal/searchcustom.jsp
Indicator 1b: Number of qualifi cations granted
The number of graduates (is not the same as number of qualifi cations – issue of double degrees etc.-) needs to be broken down by level of programme. It is therefore unlikely that international databases will include this information (although through international networks like NARIC this information may be retrieved). National data sources will however in most countries have this information.
Dimension 2: Range of subjects offered
Indicator 2a: number of subjects offered
This indicator relates to the scope of the educational profi le of the institution. In the World of Learning (Europa Publications 2006) the departments are listed, which gives an indication of the scope, but the comparability of that data is problematic, due to the existence of broad, multi-disciplinary departments and single subject departments.Counting the number of subjects is also problematic. In many higher education systems there has been a strong process of differentiation, which has lead to a huge number of subjects offered. Standardising these subjects (for comparative reasons) is diffi cult at the national level (and even more at the international level). There is an international classifi cation of disciplines (in the ISCED framework). Although the ISCED classifi cation is used by a growing number of countries, it is still not a common classifi cation, leaving us with the problem of how to compare different disciplines across countries.
Dimension 3: Orientation of degreesIn the draft classifi cation no indicator was specifi ed for this dimension. The rationale for this dimension is similar to the rationale behind the binary divide in many higher education systems: to differentiate between the vocationally oriented sector on the one hand and the academically oriented sector on the other hand. However, this dichotomy is heavily debated and the line between the sectors is not always clear. One way to look at this dimension is to use the formal structural divide between university and non-university wherever that applies. Information on this issue is available in national databases, listing the institutions by sector. Another way is to ask the institutions what part of the subjects offered are vocationally oriented (or to what extent the programmes are vocationally oriented). This requires a clear idea of what a vocational orientation is. But even if that condition is met, the reliability of the data collected this way is questionable.

MA
PP
ING
DIV
ER
SIT
Y
40 Indicator 3a: number of programmes leading to certifi ed/ regulated professions as a % of the
total number of programmes
In the questionnaire used in the survey references are listed to websites at which (national) lists of regulated professions can be found.
Indicator 3b: the number of programmes offered that answer to a particular demand from the
labour market or professions (as % of the total number of programmes)
This indicator asks for a subjective assessment of the proportion and therefore the question on existing data sources is not applicable.
Dimension 4: Involvement in life long learning
Indicator 4a: number of adult learners as a % of total number of students by type of degree
International databases do not breakdown enrolment data by institution. Even national agencies very often present enrolment data by age only at the system or sector level.
Dimension 5: Research intensiveness
Indicator 5a: number of peer reviewed publications per fte academic staff
This indicator is self-reported, therefore the question on existing data sources is not applicable.
Indicator 5b: the ISI based citation indicator, also known as the ‘crown indicator’
For this indicator, the ISI databases are the obvious international data sources to use. There are some methodological issues to resolve and there is the issue of the licence to use data on the institutional level. Co-operation with CWTS, Leiden University is envisaged.
Dimension 6: Innovation intensiveness The EU administers the Community Innovation Survey: A bi-annual survey among companies and (in some countries higher education institutions). Based on interviews with the Dutch statistical offi ce is seems highly unlikely that this source will yield data on higher education institutions (at the institutional level) for a reasonable range of countries.
Indicator 6a: Number of start up fi rms
There is no encompassing European database on start ups. There are a number of initiatives/ research projects that have addressed the issue.One of the disturbing results of the analysis of such projects is that there is no clear unambiguous defi nition of start ups. That means that the counting of start ups may be biased by ’deviant’ national, institutional or even departmental practices.
OECD DSTIThe Industry Science Relationships Outlook report (2002). In this biannual report ten ISRs are identifi ed, of which spin-offs are one and licensing is another. OECD is working towards a generic model, allowing international comparison. This information base may be used as context information at the national level, but there are no data in it at the institution level.

MA
PP
ING
DIV
ER
SIT
Y
41EUThe Rebaspinoff projects (part of the PRIME Network of Excellence). The research projects focus on research based spinoffs. Within these projects data on spin-offs have been collected, but there is no consistent database built.
List of specifi c studies on this issueGermany. The ZEW (Zentrum für Europäische Wirtschaftsforschung) has performed a study into spin offs. This report (Gründungen aus Hochschulen und der öffentlichen Forschung) provides quantitative data on spin offs of universities and research institutes in Germany in the period 1996 till 2000 and gives information on their economic success. 20.000 companies participated in a survey. The Netherlands. The Ministry of Economic Affairs published a report on spin-offs. The information in that study refers mainly to the Dutch situation although there are a number of international benchmark institutions described. There are no hard data: they are based on self-reported institutional data in interviews with experts and stakeholders. UK. HEFCE administers an annual Higher education-business and community interaction survey. In the latest version data on a number of knowledge transfer indicators are presented for each institution separately:
Income from collaborative research1. Number of consultancy contracts2. Income from regeneration and development programmes3. Patents fi led4. Spinoffs5. Free events (exhibitions etc.)6.
http://www.hefce.ac.uk/pubs/hefce/2006/06_25/
Indicator 6b: The number of patent applications fi led
There is a European database on patents (http://nl.espacenet.com)This database is not limited to higher education institutions and the number of patents awarded to them or researchers working there. The data on industry based indicators need to be fi ltered out.There is an issue of national context here. The ownership of patents differs between countries. Whether a patent is owned by the university or the individual researcher may have an impact on the results from the analyses or the effort that needs to be put in for extracting the correct information from the database.The Support Group for Research and Innovation at the Catholic University of Leuven, Belgium (SIOO) has databases on this dimension.
Indicator 6c: Annual licensing income
The SIOO has databases on this dimension.
Indicator 6d: Revenues from privately funded research contracts as a % of total research
revenues
Most international databases that have information on this indicator are at the aggregated (national) level. There is one research project, funded by the EC5 in which the income of a sample of universities in six countries is analysed (the CHINC- project). The dataset comprises data on 100 institutions for the period 1995 till 2003 on income by source. The data originate from national data sources.
7 The project, “Changes in University Incomes: Their Impact on University-Based Research and Innovation” (CHINC) was commissioned by the European Commission as represented by the Institute for Prospective Technological Studies of the Joint Research Centre (contract no. 22537-2004-12 F1ED SEV NO).

MA
PP
ING
DIV
ER
SIT
Y
42 The report (Jongbloed, Lepori et al. 2006) has a one time character: it is not planned to repeat the exercise. The study may be an important input to assess the pitfalls and potentials of analyzing the data sources used in the CHINC project.
Dimension 7: International orientation: teaching and staffAgain, the international databases do not provide information at the institution-level. World of Learning does not provide information on international students.There are data available on participants in EU programmes (Kelo, Teichler et al. 2006) but these students refl ect only part of the international orientation of a higher education institution. Data on other exchange activities may be found through the NARIC network.
Indicator 7a: the number of degree seeking students with a foreign nationality, as % of total
enrolment
The general remarks made above apply.
Indicator 7b: the number of incoming students in European exchange programmes, as % of
total enrolment
The general remarks made above apply.
Indicator 7c: the number of students sent out in European exchange programmes
The general remarks made above apply.
Indicator 7d: International staff members as % of total staff
The question of what international means applies here as well. Are staff members with foreign nationality international or only if they have obtained their degree abroad? The indicator is formulated in terms of staff, whereas it is more interesting to look at academic staff.It is highly unlikely that this information can be found in international databases. Even in national databases it is questionable whether this information is available at the institutional level.
Indicator 7e: number of programmes offered abroad
We have not come across international or national databases comprising information broken down along this dimension. There maybe some research reports on this issue.
Dimension 8: International orientation: research
Indicator 8a: Revenues from EU research programmes as % of total research revenues
We could not identify any international database comprising this information on the institution-level. In EU research programmes higher education institutions are in most cases part of consortia. Identifi cation of the turnover realized by an individual institution is therefore rather tedious. This is probably the reason why there is no international database found on this indicator.
Dimension 9: Size
Indicator 9a: number of students enrolled (headcount)
Whether data on enrolment are available in international databases depends on the required breakdown of the data. If no further breakdown is needed, data are available in sources like the

MA
PP
ING
DIV
ER
SIT
Y
43World of Learning. If a further breakdown by level of program, discipline or mode of enrolment is required we shall have to turn to national sources.
Indicator 9b: number of staff (fte)
International data sources again fall short of information on staff. World of Learning provides information on numbers of teachers but it is not clear whether all academic staff refers to teaching staff only. If it is teaching staff only the information needs to be complemented with data on other, non-teaching academic staff.There is also the issue of headcount data versus fte. With the rise of part-time professors, there may be signifi cant differences between the two.
Dimension 10: Mode of delivery
Indicator 10a: number of distance learning programmes as % of total number of
programmes
We have not come across international or national databases comprising information broken down along this dimension.
Indicator 10b: number of part-time programmes as % of total number of programmes
-
Indicator 10c: number of part-time students as a percentage of total number of students
-
Dimension 11: Public/private character
Indicator 11a: income from (competitive and non-competitive) government funding as a % of
total revenues
International databases have some information on this indicator but again it is not broken down by individual institution. The data from the CHINC project may prove to be valuable in obtaining data on some countries and identifying major obstacles in working with national databases.
Indicator 11b: income from tuition fees as % of total income
-
Dimension 12: Legal status
Indicator 12a: Legal status (private or public)
Information on this indicator is available in international databases (World of learning) and national databases.

MA
PP
ING
DIV
ER
SIT
Y
44 Dimension 13: Cultural engagement
Indicator 13a: number of offi cial concerts and performances (co)-organised by the
institution
-
Indicator13b: number of offi cial exhibitions (co)-organised by the institution
-
Dimension 14: Regional engagement
14a: annual turnover in EU structural funds as % of total turnover
-
14b: number of graduates remaining in the region as % of total number of graduates
-
14c: number of extracurricular courses offered for the regional labour market
-
14d: importance of local/regional income sources
-

MA
PP
ING
DIV
ER
SIT
Y
45Annex II: The case studies
Case Study: Norwegian University of Science and Technology (NTNU)
Introduction
The purpose of the case study was:to assess the potential use of a European classifi cation;• to fi nd out to what extent the dimensions and indicators are seen to be relevant and feasible;• to fi nd out to what extent the necessary data would be available or could be produced.•
General issues
NTNU is a university with a broad academic scope that has its main focus on technology and the natural sciences. The university has about 20 000 students and 4800 staff. NTNU has been given the national responsibility for graduate engineering education in Norway and offers an extensive range of subjects in the natural sciences, technology, the humanities, aesthetic studies, health studies, the social sciences and fi nancial and economic disciplines. NTNU also offers education in the professions: technology, medicine, psychology, architecture, fi ne art, music, pictorial art, architecture and teacher education.
The Classifi cation was judged by NTNU as highly relevant. It would help NTNU to better get to know itself, to better formulate its profi le and its mission, to further develop its identity and to create more visibility.
Internationally it would allow NTNU to create visibility as a specifi c type of higher education institution. Additionally it would allow better and more focused benchmarking. Nationally it would mark the differences between existing types of institutions. Internally it would stimulate strategic discussions and (as mentioned) assist in creating the institutional identity.
But the Classifi cation will also be a political tool, according to NTNU. Governmental and other actors will use it to target and differentiate their policies. NTNU accepts this.
The relationships between the Classifi cation and Quality Assessments should be made more explicit. The dimensions and indicators may be descriptive but they also imply judgments in terms of quality. External actors will use the indicators to assess the ‘quality’ of an institution in the various dimensions. The public may judge the quality and relevance of an institution using the Classifi cation. Thresholds per indicator will be interpreted as minimum quality levels.
The success of the classifi cation will to a large extend depend on the robustness of the indicators. Precise defi nitions and a strong and convincing standardisation are crucial. In addition, since the institutions will have to provide the data, the time and energy to be spent on data-gathering should be as little as possible.
Special attention should be given to the validity and reliability of the data. Data should be available in public repositories. Special ‘data-audits’ (e.g., by national agencies, perhaps existing accreditation agencies or statistical offi ces) could be undertaken to assess the data-provision. Data-audits should be undertaken by ‘accredited auditors’.

MA
PP
ING
DIV
ER
SIT
Y
46 A crucial issue which needs further analysis is the way interdisciplinarity (both in education and in research) can be addressed. In education the ‘range of subjects’ may imply a disciplinary bias. In research, citation analysis and related approaches may show a similar bias. It is important to fi nd indicators that capture interdisciplinarity.
Dimensions and Indicators
During four different sessions the dimensions and indicators were discussed regarding:education;• research;• international orientation;• institutional aspects.•
In the following texts the various remarks and conclusions are presented per indicator per dimension.
Dimension 1: types of degrees offeredIndicator 1.1.1.: highest degree offered
a good and important indicator;• data are easy to provide.•
Indicator 1.1.2.: number of qualifi cations granted
important to distinguish level and year;• data are easy to provide.•
Dimension 2: range of subjects offeredIndicator 1.2.1.: number of subjects offered
subjects should be understood as ‘areas in which degree programmes are offered’;• in Norway the Bureau of Statistics makes a distinction between:•
study areas (defi ned by government for all higher education institutions);o programmes (per study area; higher education institutions are free to design these);o courses (forming the programmes);o does ISCED provide an internationally shared list of study areas? Is this comparable with the o Norwegian list?in Norway in addition to the list of areas, a group of usually interdisciplinary programmes exists o as well; these should also be captured in this indicator.
Indicator is important;• Indicator appears to be insuffi ciently clear;• Data can only be provided if a generally acceptable list of study areas exists.•
Dimension 3: orientation of degreesDimension appears to create much confusion. It is nevertheless judged to be important to enable the Classifi cation to offer categories of institutions. Could it be related to Qualifi cation Frameworks (European and National)?

MA
PP
ING
DIV
ER
SIT
Y
47Indicator 1.3.1.: number of programmes offered for licensed professions
there are also professional training programmes in Norway that are not formally licensed • (engineering, architecture, teacher training);professional licensing will be different in different countries;• what about lifelong learning programmes (e.g., experience-based master programmes)?• perhaps two categories of professional programmes:•
formally licensed and/or accredited by professional organisations;o implicitly licensed by ‘acceptance in the professional fi eld’ (engineers, teachers).o
data may be diffi cult to compare.•
Indicator 1.3.2.: number of programmes considered by the institution to be professional programmes
will create much confusion and strategic behaviour;• data will be diffi cult to compare;•
Dimension 4: European educational profi leThis dimension is incorporated in ‘International Orientation’.
Dimension 5: research intensiveness
Indicator 2.2.1.: number of peer reviewed publications (per fte staff? Per number of staff?).
important indicator;• normalise per fi eld/discipline; also important to know number of researchers per fi eld in the • institution;data can be provided; in Norway the national registration system (Frida) offers this information.•
Extra indicator 2.2.1a: CWTS crown indicator.
too little information about it;• if it addresses scientometric problems, it should be preferred;• particularly attention needed for research outcomes in engineering (design results) and in arts • (concerts, performances, exhibitions, etc.); also make sure interdisciplinarity is addressed in a fair manner.
Dimension 6: innovation intensiveness researchThe most important indicator here is revenue generated from privately funded research as % of total institutional funding (or total research funding? Data on this are not available). In this indicator all research related income can be incorporated, i.e. revenues from:
licensing agreements;• start-ups and spin-offs;• contract research;• selling shares.•
An extra indicator under this dimension could be: number of invention disclosures. NTNU’s Transfer Offi ce fi les these data.
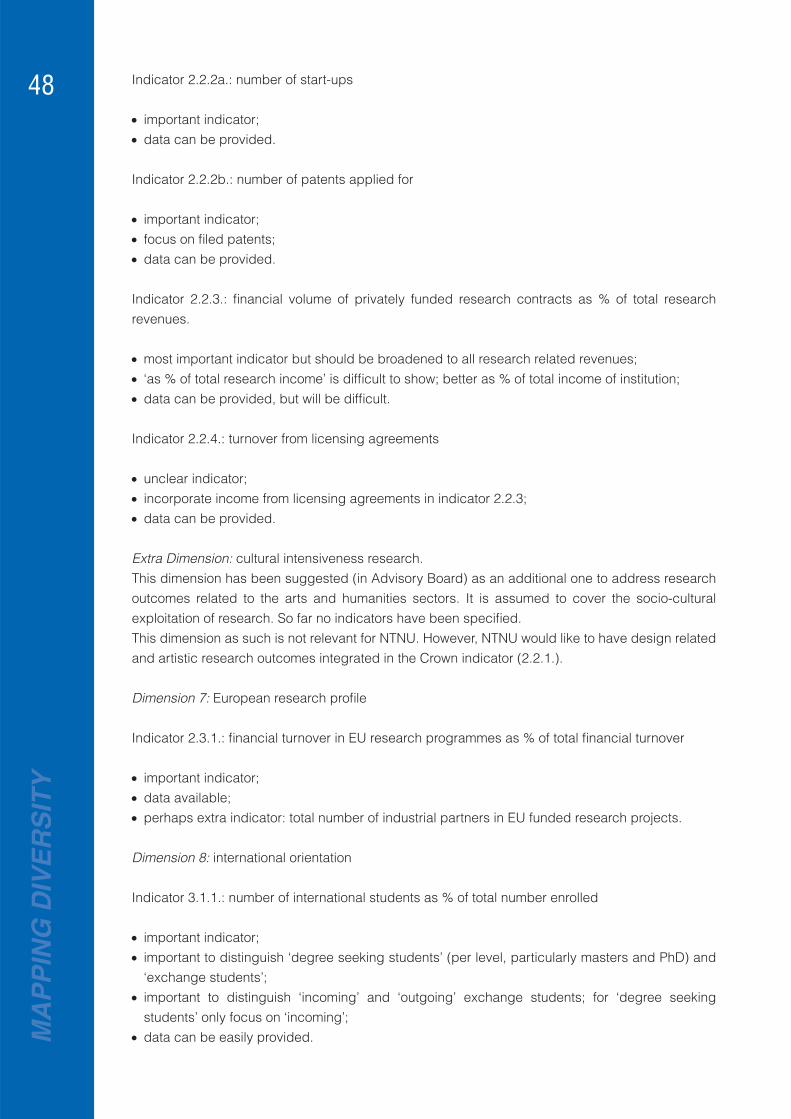
MA
PP
ING
DIV
ER
SIT
Y
48 Indicator 2.2.2a.: number of start-ups
important indicator;• data can be provided.•
Indicator 2.2.2b.: number of patents applied for
important indicator;• focus on fi led patents;• data can be provided.•
Indicator 2.2.3.: fi nancial volume of privately funded research contracts as % of total research revenues.
most important indicator but should be broadened to all research related revenues;• ‘as % of total research income’ is diffi cult to show; better as % of total income of institution;• data can be provided, but will be diffi cult.•
Indicator 2.2.4.: turnover from licensing agreements
unclear indicator;• incorporate income from licensing agreements in indicator 2.2.3;• data can be provided.•
Extra Dimension: cultural intensiveness research.This dimension has been suggested (in Advisory Board) as an additional one to address research outcomes related to the arts and humanities sectors. It is assumed to cover the socio-cultural exploitation of research. So far no indicators have been specifi ed.This dimension as such is not relevant for NTNU. However, NTNU would like to have design related and artistic research outcomes integrated in the Crown indicator (2.2.1.).
Dimension 7: European research profi le
Indicator 2.3.1.: fi nancial turnover in EU research programmes as % of total fi nancial turnover
important indicator;• data available;• perhaps extra indicator: total number of industrial partners in EU funded research projects.•
Dimension 8: international orientation
Indicator 3.1.1.: number of international students as % of total number enrolled
important indicator;• important to distinguish ‘degree seeking students’ (per level, particularly masters and PhD) and • ‘exchange students’;important to distinguish ‘incoming’ and ‘outgoing’ exchange students; for ‘degree seeking • students’ only focus on ‘incoming’;data can be easily provided.•
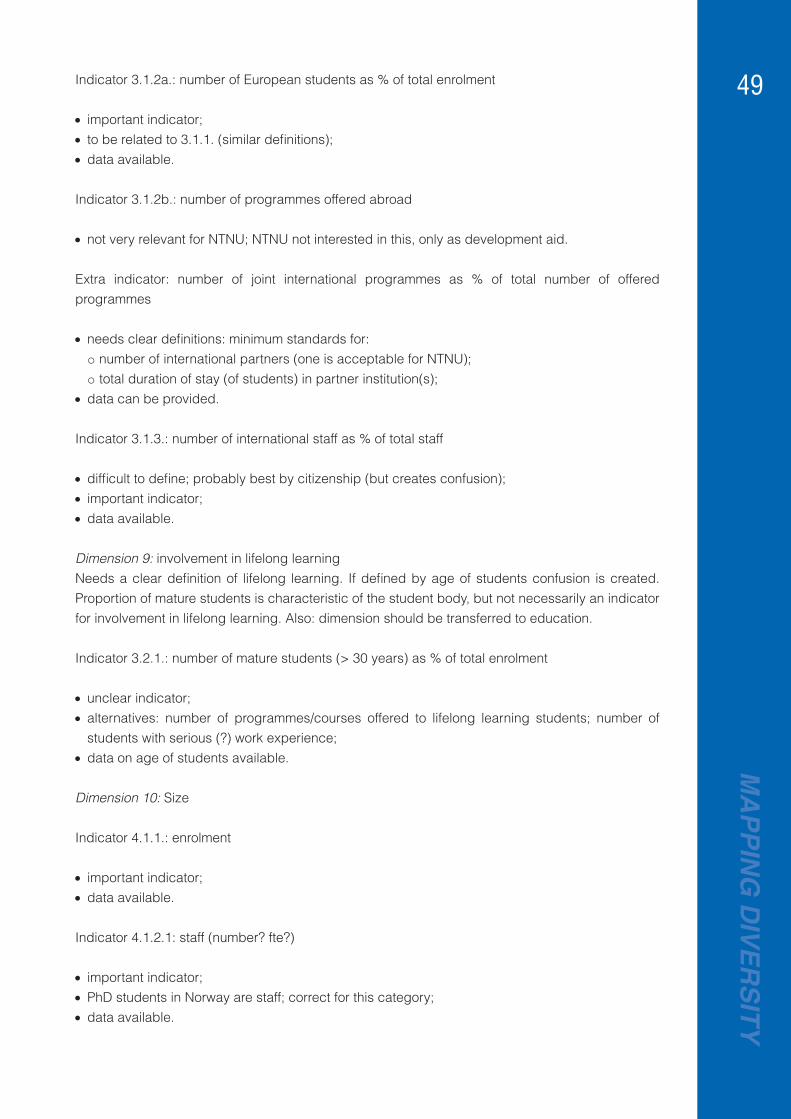
MA
PP
ING
DIV
ER
SIT
Y
49Indicator 3.1.2a.: number of European students as % of total enrolment
important indicator;• to be related to 3.1.1. (similar defi nitions);• data available.•
Indicator 3.1.2b.: number of programmes offered abroad
not very relevant for NTNU; NTNU not interested in this, only as development aid.•
Extra indicator: number of joint international programmes as % of total number of offered programmes
needs clear defi nitions: minimum standards for:• number of international partners (one is acceptable for NTNU);o total duration of stay (of students) in partner institution(s);o
data can be provided.•
Indicator 3.1.3.: number of international staff as % of total staff
diffi cult to defi ne; probably best by citizenship (but creates confusion);• important indicator;• data available.•
Dimension 9: involvement in lifelong learningNeeds a clear defi nition of lifelong learning. If defi ned by age of students confusion is created. Proportion of mature students is characteristic of the student body, but not necessarily an indicator for involvement in lifelong learning. Also: dimension should be transferred to education.
Indicator 3.2.1.: number of mature students (> 30 years) as % of total enrolment
unclear indicator;• alternatives: number of programmes/courses offered to lifelong learning students; number of • students with serious (?) work experience;data on age of students available.•
Dimension 10: Size
Indicator 4.1.1.: enrolment
important indicator;• data available.•
Indicator 4.1.2.1: staff (number? fte?)
important indicator;• PhD students in Norway are staff; correct for this category;• data available.•

MA
PP
ING
DIV
ER
SIT
Y
50 New indicator: budget/total turnover
needed, to relate to other indicators;• data available.•
Dimension 11: mode of delivery
Indicator 4.2.1.: campus vs. distance (% of programme? % of students?)
dimension should be transferred to ‘education’;• unclear indicator because more and more programmes are ‘dual mode’; distributed learning • becomes more important.
Indicator 4.2.2.: number of part time programmes offered as % of total number of programmes
this additional indicator was suggested by Advisory Board;• unclear indicator;• perhaps to relate to Dimension 9 (lifelong learning)?•
Dimension 12: community servicesThis dimension is vague. Perhaps better not use
Dimension 13: public/private character
Indicator 4.4.1.: % private income in total income
important indicator;• private funding should include funding by public organisations that contract out to the institution • for specifi c tasks;data available.•
Dimension 14: legal status
Indicator 4.5.1: public/private status
to be defi ned in legal terms;• in Norway universities are state institutions.•

MA
PP
ING
DIV
ER
SIT
Y
51Case Study: University of Strathclyde
Introduction
The purpose of the case study was:to assess the potential use of a European classifi cation;• to fi nd out to what extent the dimensions and indicators are seen to be relevant and feasible;• to fi nd out to what extent the necessary data would be available or could be produced.•
General issues
The University is an old Scottish university, having its roots in the technological fi elds. During the last half century, the scope of the university was expanded into a university with fi ve faculties (Education; Engineering; Law, arts & social science; Science; and a Business school). The university has a focus on entrepreneurship and on ‘useful learning’.
The potential role of a European Classifi cation of Institutions of Higher Education was discussed in the context of the use and abuse of international league tables. These league tables, especially the Shanghai one are very much focused on the American model of a research university. In many Asian higher education systems (the systems where potentially most international students come from) this model is seen as the dominant and best model. A European classifi cation of higher education institutions, if it is robust and trustworthy, may serve to challenge the dominance of the American model and to put the European model on the international stage.
The main use of a classifi cation would be to contribute to the identifi cation of robust benchmarks. Nowadays, the benchmarks are identifi ed based on potentially outdated views and perceptions. Specialised higher education institutions, like the University of Strathclyde, have a problem identifying those. The use of league tables is not very helpful in this respect. The main impact the league tables have is on the recruitment of international (undergraduate) students and on international MBA students. A robust classifi cation would help to overcome the problems of the league tablesBut the issue is not only an international one: it also has a national/ UK dimension. The bulk of the competitors/ potential benchmark institutions are located within the UK. The international student market is becoming more and more important, but it is also essential for the internal market to have a robust instrument to identify the benchmark institutions.
The university is developing a new strategy in which the performance of the departments and academic services are under scrutiny. The perception that the University’s position was deteriorating was partly fed by the information from the national rankings. The use of a classifi cation as a benchmark fi nding tool would improve the institutions capacity to better position itself and act on that information.
Another area where a trustworthy classifi cation would be very welcome is the international recruitment of students. The university’s experience is that applications from international students, and more specifi cally Asian students are very much infl uenced by (changes in) the position of the university in international rankings (like the Shanghai and Times Higher rankings).
The use of a classifi cation may play a role in fundraising but here, the impact of a classifi cation is expected to be limited. The bulk of fundraising activities is related to specifi c projects and has a predominantly regional or local focus.

MA
PP
ING
DIV
ER
SIT
Y
52 Dimensions and Indicators
During six different sessions the dimensions and indicators were discussed regarding:education;• research;• international orientation;• institutional aspects.•
General practical aspectsThe university has to comply with very detailed data-reporting requirements from both HESA and the Scottish HE funding council. Most of the data-elements of the classifi cation questionnaire are covered in those data-reporting activities. However, the exact defi nitions and breakdowns requested in the draft-classifi cation questionnaire are not always fully compatible with the defi nitions and breakdowns used in the national data-reporting activities.The administrative burden for the university would be reduced and the response rate might be raised if the questionnaire would follow the national data reporting as closely as possible. In addition, this may lead to a better reliability of data since the national data-reporting is extensively validated. Reworking the data increases the risk of errors and different interpretations. .The suggestions developed here were to check for national data repositories and to add a question in the questionnaire on whether the data requested are already reported to a national data agency (and if so to what agency).
In the following texts the various remarks and conclusions are presented per indicator per dimension.
Dimension 1: types of degrees offered
Indicator 1.1.1.: highest degree offereda good and important indicator;• data are easy to provide.•
Indicator 1.1.2.: number of qualifi cations granted data are easy to provide.•
Dimension 2: range of subjects offered
Indicator 1.2.1.: number of subjects offeredIt was suggested to use national conversion tables for the indicator on subjects. University • staff do not use the ISCED categories. The data reporting to the international organizations is done by national agencies (Ministry or central statistical offi ce). These agencies use national conversion tables to convert the national subject categories into the ISCED categories. If such conversion tables could be presented (in an extra info-fi eld) institutions may be able to complete the question.
Dimension 3: orientation of degrees
Indicator 1.3.1.: number of programmes offered for licensed professionsdata may be diffi cult to compare.•

MA
PP
ING
DIV
ER
SIT
Y
53Indicator 1.3.2.: number of programmes considered by the institution to be professional programmes
data will be diffi cult to compare;•
Dimension 4: European educational profi le
This dimension is incorporated in ‘International Orientation’.
Dimension 5: research intensiveness
Indicator 2.2.1.: number of peer reviewed publications (per fte staff? Per number of staff?).
important indicator;• The project team should be very clear in defi ning academic staff. In the RAE work teaching staff • and research staff are separated from staff involved in teaching and research. It was debated whether the traditional academic staff (combining research and teaching) should be counted only or whether teaching assistants and research assistants should be counted as well. Given the international practice, the latter is the preferred wayAn additional indicator for this dimension was suggested: 2.2.1a: CWTS crown indicator.•
Dimension 6: innovation intensiveness researchIt was suggested that the indicator for the innovativeness of research (number of contracts with business and industry) could be refi ned. Looking at the number of new contract partners is a more telling indicator for innovativeness. It takes a more dynamic view on innovation. Whether this information will be readily available for all UK higher education institutions can be questioned.The university uses four indicators or instruments for the commercialisation of research activities: patents, licensing, royalties and spin out companies. It has also information on the interaction of the university with SME.
Indicator 2.2.2a.: number of start-upsimportant indicator;• data can be provided.•
Indicator 2.2.2b.: number of patents applied forimportant indicator;• data can be provided.•
Indicator 2.2.3.: fi nancial volume of privately funded research contracts as % of total research revenues.
important indicator but should be broadened to all research related revenues;• data can be provided. • attention was focused on the way resources and costs are accounted for. The principle of full • academic costing is relatively new to the university and it has raised the overall costs. When fi nancial data on resources or turn-over are used in an international comparative way, it has to be clear that the same price method is used in all countries
Indicator 2.2.4.: turnover from licensing agreementsdata can be provided.• It was furthermore suggested to expand the indicator on the innovativeness of research. In •

MA
PP
ING
DIV
ER
SIT
Y
54 addition to the volume of the contracts with industry, the institution should indicate to what extent the contracts are with local, national or international industry
Dimension 7: European research profi le
Indicator 2.3.1.: fi nancial turnover in EU research programmes as % of total fi nancial turnoverimportant indicator;• data available;• it was suggested to add an indicator or expand the indicator on the European research profi le. • The new or expanded indicator should refer to international research income (not limited to European).
Dimension 8: international orientation
Indicator 3.1.1.: number of international students as % of total number enrolleddata can be easily provided.•
Indicator 3.1.2a.: number of European students as % of total enrolmentdata available.•
Indicator 3.1.2b.: number of programmes offered abroaddata can be provided.•
Indicator 3.1.3.: number of international staff as % of total staffdata on nationality is not readily available. •
Dimension 9: involvement in lifelong learning
Indicator 3.2.1.: number of mature students (> 30 years) as % of total enrolment
unclear indicator;• data on age of students available.•
Dimension 10: Size
Indicator 4.1.1.: enrolment
important indicator;• data available.•
Indicator 4.1.2.1: staff (number? fte?)
important indicator;• data available.•
Dimension 11: mode of delivery
Indicator 4.2.1.: campus vs. distance

MA
PP
ING
DIV
ER
SIT
Y
55Indicator 4.2.2.: number of part time programmes offered as % of total number of programmes
this additional indicator was suggested by the Advisory Board;• data are available•
Dimension 12: community servicesThe University of Strathclyde has conducted a study to assess the impact of the University on the region6. The information from that study may be a valuable input for the discussions regarding the dimension on community services (even though the study is a quite intensive econometric analysis).
Dimension 13: public/private character
Indicator 4.4.1.: % private income in total incomeThe fact that information on tuition fees is missing is seen as an omission.• important indicator;• data available.•
Dimension 14: legal status
Indicator 4.5.1: public/private status
to be defi ned in legal terms;•
Extra Dimension: cultural intensiveness research.This dimension has been suggested (in Advisory Board) as an additional one to address research outcomes related to the arts and humanities sectors. It is assumed to cover the socio-cultural exploitation of research. So far no indicators have been specifi ed.This dimension as such is not relevant for University of Strathclyde.
8 Ursula Kelly, Donald McLellan, Iain McNicoll: Strathclyde means business, The impact of the University of Strathclyde on the economy of Scotland and on the City of Glasgow.

MA
PP
ING
DIV
ER
SIT
Y
56 Annex III: The pilot survey
Introduction
Purpose of the pilot surveyThe main purpose of the pilot survey was to test the questionnaires that were to be sent out to a larger group of higher education institutions. Identifi cation of fl aws in the questionnaires in the eyes of respondents in higher education institutions and getting their suggestions for amendments to the questionnaires were the major goals set for the pilot. A secondary purpose was to create a fi rst version of a data base on the indicators and dimensions selected.
Set-upIn co-operation with the Advisory Board, eleven higher education institutions were identifi ed that volunteered to be test cases for the pilot questionnaires. In July 2007 two questionnaires were sent out to these higher education institutions; one questionnaire on the dimensions and one on the indicators. By the end of August 2007 eight valid responses were received. These eight included the two in-depth case study institutions presented in Annex II.
The questionnairesTwo questionnaires were sent out to the test case institutions. Both questionnaires were sent out as on-line versions only.
In the questionnaire on dimensions two questions were asked (for each individual dimension):is the dimension essential for profi ling your own higher education institution? (probing the 1. perceived relevance of the dimensions)is the indicator described a valid indicator? (probing the validity of the indicators: do they 2. measure the phenomenon central to the dimension?)
Respondents had to use a slide bar to indicate to what extent they agreed or disagreed with the statements given.
In the questionnaire on the indicators respondents had to answer two blocks of questions. The fi rst block referred to the actual data and information on reference data, like totals and reference years. The second block referred to an assessment of the indicator in terms of feasibility and reliability. Respondents were furthermore invited to comment on the choice of indicators and the way they were measured.
The results
The dimensionsThe classifi cation, phase I report concluded with 14 dimensions. Based on the discussions in the Advisory Board and the Stakeholder Group (12 December 2006), the dimension ‘community engagement’ was replaced by two other dimensions: ‘regional engagement’ and ‘cultural engagement’.

MA
PP
ING
DIV
ER
SIT
Y
57The dimension ‘cultural engagement’ was considered to be the least essential for the profi les of the test cases. Comments on this dimension indicate that the way cultural engagement was defi ned raises some concern: the defi nitions are not very precise and the results may be interpreted in various ways. It was also mentioned that the scores on this dimension may be affected by the systemic and social context. ‘Involvement in life long learning’ and ‘European research profi le’ did not score well either. The comments on the latter dimension questioned the narrow European focus and suggested to broaden the focus.International orientation, research intensiveness and size scored relatively well.
Figure 2: Responses to the statement ‘this dimension is essential for the profi le of our
institution’
0% 20% 40% 60% 80% 100%
Type of highest degree
Range of subjects
Academic orientation
LLL
Research intens
Innovation intens
International orientation
European res profile
Size
Mode of delivery
Public private
Cultural engagement
Regional engagement
strongly agree
agree
neutral
disagree
strongly disagree

MA
PP
ING
DIV
ER
SIT
Y
58 The respondents were asked also to identify the three ‘most important’ dimensions and the three ‘least important’ dimensions. The responses are not very consistent with the previous results: ‘cultural engagement’ is considered most often to be ‘least important’, and ‘involvement in LLL’ is also relatively often mentioned as least important. In contrast with the previous results, ‘European research profi le’ is not considered to be ‘least important’ and ‘regional engagement’ and ‘public/private character’ are. Research intensiveness and highest type of degree are considered most often as most important. The low score of ‘international orientation’ and ‘size’ is not in line with the previous results.Dimensions may be seen as essential for the profi le of a higher education institution, but the same dimensions for one institution are not necessarily the most important ones for another. Some comments on the ranking of dimensions corroborated this conclusion.
Figure 3: Scores on the three ‘most important’ and the three ‘least important’ dimensions
As a result of the pilot survey, the project team developed an instrument for showing the different profi les of the higher education institutions involved.
In the fi gure below, the responses are presented by case, thus providing institutional profi les that may be read as ‘mission-driven’ profi les.
0 1 2 3 4 5 6 7
Type of degree
Range of subjects
orientation
LLL
Research intens
Innovation intens
International orientation
European res profile
Size
Mode of delivery
Public private
Cultural engagement
Regional engagement
most important
least important
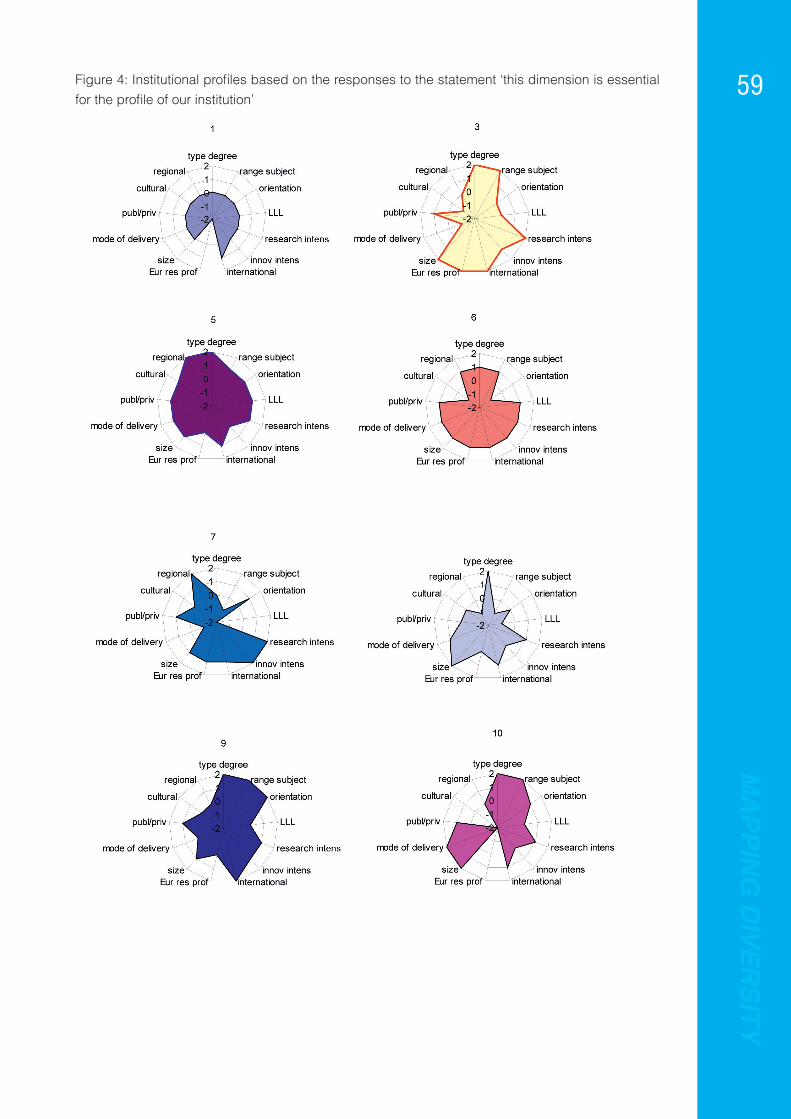
MA
PP
ING
DIV
ER
SIT
Y
59Figure 4: Institutional profi les based on the responses to the statement ‘this dimension is essential for the profi le of our institution’

MA
PP
ING
DIV
ER
SIT
Y
60 The shapes of the profi les differ substantially. This is caused partly by the differences in outspokenness of the respondents: case 1 scores very often ‘neutral’, whereas 5 and 6 have ‘agree’ as their standard score. Despite this effect, cases do differ in their opinions in what is essential for the institutional profi le. Case 8 is much more ‘research oriented’ than case 10.
5.4.1 IndicatorsThe focus of the pilot survey was to fi nd out whether the higher education institutions could provide data (in terms of feasibility and reliability), whether the presentation and formulations used were adequate, and whether the respondents considered the indicators selected as valid indicators for the dimension.
Dimension 1: highest degree offeredFor this dimension two indicators were selected: the highest degree programme offered and the number of degrees granted by type of degree. The validity of these indicators was not challenged. There were some comments on the feasibility. These comments referred to the predefi ned categories of types of degrees (doctorate, master and bachelor) that did not fi t all higher education systems and programmes. Especially the pre-Bologna programmes caused diffi culties. It proved that the second indicator could be misunderstood: number of degree programmes were reported instead of number of qualifi cations awarded (number of graduates).
Dimension 2: Range of subjects offeredFor this a list of nine subject areas was used, based on the ISCED classifi cation of subjects7. The use of the ISCED list raised some questions since institutions use national classifi cations in reporting to their national agencies, not the international ISCED classifi cation. The validity of the indicator as well as its feasibility and reliability were not challenged.
Dimension 3: Professional orientation of programmesIn the process of drafting the questionnaire it proved to be diffi cult to fi nd adequate indicators for this dimension. Two indicators were chosen: the number of programmes leading to a certifi ed or regulated profession and the number of programmes that respond to a specifi c demand. For the fi rst indicator a link to a EU list of regulated professions was provided8, but respondents appeared to be confused about the concepts of this list. The validity of the fi rst indicator was challenged by only one respondent, but the validity of the second indicator was questioned by almost all respondents. Feasibility and reliability did not score high either.
Dimension 4: Involvement in LLLLife long learning is an issue that has been high on many political agendas for a number of years. In the higher education sector, LLL is discussed quite often, but what higher education institutions actually do in this area is not very well documented. Finding an adequate indicator was therefore a tricky operation, in which the project team apparently did not fully succeed. The percentage of mature students (30+) enrolled was challenged as a valid indicator for the involvement in LLL. For some the cut-off point (30 years) was too high, while others questioned the relation between age
9 In ISCED-97 (the International Standard Classifi cation of Educational programmes) programmes are classifi ed into fi elds of education according to a 2-digit classifi cation. The classifi cation is consistent with the fi elds defi ned in the manual ‘Fields of Education and Training’ (Eurostat, 1999). For further information see OECD (2004). Handbook for Internationally Comparative Education Statistics. Paris.10 The EU has developed guidelines for the recognition of professional qualifi cations.A list of European regulation and national lists of regulated professions can be found on the website: http://ec.europe.eu/internal_market/qualifi cations/regprof/index.cfm

MA
PP
ING
DIV
ER
SIT
Y
61and life long learning. Feasibility and reliability were also ‘below standard’. Surprisingly, 6 out of ten institutions could provide data, although in half of the cases special calculations had to be made.
Dimension 5: research intensivenessResearch intensiveness is indicated by two indicators: the CWTS ‘crown’-indicator9 (a citation based composite indicator) and the number of peer reviewed publications per fte academic staff. Although the ‘crown’-indicator is seen as a state of the art indicator as far as citation scores are concerned, only half of the respondents agreed that this indicator is a valid indicator for research intensiveness. From the comments we conclude that the reluctance for this indicator is based on the argument that social sciences and humanities and arts are poorly represented when using citations scores as an indicator. The term ‘peer reviewed’ evoked some comments. Some institutions equate peer reviewed with refereed and in some institutions (especially universities of applied sciences) there is no distinction made between normal publications and peer reviewed publications. The reliability of the data from this indicator is questioned by half of the respondents, whereas the other half strong supports this indicator as a valid one. Feasibility scores relatively low.
Dimension 6: Innovation intensivenessFour indicators were selected in this dimension: the number of start-up fi rms (annual average of last three years), the number of applications for patents fi led per fte academic staff, the amount of licensing income as a percentage of total income, and the fi nancial volume of private research contracts as a percentage of total research revenues. Patents and private research contracts are seen by most respondents as valid indicators, although there are also some respondents that question the validity of patents as indicators of innovation intensiveness. There were furthermore some comments on the scope of patents and licensing income: whether it included medicine or not.
Dimension 7: International orientationThis dimension covers the international orientation of a higher education institution in teaching and training. The fi rst indicator addresses the free movers; students who enrol abroad with the intention to get a full degree. The second indicator addresses the European mobility programmes and the activities of the institution in that area. Programme offering abroad (off-shore teaching) is the third indicator in this dimension. The fourth indicator refers to the international character of the academic (teaching) staff. The validity of the fi rst and fourth indicator is not or only marginally challenged. The validity of the European mobility indicator is challenged more because of its focus on Europe only. There are also some comments on practical issues like the use of the academic year, which European programmes to include, and what degree level students to include. The indicator ‘programmes delivered abroad’ also raised some questions: whether joint degree programmes were to be excluded? What does delivery abroad actually mean? Feasibility and reliability of this indicator did not score very well.
Dimension 8: European research profi leThe fi nancial turnover in European research programmes as a percentage of total turnover in research programmes was not considered to be a very valid indicator for this dimension. There was furthermore a technical comment on the difference between total turnover and total revenues. Data are available, but it proved not all that easy to collect them.
11 the fi eld normalised citation score, developed by the Centre for Science and Technology Studies (CWTS) at Leiden University, better known as the “crown indicator”. This bibliometric indicator focuses on the impact the publications of a research group or institute have and relates it to a worldwide fi eld-specifi c reference value. Further Information on this crown indicator can be found at the web site of CWTS (www.cwts.nl).
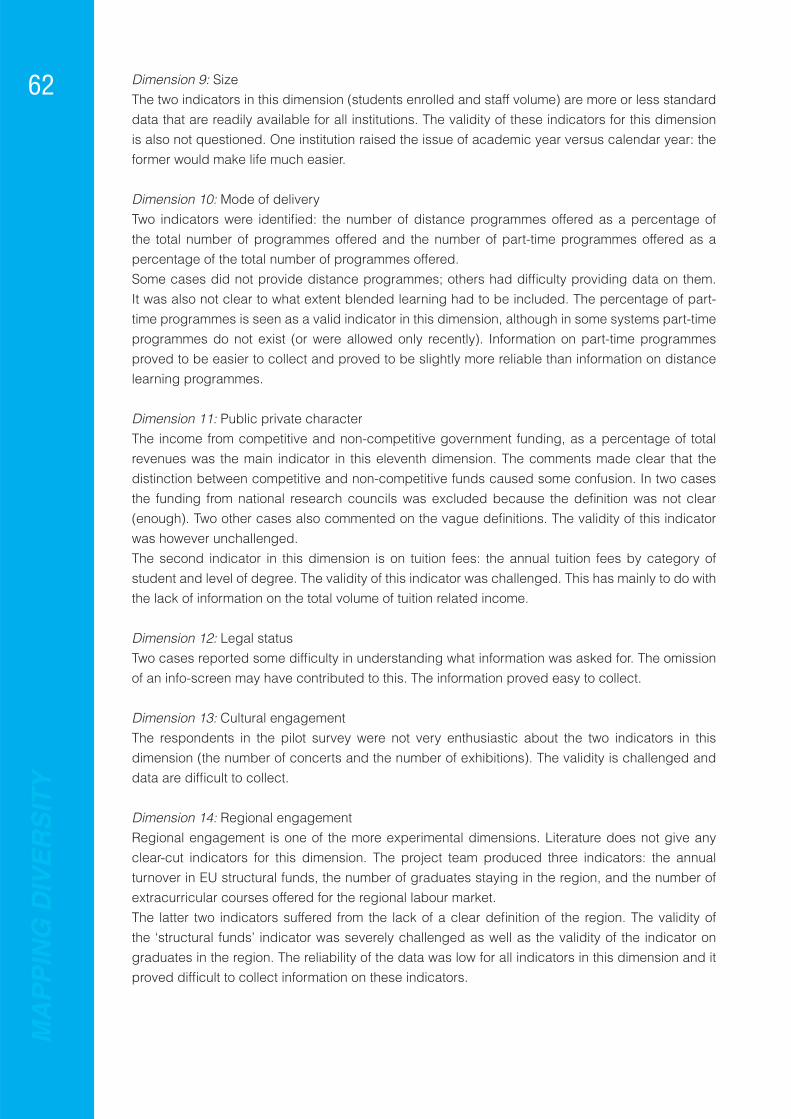
MA
PP
ING
DIV
ER
SIT
Y
62 Dimension 9: SizeThe two indicators in this dimension (students enrolled and staff volume) are more or less standard data that are readily available for all institutions. The validity of these indicators for this dimension is also not questioned. One institution raised the issue of academic year versus calendar year: the former would make life much easier.
Dimension 10: Mode of deliveryTwo indicators were identifi ed: the number of distance programmes offered as a percentage of the total number of programmes offered and the number of part-time programmes offered as a percentage of the total number of programmes offered. Some cases did not provide distance programmes; others had diffi culty providing data on them. It was also not clear to what extent blended learning had to be included. The percentage of part-time programmes is seen as a valid indicator in this dimension, although in some systems part-time programmes do not exist (or were allowed only recently). Information on part-time programmes proved to be easier to collect and proved to be slightly more reliable than information on distance learning programmes.
Dimension 11: Public private characterThe income from competitive and non-competitive government funding, as a percentage of total revenues was the main indicator in this eleventh dimension. The comments made clear that the distinction between competitive and non-competitive funds caused some confusion. In two cases the funding from national research councils was excluded because the defi nition was not clear (enough). Two other cases also commented on the vague defi nitions. The validity of this indicator was however unchallenged. The second indicator in this dimension is on tuition fees: the annual tuition fees by category of student and level of degree. The validity of this indicator was challenged. This has mainly to do with the lack of information on the total volume of tuition related income.
Dimension 12: Legal statusTwo cases reported some diffi culty in understanding what information was asked for. The omission of an info-screen may have contributed to this. The information proved easy to collect.
Dimension 13: Cultural engagementThe respondents in the pilot survey were not very enthusiastic about the two indicators in this dimension (the number of concerts and the number of exhibitions). The validity is challenged and data are diffi cult to collect.
Dimension 14: Regional engagementRegional engagement is one of the more experimental dimensions. Literature does not give any clear-cut indicators for this dimension. The project team produced three indicators: the annual turnover in EU structural funds, the number of graduates staying in the region, and the number of extracurricular courses offered for the regional labour market.The latter two indicators suffered from the lack of a clear defi nition of the region. The validity of the ‘structural funds’ indicator was severely challenged as well as the validity of the indicator on graduates in the region. The reliability of the data was low for all indicators in this dimension and it proved diffi cult to collect information on these indicators.

MA
PP
ING
DIV
ER
SIT
Y
63ConclusionsThe pilot survey showed that the questionnaires were a suitable instrument for collecting information and data for the project. However, the time and effort needed to complete the questionnaires, especially the one on indicators, proved to be an obstacle that may keep higher education institutions from completing the questionnaires and participating in the classifi cation.
Based on the results of the pilot survey, a number of changes were made to the questionnaires.Clarifi cation of the purpose of the survey and, the defi nition of indicators has been upgraded• The assessment panel (lower part of the pages on the indicators) has been upgraded. The • ‘sliders’ were replaced by 4 point clickable scales; the time-indication item was improved and an additional question was added to the questions regarding the use of existing sourcesThe respondents were not any more ‘forced’ to use predefi ned types of degree programmes, • but were invited to use self reported (national) types of programmesAn additional indicator on the legal status of the institution was developed. The actual information • was complemented with a question regarding the perceived status of the institution (using OECD defi nitions)
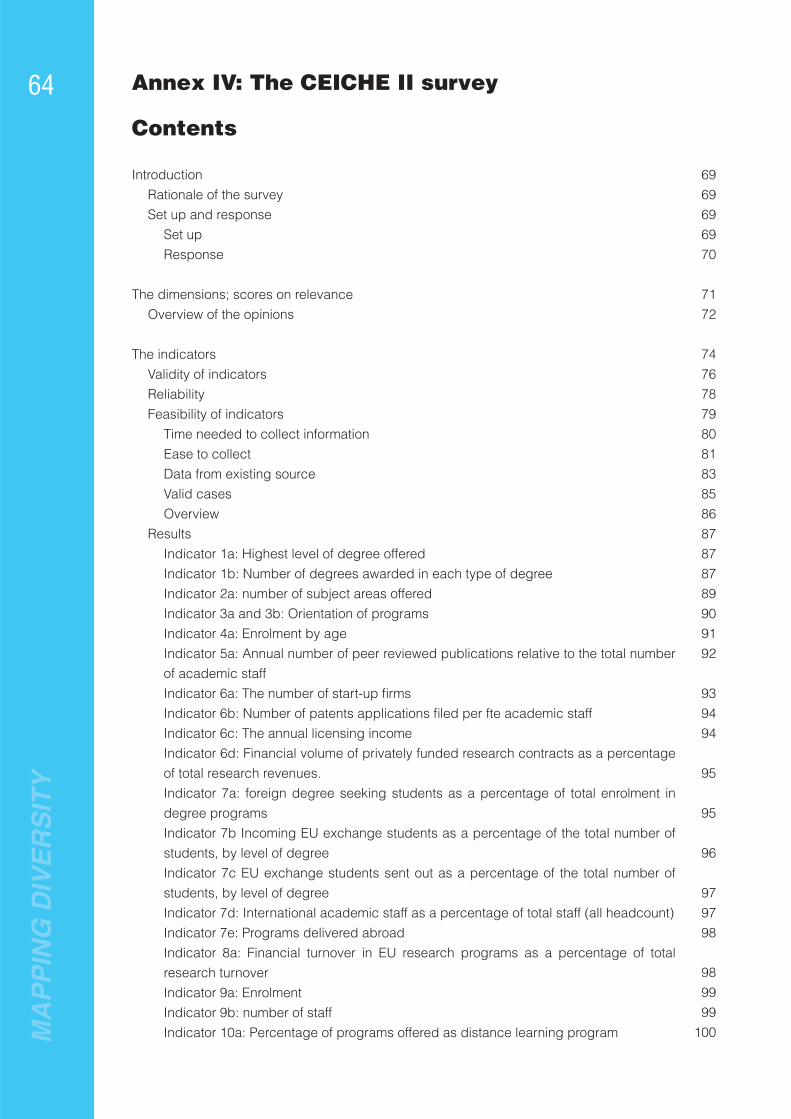
MA
PP
ING
DIV
ER
SIT
Y
64 Annex IV: The CEICHE II survey
Contents
IntroductionRationale of the surveySet up and response
Set upResponse
The dimensions; scores on relevanceOverview of the opinions
The indicatorsValidity of indicatorsReliabilityFeasibility of indicators
Time needed to collect informationEase to collectData from existing sourceValid casesOverview
ResultsIndicator 1a: Highest level of degree offeredIndicator 1b: Number of degrees awarded in each type of degreeIndicator 2a: number of subject areas offeredIndicator 3a and 3b: Orientation of programsIndicator 4a: Enrolment by ageIndicator 5a: Annual number of peer reviewed publications relative to the total number of academic staffIndicator 6a: The number of start-up fi rmsIndicator 6b: Number of patents applications fi led per fte academic staffIndicator 6c: The annual licensing incomeIndicator 6d: Financial volume of privately funded research contracts as a percentage of total research revenues.Indicator 7a: foreign degree seeking students as a percentage of total enrolment in degree programsIndicator 7b Incoming EU exchange students as a percentage of the total number of students, by level of degreeIndicator 7c EU exchange students sent out as a percentage of the total number of students, by level of degreeIndicator 7d: International academic staff as a percentage of total staff (all headcount)Indicator 7e: Programs delivered abroadIndicator 8a: Financial turnover in EU research programs as a percentage of total research turnoverIndicator 9a: EnrolmentIndicator 9b: number of staffIndicator 10a: Percentage of programs offered as distance learning program
6969696970
7172
74767879808183858687878789909192
939494
95
95
96
979798
989999
100

MA
PP
ING
DIV
ER
SIT
Y
65Indicator 10b: The percentage of programs offered as part time programsIndicator 10c: The percentage of students enrolled as part time studentsIndicator 11a: Percentage of funding from government fundingIndicator 11b: Income from tuition feesIndicator 12a legal statusIndicator 13a: Concerts and performancesIndicator 13b: ExhibitionsIndicator 14a: Annual turnover in EU structural fundsIndicator 14 b: Graduates in the regionIndicator 14c: Extracurricular coursesIndicator 14 d: Importance of regional sources
Discussion‘Challenging’ dimensionsClustering dimensionsIn conclusion
References
Appendix 1: Comments
101102102103104104105105106106106
108108108111
112
113
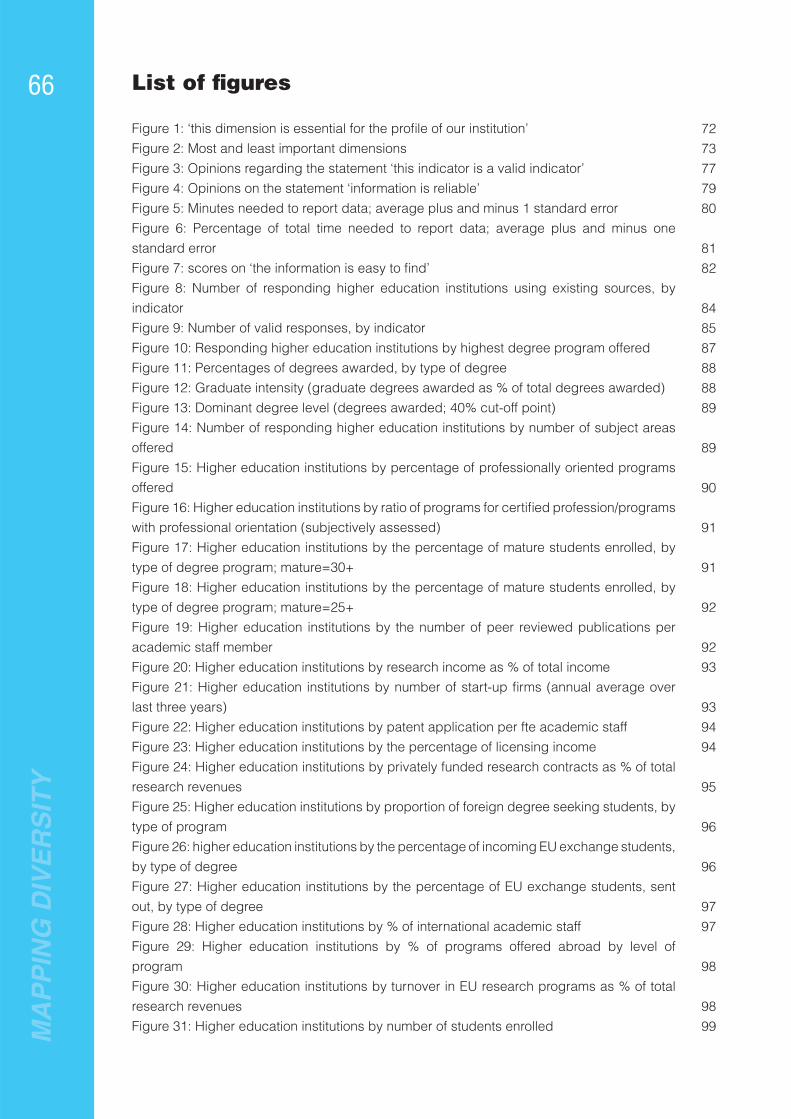
MA
PP
ING
DIV
ER
SIT
Y
66 List of fi gures
Figure 1: ‘this dimension is essential for the profi le of our institution’Figure 2: Most and least important dimensionsFigure 3: Opinions regarding the statement ‘this indicator is a valid indicator’Figure 4: Opinions on the statement ‘information is reliable’Figure 5: Minutes needed to report data; average plus and minus 1 standard errorFigure 6: Percentage of total time needed to report data; average plus and minus one standard errorFigure 7: scores on ‘the information is easy to fi nd’Figure 8: Number of responding higher education institutions using existing sources, by indicatorFigure 9: Number of valid responses, by indicatorFigure 10: Responding higher education institutions by highest degree program offeredFigure 11: Percentages of degrees awarded, by type of degreeFigure 12: Graduate intensity (graduate degrees awarded as % of total degrees awarded)Figure 13: Dominant degree level (degrees awarded; 40% cut-off point)Figure 14: Number of responding higher education institutions by number of subject areas offeredFigure 15: Higher education institutions by percentage of professionally oriented programs offeredFigure 16: Higher education institutions by ratio of programs for certifi ed profession/programs with professional orientation (subjectively assessed)Figure 17: Higher education institutions by the percentage of mature students enrolled, by type of degree program; mature=30+Figure 18: Higher education institutions by the percentage of mature students enrolled, by type of degree program; mature=25+Figure 19: Higher education institutions by the number of peer reviewed publications per academic staff memberFigure 20: Higher education institutions by research income as % of total incomeFigure 21: Higher education institutions by number of start-up fi rms (annual average over last three years)Figure 22: Higher education institutions by patent application per fte academic staffFigure 23: Higher education institutions by the percentage of licensing incomeFigure 24: Higher education institutions by privately funded research contracts as % of total research revenuesFigure 25: Higher education institutions by proportion of foreign degree seeking students, by type of programFigure 26: higher education institutions by the percentage of incoming EU exchange students, by type of degreeFigure 27: Higher education institutions by the percentage of EU exchange students, sent out, by type of degreeFigure 28: Higher education institutions by % of international academic staffFigure 29: Higher education institutions by % of programs offered abroad by level of programFigure 30: Higher education institutions by turnover in EU research programs as % of total research revenuesFigure 31: Higher education institutions by number of students enrolled
7273777980
8182
848587888889
89
90
91
91
92
9293
939494
95
96
96
9797
98
9899

MA
PP
ING
DIV
ER
SIT
Y
67Figure 32: Higher education institutions by fte academic staffFigure 33: Higher education institutions by ratio non-academic/academic staffFigure 34: Higher education institutions by % of programs offered as distance learning program by level of programFigure 35: Higher education institutions by % of programs offered as part-time program by level of programFigure 36: Higher education institutions by % of part-time students by level of programFigure 37: Higher education institutions by % of government fundingFigure 38: Higher education institutions by tuition fee income as % of total incomeFigure 39: Higher education institutions by public private statusFigure 40: Higher education institutions by concerts and performance per staff memberFigure 41: Higher education institutions by exhibitions per staff memberFigure 42: Higher education institutions by annual turnover in EU structural funds as % of total incomeFigure 43: Higher education institutions by extra curricula courses offeredFigure 44: Higher education institutions by score on importance of different sources of incomeFigure 45: Mapping of the dimensions and the correlations between the scores on relevance
99100
101
101102103103104104105
105106
107
110

MA
PP
ING
DIV
ER
SIT
Y
68 List of tables
Table 1: Sampling strataTable 2: Age strataTable 3: Size strataTable 4: Higher education institutions by region (in IAU database and CEIHE II survey)Table 5: Overview of indicators and dimensionsTable 6: Percentage of strongly disagree or disagree on statement ‘this indicator is a valid indicator’Table 7: Average time spend on collecting and reporting data, per indicatorTable 8: Opinions on the statement ‘information is easy to fi nd’Table 9: Percentage of the responding higher education institutions using existing sources, by indicatorTable 10: Percentage of valid responses, by indicatorTable 11: Grouping of indicators by feasibility scoreTable 12: Correlations between dimensions
7071717175
778081
838587
109

MA
PP
ING
DIV
ER
SIT
Y
69Introduction
Rationale for the surveyThe classifi cation is intended to be based on the actual behavior of higher education institutions. The relevant dimensions of that behavior are organized in 14 ‘dimensions’ and measured with 32 indicators. The information on these indicators at the institutional level is diffi cult to fi nd in international databases. National data sources usually have more relevant information but the use of such data sources is limited because of various practical, legal, and even methodological problems.Therefore a survey among higher education institutions was set up. This survey serves three purposes:
to assess the relevance of the dimensions selected• to assess the quality of the indicators selected• to provide data that will allow further analyses on the dimensions and their clustering and on the • indicators and their potential and pitfalls.
The results of the survey are presented in this annex. In the conclusion, some analyses and ideas are discussed on how to proceed with the clustering of the dimensions and the transformation of the survey results into a classifi cation tool.
Set up and response
Set upThe survey consists of two questionnaires: a questionnaire on the dimensions, querying the relevance of the dimensions and the indicators selected, and a questionnaire on the indicators. The latter asks both for data on the 32 indicators selected as well as for an assessment of the quality of the indicators.
Draft questionnaires were developed based on the dimensions and indicators identifi ed and selected at the end of phase I of the project (van Vught and Bartelse 2005). These draft questionnaires were tested and discussed in the pilot survey of eight cases (including the two case studies reported in annex II). Based on the results of these tests, the questionnaires were adjusted and put on-line for the survey (for a pdf version of the questionnaires see www.cheps.org//ceihe_dimension.pdf and www.cheps.org//ceihe_indicators.pdf).
The intended size of the sample for the survey was 100 higher education institutions. To keep the non-response rate as low as possible, networks of higher education institutions as represented in the Advisory Board were asked to introduce the project and identify contact persons. Around 160 higher education institutions have been contacted. A second channel through which potential participants to the survey were identifi ed was through an open web-based procedure. On the project website (www.cheps.org/ceihe) higher education institutions could express their interest to participate. Based on the information provided on the expression of interest form, the project team decided whether an applicant could participate. In total 16 higher education institutions were selected this way. A last way to invite institutions to participate was through national and international conferences. At a number of occasions the project was presented and a call for participation was made. Although it is not possible to determine how many responding higher education institutions came through that

MA
PP
ING
DIV
ER
SIT
Y
70 channel, it was obvious that the strong participation of Polish and Turkish institutions was triggered through this channel.The rationale of the project is to show the diversity of European higher education. To achieve that goal we are developing a classifi cation tool. To ensure that the tools can capture the diversity we have to make sure that the data on which the tool is developed and tested are suffi ciently diverse. If the data are too homogeneous, we cannot be sure that the classifi cation tool developed using those data can capture the full diversity of European higher education. To create the required diversity in the experimental data set, the sample needs to be stratifi ed.
Based on the results of the fi rst phase of the project, six stratifi cation criteria were selected: size, age of the institution, scope (comprehensive versus specialised), highest degree offered, research orientation, and country/region. To determine where the boundaries between the strata are we needed to have some information on all higher education institutions in Europe (Moors and Muilwijk 1975, pp.63-65). This is problematic since our previous analyses showed that there is no comprehensive database comprising all higher education institutions. The most comprehensive database is the database of the International Association of Universities (IAU). However, there is no reliable information in that database on scope, highest degree offered and research orientation. These stratifi cation criteria therefore had to be dropped. The strata in age and size were based on the information on 1634 universities and 1498 non-university higher education institution in the IAU database. For the identifi cation of the regions, the UN classifi cation of regions was used1. In this classifi cation Europe is divided in Eastern, Northern, Southern and Western Europe. Turkey is categorized by the UN as Asia, but in this project it is categorized in Southern Europe.
Table 1: Sampling strataAge (year founded) Size (students enrolled) Region
1816 or earlier 1572 or lessNorth (Denmark, Finland, Sweden,
Norway, Ireland, UK, Latvia, Estonia, Lithuania)
1817-1917 1573-6400West (Austria, France, Germany,
Belgium, the Netherlands, Luxembourg, Switzerland)
1918-1972 6401-15539 South (Greece, Italy, Spain, Portugal, Malta, Cyprus, Slovenia, Turkey)
1973 or later 15540 or moreEast (Bulgaria, Czech Republic,
Slovakia, Hungary, Poland, Romania, Russia)
Response67 Higher education institutions submitted a valid response to the indicator questionnaire and 85 responsed to the dimensions questionnaire.
AgeIn terms of age, the response is skewed towards the younger categories (see table below). A possible explanation for this may be found in the underrepresentation of non university institutions in the IAU data. Since non-univeristy institutions are on average younger than universities, it is plausible that (part) of the ‘skewed sample’ is due to this factor. In the table we present also an alternative defi nition of the age classes, based on the response in the survey.
1 http://unstats.un.org/unsd/methods/m49/m49regin.htm#europe
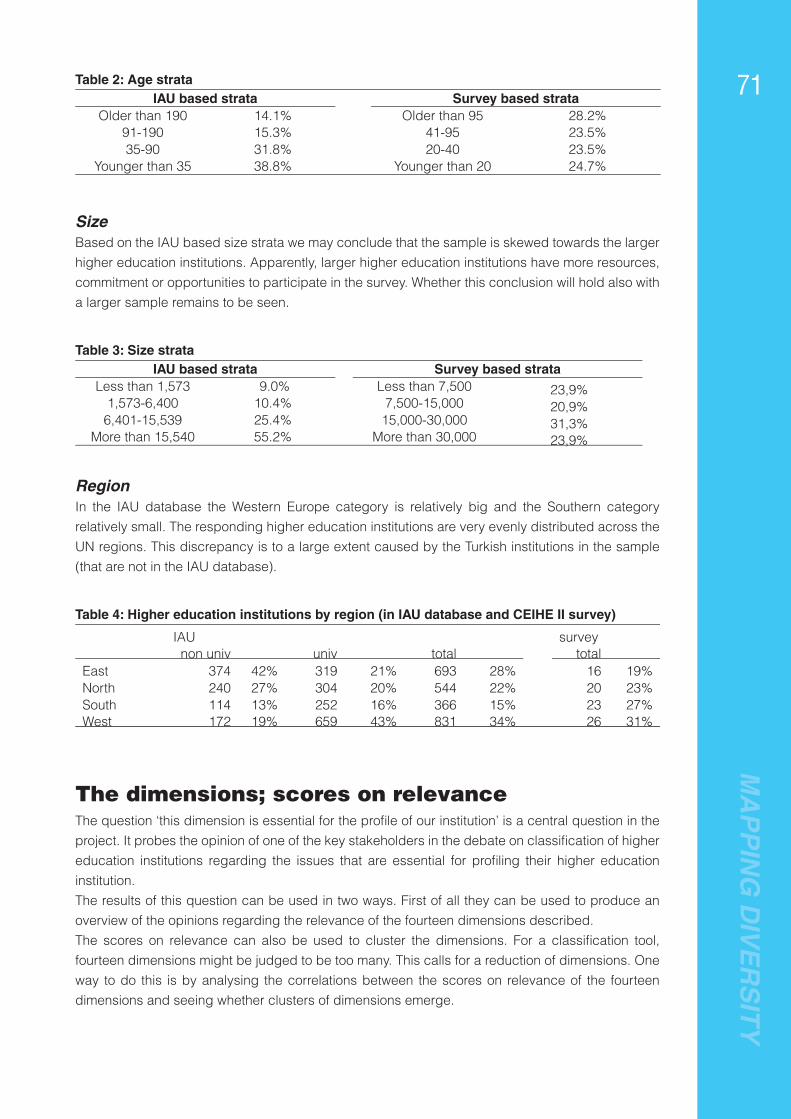
MA
PP
ING
DIV
ER
SIT
Y
71Table 2: Age strataIAU based strata Survey based strata
Older than 190 14.1% Older than 95 28.2%91-190 15.3% 41-95 23.5%35-90 31.8% 20-40 23.5%
Younger than 35 38.8% Younger than 20 24.7%
SizeBased on the IAU based size strata we may conclude that the sample is skewed towards the larger higher education institutions. Apparently, larger higher education institutions have more resources, commitment or opportunities to participate in the survey. Whether this conclusion will hold also with a larger sample remains to be seen.
Table 3: Size strataIAU based strata Survey based strata
Less than 1,573 9.0% Less than 7,500 23,9%1,573-6,400 10.4% 7,500-15,000 20,9%6,401-15,539 25.4% 15,000-30,000 31,3%
More than 15,540 55.2% More than 30,000 23,9%
RegionIn the IAU database the Western Europe category is relatively big and the Southern category relatively small. The responding higher education institutions are very evenly distributed across the UN regions. This discrepancy is to a large extent caused by the Turkish institutions in the sample (that are not in the IAU database).
Table 4: Higher education institutions by region (in IAU database and CEIHE II survey)
IAU surveynon univ univ total total
East 374 42% 319 21% 693 28% 16 19%North 240 27% 304 20% 544 22% 20 23%South 114 13% 252 16% 366 15% 23 27%West 172 19% 659 43% 831 34% 26 31%
The dimensions; scores on relevanceThe question ‘this dimension is essential for the profi le of our institution’ is a central question in the project. It probes the opinion of one of the key stakeholders in the debate on classifi cation of higher education institutions regarding the issues that are essential for profi ling their higher education institution. The results of this question can be used in two ways. First of all they can be used to produce an overview of the opinions regarding the relevance of the fourteen dimensions described. The scores on relevance can also be used to cluster the dimensions. For a classifi cation tool, fourteen dimensions might be judged to be too many. This calls for a reduction of dimensions. One way to do this is by analysing the correlations between the scores on relevance of the fourteen dimensions and seeing whether clusters of dimensions emerge.

MA
PP
ING
DIV
ER
SIT
Y
72 Overview of the opinionsThe questions regarding relevance were on average completed by almost 95% of the responding higher education institutions. For eight out of the 14 dimensions more than 80% of the responding higher education institutions agreed on the relevance of the dimensions: 1, 2, 3, 5, 7, 9, 11, and 12. There was only one dimension (13) on which less than 60% agreed as being relevant.
Figure 1: ‘this dimension is essential for the profi le of our institution’
The relative relevance of the dimensions was also measured by the fi nal question of the dimensions-questionnaire; the ranking question. For this question the respondents were asked to list the three most important and the three least important dimensions (see Figure 2).Dimensions 1 (types of degrees), 5 (research intensiveness), 7 (international orientation, teaching and staff), and 2 (range of subjects) were mentioned as the most important dimensions by more than one third of the responding higher education institutions. Dimension 10 (mode of delivery) and 13 (cultural engagement) were mentioned as the least important dimensions by more than one third of the respondents.To fi nd out whether there is consensus among the responding higher education institutions regarding relative importance, we also compared the number of times a dimension was rated as least important to the number of times the dimension was rated most important. The scores on three dimensions (involvement in LLL, international research orientation and size) are mixed: the ratios between the most important and least important scores are roughly around 65%. There is clearly no consensus regarding the relative importance of these three dimensions. On the remaining dimensions the consensus is much higher. Six dimensions are seen more frequently as most important than as least important: 1, 2, 3, 5, 6, and 7. The balance is most negative for dimensions mode of delivery, cultural engagement, public private character and legal status.A lack of consensus is not a disqualifying characteristic. It merely means that the responding higher education institutions differ in their opinion regarding the relevance of those dimensions for the profi le of their institution.
0% 20% 40% 60% 80% 10
1; types of degrees offered
2: range of subjects
3: orientation of progr
4: l ife long learning
5: research intensiveness
6: innovation intensiveness
7: international orientation
8: European research profile
9: size
10: mode of delivery
11: public private
12: legal status
13: cult engagement
14: regional engagement
strongly disagree disagree agree strongly agree

MA
PP
ING
DIV
ER
SIT
Y
73What is more problematic (or more diffi cult to interpret) is that the results of the overall ranking and the relevance scores on the individual dimensions are not completely consistent. Public private character, legal status and, above all, size score high on the relevance scale whereas they are very frequently mentioned as the least important dimensions. Innovation intensiveness scores relatively low on the relevance scale but is frequently mentioned as most important dimension.
Figure 2: Most and least important dimensions
0 10 20 30 40 50 60 70
type degree
range subjects
prof orientation
lll
research intens
innovation intens
international
eur research prof
size
mode delivery
pub-priv
legal
cult engagement
regional engagementleast important
most important
MA
PP
ING
DIV
ER
SIT
Y
74 The indicators
The position of the higher education institutions and how they score on the fourteen dimensions cannot be determined using the abstract descriptions presented in the previous chapter. For that purpose 32 indicators were selected. These indicators can be seen as quantitative information that can be used to assess the position of a higher education institution on the dimensions. Many of the indicators specifi ed are composite indicators, combining two or more data-elements.In this report we often use a shorthand ‘code’ when referring to the indicators. This ‘code’ consists of a number (referring to the dimension the indicator belongs to) and a letter (see Table 5).
This chapter consists of two parts. In the fi rst part we elaborate on three characteristics of the 30 indicators that were used in the on-line questionnaires. First we look into the validity of the indicators; do the responding higher education institutions think that the indicators we have selected, measure the phenomena we are investigating? Do the indicators convey a ‘correct’ picture of the dimension?After answering that question the focus shifts to the question of whether the information reported is trustworthy: the perceived reliability of the information reported. Since there are signifi cant differences in the status of the indicators (some are based on widely accepted standard statistics, whereas others have a more experimental character) the project team thought it to be imperative to check the perceived reliability of the information reported. The fi nal characteristic of the indicators discussed is whether it is feasible for responding higher education institutions to collect the information on the indicators. This issue was one of the main reasons for the survey. A large part of the information underlying the classifi cation has to come from the individual higher education institutions. Given growing survey fatigue and the administrative burdens higher education institutions have to face, it is crucial to know how higher education institutions think about the burden this questionnaire puts on them. Four indications for feasibility are described: the time needed to fi nd and report the information, the perceived ease of fi nding the information, the use of existing sources and the percentage of valid responses received.
The second part of the chapter comprises the scores on the indicators.

MA
PP
ING
DIV
ER
SIT
Y
75Table 5: Overview of indicators and dimensionsDimension Indicator1: types of degrees offered 1a: highest level of degree program offered
1b: number of qualifi cations granted in each type of degree program2: range of subjects offered 2a: number of subject areas covered by an institution using the
UNESCO/ISCED subject areas
3: orientation of degrees 3a: the number of programs leading to certifi ed/ regulated professions as a % of the total number of programs
3b: the number of programs offered that answer to a particular demand from the labour market or professions (as % of the total number of programs)
4: involvement in life long learning
4a: number of adult learners as a % of total number of students by type of degree
5: research intensiveness 5a: number of peer reviewed publications per fte academic staff5b: the ISI based citation indicator, also known as the ‘crown indicator’
6: innovation intensiveness 6a: the number of start-up fi rms)6b: the number of patent applications fi led6c: the annual licensing income6d: the revenues from privately funded research contracts as a % of total research revenues
7: international orientation: teaching and staff
7a: the number of degree seeking students with a foreign nationality, as % of total enrolment
7b: the number of incoming students in European exchange programs, as % of total enrolment7c: the number of students sent out in European exchange programs7d: international staff members as % of total number of staff members7e number of program offered abroad
8: International orientation: research
8a: the institution’s fi nancial turn-over in European research programs as % of total fi nancial research turn-over
9: size 9a: number of students enrolled (headcount) 9b: number of staff members employed (fte)
10: mode of delivery 10a: number of distance learning programs as % of total number of programs10b: number of part-time programs as % of total number of programs10c: number of part-time students as of total number of students
11: public/private character 11a: income from (competitive and non-competitive) government funding as a % of total revenues11b: income from tuition fees as % of total income
12: legal status 12a: legal status
13: cultural engagement 13a: number of offi cial concerts and performances (co)-organised by the institution13b: number of offi cial exhibitions (co)-organised by the institution
14: regional engagement 14a: annual turnover in EU structural funds as % of total turnover14b: number of graduates remaining in the region as % of total number of graduates
14c: number of extracurricular courses offered for regional labour market14d: importance of local/regional income sources*
* did not appear in the dimensions-questionnaire

MA
PP
ING
DIV
ER
SIT
Y
76 Validity of indicatorsFor each of the 14 dimensions one or more indicators have been selected. The scores on these indicators have to convey a correct or at least plausible picture of the dimension they belong to. This validity is assessed by a question in the dimensions-questionnaire. The higher education institutions were asked to give their opinion regarding the statement: ‘indicator a is a valid indicator for this dimension’.
The average perception of the validity of the indicators varied substantially between indicators. For eight indicators less than 15% of the responding higher education institutions (strongly) disagreed with the statement that the indicator was a valid one. For 12 indicators the respondents have some doubts regarding the validity: between 30% and 50% of the responding higher education institutions indicated that they did not consider those indicators to be valid indicators (within the dimension they are presented in).
Table 6: Percentage of strongly disagree or disagree on statement ‘this indicator is a valid indicator’
Less than 15% 15%-29% 30-50%1a 1b 3b2a 3a 4a7a 5a 6a7b 5b 6b 7c 8a 6c7d 10a 6d9a 10b 7e9b 10c 13a
11a 13b 11b 14a12a 14b
14c
There are fi ve dimensions where the validity of the indicators selected raises some doubts: 3 (orientation of degrees)2, 4 (involvement in life long learning)3, 6 (innovation intensiveness)4, 13 (cultural engagement)5, and 14 (regional engagement)6. These fi ve dimensions have a more experimental status than the other dimensions and because of that, this outcome is very much what could be expected.
2 comments referred the subjective and ‘vague’ character of indicator b. There were furthermore some comments that the indicators could not differentiate between academic and non-academic or professional institutions. The project team deliberately avoided this ‘traditional’ dichotomy in the defi nitions, to break free of these high institutionalized labels.3 comments were on the cut-off point. In some systems other defi nitions of ‘mature’ students are used (e.g., over 21 years on entrance in the UK), which may lead to confusion. It was also mentioned that national differences in entrance age and different way in which the programs are organized may lead to different age structures of the student body. In those cases the indicator does not identify differences in involvement in LLL but systemic differences.4 comments mainly referred to national differences in patenting practices.5 the indicators are considered to be too ‘simplistic’ and not covering the full width of cultural activities.6 comments revealed some problems regarding the demarcation of the region, and the weak link between the eligibility of the region for structural funds and the regional engagement of a higher education institution. It was furthermore suggested to use the indicator on start-ups (6a) as an indicator for this dimension as well.

MA
PP
ING
DIV
ER
SIT
Y
77Figure 3: Opinions regarding the statement ‘this indicator is a valid indicator’
0% 20% 40% 60% 80% 100%
1a 1b 2a 3a 3b 4a 5a 5b
6a 6b 6c 6d 7a 7b 7c
7d 7e 8a 9a 9b
10a 10b 10c 11a 11b 12a
13a 13b 14a 14b14c 14d
Strongly disagree Disagree Agree Strongly agree

MA
PP
ING
DIV
ER
SIT
Y
78 ReliabilityThe indicators selected differ in status. Some indicators are already used in different contexts and build on standard data, whereas others are ‘experimental’ and use information that is not in the set of commonly reported data. This has consequences for the perceived validity of the indicators (see above) but it may also have consequences for the perceived reliability of the information reported. In most higher education systems the defi nitions and data collection procedures for standard data, like the number of students enrolled or the number of staff, are harmonized. Because of this, it is more than likely that the data reported are not infl uenced by the person or department that provides the data. As long as the procedures and defi nitions are followed, the data will be trustworthy. For the ‘experimental’ indicators, defi nitions and procedures are not (yet) harmonized. For these indicators it might be that the data reported depend on the person or department that reports the data. To fi nd out whether this reliability problem is perceived to exist by the responding higher education institutions, they were asked to respond to the statement: ‘the information is reliable’.
The responses are very positive about the reliability of the information provided. For 25 indicators at least fi ve out of six responding higher education institutions reported that they (strongly) agreed with the statement ‘information is reliable’. The indicators on which slightly more responding higher education institutions had some doubts regarding the reliability are 3a and 3b (orientation of degrees), 6d (revenues from private contracts) and 14b and 14c (regional engagement).This very positive result may be biased because the person giving the opinion has most likely put in a lot of effort to collect the information. Avoiding cognitive dissonance may lead the respondent to an ‘over-positive’ assessment.

MA
PP
ING
DIV
ER
SIT
Y
79Figure 4: Opinions on the statement ‘information is reliable’
0% 20% 40% 60% 80% 100%
1a1b2a3a3b4a5a6a6b6c6d7a7b7e7d8a9a9b
10a10b10c11a11b12a13a13b14a14b14c14d
strongly disagree disagree agree strongly agree
Feasibility of indicatorsThe main outcome of the analysis of national and international data sources on higher education was that higher education institutions will have a leading role in the collection of data. (Inter)national data sources simply do not breakdown information by individual institutions or if they do, privacy regulations prevent these sources from publishing data at the individual institution level. This put the heavy burden of data provision on the higher education institutions. Given survey fatigue among higher education institutions it is most important to know whether it is feasible for an institution to collect and report the information and data asked for in the questionnaires.To assess the feasibility of the process of collecting and reporting the data we used four indications: the time needed to collect data on the indicator; the score on the scale ‘easy to collect’; whether the data were collected from an existing source; and the total number of valid cases.

MA
PP
ING
DIV
ER
SIT
Y
80 Time needed to collect informationThe time needed to collect the information on an indicator is a crucial indication of the feasibility of the data collection. Time is scarce for higher education institution administrators so if the time needed is limited, feasibility is considered to be high. First the overall time spent on the indicator questionnaire was calculated. 25% of the responding institutions spent less than an hour on the indicator questionnaire 25% between one and three hours, another 25% spent between three hours and a day on the questionnaire and the remaining 25% between a day and a week.
Second, the average time needed was calculated for each indicator. For nine indicators the average time reported is less than ten minutes. For ten indicators respondents took on average around half an hour or longer to collect and report the data (see Table 7). The dispersion around the average score was relatively high. This may mean that there are huge differences between institutions in the way they have the information available or it may mean that some institutions take much longer to collect and report the data than others (possibly for size and capacity reasons). To pick up on the latter explanation, a new variable was calculated, taking the time needed for a particular indicator as a percentage of the total time needed to collect and report data on all indicators (see Figure 6).
Table 7: Average time spend on collecting and reporting data, per indicatorless than 10 min. around 30 minutes and longer1a (highest degree offered) 4a: enrolment by age and type of degree 1b (degrees awarded) 6c: licensing income2a (disciplines) 6d: income from research contracts3a (certifi ed/ regulated professions) 7d: international staff3b (professional programs) 8a: income from EU research contracts6a (start-up fi rms) 10a: distance programs7e (programs offered abroad) 11a: public income9a (enrolment) 13a: number of exhibitions12a (legal status) 13b: number of concerts
14b: graduates in the region.
Figure 5: Minutes needed to report data; average plus and minus 1 standard error
0
10
20
30
40
50
60
70
80
90
1a ti
me
1b ti
me
2a ti
me
3a ti
me
3b ti
me
4a ti
me
5a ti
me
6a ti
me
6b ti
me
6c ti
me
6d ti
me
7a ti
me
7b ti
me
7e ti
me
7d ti
me
8a ti
me
9a ti
me
9b ti
me
10a
time
10b
time
10c
time
11a
time
11b
time
12a
time
13a
time
13b
time
14a
time
14b
time
14c
time
14d
time
The graph of the average of the proportion of the total time spend on each indicator shows a different outcome. A number of indicators appear in both graphs as little time consuming (1a: highest degree offered, 2a: disciplines, 6a: number of start-up fi rms, 7e: number of programs offered abroad, 9a:

MA
PP
ING
DIV
ER
SIT
Y
81enrolment and 12a: legal status) or as time consuming (4a: enrolment by age and level of degree, 14b: graduates in the region, 6d: income from research contracts, 11a: public income and 13a: number of concerts). The scores on indicator 6b (number of patents applications), 6c (licensing income), 7a (international and foreign degree seeking students) and 7b (exchange students) differ remarkably between the two approaches.
Figure 6: Percentage of total time needed to report data; average plus and minus one standard error
0%
2%
4%
6%
8%
10%
12%
14%
16%
1a ti
me
1b ti
me
2a ti
me
3a ti
me
3b ti
me
4a ti
me
5a ti
me
6a ti
me
6b ti
me
6c ti
me
6d ti
me
7a ti
me
7b ti
me
7e ti
me
7d ti
me
8a ti
me
9a ti
me
9b ti
me
10a
time
10b
time
10c
time
11a
time
11b
time
12a
time
13a
time
13b
time
14a
time
14b
time
14c
time
14d
time
Ease to collectThe time needed to collect and report the information is only one aspect of feasibility. Respondents may perceive the effort needed to fi nd the information differently. Therefore the respondents were asked whether they agreed or disagreed with the statement ‘The information is easy to fi nd’.
There are two groups of indicators. The fi rst group comprises those indicators for which more than 60% of the respondents reported that they strongly agree with the statement. The second group comprises indicators where at least 20% of the respondents disagreed (strongly) with the statement.
There is a signifi cant overlap between the lists of ‘feasible’ indicators of table 1 and table 2 and between the lists of less feasible indicators in both tables. The only exception is indicator 3b (professional programs).
Table 8: Opinions on the statement ‘information is easy to fi nd’60% Strongly agree 20% disagree1a 3b1b 4a2a 6c7e 6d9a 7d9b 8a10a 14b10b 14c10c 14d11a11b12
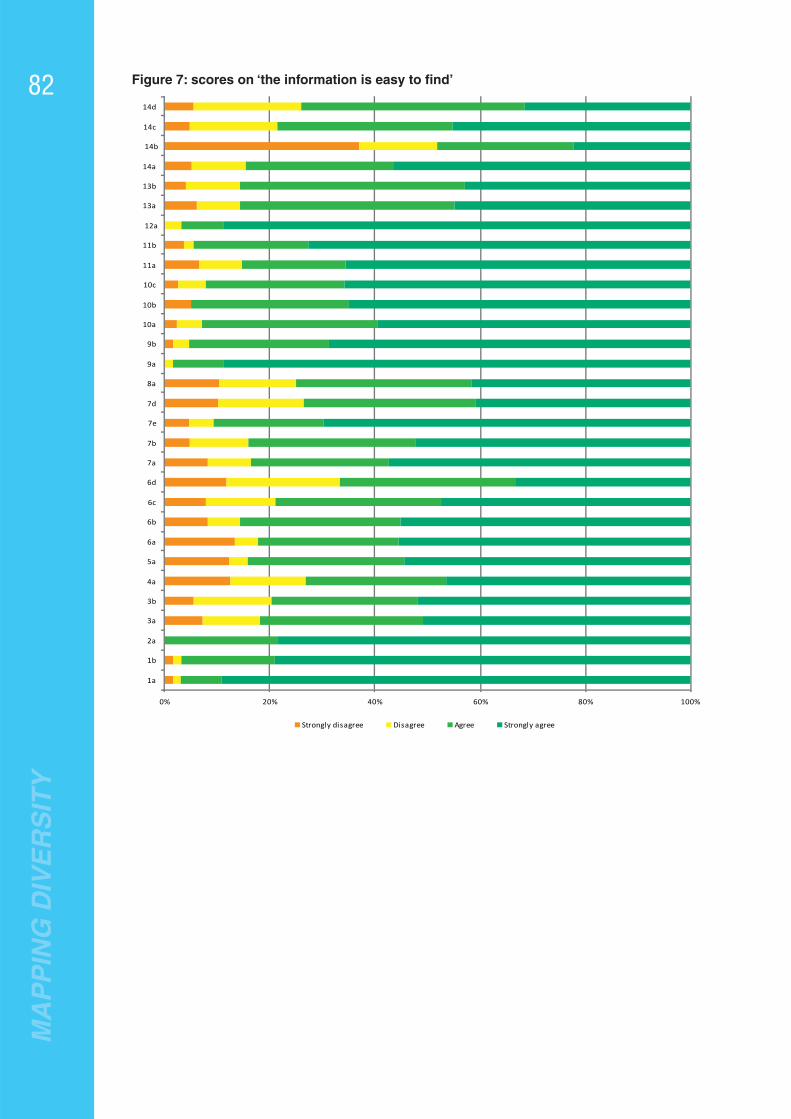
MA
PP
ING
DIV
ER
SIT
Y
82 Figure 7: scores on ‘the information is easy to fi nd’
0% 20% 40% 60% 80% 100%
1a
1b
2a
3a
3b
4a
5a
6a
6b
6c
6d
7a
7b
7e
7d
8a
9a
9b
10a
10b
10c
11a
11b
12a
13a
13b
14a
14b
14c
14d
Strongly disagree Disagree Agree Strongly agree

MA
PP
ING
DIV
ER
SIT
Y
83Data from existing sourcesThe question whether the information was taken from existing sources and if so, from what source, serves a double purpose. First it is assumed that the use of existing sources has a positive infl uence on the feasibility of collecting and reporting data.
For eight indicators, more than 75% of the responding higher education institutions reported that they used existing sources. For 10 of the 317 indicators, less than 50% of the responding higher education institutions reported the use of existing sources.
Table 9: Percentage of the responding higher education institutions using existing sources, by indicatorMore than 75% Less than 50%1a 4a1b 6c2a 6d7b 10a9a 10c9b 13a11a 13b11b 14a
14b14c14d
Again there is a considerable overlap between this table and the previous two tables categorising the indicators as feasible and less feasible.
7 for indicator 5b, no questions were asked.

MA
PP
ING
DIV
ER
SIT
Y
84 Figure 8: Number of responding higher education institutions using existing sources, by indicator
0 10 20 30 40 50 60 70
1a
1b
2a
3a
3b
4a
5
6a
6b
6c
6d
7a
7b
7e
7d
8a
9a
9b
10a
10b
10c
11a
11b
13a
13b
14a
14b
14c
14d
The second purpose of the question on the sources used refers to the potential use of national and international data sources. In an early stage of the project, national and international databases were analysed to fi nd out whether data from these existing sources could be used to fi ll the database underlying the classifi cation. The result of that analysis was rather negative: there are only reliable data on a few elements in international data sources, and the use of national sources will be very time consuming. The latter is caused by the many questions to be answered at the institutional level, legal constraints, methodological constraints and the differences in scope. The question of what existing source was used gives us the opportunity to fi nd out what existing sources the higher education institution uses and/or trusts. It is seen as a fi rst step in the quest for usable national sources, in order to reduce the survey load for higher education institutions.
Only a few responding higher education institutions reported the use of a specifi c agency as a data source. For indicator 1b eight agencies were reported, for 1a and 9a six and for 2a, 7a and 11a fi ve. The most commonly mentioned agencies are ministries and statistical agencies. In some countries, higher education (funding) councils were mentioned.

MA
PP
ING
DIV
ER
SIT
Y
85Valid casesThe fourth indication of the feasibility of data collection is not derived from a question in the ‘assessment’ part of the questionnaire. This indication, the percentage of valid responses, builds on ‘the proof of the pudding is in its eating!’ If many responding higher education institutions have been able to provide valid responses for an indicator, we assume that this is an indication that collecting the data on that indicator is highly feasible. A low valid response points at low feasibility. For a number of indicators it proved impossible to distinguish invalid responses from a ‘0’-response.
Table 10: Percentage of valid responses, by indicator50%-75% Less than 50%4a 7e6d 10a10c 10b
The remaining indicators had a score higher than 75%.
Figure 9: Number of valid responses, by indicator
0% 10% 20% 30% 40% 50% 60% 70% 80% 90% 100%
1a
1b
2a
3a
3b
4a
5a
6a
6b
6c
6d
7a
7b
7c
7e
7d
8a
9a
9b
10a
10b
10c
11a
11b
12a
13a
13b
14a
14b
14c
14d

MA
PP
ING
DIV
ER
SIT
Y
86 OverviewCalculating an overall rank score8 is a tricky exercise. There is no clear conceptual basis for weighting the rank scores on the individual feasibility scores. Yet there is an argument to make for weighting the fi rst two indicators stronger than the latter two. The fi rst two are self reported by the respondents, whereas at least the last indicator is indirectly derived from the sample. Based on the weighted rank scores9 we may distinguish three broad categories: indicators with no or only minor feasibility problems, indicators with some feasibility problems, and indicators with signifi cant feasibility problems. To determine which indicators go into which category, we may either use the list of indicators (sorted by rank score) and make three equally sized groups, or we may look in this list for relatively large differences in the scores of consecutive indicators. The result of these groupings of overall feasibility scores is presented in the table below.
Table 11: Grouping of indicators by feasibility scoremethod feasibility Indicatorequal size
high 2a, 9a, 1a, 12a, 1b, 11b, 7e, 9b, 6b, 6a, 5medium 10b, 13b, 13a, 10a, 14a, 7a, 6c, 3b, 10c, 11a low 14d, 14c, 3a, 7b, 7c, 7d, 8a, 6d, 14b, 4a
Differences between consecutive scoreshigh 2a, 9a, 1a, 12a, 1b, 11b, 7e, 9b, 6bmedium 6a, 5, 10b, 13b, 13a, 10a,14a, 7a, 6c, 3b, 10c, 11a, 14d, 14c, 3a low 7b, 7c, 7d, 8a, 6d, 14b, 4a
8 Components are: % time: average of time needed to collect information on the indicator as a % of time needed to collect information on all indicators
% disagree: % of respondents who disagreed or strongly disagreed with statement ‘easy to collect data’ not existing source: percentage of respondents that used new/ not readily available sources of information invalid cases: the number of respondents who did not report valid information for the indicators 9 weighted rank score: sum of rank scores (rankscores % time and % disagree counted double) divided by four

MA
PP
ING
DIV
ER
SIT
Y
87Results
Indicator 1a: Highest level of degree offeredIn the questionnaire, four levels of degree programs were specifi ed:
doctor or equivalent third cycle degree programs; • master or equivalent second cycle degree programs;• bachelor or equivalent fi rst cycle degree programs;• other levels of degree programs.•
Almost 73% of the responding higher education institutions offer a doctorate program. 17% offer a master degree as highest level, 6% offer bachelor as the highest level and 5% offer another type of degree as highest degree program.
Figure 10: Responding higher education institutions by highest degree program offered
��
���
���
���
���
���
���
��
��
���
����
� �� � ������� �������
������ ������������ ������ � �����������
����
Indicator 1b: Number of degrees awarded in each type of degreeIn the questionnaire, the types of degrees awarded were not predefi ned. In the testing of the questionnaire it proved that the four categories were seen as too restrictive by some of the respondents. Therefore the description of the type of degree was left open for the respondent to complete. Although many respondents used the ‘standard’ types, there was a substantial group who used the original names of the degrees. This lead to the need for recoding. Based on the recoded categories, percentages were calculated, representing the proportion of each of the degree levels in the total number of degrees awarded.
Not surprisingly, the bachelor and master degree programs are the largest programs in terms of degrees awarded. Doctorate programs, offered by almost 75% of the responding higher education institutions, are with an average size of 6%, the third ‘largest’ program.
N=66

MA
PP
ING
DIV
ER
SIT
Y
88 Figure 11: Percentages of degrees awarded, by type of degree
��
���
���
���
���
���
���
��
��
���
����
� �� �� �� �� �� �� � � �� ���
� � � �� � �������� � ��� �������
����
���� ��
������ ��
� ������ ��
�� ��� � !
�� ���
How to read this graph? 30% of the responding higher education institutions (the horizontal axis) reported a percentage of bachelor degrees awarded that was 30% or lower (vertical axis). 20% (100-80) reported a percentage higher than 90%.The number of data points for bachelor is higher than for sub-degree programs because less higher education institutions reported that they *awarded sub-degrees.The graph gives an impression of how the responding higher education institutions scored on the indicator and whether certain groups or categories may be identifi ed.
Based on the discussions of the draft survey report a new indicator was included: the number of graduate degrees awarded as a percentage of the total number of degrees awarded.
Figure 12: Graduate intensity (graduate degrees awarded as % of total degrees awarded)
��
���
���
���
���
���
���
��
��
���
����
� �� �� �� �� �� �� � � �� ���
� � � �� � �������� � ��� �������
The scores on this ‘graduate intensity’-indicator suggest the existence of three categories: low (0-40%) medium (40-60%) and high intensity (60% and higher).
Another way to look at these data is to determine the dominant level at which degrees are awarded.
N=65
N=65

MA
PP
ING
DIV
ER
SIT
Y
89If 40% is used as a cutoff point, the bachelor and master degree programs emerge as the most frequent dominant programs. Less than 5% of the responding higher education institutions do not have a dominant program.
If this indicator would be used to classify higher education institutions, we would discern three groups: bachelor dominated, master dominated, and other/no dominant program.
Figure 13: Dominant degree level (degrees awarded; 40% cut-off point)
master
bachelor
sub-degree
other pg
bachelor+master
other
no dominant level
Indicator 2a: number of subject areas offeredThe number of subject areas offered varies between 1 and 9. Most higher education institutions offer 5 or 6 subject areas (the average is 5.4) and around one out of fi ve higher education institutions can be characterized as comprehensive (offering 8 or 9 subject areas).
Figure 14: Number of responding higher education institutions by number of subject areas offered
�
�
��
��
��
� � � � � � �
N=65
N=66

MA
PP
ING
DIV
ER
SIT
Y
90 Indicator 3a and 3b: Orientation of programsThe third dimension (orientation of degrees) comprises two indicators: an ‘objective’ indicator – the number of programs leading to a certifi ed or regulated degree – and a subjective assessment of the professional orientation of the degrees offered. The concept of the orientation of degrees proved to be diffi cult to capture. In the early versions of the list of indicators various formulations were used, but there was neither a comprehensive and acceptable statistic to be found nor a generally acceptable qualitative indicator. In the fi nal questionnaire, both a more objective and a subjective indicator were included. If the results on both indicators prove to be consistent, the combined indicator may be continued to be used to convey an indication of the orientation of the programs. If not, the choice of indicators needs to be reconsidered.
The objective indicator is the percentage of programs leading to certifi ed/regulated professions.
It is quite remarkable that one out of every six higher education institutions only provides programs that lead to regulated professions. On average the percentage is 39%.
The subjective assessment of the proportion of professional oriented programs leads to a higher score: the average score is 56%.
Figure 15: Higher education institutions by percentage of professionally oriented programs offered
��
���
���
���
���
���
���
��
��
���
����
� �� �� �� �� �� �� � � �� ���
� � ������������ ���� �������
������ ���� ��������� ���������������������� �� � ������ �� �������
� ��! "������������������� ��� ���� ������� �� ���������� ��������� ��������
Around 23% of the responding higher education institutions reported a similar number of programs for both indicators 65% reported more programs for the subjective indicator than for the objective indicator.
3a: N=523b: N=48

MA
PP
ING
DIV
ER
SIT
Y
91Figure 16: Higher education institutions by ratio of programs for certifi ed profession/programs with professional orientation (subjectively assessed)
�
���
�
���
�
���
�
���
�
���
�
�� ��� ��� ��� ��� ��� �� �� ��� ��� ����
��������������� ���� �������
Indicator 4a: Enrolment by ageEnrolment by age is assumed to give an indication of involvement in life long learning. The assumption is that an institution that enrolls a large proportion of mature students is more involved in life long learning than an institution that enrolls only a small number of mature students.There has been some debate on what a mature student is. Some argue that any student aged 30 or over is a mature student while others set the threshold fi ve years lower. In the questionnaire age was categorized in a number of broad age categories and broken down by type of degree. For this report the results are based on two defi nitions of mature students: students aged 30 and older, and students aged 25 and older.
Figure 17: Higher education institutions by the percentage of mature students enrolled, by type of degree program; mature=30+
��
���
���
���
���
���
��
��
���
���
����
� �� �� �� �� �� � � �� �� ���
��������������� ���� �������
�� �
������
�� �����
N=47; one case scored higher than 5
doctorate: N=26master: N=34bachelor: N=40

MA
PP
ING
DIV
ER
SIT
Y
92 Figure 18: Higher education institutions by the percentage of mature students enrolled, by type of degree program; mature=25+
��
���
���
���
���
���
���
��
��
���
����
� �� �� �� �� �� �� � � �� ���
� � ������������ ���� �������
����
������
��������
It is not surprising to see that doctorates have a higher proportion of mature students than master programs and master programs have a higher proportion than bachelor programs. It is furthermore not surprising to see that the proportion of mature students increases if a wider defi nition is used.The graphs show that there are substantial differences between responding higher education institutions in the proportion of mature students enrolled.
Indicator 5a: Annual number of peer reviewed publications relative to the total number of academic staffThe number of academic staff reported may include in some HE-systems doctoral ‘students’. In those systems doctoral students are not considered to be students but are seen and reported as academic staff (research trainees). This proved to be the case for one third of the responding higher education institutions. To correct for this systemic infl uence the number of academic staff used to calculate the indicator excludes the number of doctoral students.
Figure 19: Higher education institutions by the number of peer reviewed publications per academic staff member
�
�
�
�
�
�
�
�� ��� ��� ��� ��� ��� ��� �� �� ��� ����
� � ������������ ���� �������
doctorate: N=26master: N=34bachelor: N=40
N=67

MA
PP
ING
DIV
ER
SIT
Y
93As a result of the discussion on the draft report, a new indicator was included: the total amount of research income as a percentage of total income.
Figure 20: Higher education institutions by research income as % of total income
��
���
���
���
���
���
���
��
��
���
����
�� ��� ��� ��� ��� ��� ��� �� �� ��� ����
� � ������������ ���� �������
For around half of the institutions that provided a valid response research income is not a large part
of their income (less than 10%). There is also a group of institutions (6 out of 38) for which research
income is the major component of their income.
Indicator 6a: The number of start-up fi rmsWhat a start-up fi rm is and whether it is a valid indication of innovation intensiveness was discussed intensively. Although a defi nition was given in the questionnaire, only 27 out of 67 higher education institutions reported to have ‘produced’ start-up fi rms. Whether the 36 institutions that did not respond to this question do not have information on this item, or actually have no start-up fi rms, cannot be determined from the results.
Figure 21: Higher education institutions by number of start-up fi rms (annual average over last three years)
�
�
��
��
��
��
��
��
�� ��� ��� ��� ��� ��� ��� �� �� ��� ����
� � ������������ ���� �������
N=39
N=67; two cases scored higher than 30

MA
PP
ING
DIV
ER
SIT
Y
94 Indicator 6b: Number of patents applications fi led per fte academic staffThe second indicator in the innovation intensiveness dimension is the ratio of patent applications fi led to fte academic staff. As numerator the number of academic staff excluding doctoral students is used. Only half of the institutions reported data on patent applications fi led.
Figure 22: Higher education institutions by patent application per fte academic staff
�
�����
�����
�����
�����
����
�����
�����
�����
�����
����
�� ��� ��� �� ��� �� ��� ��� ��� ��� ����
��������������� ���� �������
Indicator 6c: Annual licensing incomeThe third innovation intensiveness indicator is formulated as an absolute fi gure. As such it may give an indication of the size of the higher education institution and its (past) performance regarding licensing contracts. However, to measure the intensiveness of the innovation activities of an institution, the absolute amounts are not very telling. That is the reason why an alternative indicator was calculated: the annual licensing income as a percentage of total income.There are only 15 non-zero responses on the annual licensing income question. Again it cannot be determined whether the other 52 institutions do not have information on this item, or actually do not have any licensing income.
Figure 23: Higher education institutions by the percentage of licensing income
����
����
����
���
����
���
����
����
����
����
����
�� ��� ��� �� ��� �� ��� ��� ��� ��� ����
��������������� ���� �������
N=67; fi ve cases scored higher than 0.02
N=59

MA
PP
ING
DIV
ER
SIT
Y
95Indicator 6d: Financial volume of privately funded research contracts as a percentage of total research revenues.The number of non-zero responses for this third indicator on innovation intensiveness is much higher than for the previous two. 40 higher education institutions reported valid data from nearly 0 to 100%. For 56% of the responding higher education institutions, revenues from privately funded research contracts are less than 10% of total research revenues.
Figure 24: Higher education institutions by privately funded research contracts as % of total research revenues
��
���
���
���
���
���
���
��
��
���
����
�� ��� ��� ��� ��� ��� ��� �� �� ��� ����
� � ������������ ���� �������
Indicator 7a: foreign degree seeking students as a percentage of total enrolment in degree programs
If relatively many students come to an institution from abroad to take a degree program it is assumed here that this institution has a high international orientation (in the fi eld of teaching and education).On average, the percentage of foreign degree seeking students at the bachelor level is substantially lower than the percentage at the master and doctorate levels. In addition to these three levels, the graph below comprises a category of all levels. In this category, students for all levels of programs are aggregated and the ratio calculated.At the bachelor level 75% of the responding higher education institutions reported less than 5% foreign degree seeking students.
N=46

MA
PP
ING
DIV
ER
SIT
Y
96 Figure 25: Higher education institutions by proportion of foreign degree seeking students, by type of program
Indicator 7b: Incoming EU exchange students as a percentage of the total number of students, by level of degreeThe European Union runs a number of programs to stimulate the international mobility of higher education students. We assume that a relatively high percentage of incoming students and/or students sent out within the framework of these exchange programs is an indication of a strong international orientation (in teaching and education).
Figure 26: higher education institutions by the percentage of incoming EU exchange students, by type of degree
��
���
���
���
���
���
���
��
��
���
����
� �� �� �� �� �� �� � � �� ���
� � ������������ ���� �������
����
������
��������
�� � �������
doctorate: N=22master: N= 30bachelor: N= 36all levels: N=54
��
��
��
��
��
��
��
�
�
��
���
� �� �� �� �� �� �� � � �� ���
� � ������������ ���� �������
������
��������
��������� �������
�� � �������
master: N=13bachelor: N=24bachelor+master N= 11all levels: N= 46cases scoring more than 10%: master 3, bachelor 5,all levels 7.

MA
PP
ING
DIV
ER
SIT
Y
97Indicator 7c EU exchange students sent out as a percentage of the total number of students, by level of degree
Figure 27: Higher education institutions by the percentage of EU exchange students, sent out, by type of degree
The percentage of exchange students is below 5% for the majority of responding higher education institutions. There is a group of higher education institutions (around 20%) that score substantially higher than the rest of the responding higher education institutions.
Indicator 7d: International academic staff as a percentage of total staff (all headcount)Part of the international profi le of an institution is the international profi le of its staff. One way to assess that profi le is by looking at the nationality of academic staff. It shows that one third of the responding higher education institutions did not have any international staff or could not provide information on this indicator.
Figure 28: Higher education institutions by % of international academic staff
��
��
���
���
���
���
���
���
���
���
���
�� ��� ��� ��� ��� ��� ��� �� �� ��� ����
� � ������������ ���� �������
��
��
���
���
���
���
���
���
���
���
���
� �� �� �� �� �� �� � � �� ���
� � ������������ ���� �������
������� ���
������
��������
��������� �������
�� � �������
doctorate: N=12master: N=16bachelor: N=25bachelor+master N=11all levels: N= 45cases scoring more than 50%: doctorate 2, master 3, bachelor 3, all levels 3.
N=67; cases scoring more than 50%: 3.

MA
PP
ING
DIV
ER
SIT
Y
98 Indicator 7e: Programs delivered abroadThe international orientation of a higher education institution does not only show in the attractiveness of its programs to foreign students. It may also show in its program offering abroad. Off-shore higher education is seen by some (non-EU) countries as a booming market and if an institution plays an active role on that market we assume that this shows a strong international orientation. Around one third of the responding higher education institutions provide programs abroad.
Figure 29: Higher education institutions by % of programs offered abroad by level of program
��
��
���
���
���
���
���
���
���
���
���
� �� �� �� �� �� �� � � �� ���
� � ������������ ���� �������
������
��������
�� � �������
Indicator 8a: Financial turnover in EU research programs as a percentage of total research turnover
40% of the responding higher education institutions reported no data on revenues from EU research programmes as a percentage of total research revenues. Another 40% received just a modest part of their research revenues from EU programmes (0-10%). Only 10% of the responding higher education institutions had more than 25% of their research income from EU research programmes.
Figure 30: Higher education institutions by turnover in EU research programs as % of total research revenues
��
���
���
���
���
���
���
��
��
���
����
�� ��� ��� ��� ��� ��� ��� �� �� ��� ����
� � ������������ ���� �������
master: N=16;bachelor: N=9;all levels: N= 25cases scoring more than 50%: master 2, bachelor 2,all levels 4.
N=63
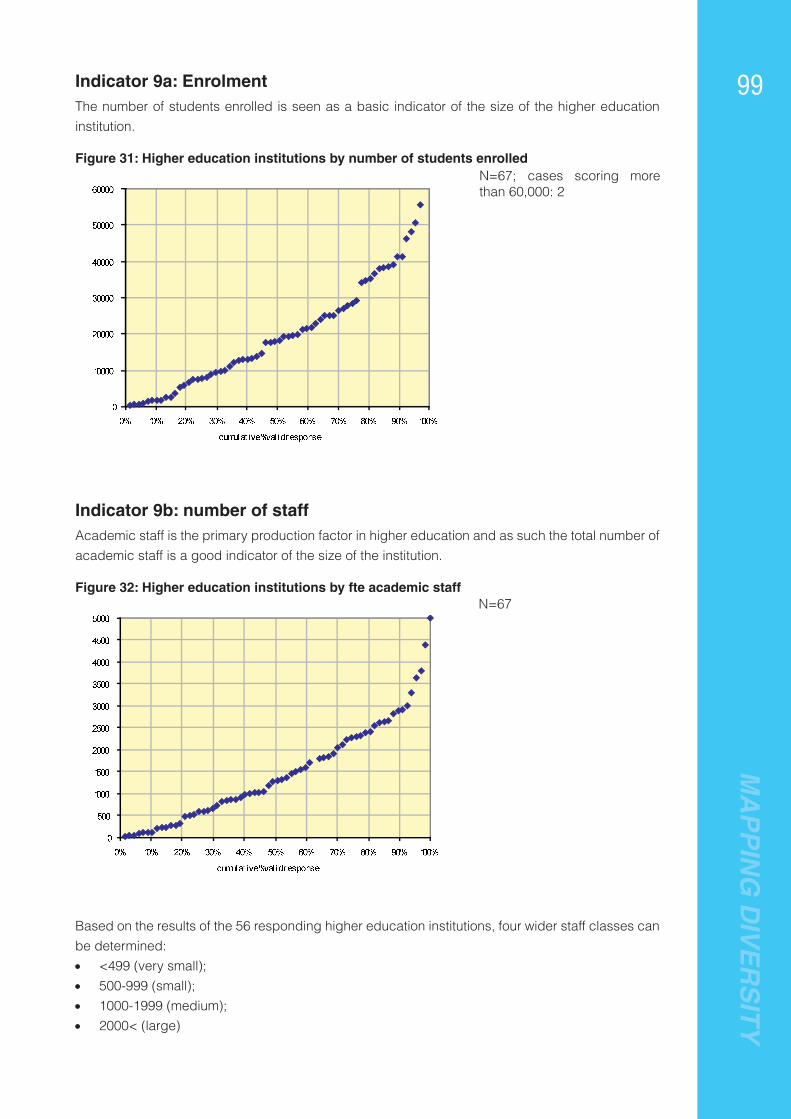
MA
PP
ING
DIV
ER
SIT
Y
99Indicator 9a: EnrolmentThe number of students enrolled is seen as a basic indicator of the size of the higher education institution.
Figure 31: Higher education institutions by number of students enrolled
�
�����
�����
�����
�����
�����
�����
�� ��� ��� ��� ��� ��� ��� �� �� ��� ����
� � ������������ ���� �������
Indicator 9b: number of staffAcademic staff is the primary production factor in higher education and as such the total number of academic staff is a good indicator of the size of the institution.
Figure 32: Higher education institutions by fte academic staff
�
���
����
����
����
����
����
����
����
����
����
�� ��� ��� ��� ��� ��� ��� �� �� ��� ����
� � ������������ ���� �������
Based on the results of the 56 responding higher education institutions, four wider staff classes can be determined:
<499 (very small); • 500-999 (small); • 1000-1999 (medium); • 2000< (large)•
N=67; cases scoring more than 60,000: 2
N=67
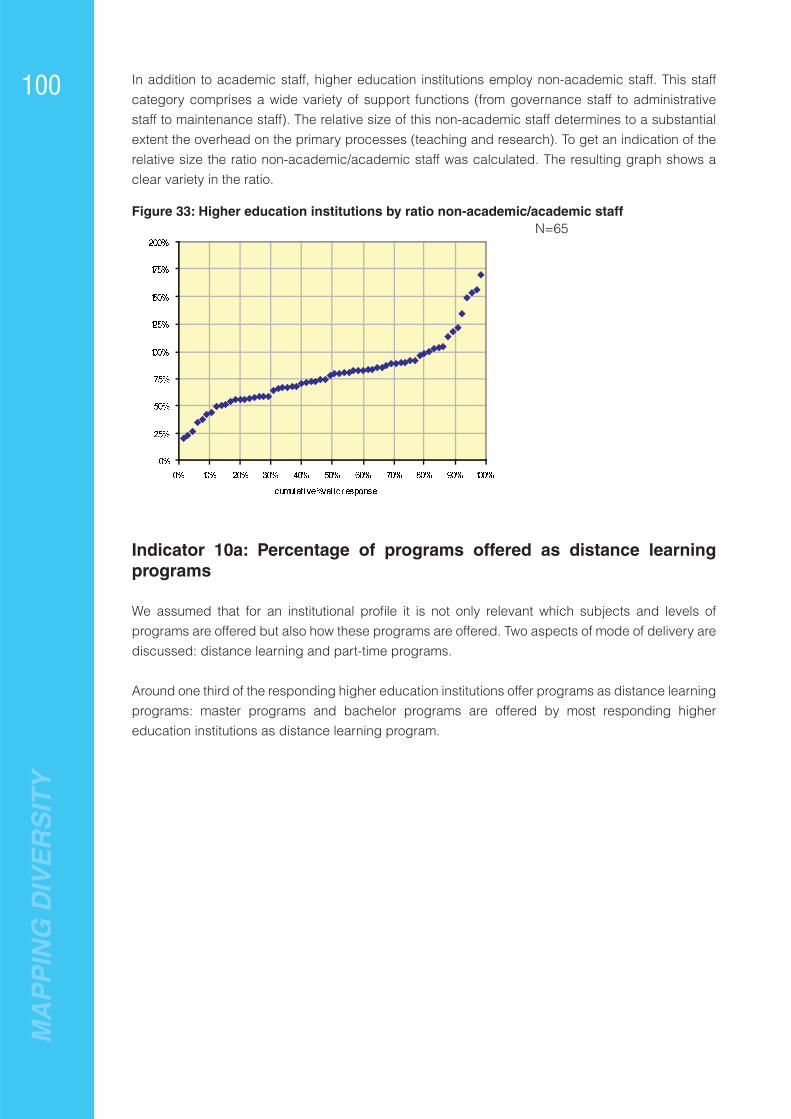
MA
PP
ING
DIV
ER
SIT
Y
100 In addition to academic staff, higher education institutions employ non-academic staff. This staff category comprises a wide variety of support functions (from governance staff to administrative staff to maintenance staff). The relative size of this non-academic staff determines to a substantial extent the overhead on the primary processes (teaching and research). To get an indication of the relative size the ratio non-academic/academic staff was calculated. The resulting graph shows a clear variety in the ratio.
Figure 33: Higher education institutions by ratio non-academic/academic staff
��
���
���
���
����
����
����
����
����
�� ��� ��� ��� ��� ��� �� ��� �� ��� ����
� � ������������ ���� �������
Indicator 10a: Percentage of programs offered as distance learning programs
We assumed that for an institutional profi le it is not only relevant which subjects and levels of programs are offered but also how these programs are offered. Two aspects of mode of delivery are discussed: distance learning and part-time programs.
Around one third of the responding higher education institutions offer programs as distance learning programs: master programs and bachelor programs are offered by most responding higher education institutions as distance learning program.
N=65
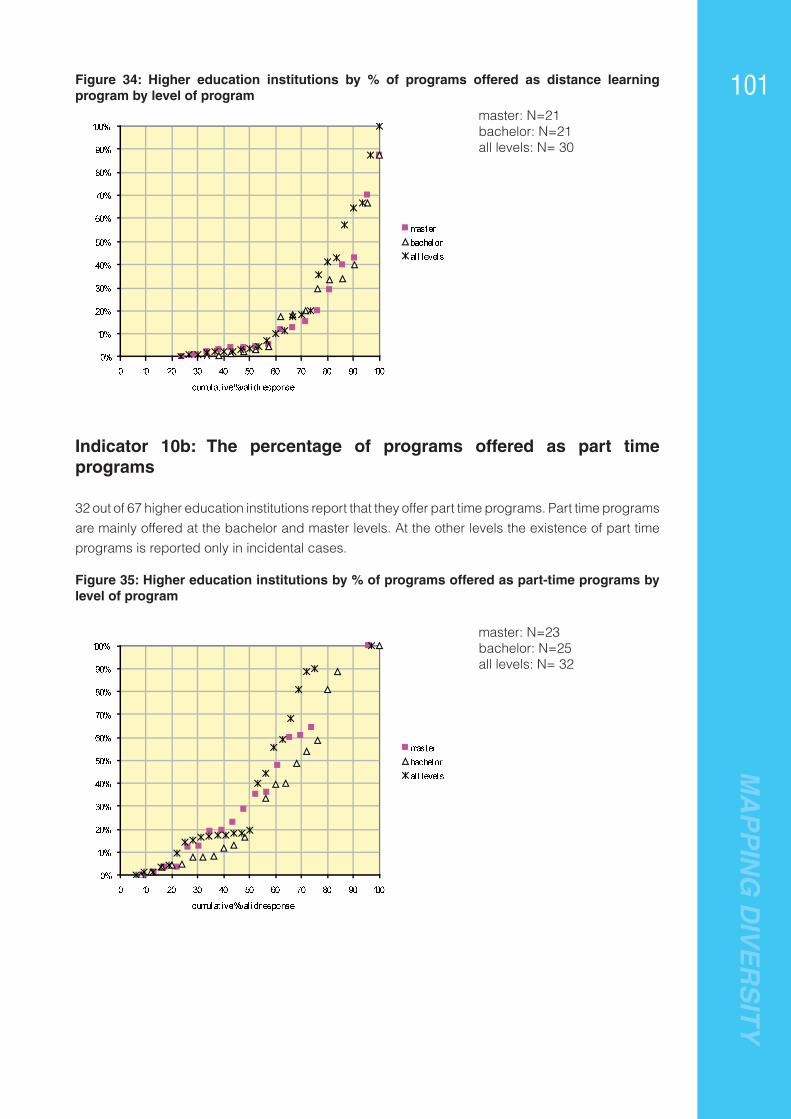
MA
PP
ING
DIV
ER
SIT
Y
101Figure 34: Higher education institutions by % of programs offered as distance learning program by level of program
��
���
���
���
���
���
���
��
��
���
����
� �� �� �� �� �� �� � � �� ���
� � ������������ ���� �������
������
��������
�� � �������
Indicator 10b: The percentage of programs offered as part time programs
32 out of 67 higher education institutions report that they offer part time programs. Part time programs are mainly offered at the bachelor and master levels. At the other levels the existence of part time programs is reported only in incidental cases.
Figure 35: Higher education institutions by % of programs offered as part-time programs by level of program
��
���
���
���
���
���
���
��
��
���
����
� �� �� �� �� �� �� � � �� ���
� � ������������ ���� �������
������
��������
�� � �������
master: N=21bachelor: N=21all levels: N= 30
master: N=23bachelor: N=25all levels: N= 32

MA
PP
ING
DIV
ER
SIT
Y
102 Indicator 10c: The percentage of students enrolled as part time students
The pattern emerging from the data on part time students is similar to the picture sketched above.
36 of the responding higher education institutions report students enrolled as part time students. Apparently there are a few institutions that enroll part time students but do not offer part time programmes. Part time students are most frequently enrolled at the bachelor and master level. At the doctorate level there are 11 higher education institutions enrolling part time students.
Figure 36: Higher education institutions by % of part-time students by level of program
��
���
���
���
���
���
���
��
��
���
����
� �� �� �� �� �� �� � � �� ���
� � ������������ ���� �������
������� ���
������
��������
�� � �������
Indicator 11a: Percentage of funding from government fundingThe public character of a higher education institution is most apparent in the balance between public and private funding. The assumption is that a high percentage of government funding indicates a public character. The majority of the responding higher education institutions has provided data on this indicator: only eight cases are missing. On average the percentage of government funding is 59%. One out of six institutions have no or virtually no government funding and 65% of the institutions have more than 50% government funding.
doctorate: N=11; master: N=21; bachelor: N=26; all levels: N= 36
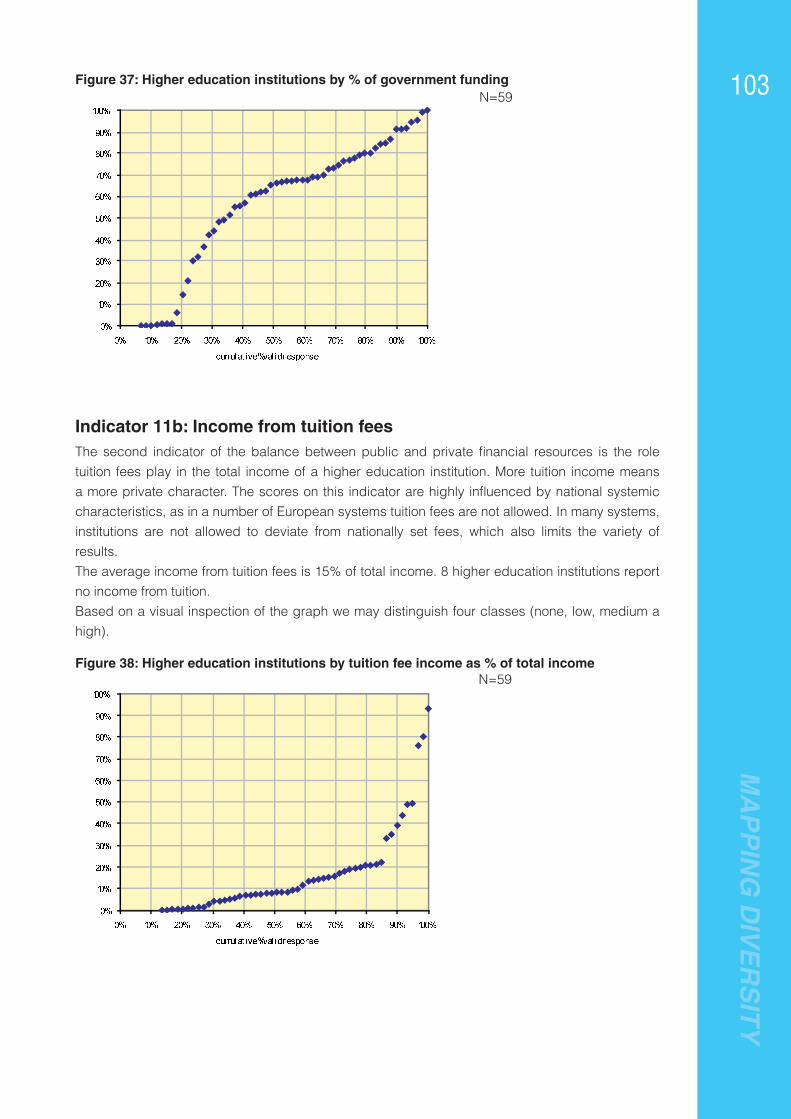
MA
PP
ING
DIV
ER
SIT
Y
103Figure 37: Higher education institutions by % of government funding
��
���
���
���
���
���
���
��
��
���
����
�� ��� ��� ��� ��� ��� ��� �� �� ��� ����
� � ������������ ���� �������
Indicator 11b: Income from tuition feesThe second indicator of the balance between public and private fi nancial resources is the role tuition fees play in the total income of a higher education institution. More tuition income means a more private character. The scores on this indicator are highly infl uenced by national systemic characteristics, as in a number of European systems tuition fees are not allowed. In many systems, institutions are not allowed to deviate from nationally set fees, which also limits the variety of results. The average income from tuition fees is 15% of total income. 8 higher education institutions report no income from tuition.Based on a visual inspection of the graph we may distinguish four classes (none, low, medium a high).
Figure 38: Higher education institutions by tuition fee income as % of total income
��
���
���
���
���
���
���
��
��
���
����
�� ��� ��� ��� ��� ��� ��� �� �� ��� ����
� � ������������ ���� �������
N=59
N=59

MA
PP
ING
DIV
ER
SIT
Y
104 Indicator 12a: legal status
The open question regarding the legal status produced a long list of specifi c legal names that needed to be recoded. The question of whether the respondent thinks the institution is public or private (according to the OECD defi nition) produces a much clearer picture.
Figure 39: Higher education institutions by public/private status
Indicator 13a: Concerts and performances22 responding higher education institutions did not report any information on this indicator. The absolute number of concerts is not a very telling indicator: it may be more informative to present this information relative to the total number of staff (academic and non-academic).
Figure 40: Higher education institutions by concerts and performances per staff member
����
����
����
����
����
����
�� ��� ��� ��� ��� ��� �� �� ��� ��� ����
��������������� ���� �������
�
private
public
N=60
N=66; three cases score higher than 0.25

MA
PP
ING
DIV
ER
SIT
Y
105Indicator 13b: Exhibitions
The absolute number of exhibitions (co-)organized by the higher education institution is also not a very telling indicator: it may again be more informative to present this information relative to the total number of staff (academic and non-academic).
Figure 41: Higher education institutions by exhibitions per staff member
����
����
����
����
����
����
�� ��� ��� ��� ��� ��� �� �� ��� ��� ����
��������������� ���� �������
Indicator 14a: Annual turnover in EU structural funds
55% of the responding higher educations reported no revenues from EU structural funds, or were unable to provide the information. Again the absolute amounts are not as telling as the amounts as a percentage of total income.
Figure 42: Higher education institutions by annual turnover in EU structural funds as % of total income
��
��
��
��
��
��
�
�
��
��
���
�� ��� ��� ��� ��� ��� �� �� ��� ��� ����
��������������� ���� �������
N=59
N=67; three cases score higher than 0.05

MA
PP
ING
DIV
ER
SIT
Y
106 Indicator 14 b: Graduates in the regionOnly 20 responding higher education institutions reported data here. But even for these higher education institutions the ratio cannot be calculated. The total number of graduates (as calculated from the data from indicator 1b) refers to one year (a fl ow) whereas the number of graduates in the region refers an accumulation of graduates over a number of years (a stock). There were many comments regarding the defi nition of ‘region’ and the lack of systematically collected data on this item.
Indicator 14c: Extracurricular coursesOffering extra curricular courses, focused at specifi c (local or regional) labour market needs is seen as an important indication of the regional engagement of a higher education institution. 40 responding higher education institutions reported that they offered at least one extra curricular course.
Figure 43: Higher education institutions by extra curricula courses offered
�
��
��
��
��
��
��
��
�
�
���
�� ��� ��� ��� ��� ��� ��� ��� �� �� ����
� � ������������ ���� �������
Indicator 14 d: Importance of regional sourcesThe responses to the ‘importance’ and to the ‘change’ questions of indicator 14d have been combined into one variable (per source).
National sources are critical for more than two thirds of the higher education institutions reporting valid data. For another quarter, the national sources have become signifi cant.International sources have grown in importance. For the majority of responding higher education institutions international sources have become signifi cant or are signifi cant. For every one out of seven international sources are critical.This information can also serve as an indicator for the dimension international orientation.
Local and regional sources are considered to be far less important than national and international sources: almost three quarters of the respondents consider the regional and local sources to be insignifi cant.
N=67; nine cases reported to offer more than 100 courses.

MA
PP
ING
DIV
ER
SIT
Y
107Figure 44: Higher education institutions by score on importance of different sources of income
0% 20% 40% 60% 80% 100%
importance ofnational sources
importance ofinternational
sources
importance oflocal and
regional sources
insignificant has become less insignificantsignificant has become significantcritical has become critical
N=51

MA
PP
ING
DIV
ER
SIT
Y
108 Discussion
In this chapter we discuss the results of the survey and the consequences these may have for the selection and clustering of dimensions and indicators. First we explore the dimensions with ‘poor’ indicators. The survey showed that a number of indicators scored signifi cantly lower on criteria such as validity and feasibility than others. Are these poor indicators evenly dispersed over the dimensions or can we identify particularly ‘challenging’’ dimensions (dimensions with predominantly poor indicators)? And what consequences may that have for the selection of dimensions and indicators? The focus then turns to a way to cluster the dimensions, using the scores on the questions on relevance.
‘Challenging’ dimensionsOne of the reasons for organising the survey was to fi nd out which dimensions and indicators would work and which would not. To fi nd an answer to this question we combined the information on the validity, feasibility and reliability of the indicators selected for each dimension. We do not use the scores on the perceived relevance of the dimensions since a high proportion of responding higher education institutions strongly disagreeing with the relevance of a dimension is not an indication of the quality of the dimension. We see such a lack of consensus as an indication of the diversity of the missions and profi les of the higher education institutions. Only if the vast majority of the responding higher education institutions disagreed with the relevance would we reconsider the choice of this dimension. This was not the case with any of the fourteen dimensions.
To identify potential challenging dimensions we selected those dimensions for which at least one indicator scores more than 5% strongly disagree on the validity and reliability items and is in the bottom fi ve of the overall feasibility ranking.Using these criteria, there are two ‘challenging’ dimensions: dimension 4, ‘Involvement in live long learning’ and dimension 6 ‘innovation intensiveness’.
If we use the validity and feasibility criteria only one more dimension emerges as being ‘challenging’: ‘regional engagement’.
If we use the validity and reliability criteria there are four ‘challenging’ dimensions: ‘program orientation’, ‘involvement in life long learning’, ‘research intensiveness’, and ‘innovation intensiveness’.
If we use the feasibility and reliability criteria again only the dimensions ‘Involvement in life long learning’ and ‘innovation intensiveness’ emerge.
Clustering dimensionsThe scores on the relevance questions can also be used to cluster the dimensions. First we look at the scores on the question where the three most and the three least important dimensions were identifi ed. If the scores on two dimensions correlate positively it is likely (Teeuwen 2004) that whenever a respondent thinks one of the indicators is most important he thinks the other indicator is most important as well. If a pair of dimensions are negatively correlated, it is likely that whenever a respondent thinks one of the indicators as most important he thinks the other indicators is least important. There are fi ve pairs of dimensions that appear to correlate positively and seven that correlate negatively.

MA
PP
ING
DIV
ER
SIT
Y
109The clustering is based on the correlation matrix of the scores on the questions (Kendall’s tau). The signifi cant correlations were mapped to fi nd out whether clear clusters emerge10. Using Kendall’s tau, ten combinations emerge as statistically signifi cant.
Table 12: Correlations between dimensionsdimension dimension Kendall’s tau
11 12 0.82**2 9 0.49*4 10 0.48*8 14 0.80*
11 13 0.46*6 9 -0.71**2 14 -0.69**5 10 -0.54**2 11 -0.53*5 11 -0.54*7 11 -0.53*9 13 -0.41*
** signifi cant at 0.01 level* signifi cant at 0.05 level
If the dimension public character (11) is mentioned it is very likely that the dimension legal status (12) is mentioned also in a similar way (most or least important). The same goes (to a lesser extent) for the combinations ‘range of subjects’ – ‘size’; ‘life long learning’ – ‘mode of delivery’; ‘international research orientation’ – ‘regional engagement’ and ‘public character’ – ‘cultural engagement’. For the other pairs listed it is likely that if one is mentioned important (innovation intensiveness) the other is considered to be least important (size).
The other way to probe for possible clusters of dimensions used the answers to the relevance questions, posed for each dimension. Again we calculated the bivariate correlations between the scores. A high correlation between two dimensions means that if the respondent scores one dimension as highly relevant it is likely that he scores the other dimension this way as well.
10 Factor analysis is not an option, due to the measurement level (which is ordinal).

MA
PP
ING
DIV
ER
SIT
Y
110 We mapped the dimensions and their statistically signifi cant correlations11.Visual inspection of the map suggests that there are at least three clusters of dimensions, with one or two sub-clusters.
Figure 45: Mapping of the dimensions and the correlations between the scores on relevance
5
3 14 8
11
6
9
4
10
12
13
7
2
1.36**
.29**
.37**
.46**
.28**
.27**
.30**
.38**
.40**
.28**
.32**
.28**
.35**
1: types of degrees offered2: range of subjects3: orientation of degrees4: involvement in life long learning5: research intensiveness6: innovation intensiveness7: international orientation (students and staff)
8: international orientation; research9: size10: mode of delivery11: public private12 legal status13 cultural engagement14 regional engagement
.29**
.31**.34**
The fi rst cluster comprises fi ve dimensions where dimension 8 (international research orientation) is the central dimension. The other dimensions in this cluster are 5 (research intensiveness), 1 (types of degrees offered), 2 (range of subjects), 6 (innovation intensiveness), and 7 (international orientation (teaching and staff)). This cluster has two faces: one R&D oriented side and one international orientation side.The second cluster includes dimensions 3 (orientation of degrees) and 14 (regional engagement)
11 Using two-tailed Kendall’s Tau

MA
PP
ING
DIV
ER
SIT
Y
111as well as dimension 4 (involvement in life long learning). This cluster may be characterised as the orientation towards the regional environment.The third cluster comprises dimension 9 (size), 11 (public private character) 12 (legal status), 13 (cultural engagement) and 10 (mode of delivery). The characterisation of this cluster is not obvious.
It is clear that there are other ways to reduce the number of dimensions. The scores on the indicators may be exploited in statistical ways to fi nd clusters of indicators that may point at new (clusters of) dimensions. In addition to these quantitative methods one may also consider using more theoretical approaches. Research literature may be used to fi nd different ways to combine information into meaningful clusters. At this stage of the project the decision to reduce the number of dimensions and how to do so has not yet been taken. To make such a decision, the material collected in this survey needs to be further analysed.
In conclusionThe survey among higher education institutions has given empirical substance to the frameworks developed in the classifi cation project so far. After the rounds of consultation in the fi rst phase of the project, we have been able to collect the views of a larger group of stakeholders regarding the relevance of the dimensions proposed. The use of on-line questionnaires forced the project team to become more specifi c and concrete regarding the choice of indicators and their operationalisation. The responses to the questionnaires showed that some of these choices need to be reconsidered, but for most of the indicators the survey produced valuable results.
One of these results is that the data collected can be used to group higher education institutions on many indicators. For some indicators a visual inspection of the scatter plots of the results suggest certain classes. On a number of indicators the scores breakdown into three or four classes (none, low, medium, high). Examples are indicators 3a (% of programs leading to certifi ed professions), 5a (peer reviewed publications per fte academic staff), 6d (privately funded research contracts as percentage of total research revenues), 7d (% international academic staff), 11a (% government funding) and 11b (% tuition fee income). For other indicators (such as the two indicators in dimension 9 (size) four more or less equally sized groups of institutions emerged. There was also a number of indicators for which it proved to be more challenging to come up with more than two groups (‘with’ and ‘without’). Examples of this category are the indicators on concerts and exhibitions (dimension 13), on patenting (6b) and on licensing income (6c). The data provided by the higher education institutions are clearly a crucial input in the further development of the classifi cation.
Knowing the results of the survey we may conclude that the role of higher education institutions is crucial in the process of developing and operating a European classifi cation for higher education institutions. Although there may be opportunities to use more existing data sources that will take part of the burden of data provision off the shoulders of the higher education institutions, it has become clear that a substantial part of the information has to be provided by the individual institutions.We may also conclude that once institutions have become involved in the process of collecting the data, they will have a strong intrinsic motivation to complete the questionnaires. This involvement was visible in the comments made in the survey and in the willingness of groups of institutions to co-operate in ‘communities’ to further the development of specifi c indicators.

MA
PP
ING
DIV
ER
SIT
Y
112 References
Moors, J. J. A. and J. Muilwijk (1975). Steekproeven, een inleiding tot de praktijk. Amsterdam, Agon Elsevier.
Teeuwen, H. (2004). “The art of prediction.” from http://nl.youtube.com/watch?v=PatELskRWWA&feature=related.
van Vught, F. and J. Bartelse (2005). Institutional Profi les, towards a typology of higher education institutions in Europe. Enschede.

MA
PP
ING
DIV
ER
SIT
Y
113Appendix 1: Comments
Dimension Comments1: types of degrees offered Only few comments were made. There was mention of
including non- degree program offerings and some confusion regarding the term ‘qualifi cations’
2: range of subjects offered There were very few comments made: two respondents stated that the ISCED classifi cation was not suited for describing the range of subjects
3: orientation of degrees Comments referred the subjective and ‘vague’ character of indicator b. There were furthermore some comments that the indicators could not differentiate between academic and non-academic or professional institutions. The project team deliberately avoided this ‘traditional’ dichotomy in the defi nitions, to break free of these high institutionalized labels.
4: involvement in life long learning
Comments were on the cut-off point. In some systems other defi nitions of ‘mature’ students are used (e.g., over 21 years on entrance in the UK), which may lead to confusion. It was also mentioned that national differences in entrance age and different way in which the programs are organized may lead to different age structures of the student body. In those cases the indicator does not identify differences in involvement in LLL but systemic differences.
5: research intensiveness Some respondents commented that the indicators do not apply to universities of applied sciences or art schools. It was furthermore commented that some obvious indicators are missing (like fte for research, other research outputs, and third party funds for research). Some of these indicators may be derived from the answers to other dimensions.
6: innovation intensiveness Comments mainly referred to national differences in patenting practices
7: international orientation: teaching and staff
There were few comments on the narrow, European scope of the indicators and on the impact the national context has on student mobility (e.g., UK receives much more students than Finland). Some respondents missed joint degrees or double degrees as indicators
8: international orientation: research
Most comments were on the EU-scope of the indicator: it is considered to be too narrow and should include other European and international funding sources.
9: size Two respondents suggested to include student staff ratios as an indicator. There was also the suggestion to use the number of degrees awarded (1b) as an indicator in this dimension.
10: mode of delivery Very few comments here. One respondent missed the number of students participating in distance learning programs.
11: public/private character Comments touched upon three issues.. The outcomes depend on the national public funding mechanism. Public versus private is a legal issue that should not be confused with the dependency on public sources [the new of the dimension is misleading]. Other private income like donations are not included.
12: legal status Very few comments
13: cultural engagement The indicators are considered to be too ‘simplistic’ and not covering the full width of cultural activities.
14: regional engagement Comments revealed some problems regarding the demarcation of the region, and the weak link between the eligibility of the region for structural funds and the regional engagement of a higher education institution. It was furthermore suggested to use the indicator on start-ups (6a) as an indicator for this dimension as well.

MA
PP
ING
DIV
ER
SIT
Y
114 Indicator Comment
1a: highest level of degree program offered Some comments that institutions are revising their degree structure following the Bologna architecture
1b: number of qualifi cations granted in each type of degree program
Mainly clarifi cations of what is reported
2a: number of subject areas covered by an institution using the UNESCO/ISCED subject areas
Few comments, mainly on ambiguity on what goes into the broad ISCED-categories
3a: the number of programs leading to certifi ed/ regulated professions as a % of the total number of programs
Next to clarifi cations of what is reported, there are some comments on defi nition of professional and regulated profession; to some of the respondents the defi nitions are not clear.
3b: the number of programs offered that answer to a particular demand from the labour market or professions (as % of the total number of programs)
Again some clarifi cations given. There are two types of comments: ‘professional’ is ill-defi ned, and ‘all programs answer to a demand from the labour market’.
4a: number of adult learners as a % of total number of students by type of degree
All comments are on the problems providing the data by specifi ed age group or type of program.
5a: number of peer reviewed publications per fte academic staff
Most comments are clarifi cations on what was reported or why nothing was reported. It proves that not all institutions have the information available or think the information is relevant.
5b: the ISI based citation indicator, also known as the ‘crown indicator’6a: the number of start-up fi rms Comments referred to the fact that institutions
did not have the information6b: the number of patent applications fi led Comments are mainly clarifi cation of what was
reported
6c: the annual licensing income Comments are mainly clarifi cation of what was reported
6d: the revenues from privately funded research contracts as a % of total research revenues
There are some comments on the diffi culty to obtain total research revenues since part of research revenues are in the lump sum provided by the government. From the comments we also can learn that respondents treat medical research in different ways (in- or excluding it). The remaining comments are clarifi cations.
7a: the number of degree seeking students with a foreign nationality, as % of total enrolment
The are two comments on the defi nition of foreign student, both stating that nationality may not be a good indication of the international orientation. Most other comments are clarifi cations on data provided
7b: the number of incoming students in European exchange programs, as % of total enrolment
Comments clarify the data provided. It proved to be diffi cult sometimes to report data on bachelor level only.
7c: the number of students sent out in European exchange programs
Comments clarify the data provided. It proved to be diffi cult sometimes to report data on bachelor level only.
7d: international staff members as % of total number of staff members
Comments clarify the data provided.

MA
PP
ING
DIV
ER
SIT
Y
1157e number of program offered abroad Most comments explain that no programs are offered abroad. There are three comments where the defi nition of ‘programs offered abroad’ are discussed.
8a: the institution’s fi nancial turn-over in European research programs as % of total fi nancial research turn-over
Comments clarify the data provided.
9a: number of students enrolled (headcount) For two cases the data reported refer to undergraduate level only. It is also mentioned that using the academic year as reference period would make dataprovision easier.
9b: number of staff members employed (fte) A few comments were made on special categories of staff (medical, externally fi nanced) that were in- or excluded.
10a: number of distance learning programs as % of total number of programs
The issue how to deal with blended learning was raised a few times. Other comments were mere clarifi cations.
10b: number of part-time programs as % of total number of programs
The comments show that the difference between part-time programs (designed as such) and programs that students may take in part-time is a diffi cult distinction.
10c: number of part-time students as of total number of students
Comments clarify the data provided.
11a: income from (competitive and non-competitive) government funding as a % of total revenues
Here are some comments on the defi nitions used. It is not clear what is in competitive government funding (is research council funding in or out?)
11b: income from tuition fees as % of total income
Some comments that fees include not only tuition fees from regular degree programs but also from other courses and other activities.
12a: legal status A few comments on the defi nition of ‘legal status’ and the fact that national descriptions may be diffi cult to compare in an international setting
13a: number of offi cial concerts and performances (co)-organised by the institution
Some comments on the the fact that information is not (readily) available
13b: number of offi cial exhibitions (co)-organised by the institution
Some comments on the the fact that information is not (readily) available
14a: annual turnover in EU structural funds as % of total turnover
Comments clarify the data provided.
14b: number of graduates remaining in the region as % of total number of graduates
This indicator evoked many comments. Many institutions did not have this information available. There was also a problem with the defi nition of the region.
14c: number of extracurricular courses offered for regional labour market
The comments show that the defi nition of extra-curricular courses is not clear to everyone.
14d: importance of local/regional income sources*
A few clarifying comments. One comment referred to the omission of tuition fee as a source of income.

This project has been funded with support from the European Commission.
This publication content refl ects the views only of the authors. The Commission cannot be held responsible for any use which may be made of the information contained therein.
Project Identifi cation number 2006 – 1742 / 001 – 001 SO2 81 AWB