Mapping Disaster Risk Reduction (MapDRR) Report - · PDF fileMapping Disaster Risk Reduction...
11
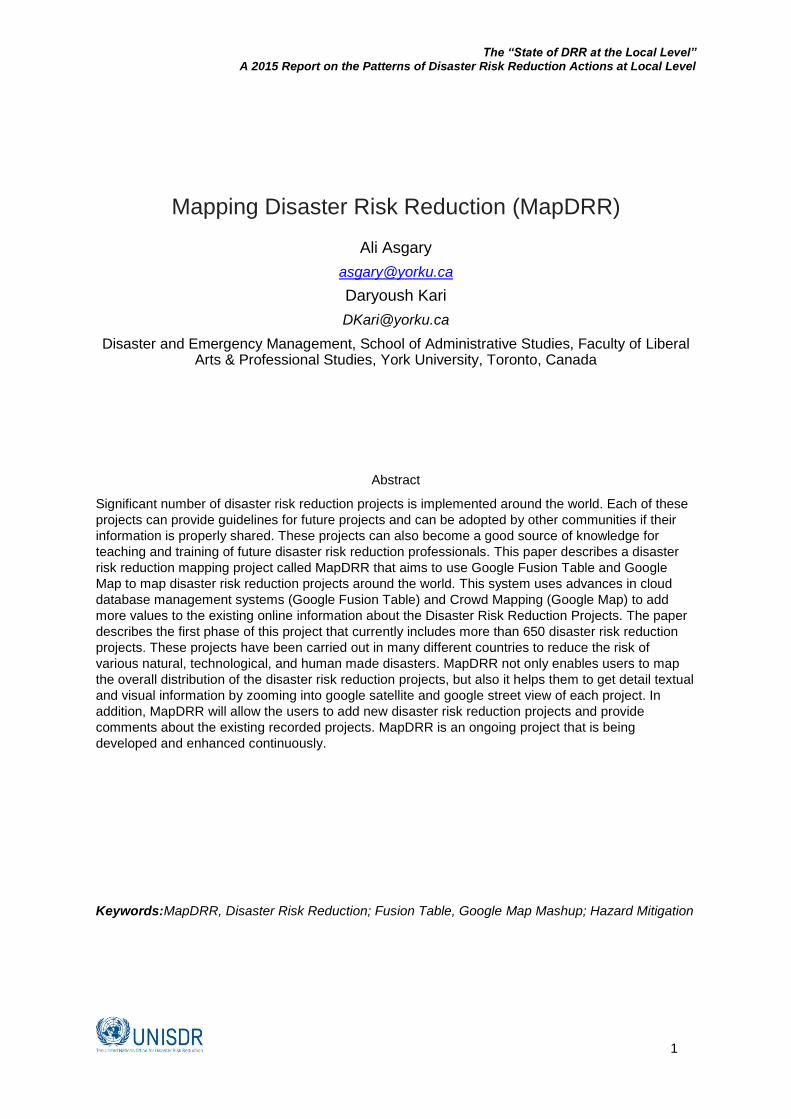
The “State of DRR at the Local Level” A 2015 Report on the Patterns of Disaster Risk Reduction Actions at Local Level 1 Mapping Disaster Risk Reduction (MapDRR) Ali Asgary [email protected] Daryoush Kari [email protected] Disaster and Emergency Management, School of Administrative Studies, Faculty of Liberal Arts & Professional Studies, York University, Toronto, Canada Abstract Significant number of disaster risk reduction projects is implemented around the world. Each of these projects can provide guidelines for future projects and can be adopted by other communities if their information is properly shared. These projects can also become a good source of knowledge for teaching and training of future disaster risk reduction professionals. This paper describes a disaster risk reduction mapping project called MapDRR that aims to use Google Fusion Table and Google Map to map disaster risk reduction projects around the world. This system uses advances in cloud database management systems (Google Fusion Table) and Crowd Mapping (Google Map) to add more values to the existing online information about the Disaster Risk Reduction Projects. The paper describes the first phase of this project that currently includes more than 650 disaster risk reduction projects. These projects have been carried out in many different countries to reduce the risk of various natural, technological, and human made disasters. MapDRR not only enables users to map the overall distribution of the disaster risk reduction projects, but also it helps them to get detail textual and visual information by zooming into google satellite and google street view of each project. In addition, MapDRR will allow the users to add new disaster risk reduction projects and provide comments about the existing recorded projects. MapDRR is an ongoing project that is being developed and enhanced continuously. Keywords:MapDRR, Disaster Risk Reduction; Fusion Table, Google Map Mashup; Hazard Mitigation
Transcript of Mapping Disaster Risk Reduction (MapDRR) Report - · PDF fileMapping Disaster Risk Reduction...
The “State of DRR at the Local Level” A 2015 Report on the Patterns of Disaster Risk Reduction Actions at Local Level
1
Mapping Disaster Risk Reduction (MapDRR)
Ali Asgary
Daryoush Kari
Disaster and Emergency Management, School of Administrative Studies, Faculty of Liberal Arts & Professional Studies, York University, Toronto, Canada
Abstract
Significant number of disaster risk reduction projects is implemented around the world. Each of these
projects can provide guidelines for future projects and can be adopted by other communities if their
information is properly shared. These projects can also become a good source of knowledge for
teaching and training of future disaster risk reduction professionals. This paper describes a disaster
risk reduction mapping project called MapDRR that aims to use Google Fusion Table and Google
Map to map disaster risk reduction projects around the world. This system uses advances in cloud
database management systems (Google Fusion Table) and Crowd Mapping (Google Map) to add
more values to the existing online information about the Disaster Risk Reduction Projects. The paper
describes the first phase of this project that currently includes more than 650 disaster risk reduction
projects. These projects have been carried out in many different countries to reduce the risk of
various natural, technological, and human made disasters. MapDRR not only enables users to map
the overall distribution of the disaster risk reduction projects, but also it helps them to get detail textual
and visual information by zooming into google satellite and google street view of each project. In
addition, MapDRR will allow the users to add new disaster risk reduction projects and provide
comments about the existing recorded projects. MapDRR is an ongoing project that is being
developed and enhanced continuously.
Keywords:MapDRR, Disaster Risk Reduction; Fusion Table, Google Map Mashup; Hazard Mitigation

The “State of DRR at the Local Level” A 2015 Report on the Patterns of Disaster Risk Reduction Actions at Local Level
2
1 Introduction A large number of disaster risk reduction projects (DRRPs) are being undertaken by different
governmental and non-governmental agencies around the world. Transfer of knowledge that are
generated by these projects to other communities and generations is very important for DRR
programs internationally (Cadag and Gaillard, 2012). Each of these projects is a unique symbol of
disaster risk reduction knowledge and action and as such it can provide ideas and transfer knowledge
to other agencies in other communities who are seeking to implement particular disaster risk
reduction projects. In some cases valuable information about these DRRPs are available online, but it
is very scattered and not easily accessible or identifiable. Currently there is not a dedicated online tool
or system that can provide Disaster Risk Reduction (DRR) experts, practitioners, planners,
researchers and students with an easy access to these projects.
Since most of the DRRPs are taking place in a particular location, they have a location or spatial
attribute such as an address or latitude and longitude. This provides an opportunity to map these
projects. Existence of easy to develop and easy to use cloud database and mapping systems
combined with their interactive and participatory capabilities enables us to design and create DRRPs
databases to better introduce these projects to interested individuals and organizations.
Efforts have been made to create databases and online portals of Disaster Risk Reductions. One
example of such efforts is the Disaster Risk Reduction Project Portal for Asia and the Pacific
(www.drrprojects.net) that has been developed by the ISDR Asia Partnership on Disaster Reduction
(IAP) with the funding support of the Asian Development Bank (ADB) and executed by the Asian
Disaster Preparedness Center (ADPC). This online system provides information on all DRR projects
in Asia and the Pacific region in order to increase collaboration and cooperation on conceptualisation,
planning and programming on DRR among different stakeholders. The DRR Project Portal provides
users with customizable tables, graphs, and maps of DRR projects. Data is provided by registered
organisations that have implement the DRR projects. The DRR Project Portal was developed using
the Sahana Eden Open Source Disaster Management Platform (http://sahanafoundation.org/). This
portal has been used in disaster risk reduction analysis (ISDR, 2011).
While portals like Disaster Risk Reduction Project Portal for Asia and the Pacific provide a good
database with search, analysis, and mapping tools for the Asia and Pacific Region, the main goal of
the MapDRR is to develop and alternative approach in mapping, visualising, and reporting DRR
projects using the power of Google map and Google fusion table technologies. As such we cover
those DRR projects that have spatial attributes (i.e. latitude and longitude). The key advantages of
this approach are: 1) Based on Google Map, MapDRR provides more mapping contexts where users
can zoom in and change map styles (satellite, terrain, and street view) and see where exactly the
DRR projects are being implemented relative to the hazards; 2) Using google map API, spatial
analysis tools can be added to the maps that will allow users to apply some basic mapping analysis;
3) Being in the cloud, there is no cost for these services; 4) the database can be easily shared and
integrated in other applications.
This paper describes the first phase of this educational and research initiative that has been started at
York University to map world’s DRRPs. Mapping these projects and making them more accessible
can be a useful source for DRR professionals who are trying to find such measures and apply them in
their own contexts. It also enables students to learn about different types of hazard and risk mitigation
measures and their management processes.
The rest of this paper is organized as follows: Section two explains the methodology, technology and
research design used to carry out this research. Section three introduces some of the preliminary

The “State of DRR at the Local Level” A 2015 Report on the Patterns of Disaster Risk Reduction Actions at Local Level
3
outcomes of the project, followed by some discussions in section four. Section five concludes the
paper with some recommendations.
2 Research design The following steps have been taken in developing the MapDRR.
1. Identifying DRRPs and data Collection
2. Developing the Online Database of DRRPs Using Google Fusion Table
3. Mapping DRRPs with Google Map
This section briefly explains each of the above steps.
2.1. Identifying DRRPs
We used the internet as the main source to identify potential DRRPs. We applied a number of general
(such as disaster risk reduction project, hazard mitigation project, etc.) and specific (flood disaster
reduction project, earthquake risk reduction project, etc.) keywords to achieve this goal. Considering
the resources and time that we had to spend on the first phase of this project, we identified more than
630 projects. Our goal was to have a diverse sample of different types of DRRPs for different
countries in the first phase. We then identified a list of key attributes for the projects that need to be
added as fields to the database. The following attributes were finally selected, considering the
availability of information and their usefulness for the end users:
Name of the Project
Type of the DRR or Mitigation
Hazard Category(s)
Type of Hazard
Country, Continent, City
Short Description
Reference/Website
Image
“Name of the project“ represents the official name given to the project.” In most cases each project
has its unique name. Examples include: Dust Strom mitigation Project; Gretna Flood control;
Padiyapelella town Landslide Mitigation; Mexico’s Battle Against Desertification; and Anti-Hail
Cannon. Using the project description and available information, “Type of the DRR or Mitigation”
classifies the type of mitigation or risk reduction measures. Using the structural and nonstructural
mitigation measures we have tried to classify the DRRPs using this attribute. This field is very
important when users need to classify and query the DRRPs in terms of different types of structural
and non-structural measures. “Hazard Category” identifies the projects in terms of overall hazard
categories: natural; technological; and intentional/civic. “Type of the Hazard(s)” shows the type of
hazard that the project has been targeting. In most cases DRRPs target single hazards, but when
multiple hazards have been mentioned, the word “multi-hazard” has been used. A number of
geographical fields (city/province, country, and continent) have been added to identify the overall
location of the projects which will be useful for creating charts and thematic maps. This will enable the
users to find and classify the DRRPs based on their geographic locations.
Since we were interested in mapping the exact location of the DRRPs projects, we needed to have
either the latitude and longitude or the full address of the projects. A “Location” field has been added
to the database that contains the latitude and longitude of each project separated by comma in one
The “State of DRR at the Local Level” A 2015 Report on the Patterns of Disaster Risk Reduction Actions at Local Level
4
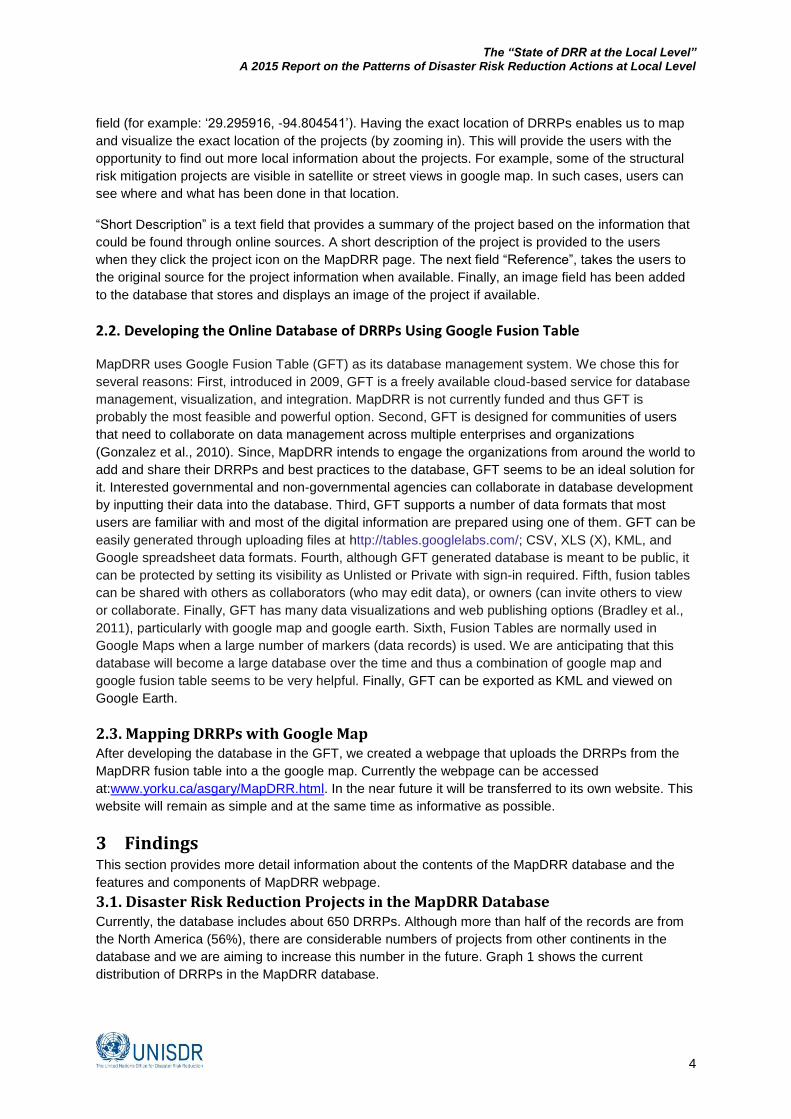
field (for example: ‘29.295916, -94.804541’). Having the exact location of DRRPs enables us to map
and visualize the exact location of the projects (by zooming in). This will provide the users with the
opportunity to find out more local information about the projects. For example, some of the structural
risk mitigation projects are visible in satellite or street views in google map. In such cases, users can
see where and what has been done in that location.
“Short Description” is a text field that provides a summary of the project based on the information that
could be found through online sources. A short description of the project is provided to the users
when they click the project icon on the MapDRR page. The next field “Reference”, takes the users to
the original source for the project information when available. Finally, an image field has been added
to the database that stores and displays an image of the project if available.
2.2. Developing the Online Database of DRRPs Using Google Fusion Table
MapDRR uses Google Fusion Table (GFT) as its database management system. We chose this for
several reasons: First, introduced in 2009, GFT is a freely available cloud-based service for database
management, visualization, and integration. MapDRR is not currently funded and thus GFT is
probably the most feasible and powerful option. Second, GFT is designed for communities of users
that need to collaborate on data management across multiple enterprises and organizations
(Gonzalez et al., 2010). Since, MapDRR intends to engage the organizations from around the world to
add and share their DRRPs and best practices to the database, GFT seems to be an ideal solution for
it. Interested governmental and non-governmental agencies can collaborate in database development
by inputting their data into the database. Third, GFT supports a number of data formats that most
users are familiar with and most of the digital information are prepared using one of them. GFT can be
easily generated through uploading files at http://tables.googlelabs.com/; CSV, XLS (X), KML, and
Google spreadsheet data formats. Fourth, although GFT generated database is meant to be public, it
can be protected by setting its visibility as Unlisted or Private with sign-in required. Fifth, fusion tables
can be shared with others as collaborators (who may edit data), or owners (can invite others to view
or collaborate. Finally, GFT has many data visualizations and web publishing options (Bradley et al.,
2011), particularly with google map and google earth. Sixth, Fusion Tables are normally used in
Google Maps when a large number of markers (data records) is used. We are anticipating that this
database will become a large database over the time and thus a combination of google map and
google fusion table seems to be very helpful. Finally, GFT can be exported as KML and viewed on
Google Earth.
2.3. Mapping DRRPs with Google Map After developing the database in the GFT, we created a webpage that uploads the DRRPs from the
MapDRR fusion table into a the google map. Currently the webpage can be accessed
at:www.yorku.ca/asgary/MapDRR.html. In the near future it will be transferred to its own website. This
website will remain as simple and at the same time as informative as possible.
3 Findings This section provides more detail information about the contents of the MapDRR database and the
features and components of MapDRR webpage.
3.1. Disaster Risk Reduction Projects in the MapDRR Database Currently, the database includes about 650 DRRPs. Although more than half of the records are from
the North America (56%), there are considerable numbers of projects from other continents in the
database and we are aiming to increase this number in the future. Graph 1 shows the current
distribution of DRRPs in the MapDRR database.

The “State of DRR at the Local Level” A 2015 Report on the Patterns of Disaster Risk Reduction Actions at Local Level
5
Graph 1. Distribution of DRRPs in the MapDRR database as of May 2014.
Majority of the MapDRRPs database records are related to the natural hazard cateogory (87%). Only
11% of the records are technological and 2% are intentional/civil disaster risk reduction projects
(Graph 2).

The “State of DRR at the Local Level” A 2015 Report on the Patterns of Disaster Risk Reduction Actions at Local Level
6
Graph 2. Distribution of DRRPs project in term of Hazard type
Graph 3. Distribution of DRRPs project in term of hazard type
Natural International/Civil Technological
0
100
200
300
400
500
600
Natural
International/Civil
Technological
Animal Attack1%
Avalanche4%Climate Change
1%Cyclone
2%Drought4%
Earthquake8%
Environmental1%
Erosion1%Fire
1%
Flood23%
Hail 1%
Health3%
Hurricane2%
Infrastructure 2%
Landslide6%
Multi hazards8%
Severe Weather1%
Storm3%
Terrorism1%
Tornado 3%
Transportation2%
Tsunami 3%
Volcano2%
Water1%
Wildfire6%
Others8%

The “State of DRR at the Local Level” A 2015 Report on the Patterns of Disaster Risk Reduction Actions at Local Level
7
Graph 3 provides some detail information about the DRRPs in terms of the type of hazards that they
are dealing with. The current version of database covers a large number of different hazards.
However, as expected significant number of the projects are flood related projects (23%).
3.1. MapDRR Website
MapDRR is a currently a webpage that has two main components: 1) MapDRR Google Map; and 2)
MapDRR Menu. By entering the MapDRR website, users will see all of the existing DRRPs in a world
map (zoom level 2 in google mapI) (Image 1). To make the records more visible the map type has
been set to “Road”.
Image 1: The MapDRR map Component.
Users can select each of the DRRPs by clicking on their marker. When a project is selected, detail
information is provided to the user in the information window and the zoom level and the map type are
changed to present more local and visual information about the project location. Depending on the
availability of information map type is changed either to satellite or street view (Image 2). In this
example street view of the project site is also available (Image 3).
Image 2. Google map satellite view of the selected DRR project.

The “State of DRR at the Local Level” A 2015 Report on the Patterns of Disaster Risk Reduction Actions at Local Level
8
Image 3. The street view image of the DRR project site.
Users can also filter the DRRPs using the provided menu on the right hand side of the website (image
4). Currently DRRPs can be filtered by hazard category and hazard type. More filters such ad DRR
type and continent and country filters will be added in the near future.
Image 4: MapDRR Menu

The “State of DRR at the Local Level” A 2015 Report on the Patterns of Disaster Risk Reduction Actions at Local Level
9
Finally, users can extract graph and tabular data for preferred hazard and or DRR projects. This will
enable researchers and policy makers to benefit from the database using aggregated data (Image 5).
Image 5: DRR Projects by type of hazards (graph generated by Google Fusion Table )
4 Discussion The MapDRR as explained here is a Google Map application initiative that uses Google Fusion Table
Technology to map disaster risk reduction projects around the world. This is a project that is in
progress both in terms of its database and in terms of its google map interface. We believe that such
mapping tool can be very helpful for students, researchers, practitioners, and policy makers who are
interested in learning about different types of disaster risk reduction projects that are being
undertaken around the world. It not only maps the DRRPs, but also it provides useful textual and
visual information to the users by bringing together the information that is publicly available in an easy
to understand and navigate approach. However, creating a comprehensive and complete DRRPs
mapping system is a daunting task and faces many challenges. Some of these challenges and key
areas of improvements are discussed here.
First, many DRRPs especially those that have been implemented in the past or are being
implemented by many local governments today are either not reported online (the main source for the
MapDRR ) or if they are reported, they are not eported in English, the current language of MapDRR.
Second, although we intentionally limited the number of fields in our database to make it easier for the
information providers and the end users, it is possible to add more fields to the database as required.
However, adding more fields requires more database management system capacities. This might
become a challenging task as the number of records in the database increases.
Third, the “Project Description” field in the MapDRR database contains significant textual information
about each project. Being able to add queries that can filter projects based on the information
provided in this field could be very valuable. We aim to add this functionality to the MapDRR so that
users can find projects that have certain types of information in their descriptions.

The “State of DRR at the Local Level” A 2015 Report on the Patterns of Disaster Risk Reduction Actions at Local Level
10
Fourth, to receive the maximum benefits from creating the MapDRR database in the Google Fusion
Table, we will add more features to MapDRR website. These features will allow the users to generate
and view thematic maps, graphs and charts for their selected DRRPs.
Fifth, to make MapDRR a participatory mapping tool, we will allow users to submit their DRR projects
to be added to the database after verification. In addition MapDRR can add a section on the database
that collects and publishes users’ comments about the viewed DRRPs. We are hoping that the
participatory and crowd sourcing attributes of the MapDRR encourages more practitioners and DRR
experts to provide DRR records and input to the database as highlighted by Doge and Kitchin (2013).
This of course has its own challenges as discussed and argued by several other authors (Carr, 2007;
Crutcher and Zook, 2009).
Finally, we are developing specific symbols for each DRRP types to be replaced with the default
google symbols. This will help users to visually identify the DRRPs on the google map window much
faster and easier.
5 Conclusions MapDRR adds many additional benefits to the existing information that are available about DRRPs on
the cloud. It provides DRR experts and researchers additional tool to easily find, analyse, and map
DRRPs that have been implemented or are being implemented around the world. It will allow the
users to compare different projects in different locations and learn from them using this interactive
database and mapping tool.
There are many obvious improvements that need to be made to MapDRR, starting from adding more
DRR records, structuring the database and adding more fields to the MapDRR Fusion Table,
providing spatial analysis functionalities, query options, and users input to the google map component
of the MapDRR. However, our plan is to provide useful, reliable, and added value information to the
users and prioritize future extensions of MapDRR.
6 Acknowledgements Authors would like to acknowledge the following York University Students for their efforts in collecting
the initial disaster risk reduction projects: Amina Mohammad Ali, Arham Arshad, Adam Witts, Ahmad
Chaudhry, Andrea Nguyen, Colette Clarke, Dan Gutin, Toroptsev Denys, Fatemeh Nourinejad, Gita
Javaheri, Hema Bahl, Hilal Faizal,Jean Kadenhe, Kevin Mak, Mohand Radi, Muhammad Mirza, Nima
Sarjahani, Oliver Sandford, Paolo Di Rezze, Rudo Kadenhe, Rumaila Soin, Ryan Lucknauth, Sadegh
Taheri, Sara Akib, Shahzaib Khalid, Shivam Kapoor, Toan Ly Ngo, Zaigham Imran, Tyler Willson,
Uzma Bhatti, Vilma Lopez Luna, AllenRenee, and Maryanne Bendell.
7 References
Bradley ES, Roberts DA, Dennison PE, Green RO, Eastwood M, Lundeen SR, McCubbin IB, and
Leifer I, 2011, “Google Earth and Google Fusion Tables in support of time-critical
collaboration: Mapping the deepwater horizon oil spill with the AVIRIS airborne spectrometer”,
Earth Sci Inform (2011) 4:169–179.
Cadag JRD and Gaillard JC (2012) Integrating knowledge and actions in disaster risk reduction: The
contribution of participatory mapping. Area 44: 100–109.

The “State of DRR at the Local Level” A 2015 Report on the Patterns of Disaster Risk Reduction Actions at Local Level
11
Carr N G, (2007) The ignorance of crowds” Strategy + Business Magazine, 47,1–5.
Crutcher M, Zook M, (2009) Placemarks and waterlines: racialized cyberscapes in post-Katrina
Google Earth”, Geoforum, 40, 523–534.
de Vries S, Buijs AE, Langers F., Farjon H, van Hinsberg A, Sijtsma FJ, (2013), “Measuring the
attractiveness of Dutch landscapes: Identifying national hotspots of highly valued places using
Google Maps”, Applied Geography, 45, 220-229.
Dodge M, and Kitchin R, (2013) “Crowdsourced cartography: mapping experience and knowledge”,
Environment and Planning A, 45, 19–36.
Gaillard JC, and Maceda EA, (2009) Participatory 3-dimensional mapping for disaster risk reduction”.
Participatory Learning and Action 60, 109–118.
Gonzalez H, Halevy AY, Jensen CJ, Langen A, Madhavan J, Shapley R, Shen W, Goldberg-Kidon J,
(2011), “Google Fusion Tables: Web-Centered Data Management and Collaboration”,
SIGMOD’10, June 6–11, 2010, Indianapolis, Indiana, USA.
ISDR, (2011) At the Cross Roads: Climate Change Adaptation and Disaster Risk Reduction in Asia
and Pacific. UNISDR Asia and Pacific Secretariat.