Mapping behavioral evolution onto brain evolution
14
doi: 10.1098/rstb.2010.0344 , 2111-2123 366 2011 Phil. Trans. R. Soc. B Barbara L. Finlay, Flora Hinz and Richard B. Darlington species strategic roles of conserved organization in individuals and Mapping behavioural evolution onto brain evolution: the Supplementary data ml http://rstb.royalsocietypublishing.org/content/suppl/2011/06/01/366.1574.2111.DC1.ht "Data Supplement" References http://rstb.royalsocietypublishing.org/content/366/1574/2111.full.html#related-urls Article cited in: http://rstb.royalsocietypublishing.org/content/366/1574/2111.full.html#ref-list-1 This article cites 88 articles, 28 of which can be accessed free Subject collections (2834 articles) evolution (280 articles) developmental biology (2165 articles) behaviour (543 articles) neuroscience Articles on similar topics can be found in the following collections Email alerting service here right-hand corner of the article or click Receive free email alerts when new articles cite this article - sign up in the box at the top http://rstb.royalsocietypublishing.org/subscriptions go to: Phil. Trans. R. Soc. B To subscribe to This journal is © 2011 The Royal Society on July 29, 2011 rstb.royalsocietypublishing.org Downloaded from
Transcript of Mapping behavioral evolution onto brain evolution
doi: 10.1098/rstb.2010.0344, 2111-2123366 2011 Phil. Trans. R. Soc. B
Barbara L. Finlay, Flora Hinz and Richard B. Darlington speciesstrategic roles of conserved organization in individuals and Mapping behavioural evolution onto brain evolution: the
Supplementary data
ml http://rstb.royalsocietypublishing.org/content/suppl/2011/06/01/366.1574.2111.DC1.ht
"Data Supplement"
References
http://rstb.royalsocietypublishing.org/content/366/1574/2111.full.html#related-urls Article cited in:
http://rstb.royalsocietypublishing.org/content/366/1574/2111.full.html#ref-list-1
This article cites 88 articles, 28 of which can be accessed free
Subject collections
(2834 articles)evolution � (280 articles)developmental biology �
(2165 articles)behaviour � (543 articles)neuroscience �
Articles on similar topics can be found in the following collections
Email alerting service hereright-hand corner of the article or click Receive free email alerts when new articles cite this article - sign up in the box at the top
http://rstb.royalsocietypublishing.org/subscriptions go to: Phil. Trans. R. Soc. BTo subscribe to
This journal is © 2011 The Royal Society
on July 29, 2011rstb.royalsocietypublishing.orgDownloaded from
on July 29, 2011rstb.royalsocietypublishing.orgDownloaded from
Phil. Trans. R. Soc. B (2011) 366, 2111–2123
doi:10.1098/rstb.2010.0344
Review
* Autho† PresenBiology,USA.
Electron10.1098
One codevelopm
Mapping behavioural evolution onto brainevolution: the strategic roles of conserved
organization in individuals and speciesBarbara L. Finlay1,2,*, Flora Hinz1,2,† and Richard B. Darlington1,2
1Department of Psychology, and 2Department of Neurobiology and Behavior, Cornell University,Ithaca, NY 14853, USA
The pattern of individual variation in brain component structure in pigs, minks and laboratory miceis very similar to variation across species in the same components, at a reduced scale. This conservedpattern of allometric scaling resembles robotic architectures designed to be robust to changes incomputing power and task demands, and may reflect the mechanism by which both growing andevolving brains defend basic sensory, motor and homeostatic functions at multiple scales. Conservedscaling rules also have implications for species-specific sensory and social communication systems,motor competencies and cognitive abilities. The role of relative changes in neuron number in thecentral nervous system in producing species-specific behaviour is thus highly constrained, whilechanges in the sensory and motor periphery, and in motivational and attentional systems increasein probability as the principal loci producing important changes in functional neuroanatomybetween species. By their nature, these loci require renewed attention to development and life historyin the initial organization and production of species-specific behavioural abilities.
Keywords: brain evolution; allometry; domestication; individual variation; neocortex
1. INTRODUCTION: FRAMEWORKS TO RELATENATURAL VARIATION IN BEHAVIOUR, BRAINSTRUCTURE AND GENESIndividual variation is the foundation of naturalselection, and the idea of inheritance of adaptivecharacteristics is fundamentally a simple one. Yet,understanding individual behavioural variability andits inheritance is one of the most complex tasksfacing current researchers. A good theory of the organ-ization of every level of analysis from behaviour to geneis necessary: individual animals in populations, thecomputational structure of the brain, the mechanismsof development of the organism and the translationfrom genome to organism. How do we begin tobreak into the complex chain from gene to brain to be-haviour to population? For example, a fairly recentreview of the evolutionary biology of animal cognitiongives an ambitious catalogue of variations in behaviourranging from very specific differences in sensory sys-tems to very complex changes in communicationsystems and cognition, some with known fitness conse-quences [1]. The associated brain ‘phenotypes’ rangefrom photoreceptor opsins, to neurotransmitters and
r for correspondence ([email protected]).t address: Howard Hughes Medical Institute and Division ofCalifornia Institute of Technology, Pasadena, CA 91125,
ic supplementary material is available at http://dx.doi.org//rstb.2010.0344 or via http://rstb.royalsocietypublishing.org.
ntribution of 10 to a Theme Issue ‘Evolutionaryental biology (evo-devo) and behaviour’.
2111
to whole brain organization and size, and the speciesrange from humans to Drosophila, but in no case isthe explanatory chain ever complete. For perfectlyunderstandable reasons, researchers appreciate thecomplexity of the level of analysis of their primaryarea of expertise, and underestimate the complexityof other levels, producing predictable and recurringerrors in explanations that attempt to bridge levels.
In the following paper, we will present some newdata about individual variation in brain parts andrelate it to phylogenetic variability. Relating the sizeof brain parts to species-typical adaptive behaviourshas been the subject of studies of brain allometry formany years [2–6]. The nature of individual variationin the size of brain parts offered to selection informsthis work directly. For this journal issue, however, wewill place these results in the context of three links inthe behaviour-to-gene chain, where new informationhas appeared. First, while the behavioural significanceof changes in absolute and relative brain size in phylo-geny has been the subject of analysis and speculationfor many years, causal or even correlational linksbetween relative brain size and fitness had never beendemonstrated. Newer studies now allow a betterunderstanding of what behavioural advantage anincrease in relative brain size permits animals in natu-ral contexts. Second, new work in computer science inrobotics, the design of machines that must function inthe real world, are beginning to yield insights on whatkinds of computational architectures are robust tochange, damage and growth. Finally, developmentalneurobiology increasingly demonstrates the importance
This journal is q 2011 The Royal Society
2112 B. L. Finlay et al. Review. Individual variability in brains
on July 29, 2011rstb.royalsocietypublishing.orgDownloaded from
of epigenetic and developmental factors in aligninginitially unspecified brain structures with theirparticular physical and social environments.
(a) Some insights from the evolution of
colour vision
Of all the work in evolution of perceptual and motorsystems, vertebrate colour vision comes closest tohaving a full description at every level, including gen-etic, developmental, physiological, computationaland ecological. The history of this investigation caninform current work on other aspects of brain and be-havioural evolution directly. Vertebrate colour visioncontrasts the output of two to five very broadly tunedphotoreceptors that cover the visible spectrum tocode the reflectance characteristics of objects andenvironments with relative independence from thespectrum of light illuminating them. A typical mammalhas two photopigments for diurnal vision (opsins), andmost anthropoid primates have three [7–9]. The opsinmolecule, composed of amino acids, is a rough cylinderto which a short-chain molecule, 11-cis retinal, isattached, like a tab on a cola can. Light absorbed bythe 11-cis retinal changes its conformation to all-trans,initiating the chain of phototransduction. Of the several100 amino acids comprising the opsin molecule (usingthe red–green opsin as a typical example), only a smallfraction are placed in the opsin cylinder such that anamino acid substitution will change the best wavelengthfor reconformation of the 11-cis retinal molecule [10].The probability of this class of mutations with directfunctional consequences is reasonably well understoodin terms of the ongoing ‘jitter’ in base-pair substitutionthat the genome continuously undergoes. Overall, thesteps from gene to opsin to phototransduction areexceptionally well worked out.
From basic receptor photosensitivity to adaptivefunction in the real world, that is, to perception andbehaviour, the path to understanding has been rockier.What does a changed best frequency of a photopig-ment signify for behavioural adaptation? A first guesswas that there might be a direct relationship betweenthe most sensitive frequency of the photoreceptorsand a specific aspect of the adaptive environment. Per-haps the best frequencies of photoreceptors evolved tofacilitate foraging or conspecific recognition—that is,detecting yellow preferentially to find bananas, or dis-criminating the redness of faces (e.g. [11]). However,no case of direct matching of best opsin frequencyand any particular feature of the environment haveever been established as a basis for species-typical pre-ferences (not negating the fact of species-typicalpreferences, only where in the brain they may be situ-ated!). Instead, the opsins appear to have been selectedto adequately cover the range of available light in eachspecies’ typical environment. In the case of signalling,the signaller (whether fruit or conspecific) typicallyevolves to be optimally detectable, while the receiverremains ‘generic’ [12,13].
In the special case of primate trichromacy, a singleamino acid change in the original opsin may producetwo slightly different opsin forms whose output canbe compared in the central nervous system [14].
Phil. Trans. R. Soc. B (2011)
This produces better ‘colour acuity’ in the green–brown regions of colour space, with many plausibleadaptive advantages [15–18]. Startlingly, the identicalmodification may be ‘knocked in’ to the retinas ofmice or dichromatic monkeys, who can in short orderlearn to make behavioural use of the new colour infor-mation, with no other genetic changes in their nervoussystems [19,20].
The lessons to be learned here are important, as theytend to recur over and over in brain–behaviour map-ping questions. First, researchers equated prominentadaptive features of the behavioural environment(such as a coloured fruit) with features of the eye andbrain (such as opsin best frequency, a particular celltype or a brain nucleus) far too quickly: the categoriesof the world are not the categories of the brain.Second, when investigators were interested in species-typical specializations in sensorimotor capacities, suchas ability to identify a particular fruit, they tended toignore the complex abilities in scene recognition, navi-gation and locomotion upon which such specializationsultimately depended. These complex, species-generalabilities may dominate species-specific specializationsin any currently measurable form of ‘neural commit-ment’ like neural volume or energetic expenditure.Finally, the perceptual, cognitive and motor systemsof any extant vertebrate are the end result of continualcompromise, having proved competent to deal withboth species-typical and species-general problems.
(b) Evolution shapes development
New work in evo-devo adds a further dimension to ourunderstanding of behavioural variability. The centralresearchers and theorists in evo-devo argue persua-sively that the developmental programmes of existingcreatures are as much a product of evolution as theirmature phenotypes, and that these developmental pro-grammes come to have the features of ‘evolvability’and robustness. Considering the various aspects of‘evolvability’, which have been discussed at lengthelsewhere [21–24], the one of central interest here is‘facilitated variation’. Readers interested in a discus-sion of basic issues in brain development, includingorganization of the body plan, neural proliferationand segmentation, and activity-dependent organi-zation of the central nervous systems are directed toany one of these sources.
Consider an evolutionary case of unfacilitated vari-ation. Suppose we know that an animal would enjoygreater reproductive success if it had longer forelimbs,but we also know that there are no coordinating mech-anisms between the developmental programmesproducing its various organ systems. Production oflonger forelimbs in this animal would require simul-taneous random changes in its unlinked programmesfor bone growth, vascular supply, muscle volume,muscle attachments, the length of other attachedbones, the neural programme executing movementand so on. While gradual accretion of such changesis certainly not impossible, in principle, no such un-likely lineups of random events are needed to producedifferences in relative and absolute amounts of limbgrowth in existing animals. A mutation changing only
Review. Individual variability in brains B. L. Finlay et al. 2113
on July 29, 2011rstb.royalsocietypublishing.orgDownloaded from
the rate or duration of bone production can be seen inadult limb morphology because of the epigenetic pro-grammes controlling somatic growth in which bonegrowth is embedded.
In the colour vision example, a random change inthe coding of a single amino acid in a much largeropsin molecule can directly change its best wavelength.If the neural system supporting wavelength selectivityrequired new committed processors from retina tobrain (‘banana detectors’; ‘command neurons forbanana grasping’), such changes at the photoreceptorlevel would rarely have consequences other than blind-ness. If the brain mechanism that looks at retinalinformation is a generalized wavelength comparator,however, as seems to be the case, prepared to analysea new contrast and learn its relationship to environ-mental structure, the mutation can succeed, as hasrecently been demonstrated [19,20]. On the otherhand, ‘nonsense’ genetic changes unsupported byepigenetic embedding or robust neural programmeswill likely be invisible or be deleterious. Normal devel-opment, via evolution, acts as a filter of geneticmutations to promote meaningful variability that ithas previously and successfully experienced, andopsin variations appear to be in that class.
(c) From individual variation to species
variation in morphology
Links of natural phenotypic variation to evolutionarydimensions of fitness, speciation and genotype havebeen made in non-behavioural contexts. Linkingwithin-species individual phenotypic variability to pat-terns of speciation has been evaluated in wide-rangingnatural contexts and phyla, the most well-knowninstances involving readily observable aspects of mor-phology, for example, plant ecology [25], skeletalalterations in three-spine sticklebacks [26] and thebeaks of Darwin’s finches [27]. In a particularly rele-vant study, Schluter [28] related details of sticklebackmorphological individual variation in skeletal structureto speciation. For a founder species, the largest set ofco-varying features was termed ‘Gmax’, ‘the phyloge-netic path of least resistance’. For closely relatedspecies, it was predicted that this factor should behighly represented, as it is the corpus of accessible vari-ation on which selection can easily act. For distantlyrelated species, it was expected that the variationobserved would diverge systematically. Instead, Gmaxremained as high in the distant taxa as in the immedi-ately related ones. ‘Developmental constraint’ wasoffered to account for these results, operating overboth short and long time spans. Alternatively, how-ever, the co-varying dimensions could represent theoperation of conserved developmental programmes,facilitating variability along the dimensions associatedwith viable outcomes in the past and filtering out others.
In natural instances of variation and speciation,going to the second step of linking phenotypic changesdirectly to genotypic changes has been attempted inonly a few contexts, such as bird plumage [29], theexplosive radiation of the Lake Malawi cichlids [30]and, recently, adaptive specialization of mouse furcolour to the environment [31]. These studies are
Phil. Trans. R. Soc. B (2011)
‘existence proofs’ that the links from fitness asmeasured in natural settings to genetic mechanismscan be made, when we understand the structure ofindividual and species variability in features withdemonstrated fitness relationships.
2. CONSERVATION AND VARIATION IN BRAINSIZE AND BEHAVIOUR, IN AN EVO-DEVOCONTEXT(a) Relative brain size can be directly linked
to aspects of fitness
The largest possible focus for brain–behaviourrelationships, the whole brain, is a surprisingly infor-mative place to begin. Pervasive increases in relativebrain size with respect to body size (‘encephalization’)in multiple lineages over evolutionary time and itsassociation with behavioural complexity (without anydirect measure of fitness) were first described systema-tically by Jerison [2]. More recently, the same simplefeature of relative brain size (at the species level) hasbeen shown to have direct links to fitness, in innova-tive studies of multiple species of both birds andmammals in natural ecology [32]. These fitness indi-cators include annual mortality rate, probability of anindividual species’ survival when introduced into anew niche, and behavioural innovation in diet. Theseecological indicators can be further correlated withseveral measures of learning flexibility in laboratorycontexts in a smaller number of species. Althoughentirely different in emphasis, similar studies actuallyexist for individual differences in humans: individualvariations in absolute brain size have a small, but statisti-cally significant link to intelligence quotient (e.g. [33]),and thus to multiple measures of socioeconomic status,if not ‘fitness’. The relative sizes and developmental pat-tern of enlargement of the parts of the brain mostdisproportionately large in the largest individual brains,the frontal and parietal cortex, vary directly withindividual differences in cognitive flexibility [34].
(b) Allometric variability in brains, between
species
To make the links from behavioural flexibility to brainsize to initial genetic specification of brain size, viadevelopment, we have empirical work at every step.Phylogenetic variation between mammalian species’brains is well described [3,35]. Developmental altera-tions associated with species variations in brain sizeand sensory systems are beginning to be understood[36–40]. A growing body of knowledge exists onthose genes or gene loci involved in brain size regu-lation including studies in mouse models [41–44], indevelopment [45–48] and in phylogeny [49].
(c) Theories of brain function underlying the first
hypotheses of brain evolution
The history of our understanding the relationship ofcomplex behavioural functions to phylogenetic brainvariation is one of bootstrapping back and forth fromthe most general structure–function mappings to pro-gressively more sophisticated versions, in much the sameway that the understanding of the evolution of colourvision changed over time. Here, we must digress
2114 B. L. Finlay et al. Review. Individual variability in brains
on July 29, 2011rstb.royalsocietypublishing.orgDownloaded from
somewhat to consider contrasting theories of brainfunction in a general evolutionary context. As men-tioned, Jerison [2] first proposed a relationshipbetween encephalization, the possession of a relativelylarge brain with respect to body size, and behaviouralcomplexity. He also hypothesized the strategic allocationof neural volume according to niche, which is the prin-ciple of ‘proper mass’. Particularly, he argued morevolume came to be allocated to neocortex in highlyvisual, diurnal primates and more to olfactory bulb andthe limbic system in early nocturnal insectivores. Thisaxis of variation in relative olfactory bulb and limbicbrain size proves to be a recurring ‘principal component’of vertebrate brain variability, not only of primates[37,50,51], whose significance we will explore later.
In parallel with Jerison’s description, the growth ofneuroethology on the one hand, with its attention tospecies-specific adaptations, and the early discoveriesof localization or ‘modularization’ of mature neuralfunction in cognitive neuroscience led the field to con-centrate on the relationship of lifestyle and niche tospecific brain parts. The basic hypothesis appearedthat brains are collections of special-purpose devicesor ‘modules’ that can be the objects of selection, apoint of view that retains strong adherents in evolution-ary psychology (e.g. [52]), and some fields of cognitiveneuroscience [53]. It is often assumed without questionin literature about brain evolution [3,5].
To compare species, the immediate corollary of the‘collection of devices’ hypothesis was that the relativesize of a brain part should reflect the importance orcomplexity of the behaviour dependent upon it,‘proper mass’. When investigated widely across speciesand brain structures, relating non-shared residual vari-ation in the relative size of brain parts to niche orbehavioural specializations typically met with onlymodest success, capturing statistically significant butsmall amounts of variation (e.g. [3,5]). Many reason-able predictions based on the idea of ‘proper mass’fail to find any relationship of relative size and utilityat all, for example whether there is a correlationbetween a mammal’s nocturnality or diurnality andthe volume of its visual cortex [54]. Any behaviouralor fitness advantage directly owing to change in therelative size of a brain part has yet to be demonstrated.
Several apparent exceptions to this generality occur,which we will introduce now and discuss fully later interms of the component structure of brain variability.Dunbar [4] posited that the relative size of the neo-cortex in primates, compared with the rest of thebrain, was related to species’ complexity in socialstructure, the ‘social brain’ hypothesis, though morerecent analyses target whole brain size rather thancortex alone [55]. Species and individual variation inthe hippocampus also stands out in its consistentrelationship to requirements of memory in foraging andnavigation, often dependent on experience [56–58].The hippocampus associates with the olfactory bulband olfactory cortex and dissociates from neocortexscaling across mammalian species [35], and is part ofthe neocortex/limbic contrast originally laid out byJerison [2].
Simply because species differences in sensory capa-bilities, motor adaptations and social structure do
Phil. Trans. R. Soc. B (2011)
not link readily to relative size of anatomically definedchunks of the brain in mammals (for example, equat-ing ‘motor skill’ and ‘cerebellar volume’), this doesnot signify that species-specific adaptations do notexist, or that they are not important. It simply suggeststhat species-typical specializations must arise throughother mechanisms. Some plausible, demonstratedmechanisms producing species diversity are: (i) thesensory or motor periphery imposing its order on thecentral nervous system, (ii) changed distributions ofneuromodulators and receptors altering social motiv-ation and attention, and (iii) dynamic reallocation ofneural tissue to the most active channels by instructionthrough the sensory channels and motivational prefer-ences of each animal. We have finally set the stage forlooking at the relationship between phylogenetic varia-bility in brain structure and scaling, and individualdifferences in brain organization.
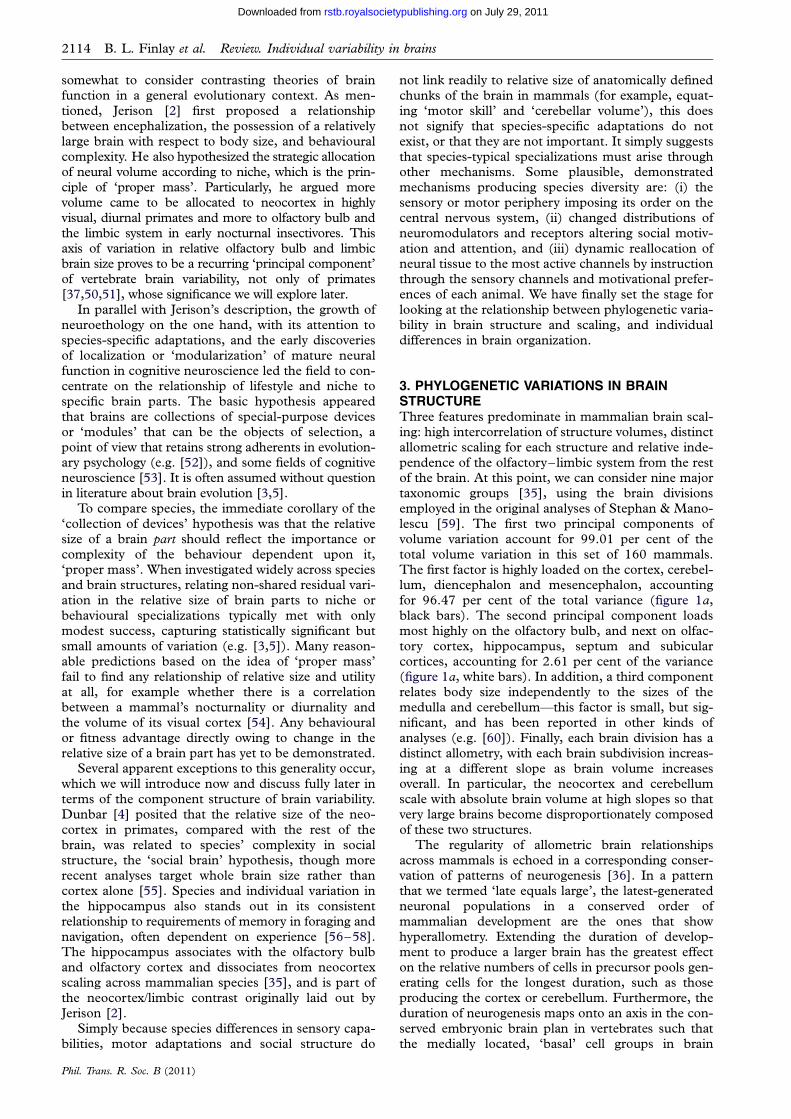
3. PHYLOGENETIC VARIATIONS IN BRAINSTRUCTUREThree features predominate in mammalian brain scal-ing: high intercorrelation of structure volumes, distinctallometric scaling for each structure and relative inde-pendence of the olfactory–limbic system from the restof the brain. At this point, we can consider nine majortaxonomic groups [35], using the brain divisionsemployed in the original analyses of Stephan & Mano-lescu [59]. The first two principal components ofvolume variation account for 99.01 per cent of thetotal volume variation in this set of 160 mammals.The first factor is highly loaded on the cortex, cerebel-lum, diencephalon and mesencephalon, accountingfor 96.47 per cent of the total variance (figure 1a,black bars). The second principal component loadsmost highly on the olfactory bulb, and next on olfac-tory cortex, hippocampus, septum and subicularcortices, accounting for 2.61 per cent of the variance(figure 1a, white bars). In addition, a third componentrelates body size independently to the sizes of themedulla and cerebellum—this factor is small, but sig-nificant, and has been reported in other kinds ofanalyses (e.g. [60]). Finally, each brain division has adistinct allometry, with each brain subdivision increas-ing at a different slope as brain volume increasesoverall. In particular, the neocortex and cerebellumscale with absolute brain volume at high slopes so thatvery large brains become disproportionately composedof these two structures.
The regularity of allometric brain relationshipsacross mammals is echoed in a corresponding conser-vation of patterns of neurogenesis [36]. In a patternthat we termed ‘late equals large’, the latest-generatedneuronal populations in a conserved order ofmammalian development are the ones that showhyperallometry. Extending the duration of develop-ment to produce a larger brain has the greatest effecton the relative numbers of cells in precursor pools gen-erating cells for the longest duration, such as thoseproducing the cortex or cerebellum. Furthermore, theduration of neurogenesis maps onto an axis in the con-served embryonic brain plan in vertebrates such thatthe medially located, ‘basal’ cell groups in brain
neocortex
cerebellum
dienceph
mesenceph
striatum
medulla
subic. cortex
septum
hippocamp
olf. cortex
olf. bulb
(a)
(b)
(c)
(d)
(e)
0 0.2 0.4 0.6 0.8 1.0
neocortex
cerebellum
dienceph
mesenceph
striatum
medulla
subic. cortex
septum
hippocamp
olf. cortex
olf. bulb
% variance explained
neocortexcerebellum
diencephmesenceph
striatummedulla
subic. cortexseptum
hippocampolf. cortex
olf. bulb
neocortexcerebellum
diencephmesenceph
striatummedulla
subic. cortexseptum
hippocampolf. cortex
olf. bulb
neocortexcerebellum
diencephmesenceph
striatummedulla
subic. cortexseptum
hippocampolf. cortex
olf. bulb
% variance explained
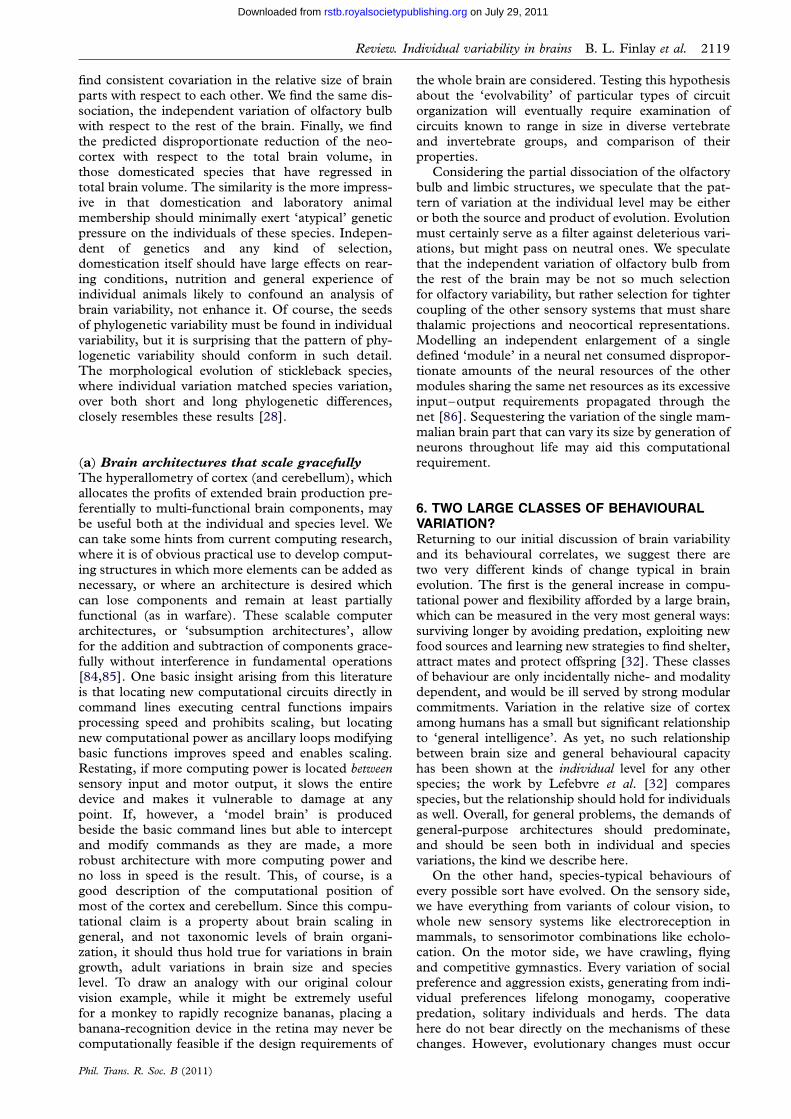
Figure 1. In all graphs, the percentage variance in each structure described by the first principal component (PC1) is graphedby the black bars, and the second principal component (PC2) by the white bars, the total percentage variance differing in each
case. (a) ‘Phylogenetic variability’, based on a sample of 131 species of bats, primates and insectivores. PC1 accounts in totalfor 96.47 and PC2, 2.61%. (b) ‘Individual variability, Composite’ includes 47 individuals whose scores were entered as devi-ations from cell means so as to exclude species and sex differences, where the cells were six male wild mink, six female wildmink, six male domestic mink, six female domestic mink, six wild pigs of unknown sex, six domestic pigs of unknown sex and11 mouse strains. PC1 accounts for 72.48% of the variance, and PC2 for 7.9%. For the individual species, (c) pig, (d) mink
and (e) mouse, data are plotted so that their overall pattern might be examined, but no statistical claims about factor loadingson individual structures are made at the individual species level.
Review. Individual variability in brains B. L. Finlay et al. 2115
on July 29, 2011rstb.royalsocietypublishing.orgDownloaded from
segments (‘segments’ here are spinal cord segments,rhombomeres and prosomeres) cease precursor gener-ation early. Laterally located, ‘alar’ groups stop last, orin the case of hippocampus and olfactory bulb con-tinue into adulthood [38].
Taxa included in the phylogenetic analysis of brainvariability are very diverse, including species of mega-and microbats, shrews, armadillos, polar bears, llamas,humans and manatees, with brain sizes ranging over20 000-fold [35]. Within any particular species, brainsizes will only range over a tiny fraction of this amount,but as phylogenetic variability must arise from the heri-table components of individual variability, it is entirelyreasonable to ask what aspects of phylogenetic varia-bility in brains are mirrored in individual variability.One excellent source of brain volume measurements ofmultiple individual members of single species exists,measured in a way comparable with the original Stephan
Phil. Trans. R. Soc. B (2011)
dataset and the Reep extended dataset. Dieter Kruskameasured a variety of individual animals to study theeffects of domestication. He compared a sample ofsix wild boars with six domestic swine (brain sizesrange from 92 to 204 g, ratio 2.21 [61]) and 12 adultwild mink brains with 12 adult ranch mink brains(brain sizes range from 7.2 to 10.4 g, ratio 1.44 [62];the electronic supplementary material, table S1). Hecompared a number of other domestic and wild specieswith fewer individuals (reviewed and discussed in[63–65]). In the present analysis, our interest was notdomestication per se, but the availability of measure-ments of a number of individuals of the same specieswith the bonus of the added variation produced bydomestication. In addition, morphometric analysesof a wide variety of mouse brains used for genetic ana-lyses are now available from an online database ([66];Box 1 includes individual strain descriptions). In this
Box 1. Mouse strain details.
In general, most strains are wild-derived inbred strains with, at most, inducible non-neural diseases. Only WSB/Ei andCAST/Ei are referred to as wild strains.
CAST/Ei—is referred to as a wild strain (not inbred) and is often used as a control line. In a study characterizing be-havioural phenotypes, CAST/Ei always came out somewhere between inbred strains, with no significant behaviouralphenotype evident from the approximately 13 tests described [67,68].
CASA/Rk—wild-derived inbred strain, no abnormal phenotype.Molf/Ei—wild-derived inbred strain, which has no abnormal behavioural phenotype but is extremely susceptible to
infection with Salmonella typhimurium [69].SWR/J—wild-derived inbred strain, which is susceptible to chemically induced colorectal cancer, but responds well to
the anti-tumour drug lentinan [70,71]. The SWR/J strain also exhibits more extensive corneal clouding after UVexposurethan other inbred strains do, and control SWR/J mice exhibits a low activity variant phenotype for the major ocular alde-hyde dehydrogenase (ALDH) AHD-4, and decreased levels of soluble protein in corneal extracts. Theory: ALDH assiststhe cornea in protecting the eye against ultraviolet radiation-induced tissue damage [72].
WSB/Ei—wild strain very rarely used.SM/J—non-diabetic [73], small inbred strain. ‘In the mouse the naturally occurring inbred strain SM/J presents with a
number of phenotypic abnormalities that have been attributed to reduced neuraminidase activity. SM/J mice were orig-inally characterized by their altered sialylation of several lysosomal glycoproteins. This defect was linked to a single gene,neu-1, on chromosome 17, which was mapped by linkage analysis to the H-2 locus. In addition, these mice have analtered immune response that has also been coupled to a deficiency of the Neu-1 neuraminidase. Here, we report theidentification in SM/J mice of a single amino acid substitution (L209I) in the Neu-1 protein that is responsible forthe partial deficiency of lysosomal neuraminidase.’ [74]. Also, ‘Compared with other inbred strains, SM/J mice haveboth abnormally high responses to B cell mitogens and hyper NK cell and K cell activity.’ [75].
RIIIS/J—inbred strain—‘highly susceptible to collagen-induced arthritis’ [76] and ‘produce low antibody responses toseveral polysaccharide Ag of bacterial origin.’ [77].
SJL/J—inbred strain—not much information, no abnormal phenotype described.Molc/Rk—inbred strain—a light bellied-agouti.PL/J—inbred strain with susceptibility to skin disease—‘Psoriasis is a frequently occurring inflammatory skin disease
characterized by thickened erythematous skin that is covered with silvery scales. It is a complex genetic disease with bothheritable and environmental factors contributing to onset and severity. The CD18 hypomorphic PL/J mouse revealsreduced expression of the common chain of b2 integrins (CD11/CD18) and spontaneously develops a skindisease that closely resembles human psoriasis. In contrast, CD18 hypomorphic C57BL/6J mice do not demonstratethis phenotype.’ [78].
Thr/ft—wild-derived inbred strain—no abnormal phenotype was described.
2116 B. L. Finlay et al. Review. Individual variability in brains
on July 29, 2011rstb.royalsocietypublishing.orgDownloaded from
case, single individual examples of 11 different strainswere chosen (ranging from 0.30 to 0.53 g, ratio 1.8),using the neuroanatomic delineations identical tothose described in Reep et al. [35]. These individualswere examined for the same principal componentstructure examined previously, considering as covari-ates species, sex and domestication, as described inReep et al. [35] and Finlay & Darlington [36] (brainmeasurements, table 1).
4. PRINCIPAL COMPONENT STRUCTURE ANDALLOMETRIC SCALING IN INDIVIDUAL BRAINVARIABILITY(a) First principal component
The factor loadings for phylogenetic variability alreadydescribed are shown in figure 1a, and for individualvariability in figure 1b. In each case, the per centfactor loading on each brain structure within thetotal variance of each component is plotted. The firstprincipal component (PC1; black bars) accounts formuch more variance (phylogenetic variability, 96%;individual variability, 72%) than the second com-ponent (white bars; 3 and 8%, respectively). Theprincipal component analysis is also broken down byindividual species in figure 1c–e. Although thenumber of individuals is too small for statistical com-parison between species, these graphs are included sothat the relationship of individual species’ data tomassed data can be examined. Comparing the
Phil. Trans. R. Soc. B (2011)
individual analysis with the phylogenetic analysis, thePC1 loads on a similar range of brain parts. Thoughthe total amount of variance explained is less than inthe phylogenetic analysis, 72.48 per cent is remarkableconsidering the 20 000-fold range in the absolute brainsizes of the phylogenetic dataset versus the approxi-mately twofold range of within-species variability.The similarity of the structure of the variance is themore striking in that this dataset includes the peculiareffects of directed selection for different aspects ofdomestication, and various indeterminate effects oflaboratory rearing on the mouse strains, and not‘natural’ selection.
(b) Second and third components
The second principal component of variation(figure 1; white bars) loads most strongly on the olfac-tory bulb in both cross-species and individual cases.This component contributes more highly to total var-iance in the individual than in the phylogeneticcomparison, 7.9 per cent versus 3 per cent, explaining86 per cent of the residual variance not accounted forby the first factor. In each of the individual species,(i.e. pig, mink and mouse), the second principal com-ponent loads most highly on olfactory bulb thoughloading on other brain subcomponents varies widely.
We further examined the relationship of body size tobrain components, because a relationship of bodymass to medulla and mesencephalon, partialing outbrain size, has been noted previously. Because

Tab
le1.
Volu
mes
of
bra
inst
ruct
ure
sfo
rel
even
mou
sest
rain
s.D
efin
itio
ns
of
the
incl
usi
on
sof
each
stru
ctu
re,
wh
ich
toget
her
com
pri
seth
een
tire
bra
in,
can
be
fou
nd
inR
eep
etal.
[35].
mou
sest
rain
s
CA
ST
/Ei
CA
SA
/RK
Molf
/Ei
SW
R/J
WS
B/E
iT
hr/
ftS
M/J
RII
IS/J
CA
ST
/Ei
433a
SJL
/JM
OL
C/R
kP
L/J
stru
ctu
revo
lum
e(m
m3)
mes
32.2
328.1
925.3
832.8
834.5
148.8
41.5
39.0
647.2
34.6
38.6
35.9
di
34.7
532.5
825.2
429.5
146.4
550.0
747.2
842.6
134.2
28.5
32
37.5
cer
51.8
754.1
945.4
749.6
961.0
680.8
667.1
77.6
953.1
54.9
59.7
58.8
med
41.8
43.2
436.0
943.9
139.5
455.7
47.8
55.8
833.1
35.6
442.5
45.3
tel
208.4
69
218.9
8163.4
8230.2
9251.2
18
295.5
7253.5
255.1
235.1
224.2
1218.8
230.5
sept
4.2
83.7
62.5
33.8
98.6
28
6.4
6.4
6.7
5.9
4.8
54.9
4.4
schiz
6.0
48.1
56.9
98.0
89.6
711.9
11.4
811.5
7.2
6.4
6.8
stri
at23.4
224.1
220.9
28.3
429.4
40.4
28.3
32.6
25.1
27.3
21.9
27.9
obu
lb20.1
417.8
616.1
20.3
414.0
932.8
27.6
23.4
23.7
22.3
625.9
18.5
hip
po
25.4
321.3
14.7
20.8
331.1
430.9
26.1
26.8
33.2
21.2
26.8
20.8
neo
88.3
7103.6
977.7
8103.3
114.8
6122.1
104.8
110.3
93.5
97.7
95.8
111.9
pala
eo40.7
89
40.1
24.4
845.5
143.4
351.0
748.9
47.3
42.2
43.6
37.1
40.2
Review. Individual variability in brains B. L. Finlay et al. 2117
Phil. Trans. R. Soc. B (2011)
on July 29, 2011rstb.royalsocietypublishing.orgDownloaded from
individual body weight was not available for the mice,a regression analysis controlling for the effects ofspecies, sex and domestication was done on theremaining animals. Body weight correlated highestwith medulla (r ¼ 0.198) and second highest withmesencephalon (r ¼ 0.1143). Since the correlationcoefficient for medulla is 74 per cent higher thaneven the second highest value for the mesencephalon,we can be reasonably confident that individual varia-bility also echoes cross-species variability, in bothcases, a small effect.
(c) Mice follow the pattern, but some mouse
strains are outliers
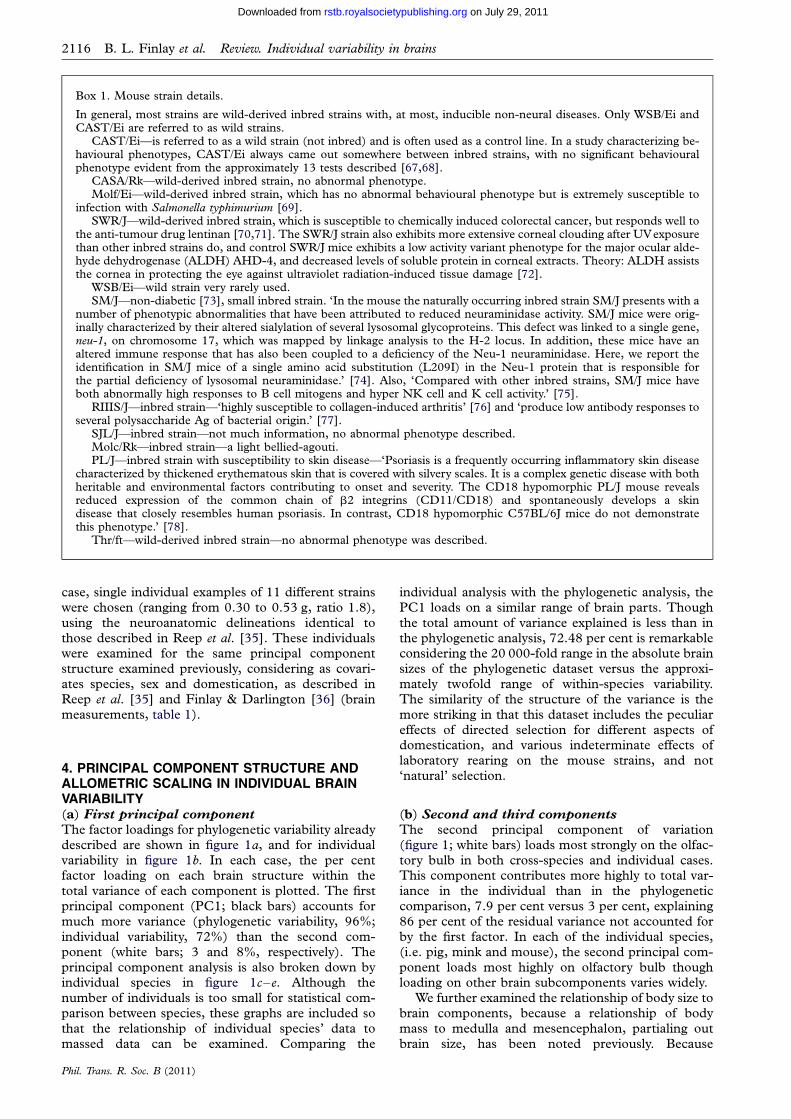
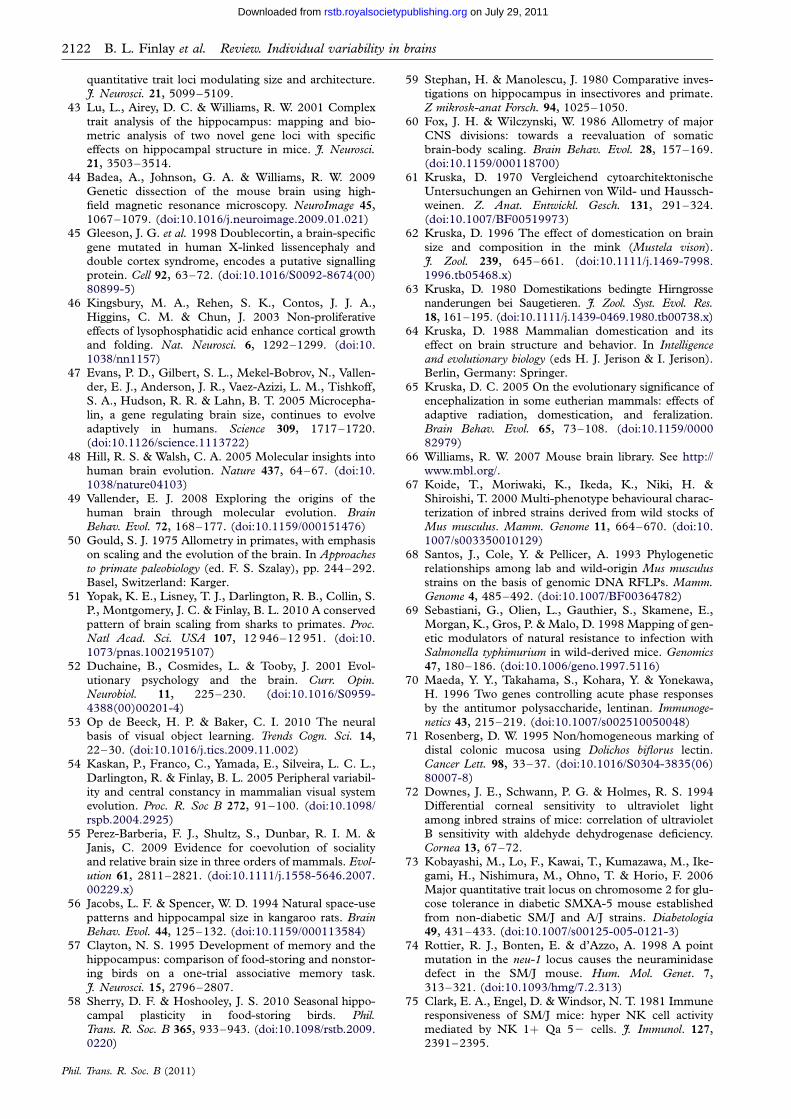
An interesting feature to the pattern of variability forthe first and second principal components is plottedin figure 2. For each individual pig, mink andmouse, a point is plotted for their value of PC1 andPC2. Of the four individual animals lying outside the90 per cent confidence circle, three are commonlyused strains of laboratory mice. Two are aberrant onPC1, one loading abnormally high (WSB/ei) and oneabnormally low (MOLF/ei). This means that forWSB/ei, the major brain parts associated with thePC1 (cortex, cerebellum and so forth) are unusuallyinvariant with respect to each other (two standarddeviations from the mean), while MOLF/ei is unu-sually variable. The third mouse strain, abnormallyhigh on PC2[MOLC/ei], has large and highly corre-lated limbic system components, five deviations fromthe mean. What feature of the ‘ordinary’ domesticationof minks and pigs retains the factorial structure inbrain variation resembling phylogenetic variability,which appears to be lost in part in the form of selectionexerted on individual mouse strains, is not clear. Thisobservation suggests that unusual variation in brainorganization should be considered as a factor in theresearch use of these strains.
A recent magnetic resonance imaging study ofrecombinant inbred individuals of two strains of micefor the purposes of identifying genetic influences onbrain volumes and neuron numbers used differentsubdivisions of brain from those employed here, butretrieves a generally similar structure, though therange in brain sizes is reduced still further [44]. ThePC1 in both strains loads highest on cortex, andthe third highest on olfactory bulb; the second princi-pal component loads highest on midbrain andmedulla, reversing the order of the second and thirdcomponents we observed. Earlier work of this samegroup [41] strongly linked overall control of brainneuron number to gene regions related to transcriptionfactors and to overall somatic growth, consistent withthe idea of the PC1 of the brain region related to dur-ation or rate of development linking the proliferationof all brain regions. Another study of control ofneuron number and size of the olfactory bulb notedthat the bulb size (unlike the brain) was highly vari-able, was related to sex and experience, and alsochanged in volume late in maturation [79]. Fourdifferent genetic loci from the one controlling wholebrain size were related to olfactory bulb variation.
0.6
0.5
0.4
0.3
0.2
0.1
0
ratio
of
wild
/dom
estic
cor
tex
volu
mes
, ln
0.50.40.30.20.10
ratio of wild/domestic brain volumes, ln
guanaco/alpaca and llama
wild/domestic ferret
gerbil
wild/domestic mink
wild/lab rat wild/domestic sheep
boar/pig
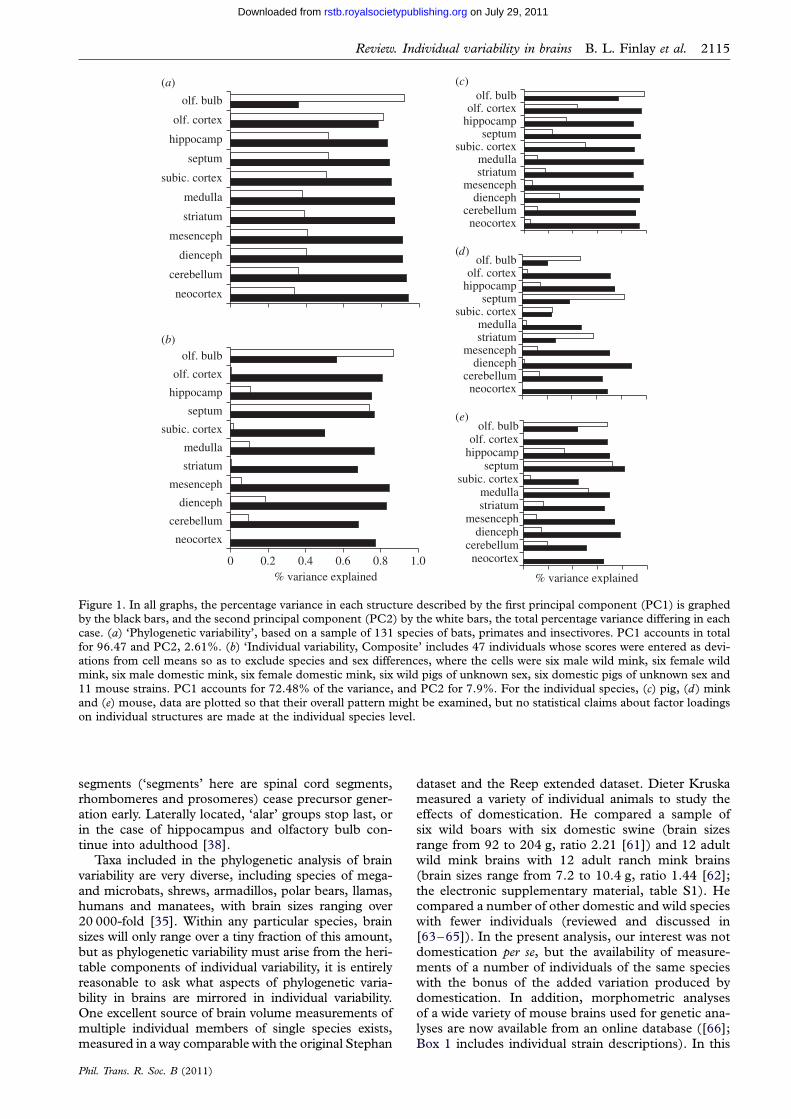
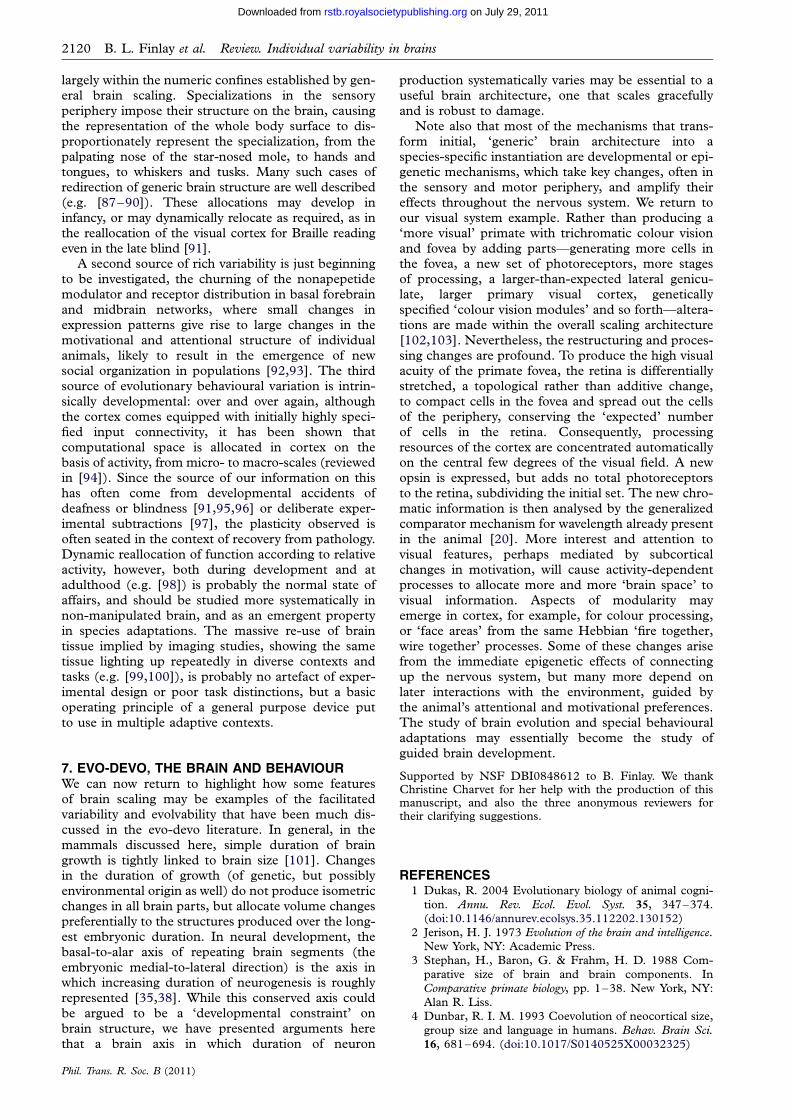
Figure 3. Comparison of the ratio of cortex to total brainvolume in seven wild/domestic comparisons gathered byKruska, compared with equal proportionality (dashed line)
or to cortex hyperallometry determined phylogenetically(solid line). In five of the seven comparisons, cortexvolume is reduced more than overall brain volume.
–3
–1
1
3
–2 0 2principal component 1
prin
cipa
l com
pone
nt 2
Figure 2. Values of PC1 and PC2, expressed as a z-score foreach individual animal for the population of 47 individuals.Three of the mice and one pig fall outside the 90% delimiter(dashed line); these mouse strains are WSB/ei, MOLC/ei
and MOLf/ei. Mouse strains may be intrinsically more vari-able because of greater genetic difference than the minks andpigs, whose lineages are unknown, but whatever the cause,their deviation from the phylogenetic and the other individ-
uals is pronounced. Diamonds, minks; open circles, pigs;filled circles, mice.
2118 B. L. Finlay et al. Review. Individual variability in brains
on July 29, 2011rstb.royalsocietypublishing.orgDownloaded from
(d) Cortex hyperallometry
Finally, the hyperallometry of the cortex can be exam-ined in this dataset by comparison of the variousdomesticated and wild animals studied by Kruska[62,64,65]. We confirm his observations of the relativegreater reduction of the cortex compared with wholebrain volume. We are able to further describe the rela-tive reduction in cortex size of the domesticatedspecies compared with our cross-species database(figure 3). In general, the effect of domestication is adecrease in relative brain size to body size or encepha-lization, ranging from a 26 per cent reduction from thewild guanaco to the domesticated alpaca or llama toequality between the wild and domesticated minks;no pair has the reverse relationship. The solid lineplotted in figure 3 is the regression line of slope of1.3 previously computed for the phylogenetic relation-ship of neocortex volume to the total brain volume[35], not the regression line for these data. For visualcomparison, the dashed line plots the slope of 1.0,the line that would be observed if the cortex decreasedisometrically with the total brain volume. Five of theseven comparisons fall on or above equal proportional-ity. So, as domesticated species decrease in relativebrain volume, they decrease disproportionately in neo-cortex volume, in accord with the phylogeneticpattern.
(e) Species differences and ‘principal component 2’
Both across and within mammalian taxa, the volumeof the neocortex (the structure loading highest onPC1) versus the volume of PC2 ‘limbic’ structures
Phil. Trans. R. Soc. B (2011)
(olfactory bulb and cortex, hippocampus, amygdalaand septum), both compared with the rest of thebrain, are negatively correlated [35]. Various multi-variate analyses of the initial Stephan dataset (e.g.[5,36,50] and others) capture this same contrast.The negative correlation of the volume of limbic struc-tures and the cortex contributes to a large numberof studies showing mosaic, part-by-part, or system-by-system covariation (e.g. [80,81]). The olfactorybulb and hippocampus have the further unusual fea-ture of continued neurogenesis into adulthood inmammals, which is one clear substrate for their link-age to sex and experiential factors [79]. In the verylarge number of studies linking hippocampus size toniche and foraging strategy, in mammals and inbirds, across and within species, the whole brain orsome adjacent structure is typically used for calibrationof hippocampus volume, so it is unclear if the hippo-campus varies independently from the rest of ‘PC2’in all cases [56,57]; see reviews in [58,82,83]. Of thevarious contrasts that have been made in the studiesof hippocampus, avian versus mammalian, foragingrange and the presence of hording, seasonality offoraging and gender, it would be interesting to seeif some contrasts claim the entire set of ‘principalcomponent 2’ structures, and if some are specific tothe hippocampus. In any case, the two dominant com-ponents of mammalian brain variation, which we haverecently shown also characterize chondrichthyans(sharks and rays; [51]), are an enduring ‘hot spot’for species-typical variation.
5. A COMPUTATIONAL CONTEXT FOR BRAINVARIATIONThe close resemblance of phylogenetic variation toindividual variation was quite surprising, given theorders of magnitude differentiating the variation ofphylogenetic and individual samples. Reiterating, we
Review. Individual variability in brains B. L. Finlay et al. 2119
on July 29, 2011rstb.royalsocietypublishing.orgDownloaded from
find consistent covariation in the relative size of brainparts with respect to each other. We find the same dis-sociation, the independent variation of olfactory bulbwith respect to the rest of the brain. Finally, we findthe predicted disproportionate reduction of the neo-cortex with respect to the total brain volume, inthose domesticated species that have regressed intotal brain volume. The similarity is the more impress-ive in that domestication and laboratory animalmembership should minimally exert ‘atypical’ geneticpressure on the individuals of these species. Indepen-dent of genetics and any kind of selection,domestication itself should have large effects on rear-ing conditions, nutrition and general experience ofindividual animals likely to confound an analysis ofbrain variability, not enhance it. Of course, the seedsof phylogenetic variability must be found in individualvariability, but it is surprising that the pattern of phy-logenetic variability should conform in such detail.The morphological evolution of stickleback species,where individual variation matched species variation,over both short and long phylogenetic differences,closely resembles these results [28].
(a) Brain architectures that scale gracefully
The hyperallometry of cortex (and cerebellum), whichallocates the profits of extended brain production pre-ferentially to multi-functional brain components, maybe useful both at the individual and species level. Wecan take some hints from current computing research,where it is of obvious practical use to develop comput-ing structures in which more elements can be added asnecessary, or where an architecture is desired whichcan lose components and remain at least partiallyfunctional (as in warfare). These scalable computerarchitectures, or ‘subsumption architectures’, allowfor the addition and subtraction of components grace-fully without interference in fundamental operations[84,85]. One basic insight arising from this literatureis that locating new computational circuits directly incommand lines executing central functions impairsprocessing speed and prohibits scaling, but locatingnew computational power as ancillary loops modifyingbasic functions improves speed and enables scaling.Restating, if more computing power is located betweensensory input and motor output, it slows the entiredevice and makes it vulnerable to damage at anypoint. If, however, a ‘model brain’ is producedbeside the basic command lines but able to interceptand modify commands as they are made, a morerobust architecture with more computing power andno loss in speed is the result. This, of course, is agood description of the computational position ofmost of the cortex and cerebellum. Since this compu-tational claim is a property about brain scaling ingeneral, and not taxonomic levels of brain organi-zation, it should thus hold true for variations in braingrowth, adult variations in brain size and specieslevel. To draw an analogy with our original colourvision example, while it might be extremely usefulfor a monkey to rapidly recognize bananas, placing abanana-recognition device in the retina may never becomputationally feasible if the design requirements of
Phil. Trans. R. Soc. B (2011)
the whole brain are considered. Testing this hypothesisabout the ‘evolvability’ of particular types of circuitorganization will eventually require examination ofcircuits known to range in size in diverse vertebrateand invertebrate groups, and comparison of theirproperties.
Considering the partial dissociation of the olfactorybulb and limbic structures, we speculate that the pat-tern of variation at the individual level may be eitheror both the source and product of evolution. Evolutionmust certainly serve as a filter against deleterious vari-ations, but might pass on neutral ones. We speculatethat the independent variation of olfactory bulb fromthe rest of the brain may be not so much selectionfor olfactory variability, but rather selection for tightercoupling of the other sensory systems that must sharethalamic projections and neocortical representations.Modelling an independent enlargement of a singledefined ‘module’ in a neural net consumed dispropor-tionate amounts of the neural resources of the othermodules sharing the same net resources as its excessiveinput–output requirements propagated through thenet [86]. Sequestering the variation of the single mam-malian brain part that can vary its size by generation ofneurons throughout life may aid this computationalrequirement.
6. TWO LARGE CLASSES OF BEHAVIOURALVARIATION?Returning to our initial discussion of brain variabilityand its behavioural correlates, we suggest there aretwo very different kinds of change typical in brainevolution. The first is the general increase in compu-tational power and flexibility afforded by a large brain,which can be measured in the very most general ways:surviving longer by avoiding predation, exploiting newfood sources and learning new strategies to find shelter,attract mates and protect offspring [32]. These classesof behaviour are only incidentally niche- and modalitydependent, and would be ill served by strong modularcommitments. Variation in the relative size of cortexamong humans has a small but significant relationshipto ‘general intelligence’. As yet, no such relationshipbetween brain size and general behavioural capacityhas been shown at the individual level for any otherspecies; the work by Lefebvre et al. [32] comparesspecies, but the relationship should hold for individualsas well. Overall, for general problems, the demands ofgeneral-purpose architectures should predominate,and should be seen both in individual and speciesvariations, the kind we describe here.
On the other hand, species-typical behaviours ofevery possible sort have evolved. On the sensory side,we have everything from variants of colour vision, towhole new sensory systems like electroreception inmammals, to sensorimotor combinations like echolo-cation. On the motor side, we have crawling, flyingand competitive gymnastics. Every variation of socialpreference and aggression exists, generating from indi-vidual preferences lifelong monogamy, cooperativepredation, solitary individuals and herds. The datahere do not bear directly on the mechanisms of thesechanges. However, evolutionary changes must occur
2120 B. L. Finlay et al. Review. Individual variability in brains
on July 29, 2011rstb.royalsocietypublishing.orgDownloaded from
largely within the numeric confines established by gen-eral brain scaling. Specializations in the sensoryperiphery impose their structure on the brain, causingthe representation of the whole body surface to dis-proportionately represent the specialization, from thepalpating nose of the star-nosed mole, to hands andtongues, to whiskers and tusks. Many such cases ofredirection of generic brain structure are well described(e.g. [87–90]). These allocations may develop ininfancy, or may dynamically relocate as required, as inthe reallocation of the visual cortex for Braille readingeven in the late blind [91].
A second source of rich variability is just beginningto be investigated, the churning of the nonapepetidemodulator and receptor distribution in basal forebrainand midbrain networks, where small changes inexpression patterns give rise to large changes in themotivational and attentional structure of individualanimals, likely to result in the emergence of newsocial organization in populations [92,93]. The thirdsource of evolutionary behavioural variation is intrin-sically developmental: over and over again, althoughthe cortex comes equipped with initially highly speci-fied input connectivity, it has been shown thatcomputational space is allocated in cortex on thebasis of activity, from micro- to macro-scales (reviewedin [94]). Since the source of our information on thishas often come from developmental accidents ofdeafness or blindness [91,95,96] or deliberate exper-imental subtractions [97], the plasticity observed isoften seated in the context of recovery from pathology.Dynamic reallocation of function according to relativeactivity, however, both during development and atadulthood (e.g. [98]) is probably the normal state ofaffairs, and should be studied more systematically innon-manipulated brain, and as an emergent propertyin species adaptations. The massive re-use of braintissue implied by imaging studies, showing the sametissue lighting up repeatedly in diverse contexts andtasks (e.g. [99,100]), is probably no artefact of exper-imental design or poor task distinctions, but a basicoperating principle of a general purpose device putto use in multiple adaptive contexts.
7. EVO-DEVO, THE BRAIN AND BEHAVIOURWe can now return to highlight how some featuresof brain scaling may be examples of the facilitatedvariability and evolvability that have been much dis-cussed in the evo-devo literature. In general, in themammals discussed here, simple duration of braingrowth is tightly linked to brain size [101]. Changesin the duration of growth (of genetic, but possiblyenvironmental origin as well) do not produce isometricchanges in all brain parts, but allocate volume changespreferentially to the structures produced over the long-est embryonic duration. In neural development, thebasal-to-alar axis of repeating brain segments (theembryonic medial-to-lateral direction) is the axis inwhich increasing duration of neurogenesis is roughlyrepresented [35,38]. While this conserved axis couldbe argued to be a ‘developmental constraint’ onbrain structure, we have presented arguments herethat a brain axis in which duration of neuron
Phil. Trans. R. Soc. B (2011)
production systematically varies may be essential to auseful brain architecture, one that scales gracefullyand is robust to damage.
Note also that most of the mechanisms that trans-form initial, ‘generic’ brain architecture into aspecies-specific instantiation are developmental or epi-genetic mechanisms, which take key changes, often inthe sensory and motor periphery, and amplify theireffects throughout the nervous system. We return toour visual system example. Rather than producing a‘more visual’ primate with trichromatic colour visionand fovea by adding parts—generating more cells inthe fovea, a new set of photoreceptors, more stagesof processing, a larger-than-expected lateral genicu-late, larger primary visual cortex, geneticallyspecified ‘colour vision modules’ and so forth—altera-tions are made within the overall scaling architecture[102,103]. Nevertheless, the restructuring and proces-sing changes are profound. To produce the high visualacuity of the primate fovea, the retina is differentiallystretched, a topological rather than additive change,to compact cells in the fovea and spread out the cellsof the periphery, conserving the ‘expected’ numberof cells in the retina. Consequently, processingresources of the cortex are concentrated automaticallyon the central few degrees of the visual field. A newopsin is expressed, but adds no total photoreceptorsto the retina, subdividing the initial set. The new chro-matic information is then analysed by the generalizedcomparator mechanism for wavelength already presentin the animal [20]. More interest and attention tovisual features, perhaps mediated by subcorticalchanges in motivation, will cause activity-dependentprocesses to allocate more and more ‘brain space’ tovisual information. Aspects of modularity mayemerge in cortex, for example, for colour processing,or ‘face areas’ from the same Hebbian ‘fire together,wire together’ processes. Some of these changes arisefrom the immediate epigenetic effects of connectingup the nervous system, but many more depend onlater interactions with the environment, guided bythe animal’s attentional and motivational preferences.The study of brain evolution and special behaviouraladaptations may essentially become the study ofguided brain development.
Supported by NSF DBI0848612 to B. Finlay. We thankChristine Charvet for her help with the production of thismanuscript, and also the three anonymous reviewers fortheir clarifying suggestions.
REFERENCES1 Dukas, R. 2004 Evolutionary biology of animal cogni-
tion. Annu. Rev. Ecol. Evol. Syst. 35, 347–374.(doi:10.1146/annurev.ecolsys.35.112202.130152)
2 Jerison, H. J. 1973 Evolution of the brain and intelligence.New York, NY: Academic Press.
3 Stephan, H., Baron, G. & Frahm, H. D. 1988 Com-
parative size of brain and brain components. InComparative primate biology, pp. 1–38. New York, NY:Alan R. Liss.
4 Dunbar, R. I. M. 1993 Coevolution of neocortical size,
group size and language in humans. Behav. Brain Sci.16, 681–694. (doi:10.1017/S0140525X00032325)

Review. Individual variability in brains B. L. Finlay et al. 2121
on July 29, 2011rstb.royalsocietypublishing.orgDownloaded from
5 Barton, R. A. & Harvey, P. H. 2000 Mosaic evolution ofbrain structure in mammals. Nature 405, 1055–1058.(doi:10.1038/35016580)
6 Striedter, G. 2005 Principles of brain evolution.New York, NY: Sinauer.
7 Jacobs, G. H. 1993 The distribution and nature of colourvision among the mammals. Biol. Rev. 68, 413–471.
8 Jacobs, G. H. 2008 Primate color vision: a comparative
perspective. Vis. Neurosci. 25, 619–633. (doi:10.1017/S0952523808080760)
9 Hunt, D. M., Carvalho, L. S., Cowing, J. A. & Davies, W.L. 2009 Evolution and spectral tuning of visual pig-
ments in birds and mammals. Phil. Trans. R. Soc. B364, 2941–2955. (doi:10.1098/rstb.2009.0044)
10 Fernald, R. D. 1997 The evolution of eyes. Brain Behav.Evol. 50, 253–259. (doi:10.1159/000113339)
11 Changizi, M. A., Zhang, Q. & Shimojo, S. 2006 Bare
skin, blood and the evolution of primate colour vision.Biol. Lett. 2, 217–221. (doi:10.1098/rsbl.2006.0440)
12 Persons, M. H., Fleishman, L. J., Frye, M. A. & Stim-phil, M. E. 1999 Sensory response patterns and theevolution of visual signal design in anoline lizards.
J. Comp. Physiol. A 184, 585–607. (doi:10.1007/s003590050358)
13 Osorio, D. & Vorobyev, M. 2008 A review of the evol-ution of animal colour vision and visualcommunication signals. Vis. Res. 48, 2042–2051.
(doi:10.1016/j.visres.2008.06.018)14 Mollon, J. D. 1989 ‘Tho she kneeled at the place they
grew. . .’ The uses and origins of primate color vision.In Principles of sensory coding and processing (ed. S. B.
Laughlin), pp. 21–38. Cambridge, UK: The Companyof Biologists, Ltd.
15 Dominy, N. J. & Lucas, P. W. 2001 Ecological impor-tance of trichromatic vision to primates. Nature 410,363–366. (doi:10.1038/35066567)
16 Kingdom, F. A. A. 2003 Color brings relief to humanvision. Nat. Neurosci. 6, 641–644. (doi:10.1038/nn1060)
17 Hansen, T. & Gegenfurtner, K. R. 2009 Independenceof color and luminance edges in natural scenes. Vis.Neurosci. 26, 35–49. (doi:10.1017/S0952523808080796)
18 Caine, N. G. & Mundy, N. I. 2000 Demonstration of aforaging advantage for trichromatic marmosets (Calli-thrix geoffroyi) dependent on food colour. Proc. R. Soc.Lond. B 267, 439–444. (doi:10.1098/rspb.2000.1019)
19 Jacobs, G. H., Williams, G. A., Cahill, H. & Nathans, J.2007 Emergence of novel color vision in mice engin-eered to express a human cone photopigment. Science315, 1723–1725. (doi:10.1126/science.1138838)
20 Mancuso, K., Hauswirth, W. W., Li, Q., Connor, T. B.,Kuchenbecker, J. A., Mauck, M. C., Neitz, J. & Neitz,M. 2009 Gene therapy for red-green colour blindnessin adult primates. Nature 461, 784–787. (doi:10.1038/
nature08401)21 Gerhart, J. & Kirschner, M. 1997 Cells, embryos and
evolution. Malden, MA: Blackwell Science.22 Jablonka, E. & Lamb, M. 2005 Evolution in four dimen-
sions. Cambridge, MA: MIT Press.
23 Kirschner, M. W. & Gerhart, J. C. 2005 The plausibilityof life: resolving Darwin’s dilemma. New Haven, CT: YaleUniversity Press.
24 Wagner, A. D. 2005 Robustness and evolvability in livingsystems. Princeton, NJ: Princeton University Press.
25 Westoby, N., Falster, D. S., Moles, A. T., Vesk, P. A. &Wright, I. J. 2002 Plant ecological strategies: some lead-ing dimensions of variation between species. Annu. Rev.Ecol. Evol. Syst. 33, 125–129. (doi:10.1146/annurev.ecolsys.33.010802.150452)
Phil. Trans. R. Soc. B (2011)
26 Shapiro, M. D., Marks, M. E., Peichel, C. L., Black-man, B. K., Nereng, K. S., Junsson, B., Schluter, D.& Kingsley, D. M. 2004 Genetic and developmental
basis of evolutionary pelvic reduction in threespinesticklebacks. Nature 428, 717–723. (doi:10.1038/nature02415)
27 Schluter, D. 1984 Morphological and phylogeneticrelations among the Darwin’s finches. Evolution 38,
921–930. (doi:10.2307/2408428)28 Schluter, D. 1996 Adaptive radiation along the lines
of least resistance. Evolution 50, 1766–1774. (doi:10.2307/2410734)
29 Mundy, N. I., Badcock, N. S., Hart, T., Scribner, K.,Janssen, K. & Nadeau, N. J. 2004 Conserved geneticbasis of a quantitative plumage trait involved in matechoice. Science 303, 1870–1873. (doi:10.1126/science.1093834)
30 Allender, C. J., Seehausen, O., Knight, M. E. & Turner,G. F. 2003 Divergent selection during speciation ofLake Malawi cichlids inferred from parallel radiationsin nuptial coloration. Proc. Natl Acad. Sci. USA 24,14 074–14 079.
31 Steiner, C. C., Rompler, H., Boettger, L. M.,Schoneberg, T. & Hoekstra, H. E. 2009 The geneticbasis of phenotypic convergence in beach mice: similarpigment patterns but different genes. Mol. Biol. Evol.26, 35–45. (doi:10.1093/molbev/msn218)
32 Lefebvre, L., Reader, S. M. & Sol, D. 2004 Brains,innovations and evolution in birds and primates. BrainBehav. Evol. 63, 233–246. (doi:10.1159/000076784)
33 tramo, M. J., Loftus, W. C., Stukel, T. A., Green, R. L.,
Weaver, J. B. & Gazzaniga, M. S. 1998 Brain size, headsize, and intelligence quotient in monozygotic twins.Neurology 50, 1246–1252.
34 Shaw, P., Greenstein, D., Lerch, J., Clasen, L., Lenroot,R., Gogtay, N., Evans, A., Rapoport, J. & Giedd, J.
2006 Intellectual ability and cortical development inchildren and adolescents. Nature 440, 676–679.(doi:10.1038/nature04513)
35 Reep, R., Darlington, R. B. & Finlay, B. L. 2007 Thelimbic system in mammalian brain evolution. BrainBehav. Evol. 70, 57–70. (doi:10.1159/000101491)
36 Finlay, B. L. & Darlington, R. B. 1995 Linked regu-larities in the development and evolution ofmammalian brains. Science 268, 1578–1584. (doi:10.1126/science.7777856)
37 Finlay, B. L., Darlington, R. B. & Nicastro, N. 2001Developmental structure in brain evolution. Behav.Brain Sci. 24, 263–307.
38 Finlay, B. L., Hersman, M. N. & Darlington, R. B.
1998 Patterns of vertebrate neurogenesis and thepaths of vertebrate evolution. Brain Behav. Evol. 52,232–242. (doi:10.1159/000006566)
39 Finlay, B. L., Silveira, L. C. L. & Reichenbach, A. 2005Comparative aspects of visual system development. In
The structure, function and evolution of the primate visualsystem (ed. J. Kremers), pp. 37–72. New York, NY:John Wiley and Sons.
40 Dyer, M. A., Martins, R., da Silva Filho, M., Muniz,J. A., Silveira, L. C. L., Cepko, C. & Finlay, B. L.
2009 Developmental sources of conservation and vari-ation in the evolution of the primate eye. Proc. NatlAcad. Sci. USA 106, 8963–8968. (doi:10.1073/pnas.0901484106)
41 Williams, R. W., Strom, R. C. & Goldowitz, D. 1998
Natural variation in neuron number in mice is linkedto a major quantitative trait locus on Chr 11.J. Neurosci. 18, 138–146.
42 Airey, D. C., Lu, L. & Williams, R. W. 2001 Geneticcontrol of the mouse cerebellum: identification of
2122 B. L. Finlay et al. Review. Individual variability in brains
on July 29, 2011rstb.royalsocietypublishing.orgDownloaded from
quantitative trait loci modulating size and architecture.J. Neurosci. 21, 5099–5109.
43 Lu, L., Airey, D. C. & Williams, R. W. 2001 Complex
trait analysis of the hippocampus: mapping and bio-metric analysis of two novel gene loci with specificeffects on hippocampal structure in mice. J. Neurosci.21, 3503–3514.
44 Badea, A., Johnson, G. A. & Williams, R. W. 2009
Genetic dissection of the mouse brain using high-field magnetic resonance microscopy. NeuroImage 45,1067–1079. (doi:10.1016/j.neuroimage.2009.01.021)
45 Gleeson, J. G. et al. 1998 Doublecortin, a brain-specific
gene mutated in human X-linked lissencephaly anddouble cortex syndrome, encodes a putative signallingprotein. Cell 92, 63–72. (doi:10.1016/S0092-8674(00)80899-5)
46 Kingsbury, M. A., Rehen, S. K., Contos, J. J. A.,
Higgins, C. M. & Chun, J. 2003 Non-proliferativeeffects of lysophosphatidic acid enhance cortical growthand folding. Nat. Neurosci. 6, 1292–1299. (doi:10.1038/nn1157)
47 Evans, P. D., Gilbert, S. L., Mekel-Bobrov, N., Vallen-
der, E. J., Anderson, J. R., Vaez-Azizi, L. M., Tishkoff,S. A., Hudson, R. R. & Lahn, B. T. 2005 Microcepha-lin, a gene regulating brain size, continues to evolveadaptively in humans. Science 309, 1717–1720.(doi:10.1126/science.1113722)
48 Hill, R. S. & Walsh, C. A. 2005 Molecular insights intohuman brain evolution. Nature 437, 64–67. (doi:10.1038/nature04103)
49 Vallender, E. J. 2008 Exploring the origins of the
human brain through molecular evolution. BrainBehav. Evol. 72, 168–177. (doi:10.1159/000151476)
50 Gould, S. J. 1975 Allometry in primates, with emphasison scaling and the evolution of the brain. In Approachesto primate paleobiology (ed. F. S. Szalay), pp. 244–292.
Basel, Switzerland: Karger.51 Yopak, K. E., Lisney, T. J., Darlington, R. B., Collin, S.
P., Montgomery, J. C. & Finlay, B. L. 2010 A conservedpattern of brain scaling from sharks to primates. Proc.Natl Acad. Sci. USA 107, 12 946–12 951. (doi:10.
1073/pnas.1002195107)52 Duchaine, B., Cosmides, L. & Tooby, J. 2001 Evol-
utionary psychology and the brain. Curr. Opin.Neurobiol. 11, 225–230. (doi:10.1016/S0959-4388(00)00201-4)
53 Op de Beeck, H. P. & Baker, C. I. 2010 The neuralbasis of visual object learning. Trends Cogn. Sci. 14,22–30. (doi:10.1016/j.tics.2009.11.002)
54 Kaskan, P., Franco, C., Yamada, E., Silveira, L. C. L.,
Darlington, R. & Finlay, B. L. 2005 Peripheral variabil-ity and central constancy in mammalian visual systemevolution. Proc. R. Soc B 272, 91–100. (doi:10.1098/rspb.2004.2925)
55 Perez-Barberia, F. J., Shultz, S., Dunbar, R. I. M. &
Janis, C. 2009 Evidence for coevolution of socialityand relative brain size in three orders of mammals. Evol-ution 61, 2811–2821. (doi:10.1111/j.1558-5646.2007.00229.x)
56 Jacobs, L. F. & Spencer, W. D. 1994 Natural space-use
patterns and hippocampal size in kangaroo rats. BrainBehav. Evol. 44, 125–132. (doi:10.1159/000113584)
57 Clayton, N. S. 1995 Development of memory and thehippocampus: comparison of food-storing and nonstor-ing birds on a one-trial associative memory task.
J. Neurosci. 15, 2796–2807.58 Sherry, D. F. & Hoshooley, J. S. 2010 Seasonal hippo-
campal plasticity in food-storing birds. Phil.Trans. R. Soc. B 365, 933–943. (doi:10.1098/rstb.2009.0220)
Phil. Trans. R. Soc. B (2011)
59 Stephan, H. & Manolescu, J. 1980 Comparative inves-tigations on hippocampus in insectivores and primate.Z mikrosk-anat Forsch. 94, 1025–1050.
60 Fox, J. H. & Wilczynski, W. 1986 Allometry of majorCNS divisions: towards a reevaluation of somaticbrain-body scaling. Brain Behav. Evol. 28, 157–169.(doi:10.1159/000118700)
61 Kruska, D. 1970 Vergleichend cytoarchitektonische
Untersuchungen an Gehirnen von Wild- und Haussch-weinen. Z. Anat. Entwickl. Gesch. 131, 291–324.(doi:10.1007/BF00519973)
62 Kruska, D. 1996 The effect of domestication on brain
size and composition in the mink (Mustela vison).J. Zool. 239, 645–661. (doi:10.1111/j.1469-7998.1996.tb05468.x)
63 Kruska, D. 1980 Domestikations bedingte Hirngrossenanderungen bei Saugetieren. J. Zool. Syst. Evol. Res.18, 161–195. (doi:10.1111/j.1439-0469.1980.tb00738.x)
64 Kruska, D. 1988 Mammalian domestication and itseffect on brain structure and behavior. In Intelligenceand evolutionary biology (eds H. J. Jerison & I. Jerison).Berlin, Germany: Springer.
65 Kruska, D. C. 2005 On the evolutionary significance ofencephalization in some eutherian mammals: effects ofadaptive radiation, domestication, and feralization.Brain Behav. Evol. 65, 73–108. (doi:10.1159/000082979)
66 Williams, R. W. 2007 Mouse brain library. See http://www.mbl.org/.
67 Koide, T., Moriwaki, K., Ikeda, K., Niki, H. &Shiroishi, T. 2000 Multi-phenotype behavioural charac-
terization of inbred strains derived from wild stocks ofMus musculus. Mamm. Genome 11, 664–670. (doi:10.1007/s003350010129)
68 Santos, J., Cole, Y. & Pellicer, A. 1993 Phylogeneticrelationships among lab and wild-origin Mus musculusstrains on the basis of genomic DNA RFLPs. Mamm.Genome 4, 485–492. (doi:10.1007/BF00364782)
69 Sebastiani, G., Olien, L., Gauthier, S., Skamene, E.,Morgan, K., Gros, P. & Malo, D. 1998 Mapping of gen-etic modulators of natural resistance to infection with
Salmonella typhimurium in wild-derived mice. Genomics47, 180–186. (doi:10.1006/geno.1997.5116)
70 Maeda, Y. Y., Takahama, S., Kohara, Y. & Yonekawa,H. 1996 Two genes controlling acute phase responsesby the antitumor polysaccharide, lentinan. Immunoge-netics 43, 215–219. (doi:10.1007/s002510050048)
71 Rosenberg, D. W. 1995 Non/homogeneous marking ofdistal colonic mucosa using Dolichos biflorus lectin.Cancer Lett. 98, 33–37. (doi:10.1016/S0304-3835(06)
80007-8)72 Downes, J. E., Schwann, P. G. & Holmes, R. S. 1994
Differential corneal sensitivity to ultraviolet lightamong inbred strains of mice: correlation of ultravioletB sensitivity with aldehyde dehydrogenase deficiency.
Cornea 13, 67–72.73 Kobayashi, M., Lo, F., Kawai, T., Kumazawa, M., Ike-
gami, H., Nishimura, M., Ohno, T. & Horio, F. 2006Major quantitative trait locus on chromosome 2 for glu-cose tolerance in diabetic SMXA-5 mouse established
from non-diabetic SM/J and A/J strains. Diabetologia49, 431–433. (doi:10.1007/s00125-005-0121-3)
74 Rottier, R. J., Bonten, E. & d’Azzo, A. 1998 A pointmutation in the neu-1 locus causes the neuraminidasedefect in the SM/J mouse. Hum. Mol. Genet. 7,
313–321. (doi:10.1093/hmg/7.2.313)75 Clark, E. A., Engel, D. & Windsor, N. T. 1981 Immune
responsiveness of SM/J mice: hyper NK cell activitymediated by NK 1þ Qa 52 cells. J. Immunol. 127,2391–2395.
Review. Individual variability in brains B. L. Finlay et al. 2123
on July 29, 2011rstb.royalsocietypublishing.orgDownloaded from
76 Nandakumar, K. S. & Holmdahl, R. 2005 A geneticcontamination in the MHC-congenic mouse strainsreveals a locus on the chromosome 10 that determines
autoimmunity and arthritis susceptibility.Eur. J. Immunol. 35, 1275–1282. (doi:10.1002/eji.200425925)
77 Hiernaux, J. R., Goidl, E. A., McEvoy, S. J., Stashak, P.W., Baker, P. J. & Holmes, K. L.1989 Characterization
of the immunodeficiency of RIIIS/J mice. I. Associationwith the CD5 (LY-1) B cell lineage. J. Immunol. 142,1813–1817.
78 Kess, D. et al. 2006 Identification of susceptibility loci
for skin disease in a murine psoriasis model.J. Immunol. 177, 4612–4619.
79 Williams, R., Airey, D., Kulkarni, A., Zhou, G. & Lu, L.2001 Genetic dissection of the olfactory bulbs of mice:QTLs on four chromosomes modulate bulb size.
Behav. Genet. 31, 61–77. (doi:10.1023/A:1010209925783)
80 Barton, R. A. 1998 Visual specialization and brain evol-ution in primates. Proc. R. Soc. Lond. B 265, 1933–1937. (doi:10.1098/rspb.1998.0523)
81 Barton, R. A., Aggleton, J. P. & Grenyer, R. 2003 Evol-utionary coherence of the mammalian amygdala.Proc. R. Soc. Lond. B 270, 539–543. (doi:10.1098/rspb.2002.2276)
82 Brodin, A. 2010 The history of scatter hoarding studies.
Phil. Trans. R. Soc. B 365, 869–881. (doi:10.1098/rstb.2009.0217)
83 Roth, T. C., Brodin, A., Smulders, T. V., LaDage, L. D. &Pravosudov, V. V. 2010 Is bigger always better? A critical
appraisal of the use of volumetric analysis in the study ofthe hippocampus. Phil. Trans. R. Soc. B 365, 915–931.(doi:10.1098/rstb.2009.0208)
84 Brooks, R. 1986 A robust layered control system for amobile robot. IEEE J. Robot. Autom. 2, 14–23.
(doi:10.1109/JRA.1986.1087032)85 Hawes, N., Sloman, A., Wyatt, J., Zillich, M., Jacobs-
son, A., Kruijff, G., Brenner, M., Berginc, G. &Skocaj, D. 2007 Towards an integrated robot with mul-tiple cognitive functions. Proc. Assoc. Adv. ArtificalIntell. 7, 1–6.
86 Finlay, B. L. & Brodsky, P. B. 2006 Cortical evolutionas the expression of a program for disproportionategrowth and the proliferation of areas. In Evolution of ner-vous systems (eds J. H. Kaas & L. A. Krubitzer), pp. 73–
96. Oxford, UK: Academic Press.87 Suga, N., Kuzirai, K. & O’Neill, W. E. 1981 How bio-
sonar information is represented in the bat cerebralcortex. In Neuronal mechanisms of hearing (eds J. Syka
& L. Aitken). New York, NY: Plenum Press.88 Van der Loos, H. & Welker, E. 1985 Development
and plasticity of somatosensory brain maps. In Develop-ment, organization, and processing in somatosensorypathways; neurology and neurobiology (eds M. Rowe Jr,
& W. D. Willis Jr), pp. 53–67. New York, NY: AlanR. Liss.
Phil. Trans. R. Soc. B (2011)
89 Silveira, L. C. L., Pincanco-Diniz, C. W., Sampaio,L. F. S. & Oswaldo-Cruz, E. 1989 Retinal ganglioncell distribution in the Cebus monkey: a comparison
with the cortical magnification factors. Vis. Res. 29,1471–1483. (doi:10.1016/0042-6989(89)90131-4)
90 Catania, K. C. 2002 Barrels, stripes and fingerprintsin the brain: implications for theories of corticalorganization. J. Neurocytol. 31, 347–358. (doi:10.
1023/A:1024186329012)91 Burton, H. 2003 Visual cortex activity in early and late
blind people. J. Neurosci. 23, 4005–4011.92 Insel, T. R. & Young, L. J. 2000 Neuropeptides and the
evolution of social behavior. Curr. Opin. Neurobiol. 10,784–789. (doi:10.1016/S0959-4388(00)00146-X)
93 Goodson, J. L., Evans, A. K., Lindberg, L. & Allen,C. D. 2005 Neuro-evolutionary patterning of sociality.Proc. R. Soc. B 272, 227–235. (doi:10.1098/rspb.
2004.2892)94 Kingsbury, M. A. & Finlay, B. L. 2001 The cortex in
multidimensional space: where do cortical areas comefrom? Dev. Sci. 4, 125–156. (doi:10.1111/1467-7687.00158)
95 Sadato, N., Pascualleone, A., Grafman, J., Ibanez, V.,Deiber, M. P., Dold, G. & Hallett, M. 1996 Activationof the primary visual cortex by Braille reading in blindsubjects. Nature 380, 526–528. (doi:10.1038/380526a0)
96 Bavalier, D., Tomann, A., Hutton, C., Mitchel, T.,
Corina, D., Liu, G. & Neville, H. 2000 Visual attentionin the periphery is enhanced in congenitally deafindividuals. J. Neurosci. 20, 85–93.
97 Pallas, S. L. 2001 Cross-modal plasticity as a tool for
understanding the ontogeny and phylogeny of cerebralcortex. Trends Neurosci. 24, 417–423. (doi:10.1016/S0166-2236(00)01853-1)
98 Gilbert, C. D., Das, A., Ito, M., Kapadia, M. &Westheimer, G. 1996 Spatial integration and cortical
dynamics. Proc. Natl Acad. Sci. USA 93, 615–622.(doi:10.1073/pnas.93.2.615)
99 Duncan, J. & Owen, A. M. 2000 Common regions ofthe human frontal lobe recruited by diverse cognitivedemands. Trends Neurosci. 23, 475–481. (doi:10.1016/
S0166-2236(00)01633-7)100 Anderson, M. L. 2010 Neural reuse as a fundamental
organizational principal of the brain. Behav. Brain Sci.33, 245–266. (doi:10.1017/S0140525X10000853)
101 Passingham, R. E. 1985 Rates of brain development in
mammals including man. Brain Behav. Evol. 26, 167–175. (doi:10.1159/000118773)
102 Finlay, B. L., Franco, E. C., Yamada, E. S., Crowley,J. C., Parsons, M., Muniz, J. A. & Silveira, L. C.
2008 Number and topography of cones, rods andoptic nerve axons in New and Old World primates.Vis. Neurosci. 25, 289–299. (doi:10.1017/S0952523808080371)
103 Finlay, B. L. 2008 The developing and evolving retina:
using time to organize form. Brain Res. 1192, 5–16.(doi:10.1016/j.brainres.2007.07.005)