Yves Bawa and Kay Nimmo - 7th Multi-Stakeholder Forum on Responsible Mineral Supply Chains

Mapping artisanal mining areas and mineral supply chains in eastern DR CongoImpact of armed interference & responsible sourcing
International Peace Information Service vzw
2 3
EDITORIAL
Mapping artisanal mining areas and mineral supply chains in Eastern DR Congo Impact of armed interference & responsible sourcing
Antwerp, April 2019
Cover image: Gold Mine in Kalehe, South Kivu (Photo: IPIS)
Authors: Ken Matthysen (IPIS), Steven Spittaels (IPIS associate researcher), Peer Schouten (DIIS)
Coordinator field research: Zacharie Bulakali Ntakobajira
Map, database and graphs: Manuel Claeys Bouuaert, Stef Verheyen
The International Peace Information Service (IPIS) is an independent research institute providing tailored information, analysis and capacity enhancement to support those actors who want to realize a vision of durable peace, sustainable development and the fulfilment of human rights.
The Danish Institute for International Studies (DIIS) is an independent research institute that pro-vides analysis of international politics. The research is organized around a large number of programs that cover topics ranging from natural resources and the environment, to terrorism and migration.
The 2016-2018 mapping of artisanal mining sites in eastern DRC was funded by the International Or-ganization for Migration- IOM in the DRC through the United States Agency for International Develop-ment-USAID funded Responsible Minerals Trade (RMT) project. Case studies were funded through a Conflict Research Fellowship of the SSRC for the LSE-based Conflict Research Programme.
D/2019/4320/07
2 3
TABLE OF CONTENTS
Editorial ................................................................................................................................................. 2
Key concepts ......................................................................................................................................... 5
List of acronyms .................................................................................................................................... 6
Executive Summary .............................................................................................................................. 7
Armed interference in mining ........................................................................................................................................7
Link between armed conflict and armed interference ..........................................................................................8
Impact of responsible sourcing on armed interference ........................................................................................8
Socio-economic aspects ...................................................................................................................................................8
Challenges for responsible supply chains ..................................................................................................................9
Concluding remarks .........................................................................................................................................................10
1. Introduction and background ...................................................................................................... 12
1.1. Scope and key findings ........................................................................................................................................12
1.2. Background ..............................................................................................................................................................12
1.3. IPIS’ Methodology .................................................................................................................................................13
1.4. Data gathered .........................................................................................................................................................13
2. Armed interference in eastern DR Congo’s artisanal mining sector ......................................... 15
2.1. Armed interference at mining sites .................................................................................................................152.1.1. Armed interference: provincial differences ............................................................................................................................. 15
2.1.2. Armed interference: different actors .........................................................................................................................................18
2.2. Roadblocks: the militarization of supply chains ......................................................................................... 20
3. Comparing armed conflict with armed interference at mining sites ........................................ 24
4. Responsible sourcing: does it mitigate armed interference? .................................................... 28
4.1. Armed interference and responsible sourcing ........................................................................................... 284.1.1. Responsible sourcing over time: decreasing interference ...................................................................................................29
4.1.2. Armed interference: geography matters ................................................................................................................................. 31
5. Socio-economic aspects ............................................................................................................... 32
5.1. Social and economic indicators related to mineral exploitation ......................................................... 325.1.1. Miners’ mobility .............................................................................................................................................................................32
5.1.2. Cooperatives ...................................................................................................................................................................................32
5.1.3. Women .............................................................................................................................................................................................34
5.1.4. Mining site owners and the distribution of revenues ...........................................................................................................34
5.2. Economic indicators related to mineral trade ............................................................................................. 355.2.1. Pricing along the trading chain .................................................................................................................................................36
5.2.2. The impact of traditional customs and local dynamics ......................................................................................................38
5.2.3. The impact of exchange rates ....................................................................................................................................................38
5.2.4. The impact of world market prices............................................................................................................................................39
5.2.5. The impact of distance/enclavement .......................................................................................................................................40
5.2.6. The impact of the quality of the minerals ............................................................................................................................... 41
5.2.7. The impact of monopolies .......................................................................................................................................................... 41
5.2.8. The impact of responsible sourcing ..........................................................................................................................................43

4 5
5.3. State control and formalization of the ASM sector ................................................................................... 445.3.1. Presence of state services .............................................................................................................................................................44
5.3.2. Carte de creuseur ...........................................................................................................................................................................45
5.3.3. Cooperatives ...................................................................................................................................................................................46
5.3.4. Taxation ...........................................................................................................................................................................................46
6. Responsible sourcing challenges ................................................................................................. 50
6.1. Mineral traceability at a distance ..................................................................................................................... 50
6.2. Commercialisation of tags ................................................................................................................................. 50
6.3. Contamination of responsible supply chains ...............................................................................................51
7. Conclusions .................................................................................................................................... 53
7.1. Armed interference .............................................................................................................................................. 53
7.2. Mining and mineral trade .................................................................................................................................. 54
7.3. How sustainable is the situation? .................................................................................................................... 55
4 5
KEY CONCEPTSBelow is a list of some terms that are regularly used throughout the report. These are no official defini-tions, but rather denominations that make it easier to refer to certain types of mines or initiatives.
Armed interference: this term is used to describe all cases where a non-state armed group, an army unit or an armed criminal network make (illegal) profits from mineral exploitation or trade, through their physical presence in mining zones, or through more indirect interferences;
Non-armed interference: this term is used to describe all cases where unarmed officials make (illegal) profits through their presence in mining zones;
Militarisation of mining sites: this term is used to point out that an armed group or army unit controls a mining zones, either through permanent presence or regular visits. Militarisation often, but not always, implies armed interference;
Responsible sourcing (initiatives): Initiatives that have been implemented to address armed interference in mineral supply chains. In this report we focus on iTSCi traceability and the validation of mining sites;
iTSCi mines: Mines that are covered by the iTSCi Programme for Responsible Mineral Supply Chains. The International Tin Association (ITA)’s programme iTSCi monitors mineral supply chains in eastern Dem-ocratic Republic of the Congo (DRC). It implements traceability by providing labels to Congolese state agents, so that they can tag 3T mineral production at the mine site and along the trade route to verify the origin of the minerals further down the chain. Furthermore, it also implements related activities to monitor the supply chains, including incident reporting, risk management, etc. iTSCi has been very suc-cessfully deployed, as it already covers a few hundred mines in eastern DRC
Validated mines: Mines visited periodically by ‘joint validation teams’, which include representatives from the government, state agencies, and international partners working in the natural resources sector. These teams assess the security situation at the site and its surroundings, as well as socio-economic risks such as child labour, depth of pits, presence of pregnant women and environmental issues. They classify sites as red, yellow or green depending on their observations.

6 7
LIST OF ACRONYMS
ANR Agence Nationale de Renseignements
APCLS Alliance des patriotes pour un Congo libre et souverain
ASM Artisanal and Small-Scale Mining
CNRD Conseil national pour le renouveau et la démocratie
DGR-NK Direction Générale des Recettes du Nord Kivu
DRC Democratic Republic of the Congo
FARDC Forces Armées de la République Démocratique du Congo
FC Congolese Francs
FDLR Forces Démocratiques de Libération du Rwanda
FRPI Forces de Résistance Patriotique d’Ituri
ICGLR International Conference on the Great Lakes Region
ITA International Tin Association
iTSCi ITA Tin Supply Chain Initiative
NDC Nduma Defense of Congo
NDC-R Nduma Defense of Congo-Rénové
OECD Organisation for Economic Co-operation and Development
PDG Président Directeur Général (a mine shaft manager or pit boss)
PNC Police Nationale Congolaise
SAEMAPE Service d’Assistance et d’Encadrement des Mines Artisanales et de Petit Echelle
SAKIMA Société Aurifère du Kivu et du Maniema
SMB Société Minière de Bisunzu

6 7
EXECUTIVE SUMMARYFor ten years IPIS has researched, and gathered extensive data on, the linkage between conflict and mineral resources in the eastern Democratic Republic of the Congo (DRC). The current report draws a number of key lessons about this linkage, and about the impact of responsible sourcing efforts that aim to tackle this issue.
IPIS’ unique cumulative dataset includes data on 2,700 mines - employing an estimated 382,000 artisanal miners, 945 roadblocks and 71mineral trading centers.
Armed interference in mining
The report provides detailed figures about the levels of armed interference in the different provinces of eastern DRC. The frequency of armed interference at the visited mining sites was highest in North Kivu, South Kivu and Ituri, where armed interference was reported at at least a third of the visited mines. The relative number of cases of armed interference in the Province of Maniema is significantly lower at 17%, and there was almost no reported armed interference in the former Katanga Province.
In North Kivu, several non-state armed groups still interfere in the mining sector including the Mai Mai Simba, commanded by Mando, the two Nduma Defense of Congo (NDC) factions, and the Nyatura mili-tia. The Forces Démocratiques de Libération du Rwanda (FDLR), on the other hand, lost control over most of its mining areas over the past three years. South Kivu’s artisanal mining sector has been affected by two important armed groups, i.e. Raia Mutomboki - mostly in Shabunda territory, and Mai Mai Yakutum-ba in Fizi. Finally, in Ituri FRPI rebels and Mai Mai rebels commanded by Manu (former Simba rebels of the deceased rebel leader Morgan) continue to interfere in mining.
Overall, however, units of the Congolese army (FARDC) are the main culprits of armed interfer-ence, at 66% of the affected mining sites (198 out of 265) in the 2016-2018 sample. This is perfect-ly illustrated by the Province of Maniema, where armed conflict is very limited, but 38% of the mines is still ‘militarised’ by army units.
IPIS’ data also illustrates that artisanal mining only constitutes one among many sources of financing for conflict actors in eastern DRC, such as roadblocks and the taxation of other kinds of natural resources. The research on roadblocks demonstrates that armed actors do not need to have direct control over mining sites to benefit from the artisanal mining sector. While armed ac-tors, and especially army units, might not be phys-ically present at some mines in militarised mining areas, IPIS notes a consistent pattern whereby the army instead consistently erects roadblocks some distance away from these mining sites. The Con-golese army is present at almost half of the total number of roadblocks that were mapped, and is responsible for nearly half of all the instances in which minerals were taxed. Cassitérite Mine in Kailo, Maniema Province (Photo: IPIS)

8 9
Link between armed conflict and armed interference
Remarkably, IPIS’ data reveals that, currently, armed conflicts are often not related to interference in the artisanal mining sector. Comparing the IPIS data with available conflict event data suggests that the control over mining sites is not a frequent battle objective for several of the most active conflict par-ties. Instead armed interference in artisanal mining often takes shape as illegal ‘protection rackets’, while armed confrontations largely take place elsewhere and for other stakes.
Nevertheless, these illegal ‘protection rackets’ do contribute to the overall insecurity in eastern DRC and reinforce its reputation as a region where it is nearly impossible to conduct ethically responsible busi-ness. In addition, some of the frontlines do appear to be related to the control over mining sites. The NDC-R, for example, has specifically targeted mining areas controlled by rival armed groups.
Impact of responsible sourcing on armed interference
IPIS has been gathering systematic data on the issue of armed interference from before 2010, when the first cautious initiatives on responsible sourcing of minerals were launched. Therefore, IPIS’ data provides the opportunity to assess the impact of responsible sourcing on armed interference, even though it has not been specifically designed to make such an exercise.
‘iTSCi mines’ and ‘green validated mines’ will be compared with non-validated and non-iTSCi mines. This report represents in no way an evaluation of the impact of these initiatives. These initiatives are rather the only ones that have been scaled sufficiently, and managed to include a wide range of mines, in order to make meaningful comparisons. iTSCi and ‘green’ validated mines are considered to be mines that are covered by responsible sourcing efforts
It appears that responsible sourcing initiatives have had a positive impact, reducing the level of interference by armed actors at mining sites.
Mines covered by responsible sourcing programmes experience considerably lower levels of armed in-terference. Yet this does not necessarily mean that responsible sourcing programmes are the cause of se-curity at mining sites. Often, it is precisely the (pre-existing) absence of armed interference that attracts validation and iTSCi involvement in the first place.
Nevertheless, IPIS data also shows that armed interference is decreasing over time in areas with more scrutiny - where responsible sourcing initiatives are being implemented.
Many problems with regards to armed and illegal interference remain, however, despite responsible sourcing.
Notwithstanding the positive evolutions that have been described above, armed interference in artis-anal mining persists. IPIS data shows that responsible sourcing targets accessible sites. Armed interfer-ence in mining seems to continue undisturbed in more remote areas.
Furthermore, some other specific issues continue, including illegal taxation by armed actors at road-blocks, and the interference by Congolese army units. Moreover, non-armed interference by state offi-cials remains an issue, which contributes to the overall levels of insecurity, facilitates illegal trade, and tolerates criminal networks.
Socio-economic aspects
IPIS’ data also enables to obtain a better understanding of the mineral supply chain, including the par-ticipation of different supply chain actors, revenue distribution, price setting and the role of state actors.
So far, increasing regulation of the artisanal mining sector and responsible sourcing efforts, have rather had a negative overall effect on the socio-economic position of artisanal miners.

8 9
The widespread establishment of cooperatives could potentially contribute to social and economic de-velopment. However, generally speaking, cooperatives in the DRC do not reflect the idea of a coop-erative as described under international standards. They have rather become vehicles that exploit miners, and can potentially further fuel already existing tensions.
The report also analyses the complexity of revenue distribution along the mineral supply chains in eastern DRC.
Already at the level of the mine a wide range of production sharing agreements exist between miners and site managers. These agreements define the revenue of several stakeholders at the site, including miners, pit bosses, landowners, customary authorities and armed actors.
Furthermore, the actual price per unit that traders pay to mineral producers is also subject to a wide range of parameters that influence ASM stakeholders’ income. IPIS’ data allows us to have better un-derstanding of the impact these parameters on price setting, including: local customs, exchange rates, world market prices, distance from the mine to the trading hub, the quality of the mineral production, trade monopolies, and responsible sourcing. IPIS data shows that responsible sourcing has not managed to provide noticeably better prices for minerals. At the local level, power relations and bargaining power between supply chain actors rather define actual mineral prices.
Qualitative case studies revealed that various local stakeholders feel as if responsible sourcing and increasing regulation has decreased their revenues. Artisanal miners have the perception that re-sponsible sourcing has affected mineral prices as the number of buyers decreased. Furthermore, local stakeholders explained that recent mining reform has introduced some additional stakeholders, who ask for additional contributions. Miners claimed that landowners, cooperatives and state officials have raised their levies.
Consequently, people complained that responsible sourcing has mostly benefited local elites.
Over the last 15 years, many observers have referred to the heavy tax burden as one of the reasons for artisanal miners and mineral traders not to work in the formal sector. IPIS data reveals that responsible sourcing efforts have managed to address the issue of illegal taxation to some extent. A higher num-ber of state services have been reported to levy taxes at non-validated and non-iTSCi sites.
Nevertheless, many miners feel as if responsible sourcing has brought them more levies (e.g. for coop-eratives), and at several validated mines, there have even been reports of the persistence of clear illegal taxation by state services.
Furthermore, the perception that taxes are too high, is also a consequence of local stakeholders’ feeling of receiving nothing in return for the taxes they pay. This is part of the wider distrust of people with regards to the Congolese state, which will not be addressed solely by more transparent supply chains.
Responsible sourcing does not seem to sufficiently recognise the dire need to improve governance, and hardly addresses the limited capacity of mining state agencies, particularly SAEMAPE. This seriously affects successful implementation of responsible sourcing.
Challenges for responsible supply chains
The report also discusses some specific challenges related to the implementation of responsible sourc-ing in eastern DRC - besides the impact and challenges related to armed interference and the socio-eco-nomic situation of ASM, discussed above.
Due to the limited number of state agents, mineral bags were not sealed at the level of the mine with traceability tags at 42% of the iTSCi mines visited by IPIS teams in 2016-2018.
Consequently, tagging is often done at a large distance from the mine. Alternatively, it is quite common that miners stock minerals at the site, or in their houses, awaiting SAEMAPE agents to pass by to tag the minerals. During the visits in 2017, it even seemed quite common that négociants held the tags them-

10 11
selves (after they bought them from the state agents), and auto-tagged their mineral bags. These issues raise questions about the effectiveness of traceability.
Furthermore, several state agents reportedly sell tags, or ask a small contribution in exchange for tag-ging. It is striking that a mechanism to fight illegal interference has been abused to levy illegal taxes. It illustrates how new regulation and technical interventions can encourage state agents to abuse their position of power.
The above reveals the high risk of contamination of responsible supply chains. In some cases, these contaminations do not involve minerals that have been affected by armed interference, or serious abus-es - for example in Maniema province. However, in other areas, risks of contamination are more problem-atic, and are actually linked to armed interference.
Gold mine in Pangi, Maniema (Photo: IPIS)
In many cases, contamination of responsible supply chains is not only due to absence of state control (e.g. absence of state agents at the mine), but also tolerated, or in some cases even organised by state agents.
Concluding remarks
The above findings show that responsible sourcing has made considerable progress over the past years, and indicate that it is possible to source minerals (more) ethically from eastern DRC.
On the other hand, the trends described above also reveal that a lot of the drivers of armed interference, corruption, and illegal trade are not addressed. Therefore, the current situation is not sustainable.

10 11
Responsible sourcing efforts have improved the personal security of groups of artisanal miners in several provinces. However, these are relatively fragile gains and the underlying problems remain unchanged. Armed conflicts, including those related to the control over natural resources, persist.
Although mining reform and responsible sourcing have increased the level of organization of ASM, it seems to have been particularly instrumental to local elites. The limited impact of responsible sourc-ing on local development once again raises doubts about the sustainability of the current situation.
In conclusion, it raises the question: how ambitious should responsible sourcing initiatives be?
On the one hand, it is unlikely that responsible sourcing will resolve an armed conflict. On the other hand, responsible sourcing should be more ambitious in its efforts to increase sustainability, for example through their integration in wider efforts to address insecurity.
Furthermore, is it sufficient if responsible sourcing initiatives solely rebuild consumers’ confidence in DRC’s mineral production? In order to increase sustainability, it is rather important that they also uplift artisanal mining populations.

12 13
1. INTRODUCTION AND BACKGROUND
1.1. Scope and key findings
This report is based on ten years of research on the linkage between conflict and mineral resources in the eastern Democratic Republic of the Congo (DRC). It draws a number of key lessons about this linkage, and takes stock of the efforts to break it, from IPIS’ unique cumulative dataset. It has collected this data through the single largest sustained mapping effort of the on-the-ground situation at mining sites and the trade routes in eastern DRC. In total, IPIS mapped about 2700 mines, employing 382,000 artisanal miners. IPIS also mapped 945oadblocks and 71 mineral trading centers.
The remainder of the first chapter will present the background of IPIS’ project on mapping of artisanal mines in eastern DRC, its methodology, as well as a general overview of the data that has been gathered.
From this data, IPIS will analyse the issue of armed interference in the DRC’s artisanal mining sector more in detail (chapter 2). Chapter 3 will look at the larger picture of armed conflict in eastern DRC, and assess to what extent it is actually related to interference in the artisanal mining sector. The next chapter (4), will assess to what extent responsible sourcing has actually had an impact on the militarization of mining sites over the last decade.
Besides these tip-of-the-spear dynamics, it is also important to ask how artisanal miners fare under the vagaries of shifting patterns of interference and efforts to mitigate it. Chapter 5 delves into tendencies in revenue distribution along the mineral supply chain, state control and broader questions linked to socio-economic development. Next, chapter 6 will discuss some of the main challenges for responsible sourcing that IPIS teams encountered in the field.
Finally, a concluding chapter will discuss the main lessons learned from the data gathered by IPIS, and will raise some questions about the future of responsible sourcing.
1.2. Background
Ten years ago the Belgian research institute International Peace Information Service (IPIS) started map-ping militarized mining areas in the Kivu provinces of eastern DRC.1 At that time, Western consumers and governments had started to pay attention to Congolese minerals, especially tin and tantalum, as they learned that armed groups were financing themselves through their mineral exploitation and trade.2
How big was this phenomenon? What exactly was the role of minerals in financing armed conflict? Lack of data was a key issue. To help answer basic questions, IPIS collected coordinates of the most import-ant mining areas in North and South Kivu, along with information such as minerals mined, numbers of workers, trade routes and centers, and the on-site security situation for its map. In 2010, IPIS extended the exercise to the adjacent provinces, including Tshopo, Ituri, Maniema, Tanganyika and Haut-Lomami.3
By 2012, interest in a better understanding of conflict-financing through mineral exploitation and trade in DRC increased considerably. A series of policy initiatives to curtail international trade in ‘conflict min-erals’ in the Great Lakes region had been launched by international organizations such as the UN, ICGLR, and OECD, as well as by the United States government (with Section 1502 of the Dodd-Frank Wall Street Reform and Consumer Protection Act). The DRC government and international businesses had little op-tion but to try to implement them. Although IPIS’ 2009 map was still in circulation, it had become less
1 Interactive Map of Militarized Mining Areas in the Kivus (MiMiKi) and Accompanying Note available at: http://ipisresearch.be/publication/accompanying-note-interactive-map-militarised-mining-areas-kivus/.
2 The link was first established by the 2001 UN Panel of Experts, which had been tasked explicitly with investigating how the illegal exploitation of mineral resources fed into the conflict at the time.
3 IPIS/International Alert, The Complexity of Resource Governance in a Context of State Fragility: An analysis of the mining sector in the Kivu hinterlands, November 2010: report and interactive web maps available at http://ipisresearch.be/publication/complexity-resource-governance-context-state-fragility-analysis-mining-sector-kivu-hinterlands/.
12 13
useful: armed group positions and conflict financing can shift from one area to another in the course of a few months. Artisanal mining, too, can be subject to sudden large migrations of miners, following changes in security, rainfall, production, and world market prices.
In order to provide more accurate and up-to-date information, IPIS has since partnered with the Con-golese Ministry of Mines4 and civil society organisations, funded by a variety of donors of whom most recently the International Organisation for Migration (IOM).5
IPIS developed a permanent monitoring system for artisanal mining activities and the involvement of armed groups and criminal networks in mineral exploitation and trade. The collaboration resulted in an interactive map published in 2013, with updates in 2014, 2015, and 2018, each with a different geo-graphical focus and accompanied by an analytical report.
Furthermore, in collaboration with the Danish Institute for International Studies (DIIS), IPIS has begun to map roadblocks in the eastern DRC, to better understand political economy of – minerals and other - supply chains in conflict affected and high-risks areas. To date, over 900 roadblocks have been mapped in the two provinces of North and South Kivu alone.6
1.3. IPIS’ Methodology
Over the years, IPIS has developed a sophisticated integrated methodology spanning the work flow from data collection to visualization. Data is collected by ‘field teams’, most of them composed of a SAE-MAPE or Division des mines agent and a civil society representative. Each team is equipped with Android smartphones and satellite communicators for mobile data collection on production and the destination of the minerals, and interviews several respondents per mining site on the presence and interferences of armed groups, among other things. The teams take pictures at each of the visited sites and to collect phone numbers of their respondents for subsequent triangulation and verification of the data. IPIS also organizes intensive training on mobile data collection and GIS database management for mining offi-cials in Kinshasa, preparing them to gradually start managing data collection and the publication of the maps themselves.
Finally, IPIS systematically collects qualitative data to contextualize and triangulate survey-based find-ings, give voice to affected communities, and to provide in-depth case studies to illustrate broader pat-terns in its analytical reports.
1.4. Data gathered
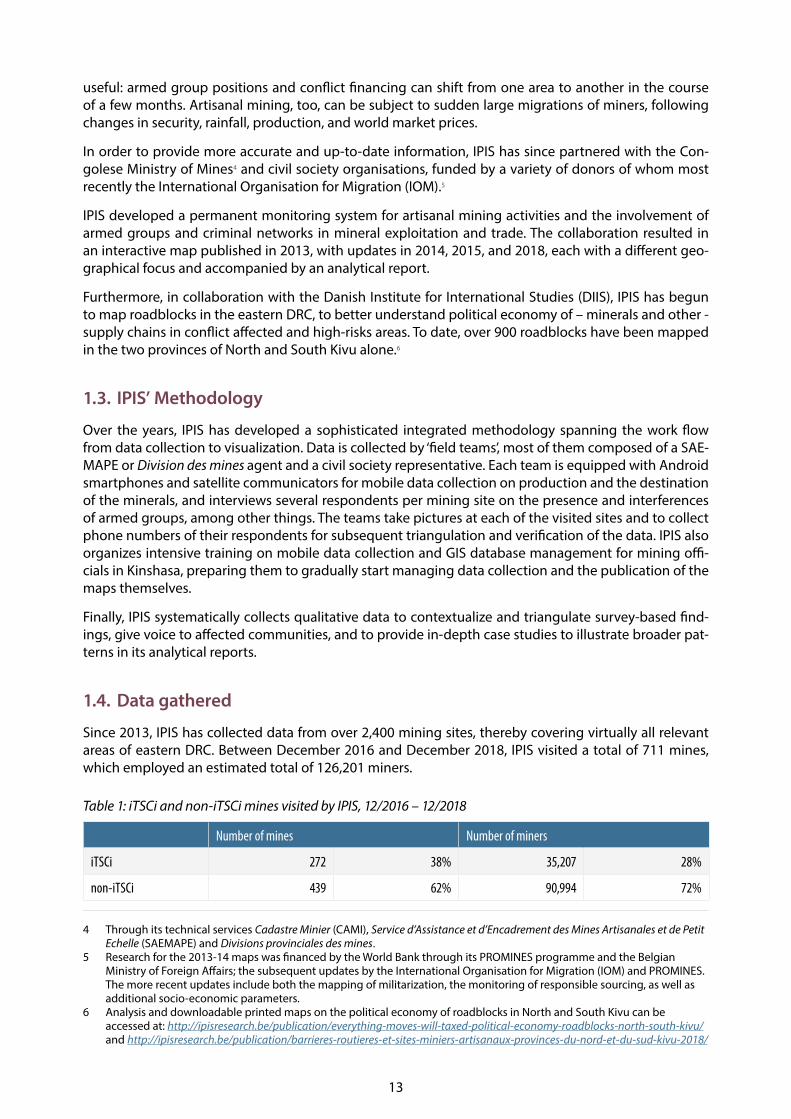
Since 2013, IPIS has collected data from over 2,400 mining sites, thereby covering virtually all relevant areas of eastern DRC. Between December 2016 and December 2018, IPIS visited a total of 711 mines, which employed an estimated total of 126,201 miners.
Table 1: iTSCi and non-iTSCi mines visited by IPIS, 12/2016 – 12/2018
Number of mines Number of miners
iTSCi 272 38% 35,207 28%
non-iTSCi 439 62% 90,994 72%
4 Through its technical services Cadastre Minier (CAMI), Service d’Assistance et d’Encadrement des Mines Artisanales et de Petit Echelle (SAEMAPE) and Divisions provinciales des mines.
5 Research for the 2013-14 maps was financed by the World Bank through its PROMINES programme and the Belgian Ministry of Foreign Affairs; the subsequent updates by the International Organisation for Migration (IOM) and PROMINES. The more recent updates include both the mapping of militarization, the monitoring of responsible sourcing, as well as additional socio-economic parameters.
6 Analysis and downloadable printed maps on the political economy of roadblocks in North and South Kivu can be accessed at: http://ipisresearch.be/publication/everything-moves-will-taxed-political-economy-roadblocks-north-south-kivu/ and http://ipisresearch.be/publication/barrieres-routieres-et-sites-miniers-artisanaux-provinces-du-nord-et-du-sud-kivu-2018/

14 15
Table 2: Validated and non-validated mines visited by IPIS, 12/2016 – 09/2018
Number of mines Number of miners
Yellow 13 2% 1,237 1%
Red 3 0% 1,080 1%
Green 174 24% 27,349 22%
Non-validated 521 73% 96,535 76%
Out of the 711 sites visited 38% were iTSCi sites, employing 35,207 miners - 28% of the total number of miners in the survey.
Out of the 711 mines, 24% were validated green, and 73% had not been validated.
It is important to note these figures reflect a certain selection bias: IPIS has partially tried to align its mapping priorities with the work of the joint validation missions of the Congolese government. In terms of case selection, this has entailed a focus on areas with a large concentration of validated sites, or where future validation missions were planned. Nevertheless, IPIS has still performed site visits in other areas as well, and has systematically collected case study material and conducted in-depth interviews with stakeholders in those areas.
To allow users to explore its data, IPIS maintains a free interactive webmap and all of the data on the webmap can be downloaded at IPIS’ Open Data web page.7
7 http://ipisresearch.be/home/conflict-mapping/maps/open-data/

14 15
2. ARMED INTERFERENCE IN EASTERN DR CONGO’S ARTISANAL MINING SECTOR
This chapter takes a closer look at armed interference at mining sites. The term ‘armed interference’ in mineral supply chains is vague and needs to be specified. How exactly do armed actors interfere in sup-ply chains? Armed interference can take place at any moment in mineral supply chains, but the OECD de-fines certain ‘bottlenecks’ at which such interference is particularly feasible, ranging from mining sites to transport and trading centers. Within this report, we consider ‘armed interference’ as a non-state armed group, an army unit or an armed criminal network that makes (illegal) profits from mineral exploitation or trade, through their physical presence in mining zones, or through more indirect interferences.
IPIS’ data enables to analyse armed interference, its main authors, and the key factors influencing them. We will discuss the difference between physical presence at mines and ‘predation at a distance’ on min-eral supply- and evacuation routes, and indicate recent tendencies as well as the role of relative accessi-bility as a factor driving the incidence of militarization.
2.1. Armed interference at mining sites
Since 2009, IPIS has collected data on armed interference at mining sites. In this section, we will discuss general patterns of militarization and insecurity in the artisanal mining sector in eastern DRC. The analy-sis focuses on data from the last reporting cycle, i.e. December 2016 - December 2018. At times, however, it is necessary to include older data from previous reporting cycles, i.e. 2015 and 2013-2014, because not all areas of eastern DRC were covered during the 2016-2018 research. Obviously, the 2013-2015 data will be less accurate as the situation may have changed. However, on the whole, sampled data shows the older data is still relevant and largely reflects the current situation. We specifically highlight it whenever we believe the 2013-2015 data is no longer relevant.
It is important to note that solely focusing on armed interference at mining sites risks to ignore part of the problem of conflict financing from mineral supply chains. This will be addressed un-der section 2.2.
2.1.1. Armed interference: provincial differences
As figure 1 shows, the frequency of armed inter-ference at the visited mining sites was highest in North Kivu, South Kivu and Ituri, where armed in-terference was reported at at least a third of the visited mines. The relative number of cases of armed interference in the Province of Maniema is significantly lower at 17%. There was almost no re-ported armed interference in the former Katanga Province. Out of all the Provinces concerned, it is probably the most stable and secure one, espe-cially after the second surrender of the warlord Gedeon Kyungu Mutanga in October 2016.
Figure 1: Armed interference per province, 2016/188
8 IPIS’ mining site visits since December 2016 did not cover all the provinces of eastern DRC to the same extent. 278 (39%) of the 711 sites visited by IPIS’ research teams are located in South Kivu. 123 mining sites were visited in Maniema, 119 in the former Katanga province and 130 in North Kivu. Finally, during this reporting cycle, only 61 sites were visited in the Ituri Province.

16 17
In North Kivu, the percentage of miners affected by armed interference is very high and almost double to that of any other province. However, this high percentage is mainly due to two large gold mining sites in northern Walikale under the control of the Mai Mai Simba, commanded by Mando.9 Together they ‘employ’ approximately 6,500 workers, which is almost a third of the total number of workers in North Kivu covered by the 2016/2018 data sample. This explains the large difference in North Kivu between the percentage of workers vs the percentage of mining sites suffering from armed interference. As a consequence, the above figures somewhat distort the true extent of the problem. Furthermore, the two NDC factions10 also interfere in gold mining in an area including northern Walikale and southern Lubero territories. (See Figure 2, ‘NDC-control’ is indicated in cyan)
The 2015 sample had identified an additional armed group known for interfering with artisanal mining, the Forces Démocratiques de Libération du Rwanda (FDLR)11 in the (southern part of the) terri-tory of Lubero. However, FDLR lost control over its Lubero mining sites in the past three years, mostly to the NDC.
The 2015-2018 data shows the strong control of non-state armed groups over several of North Kivu’s gold mining areas. It is the only province where the FARDC appears to be less involved in gold mining than the armed groups. However, it remains the main armed ‘stakeholder’ in tin min-ing, and still interferes in some gold mines as well.
For South Kivu, it is worth mentioning that about half of the reported cases of armed interference oc-curred in the (large) territory of Shabunda. As sever-al artisanal mining zones had not yet been mapped, this territory was a focus area for the IPIS teams, who visited a total of 117 mining sites there. More than 60% of these sites were affected by armed interference, which was distributed between the FARDC and Raia Mutomboki.12 (See Figure 2, ‘Raia Mutomboki-control’ is indicated in yellow) There-fore, the focus on Shabunda has certainly inflated the overall percentage for South Kivu.
The 2015 data show high levels of FARDC interfer-ence in large gold mining sites in the territory of
9 The oldest active militia in Congo, starting out in 1964. ‘Mai Mai’ is an umbrella term that Congolese self-defense groups and militia often adopt.
10 Nduma Defense of Congo and Nduma Defense of Congo-Rénové11 An ethnic Hutu armed group comprising some surviving Rwandese interahamwe. 12 Raia Mutumboki (‘outraged citizens’) is a Mai Mai group at the border of North and South Kivu.
Gold mine in Walikale, North Kivu
(Photo: IPIS)
Gold Mine Murondo, Irumu, Ituri (Photo: IPIS)

16 17
Fizi. Although these findings are somehow confirmed in the data from the 2018 sample, the trend is less obvious. Furthermore, in 2016-2018 IPIS teams observed more interference from Mai Mai Yakutumba in Fizi (Mai Mai groups are displayed in blue on Figure 2).
Figure 2: Concentration of armed interference at mining sites, 2016/2018
Concerning the Province of Ituri, mostly mining sites in the Territory of Irumu were visited in the frame-work of the 2016-2018 sample. These visits showed significant armed interference in Irumu. Analysis of the 2015 sample for Ituri also showed that the artisanal gold mining sector in the Territory of Mambasa was experiencing very high levels of armed interference.13 In 2018, IPIS did visit a few gold mines in Mambasa. Those in the west of the territory experienced interference from both the FARDC and Mai Mai rebels commanded by Manu (former Simba rebels commanded by the deceased rebel leader Morgan). Around Mambasa town, a large number of mines had been visited in 2017, within the framework of IPIS’ ‘Artisanal Gold Monitoring Pilot’.14 Only a few of them were subjected to interference of FARDC elements.
The 2015-2018 data shows that in the north of Maniema, particularly in the Territories of Punia and Lubutu, armed interference in artisanal mining by the FARDC persists. (See Figure 2, FARDC interference is indicated in red) The interactive webmap however also hides a part of the problem. IPIS’ teams have reported about members of the DRC’s Police services (and officials of other services) who intervene in mining activities. Although the police is not included in our definition of ‘armed interference’, some of these police officers are in fact armed, and abuse their position of power to extort people.
13 Beyond Ituri, such interference was equally high in the territory of Bafwasende of the neighboring Tshopo Province. Mining sites in the northern territories of Mahagi, Aru and Djugu appeared to be much less militarized.
14 http://ipisresearch.be/publication/artisanal-gold-monitoring-pilot/ , the area is also the project area of IMPACT’s Just Gold project.

18 19
2.1.2. Armed interference: different actors
In terms of those responsible for armed interference, units of the Congolese army (FARDC) are the main culprits at 66% of the affected mining sites (198 out of 265) in the 2016-2018 sample. 46% of the mines with armed interference are controlled or frequented by different armed groups—especially the Raia Mutomboki, NDC-Rénové, Mai Mai Yakutumba, and Mai Mai Simba. These trends are clearly visible on the latest update of IPIS’ webmap from the new layer ‘zones of interference’ (see Figure 2). Finally, while obviously not covered by our definition of ‘armed interference’, unarmed state services as well as traditional authorities are also structurally involved in illegal taxation of artisanal mining.
Congolese army
The illegal interference of FARDC units (appointed as ‘elements indisciplinés’ on the webmap, units known for conducting illegal or criminal activities) remains a chronic problem for eastern DRC’s ASM sector. Nevertheless, direct and open control over mining sites seems to have diminished over the last years, something which might have been spurred by responsible sourcing initiatives (see chapter 4). However, the army has found creative ways to substitute on-site taxation with ‘predation at a distance’.15 This in part comprises the erection of roadblocks on the access roads to mining sites (see section 2.2), but also other forms of accommodation such as periodic ‘patrols’ to collect contributions (see Text box 1).
How the army profits from mining without being present: some examples
In the Itebero area of southern Walikale, for instance, people reported in 2018 how direct control over mines has seriously diminished since mines have been validated. FARDC however still organizes monthly patrols that pass by the mines to collect a contribution. These contributions are often not levied directly, but rather secretly collected from either the mine boss or authorities with a legal mandate to tax mining. Mine managers often organize a collection, to which all miners have to contribute, in order to continue paying the FARDC, despite them not being present at the mining site on a daily basis, or else the monthly army patrols can turn out badly.16
Furthermore, in the nearby trading hub of Itebero, traders allegedly pay 10 US$ per ton of coltan to the president of their association, who distributes this to the FARDC, Intelligence Service (ANR) and Immigration service (DGM). Finally, some army commanders appoint a ‘commissionaire’, a civilian with no overt connection to the commander but who still covertly manages his interest at mining sites. This is reportedly the case for instance at the mining site Mutiku, some 30km from Itebero in Walikale.17
CNDP militia guarded the Rubaya mine in 2008. Some of them continue being present at ‘official’ checkpoints just outside the concession after having been integrated into the FARDC, while others have become private security guards. The army maintains a permanent presence in the village Kisura at only 500m from the important Rubaya pit B3 Bibatama, making it difficult to ascertain whether its presence has any influence or not. Local stakeholders claimed that whenever artisanal mining is productive in the area, the Military Intelligence (T2) increases random inspections for which they extort ‘mission fees’ to their suspects. 18
Artisanal miners have a role to play in sustaining the army’s interference as well. Reflective of a broader deeply engrained culture, our qualitative research showed mining pit bosses sometimes prefer to pre-empt potential harassment and insecurity from rebels, soldiers, policemen, or administrative authorities by offering their commander a periodic envelope. In some cases, such payments are more structured
15 A tactic first noticed in Spittaels S and Hilgert F. (2009) Are Congo’s mines the main target of the armed groups on its soil? The Economics of Peace and Security Journal 4: 55-61.
16 Interviews with several stakeholders, Secteur Bakano, Walikale territory, September 2018.17 Interviews with several stakeholders, Secteur Bakano, Walikale territory, September 2018.18 Interviews with several stakeholders, Rubaya, Masisi territory, September 2018.

18 19
forms of ‘political umbrellas’ shielding their claim to mine against harassment or claims from others.19
Armed groups
As indicated, armed groups still consistently practice armed interference in artisanal mining. Over the past years, some important shifts have taken place. In the past, the FDLR controlled important mining sites in both North and South Kivu. But since 2015, it has been chased away from these mines by other armed groups and the FARDC.20 Although it has lost virtually all significant mining areas in recent years following sustained military pressure and an internal split, it now endures mainly by taxing the supply chains of other natural resources, mostly charcoal (makala) and tropical hardwood (see section 2.2 below).
Many of the mines this group formerly occupied are now under control of the NDC-Rénové. Originally from Walikale, the NDC-R has expanded its area of control to southern Lubero, including important min-ing areas previously occupied by the FDLR and Mai Mai groups. IPIS found the territory under the control of the NDC-R to have grown larger than that of any other armed group in the DRC, and it is estimated to control over 100 gold mining sites in Walikale alone. The group has organized an extensive system of tax-ation, which is certainly not limited to the gold mining sector alone but comprises systematic roadblocks and access control through tickets (jetons).21
The Congolese Hutu militia Nyatura retains an important presence at the tin and coltan mines around Ru-baya in North Kivu, where it occupies a number of mining sites. As will be discussed below (see 4.1.1), the armed group even interferes systematically in a number of recently validated mining sites. In the context of complex local conflicts around access to land and natural resources, many within the local Hutu population seem to consider the presence of Nyatura as offering more security than the Congolese army.
The Mai Mai Simba of commander Mando (‘Forces Divines’) have for decades been involved in taxing gold mining in the west of Walikale and Lubutu territory (Maniema), also taxing semi-industrial gold exploitation on the river.
A significant change is also the decline of Raia Mutumboki and its subsequent loss of control over min-ing sites at the border between North and South Kivu. In 2015, it occupied significant numbers of gold mining sites, but its key figures have since fled into the remote forest, relinquishing influence over mines to the Congolese army. It still however retains some influence on gold mining south of the river Lowa in Walikale.
IPIS noted the expansion of Mai Mai Yakutumba from its heartland around Misisi (Fizi) in South Kivu, through shifting alliances with other Mai Mai militia in Shabunda and Maniema. Control over the gold mining sites in Misisi has been an important source of revenue for Yakutumba—sometimes through profit sharing agreements with FARDC units in place.
The Forces de Résistance Patriotique d’Ituri (FRPI), an armed group localized in the Irumu territory of Ituri, has consistently occupied gold mining sites such as those around the urban hub of Bavi.
State officials
Finally, non-armed interference by state officials remains an issue, including at sites where respon-sible sourcing initiatives are introduced. The mining division and SAEMAPE are supposed to frequent mining sites, to support miners and register production. However, they mainly focus on collecting legal or illegal taxes. SAEMAPE and the Mining Division regularly collect taxes without returning a receipt, or they ask for a ‘motivation’ to tag mineral bags (See sections 5.3.1 and 5.3.4). Many other officials also
19 Schouten P. (2017) Parapluies politiques: the everyday politics of private security in the Democratic Republic of Congo. In: Higate P and Utas M (eds) Private Security in Africa: From the Global Assemblage to the Everyday. London: Zed Books, 142-163.
20 Its influence became largely confined to Masisi and Rutshuru following attacks by the armed group NDC-R (Nduma Defence of Congo-Rénové) and the creation of the CNRD (Conseil national pour le renouveau et la démocratie) breakaway faction. It has however cemented a new alliance with the Congolese Hutu militia Nyatura.
21 http://www.un.org/ga/search/view_doc.asp?symbol=S/2018/531; Schouten P., Murairi J. and Kubuya Batundi S., Pillage route : l’économie politique des barrages routiers à Walikale et Masisi, IPIS, DIIS, ASSODIP, February 2017.

20 21
profit through interfering. Some of those, like the intelligence service or the anti-fraud unit, have no mandate to be involved with the mining activities. Table 23 shows that the chieftaincies (chefferies) and the ANR also engage in systematic taxation of minerals at roadblocks, without a mandate to do so.
Although less threatening, this non-armed interference is also part of power dynamics in which the ar-tisanal miners are often the weakest side. Indeed, cases of interference by unarmed state officials often imply the threat of force through the abuse of power. As a consequence, they contribute to the overall insecurity.
Finally, state officials often also play a crucial role in the persistence of illegal trade, and the contami-nation of responsible supply chains, in exchange for a bribe. Even though it might only concern small amounts of money for agents that are badly paid, these elements implicitly authorize illegal trade and tolerate criminal networks. As an example, the Mining Police in Rubaya requires periodic ‘small sums’ from artisanal miners in the Société Minière de Bisunzu (SMB) concession, which then also allows the min-ers to illicitly work by night, when the mine is officially closed.22
2.2. Roadblocks: the militarization of supply chains
Besides mining it is crucial to assess the rest of the supply chain. The OECD singles out upstream trans-port as particularly vulnerable to armed interference. As no substantive research has been conducted to date, IPIS proceeded to investigate the issue. The transport of minerals, it turned out, is structurally subjected to illegal taxation at strings of roadblocks operated by both armed groups and members of the Congolese security forces. An IPIS/DIIS study from December 2017 identified 798 roadblocks in the Provinces of North and South Kivu alone. The large majority of these roadblocks are used for (illegal) taxation. Furthermore, roughly 75% of the roadblock has a presence of armed men, from either armed groups or Congo’s security forces—a higher overall rate of militarization than mining sites. Out of the 239 instances in which natural resources were taxed at roadblocks (see Table 3 below), minerals pre-vailed with 122 instances (51%).
The Congolese army is present at almost half of the total number of roadblocks, and is responsible for nearly half of all the instances in which minerals were taxed.23 While the army might not be physically present in some of the mining sites controlled by armed groups, IPIS notes a consistent pattern whereby the army instead consistently erects roadblocks some distance away from these mining sites, usually at the junction of the footpath leading to the mine and a main road.
Army roadblocks along mineral supply chains: some examples
In Kalehe Territory, for example, the threat of several armed groups results in a high number of roadblocks by FARDC to guard over security. These units however levy taxes to earn their living. Such roadblocks also affect responsible sourcing:
• CENADEP reported on roadblocks in the areas of Numbi and Lumbishi (in Kalehe territory), which hold a lot of validated mines.24 At the crossing at Kalungu, FARDC units ask mineral traders somewhere between 5,000 and 50,000 Congolese Francs (FC)25. Next, before arriving at Bukavu, at the Kazingo roadblock, FARDC allegedly also levies a tax between 10,000 and 100,000 FC;
22 Interviews with artisanal miners, Rubaya, Masisi territory, September 2018.23 Schouten P., Murairi J. and Kubuya S., “Everything that moves will be taxed”: the political economy of roadblocks in North and
South Kivu, IPIS, DIIS, ASSODIP, November 2017.24 CENADEP, La fraude et la contrebande minière dans le territoire de Kalehe (Sud-Kivu): Cas de la chaîne d’approvisionnement de
Numbi/Lumbishi, IPIS, April 2018, pp. 15-16.25 FC, or Franc Congolais. At the start of the current dataset, late November 2016, 1 US$ equaled less than 1,000 FC. Since
mid-July 2017, however, 1 US$ has never been below 1,550 FC. 5,000 50,000 FC, equaled 3 US$ and 31 US$ at the time of the research.

20 21
• IPIS field teams reported négociants also provide for FARDC presence in Nyamukubi, on the road to the validated mines Nkwiro and Manga. They regularly pay them 50,000 FC, in order to guard over security along the road;
• The validated mine Kibuyu, somewhere between Numbi and Nyabibwe, is quite isolated, and has in the past been affected by pillaging by armed groups. The FARDC has established a roadblock on the road to Kibuyu, in order to discourage such invasions. By-passers carrying agricultural or mineral products however have to pay small contributions.
IPIS conducted a case study in 2017 on the taxation of gold in and around the NDC-R controlled goldmines north of the Osso-Walikale-Masisi axis in Walikale Territory. It found that every NDC-R roadblock along a footpath leading into its territory—usually leading up to a gold mine—is mirrored consistently by an army roadblock. (See Figure 3) In fact, until mid-2018, there seemed to be a truce or even a collaboration between the FARDC and the NDC-R. Despite the fact that the NDC-R controlled a large area, hardly any clashes were reported between the two, and their roadblocks existed side by side. 26
Figure 3: FARDC and NDC-R roadblocks along Walikale-Kashebere
The zones that are marked blue are areas with mines controlled by NDC-R. The red and pink dots are roadblocks
controlled by NDC-R, which are more distant from the big road. Brown dots are roadblocks controlled by FARDC. The
latter ones are much closer to the big road.
26 http://www.un.org/ga/search/view_doc.asp?symbol=S/2018/531. In mid-August 2018 the arrangement fell apart after a large-scale FARDC operation around Kagheri and Kasugho. https://www.securitycouncilreport.org/atf/cf/%7B65BFCF9B-6D27-4E9C-8CD3-CF6E4FF96FF9%7D/s_2018_882.pdf
22 23
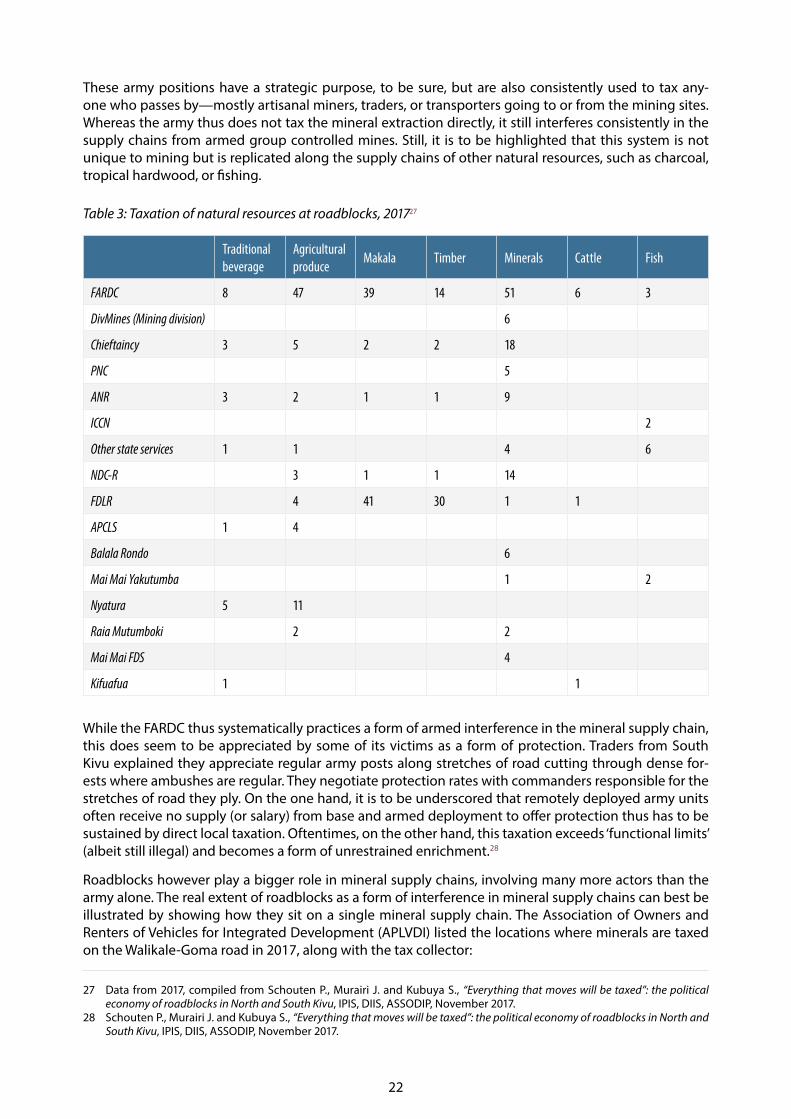
These army positions have a strategic purpose, to be sure, but are also consistently used to tax any-one who passes by—mostly artisanal miners, traders, or transporters going to or from the mining sites. Whereas the army thus does not tax the mineral extraction directly, it still interferes consistently in the supply chains from armed group controlled mines. Still, it is to be highlighted that this system is not unique to mining but is replicated along the supply chains of other natural resources, such as charcoal, tropical hardwood, or fishing.
Table 3: Taxation of natural resources at roadblocks, 201727
Traditional beverage
Agricultural produce
Makala Timber Minerals Cattle Fish
FARDC 8 47 39 14 51 6 3
DivMines (Mining division) 6
Chieftaincy 3 5 2 2 18
PNC 5
ANR 3 2 1 1 9
ICCN 2
Other state services 1 1 4 6
NDC-R 3 1 1 14
FDLR 4 41 30 1 1
APCLS 1 4
Balala Rondo 6
Mai Mai Yakutumba 1 2
Nyatura 5 11
Raia Mutumboki 2 2
Mai Mai FDS 4
Kifuafua 1 1
While the FARDC thus systematically practices a form of armed interference in the mineral supply chain, this does seem to be appreciated by some of its victims as a form of protection. Traders from South Kivu explained they appreciate regular army posts along stretches of road cutting through dense for-ests where ambushes are regular. They negotiate protection rates with commanders responsible for the stretches of road they ply. On the one hand, it is to be underscored that remotely deployed army units often receive no supply (or salary) from base and armed deployment to offer protection thus has to be sustained by direct local taxation. Oftentimes, on the other hand, this taxation exceeds ‘functional limits’ (albeit still illegal) and becomes a form of unrestrained enrichment.28
Roadblocks however play a bigger role in mineral supply chains, involving many more actors than the army alone. The real extent of roadblocks as a form of interference in mineral supply chains can best be illustrated by showing how they sit on a single mineral supply chain. The Association of Owners and Renters of Vehicles for Integrated Development (APLVDI) listed the locations where minerals are taxed on the Walikale-Goma road in 2017, along with the tax collector:
27 Data from 2017, compiled from Schouten P., Murairi J. and Kubuya S., “Everything that moves will be taxed”: the political economy of roadblocks in North and South Kivu, IPIS, DIIS, ASSODIP, November 2017.
28 Schouten P., Murairi J. and Kubuya S., “Everything that moves will be taxed”: the political economy of roadblocks in North and South Kivu, IPIS, DIIS, ASSODIP, November 2017.

22 23
• In Mubi, at the time of loading, the transporter pays 50 dollars per ton of tin ore to the DGR-NK;
• At the Mubalaka roadblock, at the exit of Walikale town, the ANR and CNRP both tax 10 dollars per truck / vehicle carrying minerals, without receipt;
• At the roadblock of Kashebere, 3,000 FC per vehicle transporting ores are required by the Mining Service;
• At the Kaanja roadblock, 3,000 FC per vehicle transporting minerals need to be paid to the services present there;
• At the Sake roadblock, 5 dollars per vehicle transporting minerals for the operators of the barrier;
• At the Mubambiro roadblock the ore transporter pays 5 dollars to agents for «Assistance»;
• In Goma, the carriers pay 25 Dollars per ton to the DGR-NK, a tax called «Development of Walikale». Trucks often carry 10 tons, so a 10-ton vehicle will pay 500 Dollars to DGR-NK in Mubi and 250 Dollars in Goma for «Development of Walikale».29
When mineral transporters are subjected to a forced tax at a roadblock, they have to report the incident immediately when it concerns tagged minerals. However, questions arise on the efficiency of this self-re-porting mechanism. To illustrate, around the tin and coltan mines of Rubaya (see text box in 4.1.1), for instance, ten roadblocks have been reported, operated by the FARDC, the cooperative COOPERAMMA, the ANR, as well as Nyatura armed group and the chefferie. Each roadblock systematically levies taxes to passers-by. Asked about this, mineral transporters however indicate they do not always report such incidents. One of them explained:
“If we have to abandon one tagged load by the roadside our boss will make us pay the whole load. I prefer quietly paying the little passage money instead.”30
29 Interviews, February 2017.30 Interview iTSCi representative, Paris OECD meeting, April 2018; Transporter at group discussion, roadblock workshop,
Goma, March 2018.

24 25
3. COMPARING ARMED CONFLICT WITH ARMED INTERFERENCE AT MINING SITES
A central idea within the ‘conflict mineral’ debate has been the importance of the control over mineral re-sources for conflict financing, with armed actors battling each other for physical control over mining sites. From this perspective, incorporating mining sites in responsible supply chains could cut armed groups’ revenue streams, and as such address the wider conflict.
IPIS data on armed interference can shed light on this assumption, by comparing the geographical location of armed confrontations to the locations of armed interference in mining. We find a few notable overlaps, but even more differences. It gives a better idea to what extent fighting targets control over mineral re-sources. Here follow the tendencies, province by province.
Among the five most active conflict zones in North Kivu31, only one overlaps with an area of widespread armed interference at mining sites: southern Lubero. The IPIS data below shows the rare cases of armed interference at mining sites around Beni, in eastern Lubero and in the territories of Rutshuru and Masisi.32 Partly because these areas have relatively little artisanal mining activity, the armed groups operating in these areas appear to rely on other sources of revenue.
The ADF, for example, has sustained itself for over two decades by relying to a large extent on money trans-fers from Ugandan diaspora.33 The Mai Mai around Lake Edward by contrast tax economic activities such as fishing, charcoal production and the marihuana trade.34 And while the FDLR has lost virtually all significant mining areas in recent years, it somehow endures.
Figure 4: Mining sites with armed interference in North Kivu, between 2013 and 2018, from IPIS’ map (left) and reported security incidents, since April 2017, from Kivu Security tracker (right)
Red halos include mines controlled by FARDC, cyan by NDC factions, blue Mai Mai groups and yellow Raia Mutomboki.
31 (1) Around the town of Beni in the very Northeast of the Province, the armed group ADF (Allied Democratic Forces) has been operating for two decades; (2) In the west of Rutshuru Territory, impacting on eastern Masisi as well, the remaining FDLR engage in occasional raids against vil-lages. There have been frequent clashes between a number of armed groups, all of which have entered into rather unstable alliances, including CNRD (Conseil national pour le renouveau et la démocratie), RUD (Ralliement pour l’unité et la démocratie) and several Nyatura and Mai Mai groups; (3) In the Northwest of Masisi, including neighbouring areas in Walikale, the APCLS (Alliance des patriotes pour un Congo libre et souverain and the NDC-R are fighting each other; (4) In the South of Lubero, including neighbouring areas in Walikale, the Mai Mai Mazembe and the NDC-R have been involved in many incidents. Similar to the situation in Masisi, a lot of the fighting is between armed groups rather than against the Congolese army; (5) Southeastern Lubero, bordering Lake Edward, including a large section of the Virunga National Park. In this zone, Mai Mai groups have launched repeated attacks against FARDC positions and the FARDC has conducted several operations against the Mai Mai.
32 It has to be reminded that Rutshuru and southeastern Lubero have very little artisanal mining activity in general. 33 GoE, 2015 report34 https://suluhu.org/congo/biographies/

24 25
The main area of overlap between armed conflict and armed interference at mining sites is southern Lubero, a key gold mining region. Whereas previously, the FARDC and the NDC-R each had their ‘zone’ and refrained from engaging each other, the NDC-R’s aggressive expansion led to clashes over mining areas in southern Lubero in 2018. 35
Several areas where armed interference at mining sites is widespread, are far away from any active front lines. Two areas are particularly worth highlighting. Firstly, most of the gold mining in (north)western Lubero is systematically taxed by Mai Mai Simba groups (ex-Morgan) and/or the FARDC. However, the area has been largely free of armed conflict in recent years. Secondly, armed groups make considerable profits from their involvement in (primarily) gold mining in eastern and central Walikale. These groups include the NDC-R, the Mai Mai Simba ‘Forces Divines’ (Mando) and the Raia Mutomboki south of the Riv-er Lowa. In neither case is the link between interference in the gold sector and armed conflict very clear.
Armed interference at mining sites in the Province of Maniema also appears to be partially unrelated to armed conflict. On the one hand, armed groups in eastern Kabambare have been involved in armed clashes,36 while also interfering in nearby mining activities. On the other hand, apart from the territory of Kabambare, and to some extent Kasongo, there are no armed conflicts. Nevertheless, there is significant armed interference by the FARDC at mines in Maniema’s northern Territories.
Figure 5: Mining sites in Kabambare with halos around those that are affected by armed interference (left) and mining sites with FARDC interference in northern Maniema (right), reported between 2013 and 2018
Red halos include mines controlled by FARDC, blue Mai Mai groups and yellow Raia Mutomboki.
At first sight, zones of armed conflict in South Kivu,37 seem to correspond better with mining areas sub-jected to armed interference than those in North Kivu and Maniema. Indeed, the province’s most active combat zones, the territories of Fizi and Shabunda, experience relatively widespread armed interference. In Fizi, for example, the FARDC and the Mai Mai Yakutumba have clashed around the gold mining hub of Misisi, an area they have both used for illegal taxation. In Shabunda, militarized cassiterite (and some col-tan) mining areas southwest of the Kahuzi Biega National Park have seen a number of clashes between the FARDC and several Raia Mutomboki groups.
35 http://www.un.org/ga/search/view_doc.asp?symbol=S/2018/531 36 Southeast Maniema has also been affected by armed groups that were part of the Mai Mai Yakutumba coalition. Some of the
Mai Mai Malaika-She Assani’s most remarkable attacks were conducted in the Maniema Territories of Kabambare and Kasongo. Although these incidents continued throughout 2018, by October large groups of Mai Mai had surrendered themselves to the Congolese army.
37 The largest concentrations of armed clashes were in the South and the East of South Kivu. Although many violent incidents also occurred within the northern territory of Kalehe, these were mostly smaller in scale and less often related to systematic armed group activity. In the South, various dynamics have had a negative impact on the security situation. The most important has been the resurgence of the Mai Mai Yakutumba, which had allied itself with several other Mai Mai groups. The UN Panel of Experts reports that “United Nations and FARDC sources documented over 100 attacks by Mai-Mai Yakutumba and allies against FARDC positions from January 2017 to January 2018” (http://www.un.org/ga/search/view_doc.asp?symbol=S/2018/531). In the east of South Kivu, in the vast Territory of Shabunda, most clashes were related to fighting between the FARDC and several Raia Mutomboki and Mai Mai groups. However, the situation is different between the north and the south of Shabunda.

26 27
Figure 6: Mining sites with armed interference in the territories of Fizi (left) and Shabunda (right), reported between 2013 and 2018
Red halos include mines controlled by FARDC, blue Mai Mai groups and yellow Raia Mutomboki.
A series of attacks by the Mai Mai Malai-ka-She Assani and Yakutumba against as-sets and staff from the industrial mining company Banro in South Kivu and Manie-ma are a rather exceptional case of armed conflict linked to the mining sector.38 Nev-ertheless, these incidents illustrate both the contested nature of resource gover-nance in the DRC and the continued rela-tion between natural resources and armed group activity. That being said, it needs to be highlighted that artisanal mining ac-tivities do not always seem a primary tar-get for these armed groups. For example, and as pointed out earlier, the Mai Mai Yakutumba launched a large-scale attack on the town of Uvira in September 2017. Clearly, the armed group has been pursu-ing multiple objectives, some of which ap-pear unrelated to material gain.
Notwithstanding the above, some import-ant (mining) areas of South Kivu outside of the active conflict zones are heavily affect-ed by armed interference in mining as well. This is particularly the case for the center of the province, in territories such as Mwenga and to some extent Walungu.
38 See, for example: https://www.radiookapi.net/2018/05/25/actualite/securite/salamabila-au-moins-30-morts-dans-des-combats-entre-larmee-et; https://www.voaafrique.com/a/cinq-otages-suite-a-un-assaut-armee-a-salamabila-dans-le-sud-kivu/3746645.html; https://www.reuters.com/article/us-banro-congo-violence/banro-gold-mine-trucks-attacked-in-eastern-congo-two-dead-army-idUSKBN1KW0IY and https://easterncongotribune.com/2017/08/07/maimai-malaika-attaque-kabambaremaniema/
Figure 7: Mining sites with armed interference in the center of South Kivu, reported between 2013 and 2018
Red halos include mines controlled by FARDC, blue Mai Mai
groups and yellow Raia Mutomboki.

26 27
In Tanganyika and Haut-Lomami, both the instances of armed conflict39 and those of armed interfer-ence at mining sites were very low. Finally, in Ituri, the only active conflict zone40 is also an area where a lot of mining sites are militarized. Between 2013 and 2018, both the FRPI and the FARDC have been reported to collect illegal taxes at mines around the town of Bavi, in the Territory of Irumu. However, as the maps below show, armed interference was also concentrated in several other areas of Ituri, espe-cially the territories of Mambasa and Djugu, by both FARDC elements and Mai Mai Simba (ex-Morgan). Although there have been sporadic episodes of fighting around control over gold mines in some areas of Mambasa (such as the Okapi Reserve), the overall level of armed conflict has been relatively low. Again, it appears that there is only a limited geographic overlap between armed conflict and armed interference at mining sites.
Figure 8: Mining sites in Ituri that have experienced armed interference between 2013 and 2018
Red halos include mines controlled by FARDC, blue Mai Mai groups and purple FRPI.
39 For almost a year, the provinces of Tanganyika and Haut-Lomami have been affected by the actions of armed groups, some of which have been allied with the Mai Mai Yakutumba. One of these, the Mai Mai ‘Hapa na pale’ has been involved in attacks against the FARDC between October 2017 and April 2018. It appears that more recently, armed groups have been most active in the territories of Nyunzu and Moba, and especially in the area around Bendera (Territory of Kalemie)
40 Finally, the Ituri Province also experienced an escalation of violence between late 2017 and early 2018, when intercommunal fighting broke out in the territory of Djugu. After April 2018, the violence subsided. Meanwhile, attacks by (and against) the armed group FRPI (Force de résistance patriotique d’Ituri) continued throughout the whole period in the Territory of Irumu.

28 29
4. RESPONSIBLE SOURCING: DOES IT MITIGATE ARMED INTERFERENCE?
This chapter asks: what impact have responsible sourcing efforts had on the issue of armed interference? As IPIS has been gathering systematic data on the issue from before 2010, when the first cautious initia-tives on responsible sourcing of minerals were launched, it can assess the evolution.
4.1. Armed interference and responsible sourcing
IPIS’s data gathering has not been specifically designed to make a comparison of the situation before and after responsible sourcing started. Only a limited number of mining sites have been revisited over the past 5 years and over that period some of the research questions have changed as well. Moreover, the militarization of mining sites is affected by more general developments of the security situation. Therefore, although we believe they show important trends, the figures and percentages below should only be considered as indicative.
Below we will compare iTSCi mines41 and ‘green’ validated mines42 on the one hand, with non-validated and non-iTSCi mines on the other. This report represents in no way an evaluation of the impact of these individual initiatives. These initiatives are rather the only ones that have been scaled sufficiently, and managed to include a wide range of mines, in order to make meaningful comparisons. iTSCi and ‘green’ validated mines are considered to be mines that are covered by responsible sourcing efforts.
Table 4 summarizes armed interference at mining sites, measured during two separate assessment pe-riods. It shows that mines covered by responsible sourcing programmes experience considerably lower levels of armed interference than mines that are not covered by these programmes, both in 2015 and 2016-2018. Yet this does not necessarily mean that responsible sourcing programmes are the cause of security at mining sites. Often, it is precisely the (pre-existing) absence of armed interference that attracts validation and iTSCi involvement in the first place.
Table 4: Interference by armed actors at the mining site (overall)
2015 2016/2018
All mines (3TG and other minerals): 41% (317/772) 28% (201/711)
All 3T mines: 17% (43/251) 16% (59/372)
Non-validated and Non-iTSCi 3T sites: 29% (42/143) 39% (33/84)
‘Green’ validated mines: 3% (2/69) 13% (22/174)
iTSCi sites: 0% (0/94) 8% (20/265)
Over the last years, it seems that DRC mining stakeholders and their validation teams have become less risk-averse, using validation as an ‘incentive’ to stimulate the formal trade in minerals from conflict-af-
41 iTSCi mines: Mines that are covered by the iTSCi Programme for Responsible Mineral Supply Chains. The International Tin Association (ITA)’s programme iTSCi monitors mineral supply chains in eastern DRC. It implements traceability by providing labels to Congolese state agents, so that they can tag 3T mineral production at the mine site and along the trade route to verify the origin of the minerals further down the chain. Furthermore, it also implements related activities to monitor the supply chains, including incident reporting, risk management, etc. iTSCi has been very successfully deployed, as it already covers a few hundred mines in eastern DRC.
42 Validated mines: Mines visited periodically by ‘joint validation teams’, which include representatives from the government, state agencies, and international partners working in the natural resources sector. These teams assess the security situation at the site and its surroundings, as well as socio-economic risks such as child labour, depth of pits, presence of pregnant women and environmental issues. They classify sites as red, yellow or green depending on their observations.

28 29
fected areas such as the territory of Shabunda.43 As a consequence, the data in table 3 shows a significant increase of armed interference at validated mining sites. But these data are mostly a reflection of the policy changes informing the validation missions, rather than indicative of a general deterioration of the security situation at validated mining sites.
4.1.1. Responsible sourcing over time: decreasing interference
How does responsible sourcing affect armed interference over time? How sustainable is its effect on mil-itarization? If we restrict our focus on mining sites that have been visited multiple times, we can assess the evolution of armed interference.
Table 4: Armed actor interference at mines visited both in 2015 and 2016/18 (173 mines)
2015 2016/2018 Change
All mines (3TG and other minerals): 31% (54/173) 22% (38/173) -9%
All 3T mines: 10% (8/80) 6% (5/81) -4%
Non-validated and Non-iTSCi 3T sites: 30% (8/27) 10% (1/10) -20%
Green validated mines: 0% (0/39) 4% (2/46) +4%
iTSCi sites (all 3T): 0% (0/43) 5% (3/66) +5%
Table 4 compares the levels of armed interference at mines visited both in 2015 and 2016-2018. It in-dicates that overall armed interference is decreasing. This observation is however especially true in areas with more scrutiny (where responsible sourcing initiatives are being implemented), as the 2016/18 data has mainly been gathered in areas with a relatively higher presence of validated mines.44
Table 5: Levels of armed actors interfering at mines visited both in 2015 and 2016/18 (173 mines), comparing validation status 2015, with validation status 2018
2015 (validation status 2015) 2015 (validation status 2018)
All mines (3TG and other minerals): 31% (54/173) 31% (54/173)
All 3T mines: 10% (8/80) 10% (8/80)
Non-validated and Non-iTSCi 3T sites: 30% (8/27) 33% (3/9)
Green validated mines: 0% (0/39) 11% (5/46)
iTSCi sites (all 3T): 0% (0/43) 8% (5/66)
The left column shows the mines that have been visited both in 2015 and 2016/2018, with reports about armed interfe-rence from IPIS’ 2015 surveys, taking into account the “validation status of 2015”.The right-hand column also shows the mines that have been visited both in 2015 and 2016/2018, with reports about armed interference from IPIS’ 2015 surveys. However, opposed to the left column, this one takes into account the “vali-dation status of 2018.
Yet the data also shows that armed interference has gone up in validated and iTSCi sites. Again, as dis-
43 36% of the validated sites experiencing armed interference were located in the Shabunda territory of South Kivu and had only been validated in April 2017. From the point of view of OECD guidelines that call for risk mitigation instead of risk aversion, this is a positive evolution. Table 5, below, illustrates this: it shows that many mines that suffered from armed interference have been enrolled in responsible sourcing programmes after 2015, in an effort to reduce the impact of armed interference by strengthening access to legal and formal supply chains.
44 24% of the mines visited in 2016/18 were green validated mines, while this was only 9% in 2015.

30 31
cussed above, this is mainly the consequence of more progressive policy changes, with responsible sourcing practices that are less risk-averse. Table 5, illustrates this: it shows that many mines that suffered from armed interference have been enrolled in responsible sourcing programmes after 2015, in an effort to reduce the impact of armed interference by strengthening access to legal and formal supply chains.
Tables 6, compares the sites that IPIS has visited both in 2013/2014 and 2016/2018. They confirm the above findings. The decrease of armed interference is even stronger, and also valid for iTSCi and validated mines.
Table 6: Levels of armed actors interfering at mines visited both in 2013/14 and 2016/18 (233 mines)
2013/2014 (validation status 2014) 2016/2018
All mines (3TG and other minerals): 42% (98/233) 25% (59/233)
All 3T mines: 33% (25/76) 14% (11/80)
Non-validated and Non-iTSCi 3T sites: 54% (15/28) 30% (3/10)
Green validated mines: 26% (7/27) 15% (9/62)
iTSCi sites (all 3T): 21% (8/38) 8% (5/59)
In conclusion, it seems very likely that responsible sourcing initiatives have a substantial positive impact by discouraging armed interference. However, in reality, the effect is probably less strong be-cause the 2016/18 data sample is to some extent biased.45 Furthermore, there are still regular reports of armed actors’ interference at validated sites (see text box below), and human rights violations in and around validated mines.
Armed group interference in validated mines: the case of Rubaya46
The mines of Rubaya are one of the main sources of artisanally mined tin and coltan in the DRC. Because of its importance, there has been impetus to establish and maintain a certified supply chain around its minerals. It has been subject to the earliest rounds of certification pilots in 2012. It has continued to be part of such efforts despite many irregularities and conflicts over control of the mines, most notably between the concession holder SMB and the cooperative COOPERAMMA.
Nonetheless, since 2013, the area has been home to an important and consistent presence of the Nyatura militia. The group headed by Colonel Irunva is currently in control of a number of coltan mining sites adjacent to validated sites. The site Chugi, for instance, is a geographical extension of the validated site Bihula. Local stakeholders have started to refer to Chugi as ‘Bihula 2’, because the minerals from this Nyatura-controlled site allegedly enter the validated supply chain together with minerals from Bihula and are tagged at the same location (Kibabi).
Even more notable are the mines Kavuta/Katovu and Rwandanda, which have both been validated green. About 50 artisanal miners produce around 4 kilos of coltan per day in Kavuta, which is controlled by Nyatura. The mineral production is transported about 20 km to Kibabi, where it is tagged and further shipped downstream. The small site Rwandanda is also under consistent control of Nyatura’s ‘General Delta’. The minerals from Rwandanda also proceed down the supply chain via Kibabi. Artisanal miners explained they work one day a week for the Nyatura, meaning that all production that day is handed over to the militia. Some ASM stakeholders explained that they consider the presence of Nyatura beneficial, because the risk of exactions is lower compared to the undisciplined army.
45 As explained earlier, the selection of areas visited by the IPIS teams partially focused on areas that already had a lot of validated sites, or where future ‘joint validation missions’ were planned. Validation missions are only planned for areas where there is a potential for responsible sourcing initiatives to succeed. Armed groups are usually less present in these areas, regardless of the introduction of a responsible sourcing initiative.
46 This case study is based on extensive fieldresearch in Rubaya, September 2018

30 31
4.1.2. Armed interference: geography matters
The above trends show a positive evolution with regards to armed interference in areas covered by responsible sourcing programmes. Also, a closer look at some particular cases show that the most en-trenched and striking cases of armed interference - such as around the trading hubs of Kigulube, Nzovu, Misisi and Nyange – are observed in areas without responsible sourcing efforts.
Nevertheless, this is not a causal relationship as the selection of mines and areas for responsible sourcing is often risk-averse. From the available information, it seems that armed interference in the artisanal mining sector seems to continue undisturbed in more isolated areas - with less scrutiny.
Responsible sourcing programmes seem to focus relatively more on less isolated areas, which is illustrat-ed by table 8. While 39% of all mines visited in 2016/2018 can only be accessed after at least two hours of walking, no more than 25% (iTSCi) and 26% (validated) of the ‘responsible sourcing mines’ are at this distance.
Table 9, however, illustrates that armed interference is relatively higher at these more isolated mines. 25% of mines – visited in 2016/18 - that can only be accessed after more than two hours of walking, experience interference by FARDC elements, and 22% of these mines by non-state armed groups, while these percentages are only respectively 10% and 4% for mines that can be accessed by car or motorbike.
Table 8: Accessibility of mines, 2016/18
Mines accessible by … All (711) iTSCi (272) Non-iTSCi (439) Validated green (174) Non-validated (537)Car/motorbike 29% 41% 22% 39% 26%Less than 2 hours by foot 32% 34% 31% 34% 31%More than 2 hours by foot 39% 25% 47% 26% 42%NA 1%
Table 9: Levels of armed interference, per accessibility, 2016/18
Mines accessible by … FARDC interference Non-state armed actor interferenceMines Miners Mines Miners
Car/motorbike 10% 9% 4% 4%Less than 2 hours by foot 16% 23% 10% 4%More than 2 hours by foot 25% 32% 22% 40%
However, more robust data is needed to further test the above indications that armed interference in-creases with relative inaccessibility.

32 33
5. SOCIO-ECONOMIC ASPECTSBesides the different types of armed interference and impacts of responsible sourcing thereon, IPIS also monitors a wide range of social and economic data related to mineral exploitation, trade and state con-trol over the ASM sector. This chapter will discuss some of this data in more detail.
5.1. Social and economic indicators related to mineral exploitation
Under this section we will focus on the current state of mineral exploitation, specifically focusing on the involvement of various stakeholders and the impact of mining activities on them.
5.1.1. Miners’ mobility
IPIS field teams gathered some data that provide some indi-cations on the extent to which mineral exploitations are locally anchored and drive people to migrate. More in-depth, tailored research is however needed to draw com-prehensive conclusions on this issue.
IPIS field teams asked mining stakeholders since which year mineral exploitation has started at the mining site (see ta-ble 10). Out of the 711 sites visited in 2016/2018, 26% have been exploited for more than 29 years, while at 31% of the sites, exploitation has only started since 2010 or later.
Furthermore, IPIS asked interviewees at the mining site to estimate the percentage of miners at the mine that were not considered local (arriving from another territory, prov-ince or country). Results for the 711 mines visited in 2016-2018 reveal that at 43% of the sites, more than half of the miners are considered to have come from elsewhere.
It is important to highlight that miners’ mobility is clearly more associated to gold mining. Table 12 clearly illustrates this. While 46% of the 3T mines rely on a workforce of local miners (75% or more), this is only the case for 23% of the gold mines.
Table 10: Start date of mining at the mine
Table 11: Share of miners that is not considered to originate from the area of the mining site
Table 12: Share of miners that is not con-sidered to originate from the area of the mining site, 3T versus Gold,
5.1.2. Cooperatives
A ministerial decree of 2010 obliges artis-anal miners to regroup into cooperatives.47
While the majority of the mines has a co-operative in place (Table 13), the estimated percentage of miners that are actually mem-ber of the cooperative is often rather low (Table 14).
Table 14: Estimated percentage of miners that are member of the cooperative, 2016-2018 (only including mines with a cooperative)
All mines (523) iTSCI (235) Validated green (151)
0% 11% 11% 1%
0 - 25% 26% 31% 32%
25 - 50% 14% 11% 11%
50% 1% 1% 1%
50 - 75% 26% 17% 25%
75 - 100% 21% 28% 30%
The widespread establishment of cooperatives could contribute to social and economic development. In particular, cooperatives have the potential to protect miners’ interests.
However, generally speaking, cooperatives rarely provide technical assistance, or better tools. More importantly, cooperatives in the DRC do not reflect the idea of a cooperative as described under international standards48, which would include among others ‘voluntary and open membership’, ‘dem-ocratic member control’, and ‘economic participation by members’. Usually some local strongmen, often in cooperation with customary chiefs, establish a cooperative in order to serve private interests rather than advancing those of the miners49. The following issues are especially problematic.
Firstly, most cooperatives have been subject to elite capture, and serve the interests of their most promi-nent members, including customary chiefs and mineral traders. Bahati for example noted that in six of the nine cooperatives he studied in South Kivu, the president of the cooperative was also a mineral trader. 50
Second and related, in most cases, cooperatives have become an important ‘actor’ in the commercial-ization of mineral production. This could potentially help miners’ access to mineral markets. However, various actors have complained that the ‘canalization’ of mineral trade (through traceability), and obliga-tion to work with a cooperative, has rather affected their income negatively. Cooperatives have regularly established a monopoly on mineral trade of the mine’s production, and miners claim the cooperatives set bad prices.
Thirdly, a significant number of cooperatives are established along ethnic lines as vehicles for different communities to protect their interests. This could potentially increase community tensions over access to resources. In Kalay Boeing (Walikale Territory) for example, local people claimed the cooperative CO-
47 Arrête ministériel n° 0706/CAB.MIN/MINES/01/2010 du 20 septembre 2010 portant mesures urgentes d’encadrement de la décision de suspension des activités minières dans les provinces du Maniema, Nord-Kivu et Sud-Kivu
48 Bahati Bahalaokwibuye C., Hybridation normative et institutionnelle dans les coopératives minières. Entre pluralisme juridique et ineffectivité du droit coopératif congolais, Canadian Journal of Law and Society, 2017, p. 8.
49 Administrative procedures are too complicated and costly for ordinary miners to set up their own registered cooperative. See Geenen S. And Radley B., In the face of reform: What future for ASM in the eastern DRC?, in Futures 62 (2014), p. 61.
50 Bahati Bahalaokwibuye C., Hybridation normative et institutionnelle dans les coopératives minières. Entre pluralisme juridique et ineffectivité du droit coopératif congolais, Canadian Journal of Law and Society, 2017, p. 8.
Table 13: Presence of a cooperative at the mine, 2016-2018
Table 14: Estimated percentage of miners that are member of the cooperative, 2016-2018 (only including mines with a cooperative)
Table 15: Mines with women involved in mineral exploitation, 2018
Table 10: Start date of mining at the mine
Start date Number of mines (711)
Before 1990 26%
1990-2005 24%
2005-2010 17%
2010-2015 16%
After 2015 15%
Table 11: Share of miners that is not considered to originate from the area of the mining site
Number of mines
0% 29 4%
1 - 25% 223 31%
26 - 49% 116 16%
50% 20 3%
51 - 75% 268 38%
76 - 100% 35 5%
NA 20 3%
Table 12: Share of miners that is not considered to originate from the area of the mining site, 3T versus Gold,
Gold mines 3T mines
0% 18 (5%) 11 (3%)
1 - 25% 62 (18%) 159 (43%)
26 - 49% 62 (18%) 54 (15%)
50% 14 (4%) 6 (2%)
51 - 75% 156 (45%) 121 (33%)
76 - 100% 20 (6%) 16 (4%)
NA 15 (4%) 4 (1%)

32 33
5.1.2. Cooperatives
A ministerial decree of 2010 obliges artis-anal miners to regroup into cooperatives.47
While the majority of the mines has a co-operative in place (Table 13), the estimated percentage of miners that are actually mem-ber of the cooperative is often rather low (Table 14).
Table 14: Estimated percentage of miners that are member of the cooperative, 2016-2018 (only including mines with a cooperative)
All mines (523) iTSCI (235) Validated green (151)
0% 11% 11% 1%
0 - 25% 26% 31% 32%
25 - 50% 14% 11% 11%
50% 1% 1% 1%
50 - 75% 26% 17% 25%
75 - 100% 21% 28% 30%
The widespread establishment of cooperatives could contribute to social and economic development. In particular, cooperatives have the potential to protect miners’ interests.
However, generally speaking, cooperatives rarely provide technical assistance, or better tools. More importantly, cooperatives in the DRC do not reflect the idea of a cooperative as described under international standards48, which would include among others ‘voluntary and open membership’, ‘dem-ocratic member control’, and ‘economic participation by members’. Usually some local strongmen, often in cooperation with customary chiefs, establish a cooperative in order to serve private interests rather than advancing those of the miners49. The following issues are especially problematic.
Firstly, most cooperatives have been subject to elite capture, and serve the interests of their most promi-nent members, including customary chiefs and mineral traders. Bahati for example noted that in six of the nine cooperatives he studied in South Kivu, the president of the cooperative was also a mineral trader. 50
Second and related, in most cases, cooperatives have become an important ‘actor’ in the commercial-ization of mineral production. This could potentially help miners’ access to mineral markets. However, various actors have complained that the ‘canalization’ of mineral trade (through traceability), and obliga-tion to work with a cooperative, has rather affected their income negatively. Cooperatives have regularly established a monopoly on mineral trade of the mine’s production, and miners claim the cooperatives set bad prices.
Thirdly, a significant number of cooperatives are established along ethnic lines as vehicles for different communities to protect their interests. This could potentially increase community tensions over access to resources. In Kalay Boeing (Walikale Territory) for example, local people claimed the cooperative CO-
47 Arrête ministériel n° 0706/CAB.MIN/MINES/01/2010 du 20 septembre 2010 portant mesures urgentes d’encadrement de la décision de suspension des activités minières dans les provinces du Maniema, Nord-Kivu et Sud-Kivu
48 Bahati Bahalaokwibuye C., Hybridation normative et institutionnelle dans les coopératives minières. Entre pluralisme juridique et ineffectivité du droit coopératif congolais, Canadian Journal of Law and Society, 2017, p. 8.
49 Administrative procedures are too complicated and costly for ordinary miners to set up their own registered cooperative. See Geenen S. And Radley B., In the face of reform: What future for ASM in the eastern DRC?, in Futures 62 (2014), p. 61.
50 Bahati Bahalaokwibuye C., Hybridation normative et institutionnelle dans les coopératives minières. Entre pluralisme juridique et ineffectivité du droit coopératif congolais, Canadian Journal of Law and Society, 2017, p. 8.
Table 13: Presence of a cooperative at the mine, 2016-2018
Table 14: Estimated percentage of miners that are member of the cooperative, 2016-2018 (only including mines with a cooperative)
Table 15: Mines with women involved in mineral exploitation, 2018
Table 13: Presence of a cooperative at the mine, 2016-2018
All (711) iTSCi (272) Validated green (174)
No coop 26% 14% 13%
Coop 74% 86% 87%

34 35
CABI was not representative for their community, while tensions at Rubaya develop along the communi-ty fault lines that surface via the conflict between the cooperative (COOPERAMMA) and the concession holder (SMB).
In sum, while potentially a solution to help collective action among artisanal miners to further their in-terests, in practice, cooperatives have become vehicles of their exploitation and, by mapping onto and amplifying ethnic fault lines, can further fuel already existing tensions.
5.1.3. Women
Overall, women are involved in mineral exploitation at 51% of the mines that have been visited in 2018. They are especially working at larger mines, with a lot of workers, as the 51% of mines where they are involved employ 73% of all the miners in our 2018 survey.
In most cases, however, the participation of women in mining related activity is limited. They usually represent a very small percentage of the workforce at the mine. Additionally, they are often only involved in less profitable jobs such as transportation (43% of the mines where women are working), washing (74%), crushing (25%) and the treatment of tailings (44%). Only in 24% of the mines where they are working, they are involved in digging. At 44% of the mines visited in 2018, women were involved in ‘associated activities’. At half of these mines some women were involved in prostitution. Most often they sell consumer goods (63%).
Women often face many challenges to access good positions within the ASM sector. Stereotypes and traditions affect women’s position.51
Additional regulatory and administrative requirements - which often result from formalization efforts - risks to affect access to resources of more vulnerable groups, including women. Responsible sourcing initia-tives should remain conscious about this issue and recognise the opportunity to address women’s difficult position in ASM. That this is not always the case is illustrated at the validated mine Tusengosengo (Walikale Territory). Pit bosses explained that a few dozen women were working at the mine, but that they had not been registered as it was believed that women were not authorized to work at the mine.52
5.1.4. Mining site owners and the distribution of revenues
Once miners start producing minerals there are clear production sharing agreements between them and the mine owner(s). While these agreements vary, IPIS figures indicate that often miners get somewhere between 40% and 60% of the revenues, while the other half goes to the ‘mine managers’. The mine managers include PDGs53, cooperatives and/or land owners.
However, in practice the miner’s share is often less than half, because the division of revenues is usually done after a certain percentage has been deducted to refund the expenses made by the mine manager or another pre-financer, and a percentage is paid to the land owner (or chef de colline).
For example in the mines Zolazola-D23 and Chaminyago, near Nzibira (Walungu Territory), interviewees explained in September 2017 that all expenses prior to the production phase of a gallery are covered by the PDG, including food provision for the miners. Allegedly, these expenses range between 500 and
51 Working document, Gabriel Kamundala Byemba, CEGEMI, 2018.52 Interview pit boss, Itebero area, September 201853 The so-called ‘PDG’ (‘Président Directeur Général’) is a shaft manager or pit boss that takes the initiative to start mining.
He engages a team of workers and provides them with the necessary equipment (shovels, pick axes, water pumps, compressors, etc.).
Table 15: Mines with women involved in mineral exploitation, 2018
Women … All (314) Gold (180) 3T (129)
Involved 51% 57% 43%
Not involved 49% 43% 57%
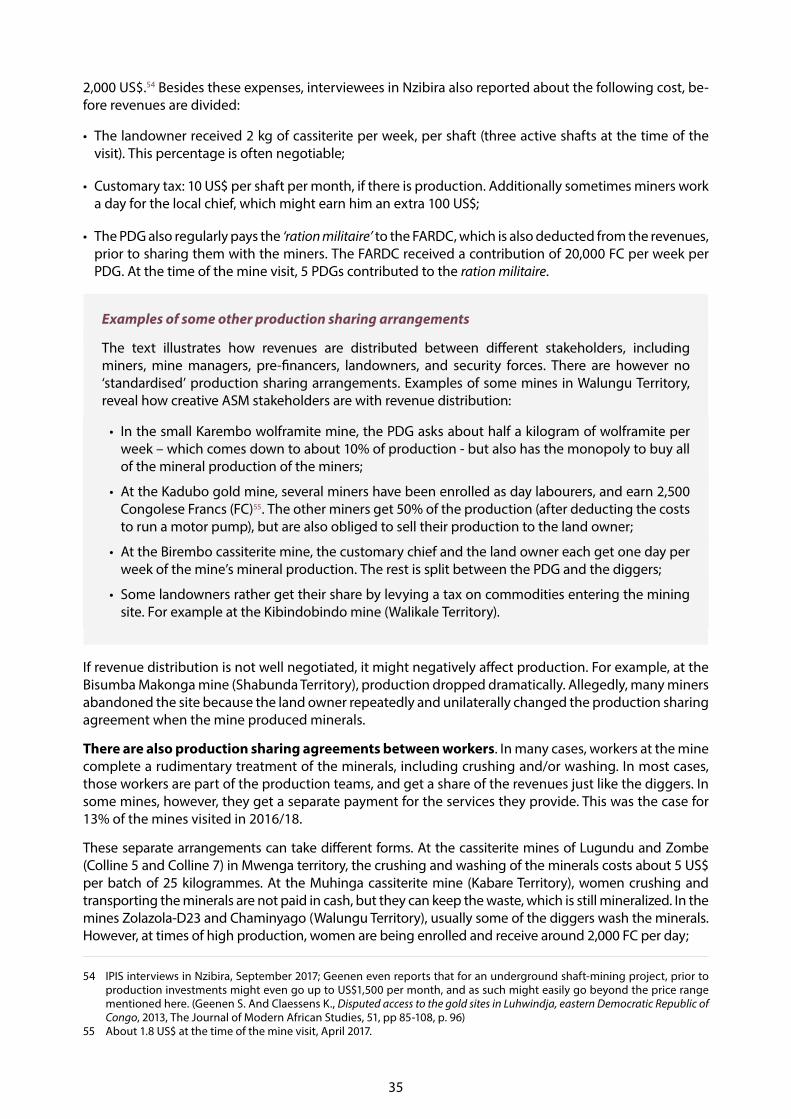
34 35
2,000 US$.54 Besides these expenses, interviewees in Nzibira also reported about the following cost, be-fore revenues are divided:
• The landowner received 2 kg of cassiterite per week, per shaft (three active shafts at the time of the visit). This percentage is often negotiable;
• Customary tax: 10 US$ per shaft per month, if there is production. Additionally sometimes miners work a day for the local chief, which might earn him an extra 100 US$;
• The PDG also regularly pays the ‘ration militaire’ to the FARDC, which is also deducted from the revenues, prior to sharing them with the miners. The FARDC received a contribution of 20,000 FC per week per PDG. At the time of the mine visit, 5 PDGs contributed to the ration militaire.
Examples of some other production sharing arrangements
The text illustrates how revenues are distributed between different stakeholders, including miners, mine managers, pre-financers, landowners, and security forces. There are however no ‘standardised’ production sharing arrangements. Examples of some mines in Walungu Territory, reveal how creative ASM stakeholders are with revenue distribution:
• In the small Karembo wolframite mine, the PDG asks about half a kilogram of wolframite per week – which comes down to about 10% of production - but also has the monopoly to buy all of the mineral production of the miners;
• At the Kadubo gold mine, several miners have been enrolled as day labourers, and earn 2,500 Congolese Francs (FC)55. The other miners get 50% of the production (after deducting the costs to run a motor pump), but are also obliged to sell their production to the land owner;
• At the Birembo cassiterite mine, the customary chief and the land owner each get one day per week of the mine’s mineral production. The rest is split between the PDG and the diggers;
• Some landowners rather get their share by levying a tax on commodities entering the mining site. For example at the Kibindobindo mine (Walikale Territory).
If revenue distribution is not well negotiated, it might negatively affect production. For example, at the Bisumba Makonga mine (Shabunda Territory), production dropped dramatically. Allegedly, many miners abandoned the site because the land owner repeatedly and unilaterally changed the production sharing agreement when the mine produced minerals.
There are also production sharing agreements between workers. In many cases, workers at the mine complete a rudimentary treatment of the minerals, including crushing and/or washing. In most cases, those workers are part of the production teams, and get a share of the revenues just like the diggers. In some mines, however, they get a separate payment for the services they provide. This was the case for 13% of the mines visited in 2016/18.
These separate arrangements can take different forms. At the cassiterite mines of Lugundu and Zombe (Colline 5 and Colline 7) in Mwenga territory, the crushing and washing of the minerals costs about 5 US$ per batch of 25 kilogrammes. At the Muhinga cassiterite mine (Kabare Territory), women crushing and transporting the minerals are not paid in cash, but they can keep the waste, which is still mineralized. In the mines Zolazola-D23 and Chaminyago (Walungu Territory), usually some of the diggers wash the minerals. However, at times of high production, women are being enrolled and receive around 2,000 FC per day;
54 IPIS interviews in Nzibira, September 2017; Geenen even reports that for an underground shaft-mining project, prior to production investments might even go up to US$1,500 per month, and as such might easily go beyond the price range mentioned here. (Geenen S. And Claessens K., Disputed access to the gold sites in Luhwindja, eastern Democratic Republic of Congo, 2013, The Journal of Modern African Studies, 51, pp 85-108, p. 96)
55 About 1.8 US$ at the time of the mine visit, April 2017.

36 37
Finally, it is clear that many miners are still paid in minerals, instead of cash money. In 2016-2018, at 34% of the gold mines, diggers were paid in gold, while at 3T sites miners were only paid in minerals in 14% of the mines.
5.2. Economic indicators related to mineral trade
In this section, we will discuss the current state of the mineral trade. We will specifically focus on costs and the price evolutions along the supply chain.
Above, the report already discussed how production sharing agreements between miners and site man-agers define the revenue of several stakeholders at the site. Another important factor defining actual income is the actual price per unit that traders pay to mineral producers. Understanding the impact of responsible sourcing on mineral prices is crucial, as it is an important (dis)incentive for artisanal miners to join the formal sector.
Under subtitle 5.2.8 we compare prices paid at iTSCi or validated mines with the prices paid at mines that are not covered by these initiatives. Before digging into this data, it is important to note that a wide range of other factors influence mineral prices, which makes it very difficult to draw strong conclusions from the comparison. We discuss the seven most important factors under the following sections below.
5.2.1. Pricing along the trading chain
Different actors along the supply chain take their share in order to make a living. All of these supply chain actors’ interferences have an impact on the mineral prices along the supply chain, up to the level of the mine. Similar to the production sharing arrangements discussed above (section 5.1.4), there are no stan-dardised revenues for these actors. In this section, we will refer to two main case studies (i.e. Kalima and Nzibira) in order to try to illustrate some of the costs, and incomes of different actors, along the trading chain. IPIS field teams visited the trading hubs Nzibira (September 2017) and Kalima (May/June 2018) in order to gather some specific information on this.
After minerals have been produced, miners take them to the trading hub themselves, or mineral traders buy them at the level of the mining site. In general, there are two types of négociants. Those that are limited to local trade around the mines are often called managers, chachouleurs, commissionaires, four-nisseurs, or ‘category B’. The bigger négociants connect mines and local traders with the trading houses near the border.56
Table 16: Gold prices at the level of the mine and trading hub, US$/gr, December 2016 - September 2018
Province Mine Trading hubs Price difference
Avg Median Avg Median Avg Median
Overall 46.97 47.41 52.93 51.2 11% 7%
Maniema 50.77 55.48 56.73 59.02 11% 6%
North Kivu 45.59 44.94 50.07 51.2 9% 12%
South Kivu 48.48 47.41 54.16 57.07 10% 17%
Tanganyika 40.05 37.25 46.11 44.52 13% 16%
Table 16 shows how median and average gold prices evolve from the level of the mine to the in-coun-
56 Vogel C. and Musamba J., Brokers of crisis: the everyday uncertainty of Eastern Congo’s mineral négociants, J. of Modern African Studies, 55, 4 (2017), pp. 567-592, p. 569.

36 37
try local trading hubs, per province.57 Overall it is clear that there is a price difference of about 10% between these two levels.
Furthermore, Max Impact developed an interesting case study on a batch of gold that is produced in Maniema, and exported via Bukavu. While the price of gold in Kampene was at 29 US$/gr, the comptoir in Bukavu bought it for 36.17 US$/gr. It is interesting to note that Max Impact calculated that total tax weight between Kampene and Bukavu was 17.2% (=5 US$/gr).
In September 2017, IPIS also mapped the price evolution of cassiterite along the route from Zolazo-la-D23 (Walungu Territory) to Bukavu. At the mine cassiterite was priced at 6 US$/kg, after the minerals had been washed by the miners. In Nzibira, its price rose to somewhere between 6.5 and 7 US$/kg, and was valued between 9 and 12 US$/kg in Bukavu.
Transporting the minerals from the mine to the trading hub entails significant costs. Un-der section 5.2.5 we will discuss how the dis-tance between the mine and the trading hubs has a negative impact on price levels.
In Zolazola-D23 (Walungu Territory), transport to Nzibira is done by porters as well as motor-bikes. The mineral trader pays the transporter 3,000 FC per 40-50kgs bag of cassiterite. Also in Kalima (Maniema), it has been reported how commissionaires or ‘managers’ visit mines and buy minerals for the bigger traders or négo-ciants. In May 2018 the price of cassiterite at the level of the mines around Kalima had been fixed by the traders at 8,000 FC/kg. Négociants often paid their commissionaires somewhere between 10,000 and 11,000 FC/kg, which includes the pur-chase price for the minerals, the commissionaire’s fee, as well as the costs for the mineral transport to Kalima. In Nzibira, a commissionaire testified how he usually received somewhere between 2% and 5% of the value of the minerals.
Négociants frequently pre-finance exploita-tion. At times they are reimbursed for this di-rectly (e.g. 30 or 40% of the mineral production is handed over to them), or they have acquired a monopoly to buy the mineral production.
After the delivery of the minerals by the commissionaires, négociants stockpile minerals, and often do further treatment. When they have collected a sufficiently large quantity, they transport it to big towns such as Kindu, Bukavu or Goma. In Nzibira traders reported that in principle they are obliged to stock their minerals at the Centre de Négoce. Most of them however prefer to stock minerals at home, as they are afraid of theft in the Centre de Négoce. Yet, it seems quite likely traders rather prefer to stock at home to decrease government oversight. Mining officials complained to IPIS about tax evasion by négociants.
Indeed, négociants are considered as key drivers behind the high levels of informality in the sec-tor, which sometimes leads to suggestions to side-line them. Vogel and Musamba, however, de-scribe them as “brokers of socio-economic life in North and South Kivu”. On the one hand, they are ac-quainted with comptoirs, credit institutions, local politicians, kinship networks and security forces,58
57 For price analyses in section 5.2, we have only included data up to September 2018.58 Vogel C. and Musamba J., Brokers of crisis: the everyday uncertainty of Eastern Congo’s mineral négociants, J. of Modern
African Studies, 55, 4 (2017), pp. 567-592
Mine Metsera in Maniema (Photo: IPIS)

38 39
while on the other they manage to access isolated mines to buy minerals and provide consumer goods in a context of poverty, insecurity, corruption, and lack of governance.
Before minerals are being transported to the bigger trading towns, négociants have to pay some taxes. For example in Nzibira, prior to the transport to Bukavu, they pay:
• ‘Autorisation de transport des minerais’ (ATM): 25 US$/lot to the Mining Division;• Service rémunératoires: 0.3 US$/kg to SAEMAPE;• As well as 10 US$ ‘motivation’ per mineral batch to SAEMAPE, without any receipt;• 0.025 US$/kg to the cooperative;• Taxe sur l’étalage to the chefferie: 0.05 US$/kg
The next cost is the transport from the local trading hub to the regional trading hub. The transport from Nzibira to Bukavu, for example, has been estimated by some négociants at 0.2 US$/kg, which does not include taxes. In addition, the traders have to pay at several roadblocks along the road from Nzibira to Bukavu. These roadblocks included: a first at Nzibira (The ‘Anti-fraud Service’: 50 US$ per batch of minerals); a second at Mashango (5 US$/batch); a third at Kashanja (10 US$/batch) and a fourth at Mush-weshwe (8,000 FC).
The case of Kalima is quite different. Négociants and commissionaires arrange transport from the mines to Kalima, paying porters and motorcyclists.59 From Kalima onwards transport is reportedly much more organised. SAKIMA arranges transport by truck from Kalima to Kindu. There seem to be less interferences at roadblocks on this axis, compared to the Nzibira case. In May 2018, traders reported the transport of 13 tons of minerals cost 1,200 US$. Next, minerals are transported by the national railway company (Société Nationale des Chemins de fer du Congo, SNCC) to Kalemie. One waggon, which carries 40 tons, allegedly costs 4,400 US$.
According to traders, these transports from Kalima to Kalemie also have an impact on the price of the minerals that people receive upstream. This is not just because of the actual cost of transportation. The transport by truck, and especially the railway transport, often involve serious delays. These delays in-volve risks for supply chain actors, and particularly comptoirs, as mineral prices fluctuate. To de-crease their own risks, comptoirs and traders allegedly reduce buying prices.
5.2.2. The impact of traditional customs and local dynamics
At the level of individual transactions, various factors might influence prices which are very hard to cap-ture. Actual prices paid might for example decrease when particular miners are in dire need of money. Adversely, miners sometimes stock minerals in order to get better prices and increase their revenues.
Another difficulty when calculating the actual price miners get, is linked to a lack of transparent price setting. Artisanal miners do report how much money they receive per gramme or kilogramme. In many cases, however, the reported weight of minerals they have sold is seriously underestimated. For example in the area of the trading towns Mwenga and Kidasa (Mwenga Territory), IPIS surveyors reported about a practice called ‘dixième région’. In December 2016, the price for cassiterite at the level of the mine and the trading town was the same in both cases: 6,000 FC. At the level of the mine, however, local mineral traders deliberately underestimated the weight of the mineral production by about 20%. The IPIS field team did report local discontent with regards to this practice. The cooperative COOMIAMU, managing the Kalesha mine, reportedly fought against it. The field team also reported about this practice at the validated site of Misela.
Particular to the gold sector is the use of the kitchele gramme as a unit of weight. A kitchele gramme equals about 1.28 metric grammes. It was used at 84% of the gold mines visited in 2017. The absence of
59 Mine visits around Kalima in May/June 2016 provide more detail on the cost of transport. From the mine of Moka, cassiterite is transported by motorbike at a price of 300 FC, which takes about 2 hours and a half. From the mine Mosala to Kalima, transport costs 700 FC/kg, which includes 300 FC from Mosala to Kamundala by foot, 200 FC to cross the river by pirogue, and another 200 FC/kg for the moto from Kamundala to Kalima. In total the latter route takes about a day. Transport from the Avanga mine to Kalima costs a mere 150 FC/kg.

38 39
a uniform measurement complicates price data collection.
These practices negatively affect the transpar-ency within the sector, making it very difficult to make detailed and accurate comparisons of mineral prices at an aggregated level, e.g. be-tween regions and different types of mining sites.
5.2.3. The impact of exchange rates
Another complicating factor for the analysis of mineral pricing in DRC over the past few years, has been the strong currency devaluation of the Congolese Franc (FC) compared to the US dollar. At the start of the current dataset, late November 2016, 1 US$ equalled less than 1,000 FC. Since mid-July 2017, however, 1 US$ has never been below 1,550 FC.
As prices are usually paid in FC at the level of the mine, this has strongly influenced local mineral prices. This is perfectly illustrated by the local trading hubs Manono (Tanganyika) and Ngoya (Haut-Loma-mi). Both had been visited in April 2017, as well as August/September 2017. At both trading hubs cassite-rite was sold at 8,300 FC/kg in April 2017, while these prices increased to 11,000 FC in August/September 2017 – a 33% price increase. The Congolese Franc however devaluated by 15% over the same period (1 US$ equalled 1,349 FC mid-April, while it was at 1,551 FC mid-September). In order to try to nullify the impact of the strong currency devaluation, mineral prices have been converted into US$ under section 5.2.
There are also local differences in the exchange rates. Around the trading hub Tchonka, for example, IPIS surveyors reported in December 2017 how 1 US$ equalled 1,500 FC at the level of the mines, while it valued 1,600 FC at the level of trading hub.
5.2.4. The impact of world market prices
Above we discussed how prices in-creased by 33% in Manono and Ngoya between April and August/September 2017. Another factor that might help to explain this price in-crease are the world market prices. Between mid-April and mid-Septem-ber 2017, tin prices rose by 4% at the London Metal Exchange.
During the period of the data collec-tion, tin prices fluctuated between 18,650 and 22,100 US$ per ton at the LME. They reached bottom prices in February 2017 and August 2018, re-spectively 18,750 and 18,650 US$ per ton. While at its peak, in January 2018, a ton was at 22,100 USD.
Cassitérite mine in Manono, Tanganyika (Photo: IPIS)
https://www.lme.com/en-GB/Metals/Non-ferrous/Tin#tabIndex=2
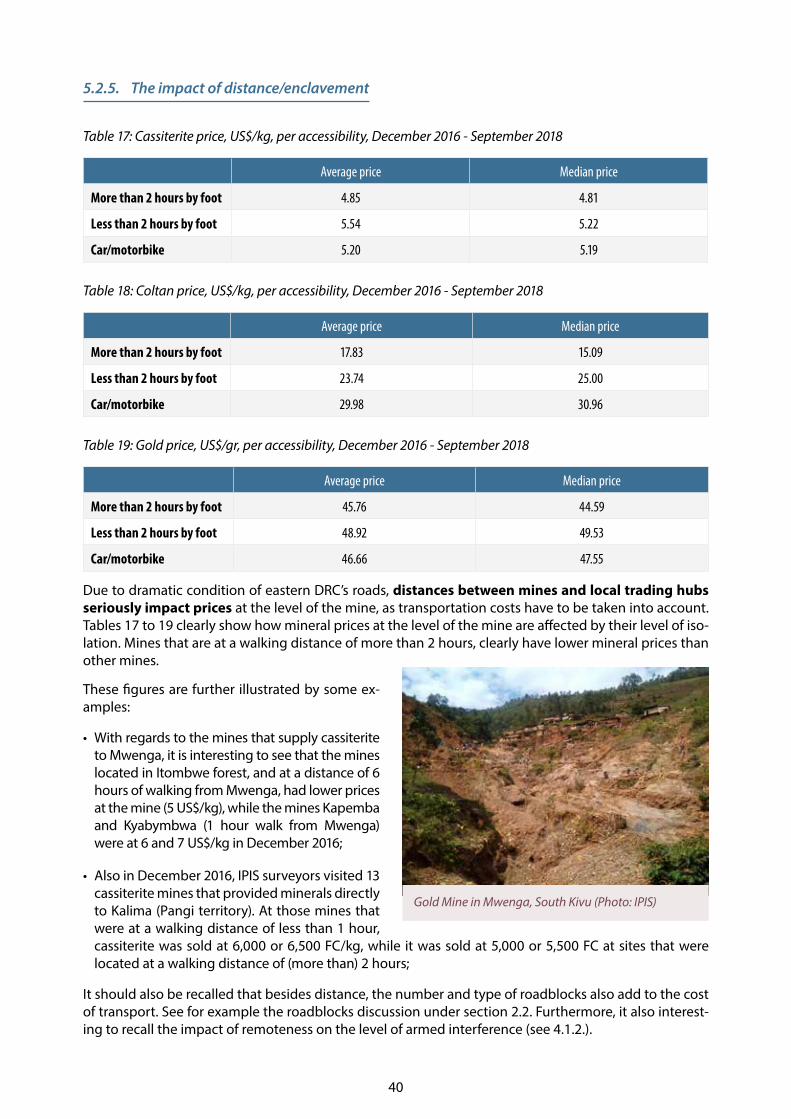
40 41
5.2.5. The impact of distance/enclavement
Table 17: Cassiterite price, US$/kg, per accessibility, December 2016 - September 2018
Average price Median price
More than 2 hours by foot 4.85 4.81
Less than 2 hours by foot 5.54 5.22
Car/motorbike 5.20 5.19
Table 18: Coltan price, US$/kg, per accessibility, December 2016 - September 2018
Average price Median price
More than 2 hours by foot 17.83 15.09
Less than 2 hours by foot 23.74 25.00
Car/motorbike 29.98 30.96
Table 19: Gold price, US$/gr, per accessibility, December 2016 - September 2018
Average price Median price
More than 2 hours by foot 45.76 44.59
Less than 2 hours by foot 48.92 49.53
Car/motorbike 46.66 47.55
Due to dramatic condition of eastern DRC’s roads, distances between mines and local trading hubs seriously impact prices at the level of the mine, as transportation costs have to be taken into account. Tables 17 to 19 clearly show how mineral prices at the level of the mine are affected by their level of iso-lation. Mines that are at a walking distance of more than 2 hours, clearly have lower mineral prices than other mines.
These figures are further illustrated by some ex-amples:
• With regards to the mines that supply cassiterite to Mwenga, it is interesting to see that the mines located in Itombwe forest, and at a distance of 6 hours of walking from Mwenga, had lower prices at the mine (5 US$/kg), while the mines Kapemba and Kyabymbwa (1 hour walk from Mwenga) were at 6 and 7 US$/kg in December 2016;
• Also in December 2016, IPIS surveyors visited 13 cassiterite mines that provided minerals directly to Kalima (Pangi territory). At those mines that were at a walking distance of less than 1 hour, cassiterite was sold at 6,000 or 6,500 FC/kg, while it was sold at 5,000 or 5,500 FC at sites that were located at a walking distance of (more than) 2 hours;
It should also be recalled that besides distance, the number and type of roadblocks also add to the cost of transport. See for example the roadblocks discussion under section 2.2. Furthermore, it also interest-ing to recall the impact of remoteness on the level of armed interference (see 4.1.2.).
Gold Mine in Mwenga, South Kivu (Photo: IPIS)

40 41
5.2.6. The impact of the quality of the minerals
Another important factor influencing prices is the mineral grade of production. The level to which min-eral production has been treated might also influence prices.
For example, in Misisi (Fizi territory), IPIS surveyors reported that gold that had already been treated with mercury was sold at 72,000 FC per kitchele gramme. Gold that had not yet been treated with mercury was sold somewhere between 62,000 and 65,000 FC.
Furthermore, at several 3T mines it has been reported how mineral traders prefer mixed material (cas-siterite-coltan), compared to cassiterite, and pay significantly more for it. As coltan is worth considerably more than cassiterite, they can sell this at higher prices. This is for example the case in the Nzovu, Lulingu and Tchonka areas (Shabunda Territory). At the latter two hubs, people reported how minerals are hardly processed at the level of the site, but separated by the négociants. Miners take the minerals to the négo-ciants, who separate the minerals before taking them to the selling point in Tchonka. In December 2017, IPIS surveyors reported the following prices at the Lulingu trade hub: cassiterite was sold at 10,000 FC/kg; High-density coltan at 30 US$/kg, and low-density coltan at 20 US$/kg; Mixed cassiterite-coltan was sold at 14,000 FC/kg.
At the (iTSCi) mines around Manono and Kanunka, miners also claimed their production was mixed cas-siterite-coltan. However, they complained they were not remunerated for the coltan, as their minerals were bought as if it was pure cassiterite.
It is problematic that very few ASM stakeholders have the tools to assess the quality of the minerals, while it is an important factor that influences the price. For example, at the 3T mines around Kalima, nei-ther the négociants, nor the miners could accurately assess the value of their mineral production. Traders depend on what the entité de traitement offers them, and miners get a fixed price (see next subsection). Subsequently, miners feel they are being exploited by the traders, while the latter worry that they might by deceived by the comptoir, who only communicates them the mineral content of their material by phone.
5.2.7. The impact of monopolies
Prices that people receive for their mineral production are often also influenced by the power relations between various supply chain actors. Several comptoirs and négociants hold de facto monopolies over mineral trade in certain areas, which allows them to unilaterally set prices. Although such monopolies exist in several mining areas, it is important to underline that the large majority are still visited by a wide range of buyers.
Several monopolies have for example been observed in SAKIMA concessions, including a lot of validated and iTSCi mines. SAKIMA has never started industrial exploitation, but for the time being authorises artisa-nal miners to work at its concessions. SAKIMA has signed some contracts (‘contrats de collecte de la produc-tion artisanale’) with a number of comptoirs, as part of its strategy to revive its mining activity. The contracts give several comptoirs a monopoly to buy minerals at validated mines within its concessions.60
AMUR’s monopolies at SAKIMA concessions
AMUR has for example acquired a monopoly to source from the mines on SAKIMA’s exploitation permit 2598 (Kalehe territory). Miners of the cooperative COPAMIHANUBU have been complaining about this monopoly, as AMUR imposes prices that have been considered too low by the miners (somewhere between 3.75 and 5.5 US$/kg early 2018).
60 SAKIMA, Rapport 2017 sur la mise en oeuvre du devoir de diligence raisonnable par la SAKIMA SA, 6 April 2018.
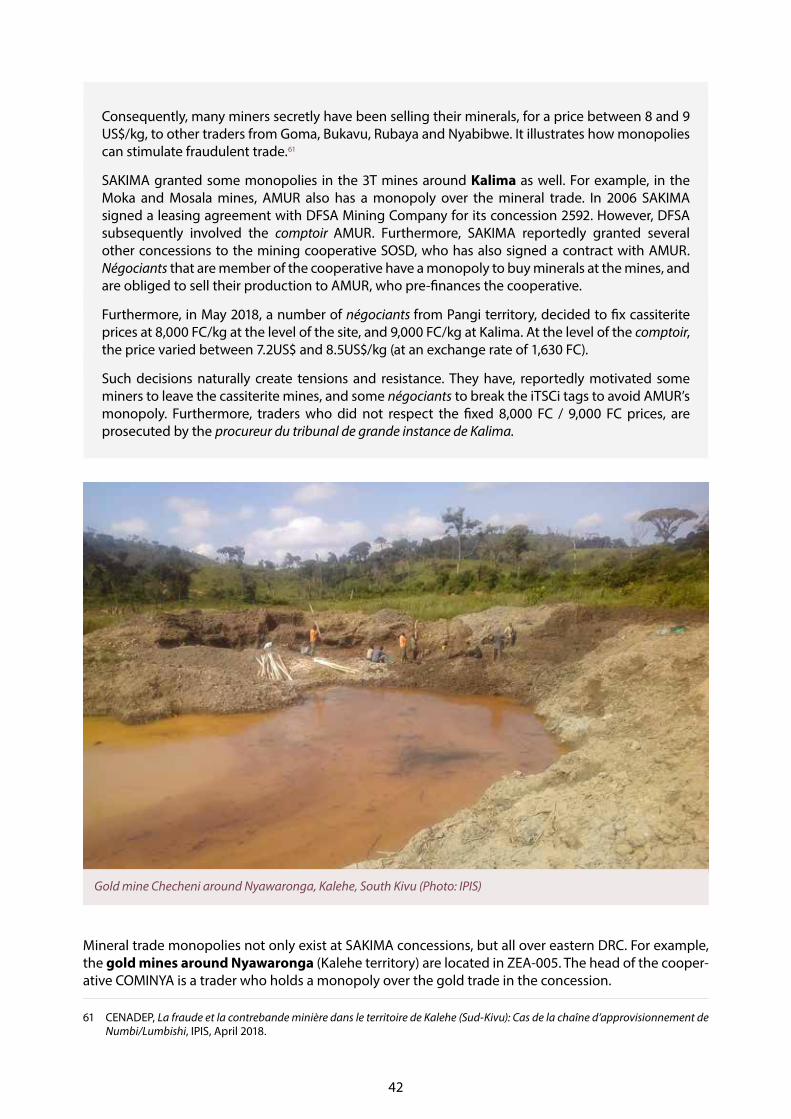
42 43
Consequently, many miners secretly have been selling their minerals, for a price between 8 and 9 US$/kg, to other traders from Goma, Bukavu, Rubaya and Nyabibwe. It illustrates how monopolies can stimulate fraudulent trade.61
SAKIMA granted some monopolies in the 3T mines around Kalima as well. For example, in the Moka and Mosala mines, AMUR also has a monopoly over the mineral trade. In 2006 SAKIMA signed a leasing agreement with DFSA Mining Company for its concession 2592. However, DFSA subsequently involved the comptoir AMUR. Furthermore, SAKIMA reportedly granted several other concessions to the mining cooperative SOSD, who has also signed a contract with AMUR. Négociants that are member of the cooperative have a monopoly to buy minerals at the mines, and are obliged to sell their production to AMUR, who pre-finances the cooperative.
Furthermore, in May 2018, a number of négociants from Pangi territory, decided to fix cassiterite prices at 8,000 FC/kg at the level of the site, and 9,000 FC/kg at Kalima. At the level of the comptoir, the price varied between 7.2US$ and 8.5US$/kg (at an exchange rate of 1,630 FC).
Such decisions naturally create tensions and resistance. They have, reportedly motivated some miners to leave the cassiterite mines, and some négociants to break the iTSCi tags to avoid AMUR’s monopoly. Furthermore, traders who did not respect the fixed 8,000 FC / 9,000 FC prices, are prosecuted by the procureur du tribunal de grande instance de Kalima.
Mineral trade monopolies not only exist at SAKIMA concessions, but all over eastern DRC. For example, the gold mines around Nyawaronga (Kalehe territory) are located in ZEA-005. The head of the cooper-ative COMINYA is a trader who holds a monopoly over the gold trade in the concession.
61 CENADEP, La fraude et la contrebande minière dans le territoire de Kalehe (Sud-Kivu): Cas de la chaîne d’approvisionnement de Numbi/Lumbishi, IPIS, April 2018.
Gold mine Checheni around Nyawaronga, Kalehe, South Kivu (Photo: IPIS)

42 43
The perception of being excluded from the price setting process often creates discontent among miners. This discontent can lead to social tensions, and increasing levels of contraband trade. It is important that responsible sourcing efforts prioritise this issue. Various local stakeholders currently feel that re-sponsible sourcing has especially strengthened buyers, and as such weakened their position. (See next section.)
5.2.8. The impact of responsible sourcing
Table 20: Mineral prices, US$/kg, 2016 – September 2018
Cassiterite (US$/kg) Coltan (US$/kg) Gold (US$/gr)
Avg price Median price Avg price Median price Avg price Median price
iTSCi 5.35 5.19 27.74 25.00
Non-iTSCi 4.92 5.00 18.69 15.72
Price difference 8% 4% 33% 37%
Green validated sites 5.37 5.19 27.53 25.00 49.62 48.97
Non-validated sites 5.08 5.03 20.92 20.39 46.88 47.41
Price difference 5% 3% 24% 18% 6% 3%
Table 20 showws that IPIS data gathered on price levels indicates there is a correlation between whether sites are part of respon-sible sourcing efforts on the one hand, and price levels on the other hand.
For coltan the differences are significant, but this seems mainly to be caused by some regional differences. Low coltan prices have been registered in non-validated mines in South Kivu, especially in Shabunda territo-ry. Within Tanganyika, for example, prices differences are much smaller.
For cassiterite and gold, on the other hand, the differences are very limited and insufficient to establish a trend, es-pecially when taking into account the wide range of other factors that have been dis-cussed above ( 5.2.2 - 5.2.7).62
The fact that the impact of responsible sourcing on gold and cassiterite prices is limited, is also con-firmed by some case studies conducted by IPIS and DIIS in 2017 and 2018.63 Below we have summarised some of these findings, including some of the explanations provided by stakeholders. It is however im-portant to note that people’s perceptions about price evolutions are unlikely to reflect all of the factors discussed above.
62 The report for example revealed that more isolated mines have lower prices than more accessible mines, while it has been discussed how responsible sourcing programmes focus relatively more on less isolated mines.
63 IPIS and DIIS teams have visited Nzibira, Kalima, Nyabibwe and Itebero, to look into pricing more in detail, as well as various stakeholders perceptions on ASM and developments over the past few years.
Coltan mine in Kalehe, South Kivu (Photo: IPIS)

44 45
A claim that is made by various local stakeholders is the impact of the ‘canalisation’ of mineral chains:
• Artisanal miners have the perception that responsible sourcing has affected mineral prices as the number of buyers decreased. Both in Nyabibwe and Itebero, ASM stakeholders claimed that the ‘canalisation’ of mineral supply chains has decreased the number of mineral buyers at the level of the mines, and as such affected miners’ bargaining power;
• In Itebero (Walikale Territory), people explained that previously a lot of buyers would come from Bukavu (South Kivu). However, new regulation prohibits the transport of minerals across the provincial border from North Kivu to Bukavu;
• Since several years, within the framework of the fight against ‘conflict minerals’, Kasogohas prohibited the traditional mineral export routes that lead directly to Goma and Bukavu. Nowadays, minerals from Kalima need to go by truck to Kindu, and next by train to Kalemie (discussed under section 5.2.1.). These obligatory trade route is slow, and often subject to a lot of delays. Allegedly, risks linked to the fluctuation of mineral prices during the transport, motivate buyers to offer lower prices in the province.
Another issue raised by some local stakeholders is that recent mining reform has introduced some addi-tional stakeholders, who ask for additional contributions. At Kibindobindo mine (Walikale territory) for example, miners explained how landowners and cooperatives have raised their levies. Consequently, they complain that responsible sourcing has mostly benefited local elites.64
It also seems possible that cassiterite prices outside of the formal supply chains can maintain decent prices - even though in principle they can not be exported legally, which would affect its selling market - as they eventually do manage to end up in responsible supply chains. In section 6.3., the report will discuss the high levels of contamination of responsible supply chains.
For gold, some of the responsible sourcing pilot projects have even reported that they cannot compete with the informal market. Buyers are readily available within the informal sector. These informal gold trad-ers often buy at prices that meet (or sometimes even exceed) the world market price. They are able to offer these prices as they are free of taxation, and informal gold trade is interlinked with money laundering.65
5.3. State control and formalization of the ASM sector
Under this subsection we will look into the level of formalization and state control in the ASM sector.
The DRC legislation recognizes ASM, and defines how the sector should be governed. Many legal provi-sions have however never been fully implemented, which makes it hard to operate legally. Furthermore, many supply chain stakeholders are not very eager to work in the formal sector for reasons such as taxa-tion or the administrative burden. All of this leads to low levels of formalization in the DRC’s ASM sector.
5.3.1. Presence of state services
At first sight, mining site coverage by state agents seems to be quite high. At only 14% of the mines visited by IPIS in 2016-2018, not a single state agency was represented (see table 21). At all of the other mines, there was at least one state service ‘monitoring’ the exploitation. However, this high level of state presence certainly should be nuanced. As illustrated below, their presence is often not permanent, state services often do not fulfill their responsibilities, and at times they even conduct illegal activities.
64 It is however unclear whether this directly impacts the mineral price, rather than the share that miners get of their mineral production.
65 Responsible Artisanal Gold Solutions Forum, Responsible sourcing of artisanal gold from the Democratic Republic of Congo: Lessons Learned from Year 2 of the Responsible Artisanal Gold Solutions Forum, April 2018

44 45
Table 21: Number of state services per mine, 2016-2018
Number of state services present Number of mines Number of workers
0 102 14% 16,495 13%
1 41 6% 6,282 5%
2 171 24% 25,912 21%
3 242 34% 33,057 26%
4 154 22% 44,455 35%
NA 1 0% 0 0%
SAEMAPE - the state service to monitor and support artisanal mining exploitations -was present at 80% of the mines. However, only in 46% of these cases they were permanently present. At 23% of the sites with a SAEMAPE presence, they only visit once a month, or even less. Furthermore, as highlighted in chapter 2, data-gathering in 2016/2018 has focused mainly on areas with a lot of validated sites. It is therefore probable that the high figures of state service presence have been biased (positively) by the sample selection.
In 58% of the sites with SAEMAPE presence, visited in 2018, interviewees report that SAEMAPE does not provide any support to the miners, while this is their mandate. Although that is a very significant num-ber, these figures should be used carefully. Interviewees are sometimes insufficiently informed.
SAEMAPE is entitled to collect taxes. Consequently, when SAEMAPE is present, in 80% of the cases they levy taxes. However, there are often complaints that these taxes are not legitimate, as miners don’t feel they receive anything in return. In some cases, people even claim these taxes are illegal. In 30% of the cases where SAEMAPE agents collect taxes, they (sometimes) fail to provide a receipt.
Another, problematic issue is that state agents at times levy taxes in areas where ASM is not permitted, and as such legitimise illegal exploitation. This is for example the case in some protected areas. IPIS field teams reported taxation by Mining Division agents in mines in the Itombwe Nature Reserve (includ-ing Colline 7, Shakatembo, Colline 5, Kiwandawanda and Lugundu). Furthermore, in the Matenende and Calvaire gold mines, near Kamituga in Mwenga Territory, both SAEMAPE and the Mining Division levied taxes in December 2016, despite the prohibition by the concession holder Banro Corporation.
5.3.2. Carte de creuseur
It is well-known within the sector that miners rarely hold the official artisanal miners’ card. In our survey, at 54% of the mines, less than 25% of the miners held the miner’s card (see table 22).
Table 22: Percentage of miners that hold the artisanal miners’ card, 2016-2018
Number of mines
All (711) iTSCi (272) Green validated (174)
0% 20% 20% 11%
1 - 25% 34% 41% 41%
25 - 50% 11% 10% 10%
50% 3% 6% 2%
50 - 75% 18% 11% 20%
75 - 100% 6% 9% 11%
NA 7% 3% 5%

46 47
Miners explain they consider it too expensive, they do not see the benefit of card ownership, they are afraid of increasing levels of taxation, and they shy away from the administrative burden.
Finally, miners’ unwillingness to register should also be looked at within the context of the wider distrust of the Congolese state. Therefore, purely technical incentives, focusing solely on supply chains, will not be sufficient for miners to legalise their activities.
Table 22 reveals that sites covered by responsible sourcing programmes do not perform any better with regards to card ownership by the miners.
The validated mine Zolazola-D23 is an interesting example of how the absence of miners’ cards is tolerated. An estimated 70% of the miners do not have the artisanal miners’ card. However, these miners pay a small sum to the mining agents to avoid them asking for it. State agents, on the other hand, claim that people do not want to buy the card, and that they cannot insist as many of these miners are former rebels.
5.3.3. Cooperatives
Since 2010, following a ministerial decree, artisanal miners have to be member of a cooperative in order to be entitled to work in the mines.66 As such, the level of implementation of this requirement can also be considered an indicator of the level of formalisation and state control over the ASM sector.
Above, under subtitle 5.1.2, cooperatives have been discussed in detail. That said, it is worth repeating here that there are relatively more iTSCi and validated mines with a cooperative (relatively 86% and 87% of the mines), compared to non-iTSCi mines (66%) and mines that have not been validated (69%).
This indicates that mines within a responsible supply chain are more in line with legal requirements. How-ever, this does not result in better functioning cooperatives. There is very little involvement of artisanal min-ers in ASM cooperatives. Consequently, there is no real difference in the level of cooperative membership.
5.3.4. Taxation
Over the last 15 years many observers have referred to the heavy tax burden as one of the reasons for artisanal miners and mineral traders not to work in the formal sector. Max Impact has for example de-veloped an interesting case study on the legal taxes for a batch of gold from the mine in Maniema up to the point of export in Bukavu. The total tax rate rose up to 25% of the value of the gold at the level of the mine, or 19% compared to the value of the gold at the point of export.
Most stakeholders within the supply chain consider official registration too expensive. Furthermore, working within the formal sector often increases the level of taxation, as it usually includes both formal and informal taxes. Furthermore, people do not see the use of paying these taxes and fees, as in practice they feel they get nothing in return.
Fighting illegal taxation is an important challenge for responsible sourcing efforts, in order to convince people of the added value of working within the formal sector. IPIS data reveals that, in general, respon-sible sourcing efforts have managed to address this issue to some extent, as a higher number of state services have been reported to levy taxes at non-validated and non-iTSCi sites.
At non-iTSCi mines, IPIS teams reported about 19 different authorities (besides Division des Mines, SAE-MAPE and SAKIMA) levying taxes, while they reported about 7 different authorities at iTSCi sites.
The 2016-2018 data also reveal that no more than 12 iTSCi mines out of a total of 272 experienced taxa-tion by actors other than the Mining Division, SAEMAPE and SAKIMA. This was the case for 115 mines out of a total of 439 non-iTSCi mines.67
66 Arrête ministériel n° 0706/CAB.MIN/MINES/01/2010 du 20 septembre 2010 portant mesures urgentes d’encadrement de la décision de suspension des activités minières dans les provinces du Maniema, Nord-Kivu et Sud-Kivu
67 In 73 of these mines, the chefferie levied a tax.

46 47
In its 2016 study on taxation in South Kivu and illegal taxation by state agents, Max Impact den-tified different types of illegal taxation, including: payments that have no legal basis, taxes with a legal basis but levied at an illegal rate, and taxes for which people do not get a receipt.68
With regards to the latter, above we already discussed how, for example, in 30% of the cases where SAEMAPE agents collect taxes, they do not always give a receipt for these taxes. For iTSCi and validated mines alone these percentages are not particularly different, respectively 27% and 33%.
Another important element, it is easier for state agents to levy (legal) taxes in areas which are free from armed actor interference. When state agents suspect that artisanal miners have ties with armed groups, they are not very eager to insist on taxes and registration fees. This is quite common in more insecure areas such as Shabunda. For example, at the non-validated cassiterite mines around Penekusu, state agents claimed they feared repercussions by Raïa Mutomboki. Even in more stabilised areas state agents might experience threats of physical violence. For example, in the validated mine Zolazola-D23, state agents claimed that they were not too stringent as they suspect many miners are former rebels.
Challenges for responsible sourcing with regards to taxation
Despite the positive impact of responsible sourcing on illegal taxation, a closer look at some qualitative case studies shows that a lot of challenges persist.
In several mining areas, there is a strong feeling among ASM stakeholders that responsible sourc-ing has lead to increasing levels of taxation. For example, in Nyabibwe, miners feel that responsible sourcing comes at a cost, including payments to the cooperatives and more taxes. Furthermore, in their view, they do not get anything in return for these contributions, except for the Basket Fund69, which they consider rather limited, and has recent-ly been cancelled.
The CENADEP/IPIS report70 on Numbi and Lumbishi (Kalehe territory, South Kivu) reveals that miners suffer from high taxes by SAEMAPE at the green validated mines within SAKIMA’s exploitation permit 2598. SAKIMA is a Congolese state miner which lacks the capacity to start industrial exploitation, and as such tolerates artisanal miners at its concession. In exchange SAKIMA levies a 10% ‘frais rémunératoires’ at the value of the mineral production. While SAEMAPE received a percentage of these frais rémunéra-toires to support artisanal miners on SAKIMA’s concession, they also asked miners directly for a payment of 0.3 US$/kg for the same service, i.e. supporting the miners. Early 2018, however, SAEMAPE addressed this issue, and since it no longer receives its percentage from SAKIMA. Nevertheless, for miners little has changed as they still have to pay the 10% to SAKIMA, and the 0.3 US$/kg to SAEMAPE. 71
At several validated mines, there have even been reports of the persistence of clear illegal taxation by state services.
68 Max Impact, Rapport de l’étude sur les paiements dans le secteur minier artisanal au Sud Kivu, commissioned by GIZ, January 2016.
69 This is an earmarked budget for community investments funded by contributions from mineral exporters, and managed by local governments and communities.
70 CENADEP, La fraude et la contrebande minière dans le territoire de Kalehe (Sud-Kivu): Cas de la chaîne d’approvisionnement de Numbi/Lumbishi, IPIS, April 2018
71 CENADEP, La fraude et la contrebande minière dans le territoire de Kalehe (Sud-Kivu): Cas de la chaîne d’approvisionnement de Numbi/Lumbishi, IPIS, April 2018, pp. 15-16.
“ Les services veulent récolter là où ils n’ont pas semé”
People complain about taxes at ‘Amanyambele amont’.

48 49
Some examples of illegal taxation at validated mines
In Maniema province, the extortion and illegal taxation by mining state agents is striking, especially in Lubutu territory. In the Kayeye mine (Pangi territory), state agents allegedly control some pits where they sometimes make miners work for free, thereby profiting from the fact that these miners are not registered.
In the Amakinga and Gonga iTSCi mines, near the trading hub Tshamaka (Lubutu territory), Mining Police and SAEMAPE both demand some cassiterite on a weekly basis. Also at the Ogobinako iTSCi mine, in Punia territory, pit owners regularly have to pay a fee to mining state agents.
In Lubutu, a PNC officer has been accused of installing a monopoly over gold purchases at the Fimbonafimbo mine. A high-ranking officer of the Auditorat Militaire in Lubutu has also been accused of being responsible for extortion at mines and arbitrary arrests.
Besides the widespread misbehaviour of police elements in Maniema province, there have been similar reports in Numbi (South Kivu), and one near Manono (Tanganyika). In some mines in Numbi, mining police allegedly extort illegal miners. Reported penalties range from a few cigarettes, up to 20,000 FC per miner.
At the iTSCi mine Ngobo/la mort, near Manono, Mining Police allegedly levy a 1,500 FC tax per miner at least once per week.
Finally, additional regulation, includ-ing validation, might have indirect negative effects in a context with-out good governance. Powerful ac-tors instrumentalise the new regula-tion to serve their personal gains. For example, in the village of Nyantam-ba, in the Itebero area (North Kivu), people explained that ANR agents and policemen have started inspect-ing mineral stocks in houses since mines have been validated in Itebe-ro. If they find minerals, these agents rob the people: they claim it is illegal to hold minerals in the village as the surrounding mines have not yet been validated.
Tax coutumier
Customary taxes are also quite random in eastern DRC’s ASM sector. According to the law, howev-er, customary authorities can only collect the ‘tax d’étalage des minerais’ at the level of the trading hub, in centres de négoce or entités de traitement. The customary authority has no right to collect taxes at the mine.72
72 Bahati Bahalaokwibuye C., Hybridation normative et institutionnelle dans les coopératives minières. Entre pluralisme juridique et ineffectivité du droit coopératif congolais, 2017
Cassitérite mine Numbi, Maniema South Kivu (Photo: IPIS)
Table 23: Percentage of mines with a customary tax, per province
province Customary tax
Haut-Lomami 8%
Ituri 38%
Maniema 0%
North Kivu 8%

48 49
Nevertheless, IPIS’ 2016/2018 data reveal that customary authorities levy taxes at a considerable number of mines in Ituri, Tanganyika, and especially in South Kivu.
Within South Kivu, these customary taxes are levied in particular in the territories of Mwenga (83%), Shabunda (74%), Idjwi (57%), Kabare (50%) and Fizi (56%).
There is no fixed level or modality for customary taxes. Nevertheless, these taxation levels are often very well balanced, in order not to discourage miners to work. The text box below provides a short overview of some modalities that IPIS teams have encountered.
Examples of customary taxes
At the validated Nyakabindi gold mine (Walungu Territory), the customary chief decided to ask 50 US$ per person to work at the mine. Consequently, from October 2016 to April 2017 the number of miners decreased from 540 to 45;
Taxes are sometimes levied on production volumes, e.g. 0.1 US$/kg of cassiterite, or 10% of production, or 1000 FC per 50kg bag. For example, at the iTSCi mines around Manono (Tanganyika) and Kanunka (Haut-Lomami), the customary authority charges a 1% tax;
At other sites there is rather a flat-rate tax per mine, pit or actor: E.g. 8,000 FC per month for the entire mine, or 500 US$ per year for the entire mine, 30 US$ per PDG per year, or 30,000 FC per pit per year, 1 kg of cassiterite per pit per month, or 1,000 FC per miner per year. For example, at the validated gold mines Malinji, Madirhi, and Changoboka (Walungu Territory) the chefferie asks for 20 US$ per month per pit;
In the Zolazola-D3 mine, near Nzibira, traders selling goods or food at the mine pay a small sum to the landowner as well as the customary chief. As there is very little production for the moment, the few traders that arrive do not pay any taxes. When production increases, each trader pays between 100 FC and 500 FC per day. Additionally, each productive pit has to pay 10 US$ per month to the customary chief, and miners work one day per week for him.

50 51
6. RESPONSIBLE SOURCING CHALLENGESUnder this chapter, the report will discuss some challenges that are particularly linked to responsible sourcing, including difficulties with regards to traceability, and the high risks for contamination of clean supply chains.
6.1. Mineral traceability at a distance
IPIS field teams reported at 42% of the visits between 2016 and 2018 to iTSCi mines, that tagging was not done at the level of the mine. The main reason for this seems to be the limited number of state agents.
Consequently, tagging is often done at a (large) distance from the mine. For example, at the 3T sites in the Etaetu mining area (Lubero Territory), all mineral production is transported to the trading hub of Bandulu. Because of the low number of SAEMAPE agents in the area, it is only in Bandulu that state agents can tag all of the mineral bags. Similar observations have been made in many other places, e.g. Ngungu (Masisi Territory), Kailo Territory, and Punia Territory.
Alternatively, it is quite common that miners stock minerals at the site, or in their houses, awaiting SAEMAPE agents to pass by to tag the minerals.
In some cases these state agents pass by regularly, for example once per week or every two weeks, in order to tag the mine’s production. However, when there is an important production, miners can call upon the SAEMAPE agents to come sooner. In some other mines, state agents reportedly only pass by when they are called by the miners.
In Pangi territory (Maniema), surveyors reported that state agents do not tag mineral bags at the level of the mining site, and that tagging is regularly done at big distances (allegedly up to 10 kilometres) from the mine, e.g. at Lutala mine. During the visits in 2017, it even seemed quite common that négociants held the tags themselves (after they bought them from the state agents), and auto-tagged their min-eral bags. The latter practice has also been noted in Mwenga territory, around the Kidasa trading hub.
The above issues, including tagging at large distance from the mine, stocking of minerals, and auto-tag-ging by négociants, raise questions about the effectiveness of traceability. An interviewee in Itebero ex-plained that traceability exists between the ‘support village’ and the mineral trading hub, but does not exist between the mine and the ‘support village’. The above observations seem to reveal that this issue is quite prevalent.
6.2. Commercialisation of tags
Another issue that surfaced regularly is illegal taxation linked to mineral traceability. Especially around Kalima (Pangi territory), SAEMAPE agents have developed a practice which is omnipresent in the area. These agents sell tags to négociants, or sometimes cooperatives, for 500 FC or 1,000 FC per piece. Sub-sequently, négociants can tag their own minerals. Furthermore, selling of tags has also been reported in the Itebero area.
It is quite paradoxical that a mechanism to fight illegal interference has been abused to levy illegal tax-es. It illustrates once again how new regulation and technical interventions can be instrumentalised by state agents to abuse their position of power.
In other areas as well, tags have provided an additional source of income for state agents, albeit less striking. For example in the Itebero area, miners regularly call state agents to tag minerals. In order to motivate the SAEMAPE agent to come over, the miners paid him a ‘voluntary’ contribution. These small illegal contributions should however be assessed within the specific context of eastern DRC, where state agents in other sectors also levy taxes in exchange for public services. The levels of coercion to demand such taxes is an important element when assessing the gravity of the violation.

50 51
6.3. Contamination of responsible supply chains
The issues above reveal that there is a high risk of contamination of responsible supply chains. During IPIS’ mine visits it was also clear that this risk should not be underestimated.
In some cases, these contaminations do not involve minerals that have been affected by armed interfer-ence, or serious abuses. For example, at the non-validated cassiterite mine Andamane (Pangi territory), IPIS spotted iTSCi tags of Lusolo-Mutopia. The latter is just a few kilometres away from Andamane, and the mine is not affected by armed interference or human rights violations.
However, in other areas, risks of contamination are more problematic. The text box lists a few examples where contamination is linked to armed interference. It is not an exhaustive list, but illustrates the scale of the problem.
Examples of contamination of responsible supply chains
In Lubutu territory, minerals are allegedly tagged as originating from the validated mine Mapamboli, while they are coming from areas under control of Mai Mai Simba, or from the neighbouring territory of Walikale. At the time of the mine visit in August 2017, state oversight was reportedly very limited at the mine. SAEMAPE agents only passed by once per month, and tagging was done at the village Osso, which is 4 hours by foot from Mapamboli.
Also in Lubutu, the gold mine Kanda ya nini, where about 1,500 miners are working, also produces some cassiterite which is allegedly tagged as originating from the Ntufia area. At Kanda ya nini, however, some army people are allegedly involved in mineral trade, and there have been reports of arbitrary arrests and extortion of miners.
In Mwenga territory, interviewees reported that minerals coming from the mines inside Itombwe forest are tagged in Mwenga town. IPIS teams visited six of these mines73 in late 2016, and reported about an estimated 1,100 miners. Furthermore, there were also reports about illegal taxation by FARDC units at some of these mines. Reportedly, these soldiers were at the mines at the demand of the miners, in order to watch over their security. In exchange, miners paid them a small ‘ration militaire’.
In Masisi territory, the validated coltan mines Katovu and Rwandanda are located in an area controlled by the Nyatura rebels. In September 2018, the mines employ about 50 miners, who allegedly have to work one day per week for the rebels. The minerals are reportedly transported to the village Kibabi, to be tagged over there.
73 Zombe (Colline 7, Colline 5, and Colline 4), Shakatembo, Kiwandawanda and Lugundu.
Gold mine Etogo in Lubutu, Walikale
“ La forêt n’a pas de portes ni fenêtres”
Phrase used by several respondents in the Itebero area, to illustrate it is nearly impossible to bar minerals from the Kahuzi Biega National Park entering responsible supply chains.

52 53
In the Itebero area, Walikale territory, there are several productive cassiterite mines which are located in Kahuzi Biega National Park (even though locals contest the park’s boundaries). These minerals are being tagged through the validated mines such as Bukumo or Idambo.
In many cases, contamination of responsible supply chains is not only due to absence of state control (e.g. absence of state agents at the mine), but also tolerated, or in some cases even organised by state agents.
For example, in Pangi Territory, state actors at the roadblock leading up to Kalima tolerate mineral trans-ports that are not accompanied by the necessary Autorisation de Transport des Minerais in exchange for 5,000 FC per lot. Or they allow night transports to pass by for an amount between 20,000 FC and 50,000 FC.
In Walikale Territory, on the Makana-Biruwe axis, agents of several state services allegedly facilitate the illegal transport of untagged minerals, in order to enter the responsible supply chain in Biruwe.

52 53
7. CONCLUSIONS
7.1. Armed interference
Responsible mineral sourcing initiatives have had a positive impact on the security of certain ar-tisanal mining communities. That impact continues to grow, albeit at a relatively slow pace, but seems to be limited to less isolated areas.
Indeed, more than seven years after the introduction of the first responsible sourcing initiatives in east-ern DRC, both armed conflict and armed interference at mining sites remain critical impediments to the stabilization and development of the region. Furthermore, the bad reputation of eastern DRC’s arti-sanal mining sector will not disappear as long as the perception persists that the area produces ‘conflict minerals’.
The challenges have remained unchanged. On the one hand, armed conflicts continue to flare up. Armed groups, such as the FDLR, FRPI, ADF and Mai Mai Yakutumba, have been around for decades and maintain the capability to cause unrest in large areas, including at mining sites and mineral trad-ing centres. The FARDC has launched repeated military operations against them, but has been unable to decisively defeat them. As we have seen in chapter 3, most of these armed conflicts appear to be unrelated to mining activities. Nevertheless, they contribute to the overall insecurity in eastern DRC and reinforce its reputation as a region where it is nearly impossible to conduct ethically responsible business. In addition, some of the frontlines do appear to be related to the control over mining sites. The NDC-R, for example, has specifically targeted mining areas controlled by rival armed groups.
On the other hand, the problem of (armed) criminal networks interfering with artisanal mining activities persists. Although some of the armed groups are deeply involved as well, the main armed faction within these criminal networks are often Congolese army units. The FARDC continues to levy illegal taxes on various mining activities in all seven provinces visited by IPIS’ research teams over the past 5 years. In addition, its interference often includes more indirect involvement such as pit ownership, pre-financing of teams of artisanal miners or outright extortion. Some of these army units have absolute-ly no reason to deploy their men at mining sites. For example, IPIS has come across several cases of inter-ference by a high-ranking officer of the Military Justice.
Although the two challenges above are linked, the re-lation is in most cases indirect. The geographic dis-tribution of the widespread phenomena of armed interference at mining sites differs greatly from the distribution of armed conflict. In areas such as Djugu, Mambasa, Northern Lubero, Mwenga and the north of Maniema Province, the armed interference by criminal networks has existed for years, even though there has been no recent ongoing armed conflict. In many cases, this is just another form of corruption, which is wide-spread throughout the DRC and present in all econom-ic activities. Nonetheless, the armed interference in non-conflict areas is facilitated by the past and cur-rent armed conflicts throughout eastern DRC. State authority is generally weak, criminal networks have consolidated their control over local economic activi-ties and armed groups or army units are deployed in virtually every corner of the area.
In a smaller number of cases, mining areas are di-rectly affected by armed conflict and control over
Gold site 'Nyawarongain' Chabange village
in Kalehe, Lubero.

54 55
mining activities appears to be an important military objective. The NDC-R’s focus on mining areas has already been raised above. In addition, mining areas may have been an important focus of some FARDC operations as well. In the course of 2017 and 2018 in northern Shabunda, for example, the FARDC pushed back Raia Mutomboki groups after which it remained deployed throughout the territory, includ-ing at some mining sites. Or in the territory of Kalehe, FARDC’s presence to discourage non-state armed groups activities, leads to additional illegal taxation. Such cases show how difficult it is to fully resolve the issue of armed interference without resolving the issue of armed conflict. Many mining areas are affected by insecurity caused by armed groups. As a consequence, the Congolese army is the most obvious candidate to move into the area and restore security.
This does not always lead to a problematic situation. Indeed, not all of the armed interference is nec-essarily abusive or linked to criminal networks. In many of the more ‘moderate’ cases of FARDC inter-ference in artisanal mining activities, IPIS’ data indicates that local stakeholders accept and sometimes welcome the army’s presence. Interviews conducted by IPIS’ research teams indicate that in some cases the local population considers it reasonable that the FARDC troops rely on local economic activi-ties to sustain themselves.
7.2. Mining and mineral trade
Besides the decrease of armed interference, there is also an impact on mineral trade in areas where re-sponsible sourcing programmes have been implemented. Responsible sourcing efforts, and the wider reform of the ASM sector, have had an important effect on mineral supply chains.
IPIS data reveals that responsible sourcing efforts have managed to address the issue of illegal taxa-tion to some extent. A higher number of state services have been reported to levy taxes at non-validated and non-iTSCi sites. Furthermore, ASM stakeholders testified to IPIS field teams how the sector is less ‘disorganised’ than before, and how fraud has decreased.
Very few interviewees, however, reported that these changes improved their personal situation. In fact, the majority of interviewees was convinced these changes mostly benefited the local elite.
An important initiative to formalize the ASM sector has been the obligation for artisanal miners to or-ganise themselves in cooperatives. Even though validated mines have more cooperatives, cooperative membership is equally low. Often, cooperatives are subject to elite capture, they establish trade monop-olies, and they do not provide any support to miners. Consequently, they have become a vehicle used by local elites to acquire access to mineral resources. Subsequently, it has affected ordinary artisanal miners’ access to the mines, and further weakened their position.
Interviewees, including diggers and local community members, stated that cooperatives and the elites that preside them, are the main beneficiaries of responsible sourcing.
Except for coltan, responsible sourcing has not managed to provide better prices for minerals. IPIS has found no significant price differences between validated mines and non-validated mines. It has been discussed how a wide range of other factors should be taken into account to understand pricing. At the local level, power relations and bargaining power between supply chain actors define actual min-eral prices. Various stakeholders have reported how mining reform and responsible sourcing have led to a better ‘canalisation’ of mineral supply chains, but has also increased some buyers’ control over the sector. The latter has increased unilateral price-setting by mineral buyers.
So far, responsible sourcing efforts have not sufficiently recognised the dire need to improve gov-ernance, and hardly address the limited capacity of mining state agencies, particularly SAEMAPE. State services have rightly been granted the authority to guard over responsible sourcing. However, the re-luctance to address the difficulties they face, seriously affects successful implementation of responsible sourcing. Meanwhile, there is widespread distrust of the government and its services due to the lack of support that these services provide, despite the high levels of taxation. It is indeed interesting to see that agents of various state services have made use of the new provisions of responsible sourcing, and the authority it gave them, to levy additional taxes.

54 55
As a consequence of these developments, many ASM stakeholders do not see the incentive to work within the formal sector. Only a limited number of miners register officially (through the acqui-sition of the miner’s card), and many miners do not join the cooperatives that are present at the site. In addition, the widespread corruption among state agents further enables illegal mineral supply chains to persist, and to contaminate ‘responsible supply chains’.
7.3. How sustainable is the situation?
Responsible sourcing initiatives have proven that it is possible to source minerals (more) ethically from eastern DRC, despite the security challenges. All of the above trends are however a strong reminder that the current situation is not sustainable.
Responsible sourcing efforts have improved the personal security of groups of artisanal miners in several provinces. However, these are relatively fragile gains and the underlying problems remain unchanged. Armed conflicts, including those related to the control over natural resources, persist and will con-tinue to affect the region’s reputation. In addition, armed interference by criminal networks is wide-spread in areas without armed conflict.
Furthermore, although they have increased the level of organization of ASM, responsible sourcing seems to have been particularly instrumental to local elites. Miners claim it has not brought them any additional revenues. The limited impact of responsible sourcing on local development once again raises the question how sustainable the current situation is.
Limited control over the ASM sector also hinders the successful implementation of mining reform and true local ownership over responsible sourcing. Technical solutions are clearly not sufficient to address deep-rooted problems in the sector, such as informality, corruption, bad environmental management, etc. If responsible sourcing initiatives want to increase their credibility and sustainability, more attention should be granted to the wider problems linked to mining governance in eastern DRC.
It is an important question to ask what realistically can be expected from responsible sourcing initiatives. Is the current outcome enough or could more be done?
On the one hand, it is unlikely that responsible sourcing will resolve an armed conflict. From the above it is clear that the ongoing armed conflicts often seem unrelated to mining activities. On the other hand, re-sponsible sourcing should be more ambitious in its efforts to increase sustainability, for example through their integration in wider stabilization efforts to address insecurity linked to armed group activities.
Furthermore, it is insufficient if responsible sourcing initiatives solely rebuild consumers’ confidence in DRC’s mineral production. Responsible sourcing initiatives should invest in responsible mining practices and the wider development impact linked to mineral supply chains. In order to increase sustainability, responsible sourcing efforts should increase their level of engagement towards national and local gov-ernments in eastern DRC. Externally controlled clean supply chains in a context of failing governance will not persist. It is a shared responsibility to ensure that in-country authorities manage to actually control responsible sourcing.

Independent research and
capacity building for durable peace,
sustainable development
and human rights
V.U
. Fili
p Re
ynie
rs, D
irect
eur,
IPIS
, Ita
liële
i 98A
, 200
0 A
ntw
erpe
n I L
ayou
t: S
AKA
DO
I D
/201
9/43
20/0
7