Many People and Less Poverty in 2050: Satisfying Food ... Long-Term... · Many People and Less...
16
Many People and Less Poverty in 2050: Satisfying Food Demand in the Future Douglas Southgate Ohio State University [email protected]
Transcript of Many People and Less Poverty in 2050: Satisfying Food ... Long-Term... · Many People and Less...

Many People and Less Poverty in 2050: Satisfying Food Demand in the Future
Douglas SouthgateOhio State [email protected]

Demand Drivers
• Population growth: Unprecedented during the second half of the twentieth century, mainly due to an “escape from premature mortality,” but clearly decelerating now, because of diminished human fertility.
• Increased per-capita consumption: Particularly in impoverished settings, diets have improved as incomes have risen. In particular, higher incomes have caused per-capita consumption of livestock products (and feed grains) to increase. However, these trends, like population growth, will not continue indefinitely.

Global Population, 1800-2050
0
2
4
6
8
10
12
1 2 3 4 5 6 71800 1850 1900 1950 2000 2050
10.46
9.15
7.96
Popu
latio
n (m
illio
ns)
0.98 1.26 1.65
2.474.07
6.06
6.83
Year


Revolution in Human Fertility
Births per woman in: 1982 2007High-Income Nations 1.9 1.8
E. Europe & Former USSR 2.5 1.7
E. & S.E. Asia 3.1 1.9
S. Asia 5.2 2.9
Latin America & Caribbean 4.2 2.4
Middle East & N. Africa 6.2 2.8
Sub-Saharan Africa 6.7 5.1

Growth in GDP per Capita (% p.a.)
Region (2007 GDP p.c., PPP-adj.) 1965-99 2000-07
High-Income Nations ($36,341) 2.4 1.7
E. Europe & ex-USSR ($11,262) 0.0 6.1
E. & S.E. Asia ($4,969) 5.6 8.0
S. Asia ($2,532) 2.4 5.5
Lat. Am. & Caribbean ($9,678) 1.4 2.1
Mideast & N. Africa ($7,402) 0.1 3.2
Sub-Saharan Africa ($1,870) -0.2 2.8


Kg of Grain Consumedper Capita (Log scale)
China
India
1,000
367
135
45
18
RussianFederation
400 1,100 2,900 8,100 22,000 59,800GDP (PPP$) per Capita
Brazil
Grain Consumption and Living Standards

Global Supply Trends, 1961 to 2007
• Farmed Area:
43.0% increase in land planted to crops;
9.4% expansion in grazing land; and
10.7% increase in total agricultural land use.
• Average yield of cereals (> 60% of human diet, including feed grains) has more than doubled.
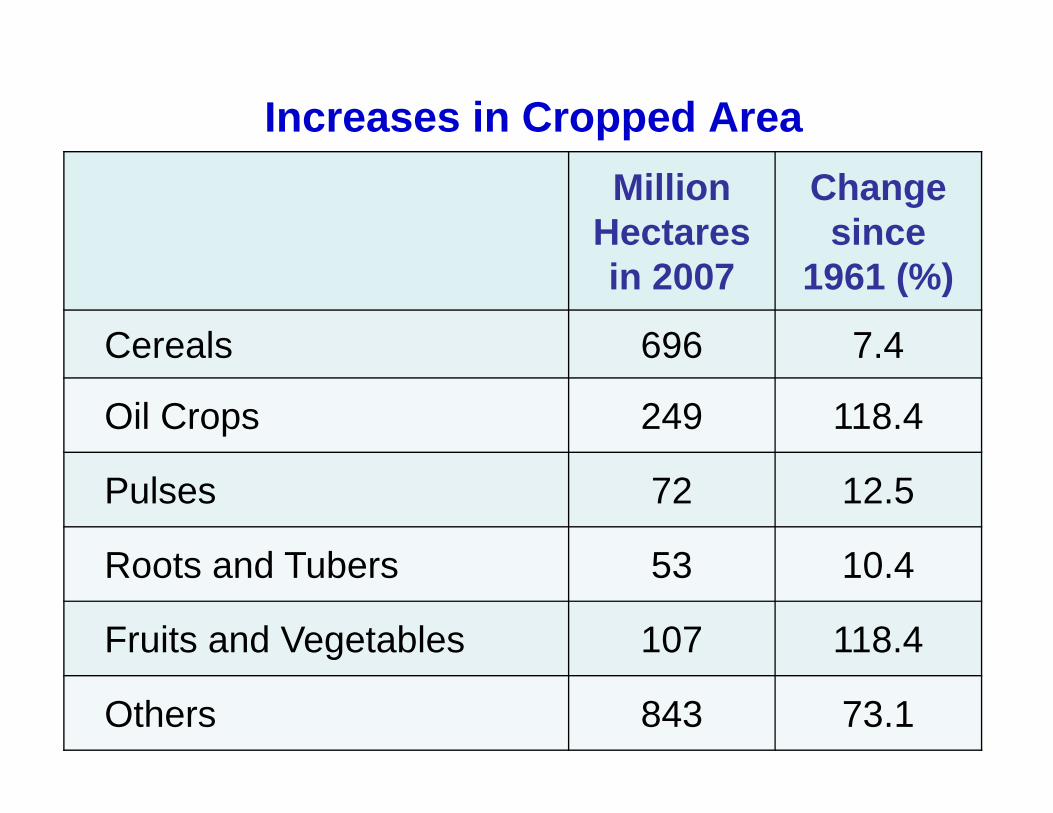
Increases in Cropped AreaMillion
Hectares in 2007
Changesince
1961 (%)
Cereals 696 7.4
Oil Crops 249 118.4
Pulses 72 12.5
Roots and Tubers 53 10.4
Fruits and Vegetables 107 118.4
Others 843 73.1

Growth in Global Cereal Yields
0.0
0.5
1.0
1.5
2.0
2.5
3.0
3.5
4.0
1960 1970 1980 1990 2000 2010Year
Met
ric to
ns p
er h
ecta
re

Diminishing Food Scarcity
• Gains in per-capita production from 1961 to 2007:
+98% in Asia;
+73% in South America; and
-2% in Sub-Saharan Africa.
• Real prices of grain declined by 75% between 1950 and middle 1980s.

Real Grain Prices (2000 $), 1950 to 2008
0
200
400
600
800
1000
1950 1955 1960 1965 1970 1975 1980 1985 1990 1995 2000 2005 2010
Rice
Wheat
Corn
Year
$ (2
000)
/mt
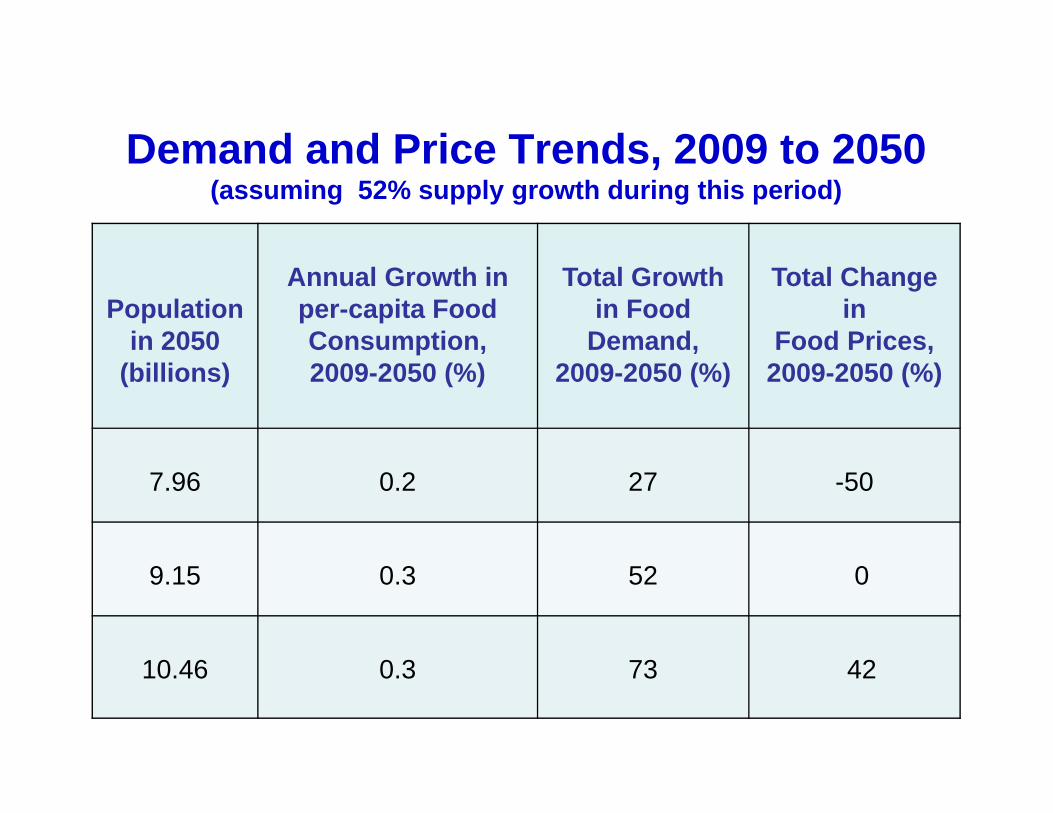
Demand and Price Trends, 2009 to 2050(assuming 52% supply growth during this period)
Populationin 2050
(billions)
Annual Growth inper-capita Food Consumption,2009-2050 (%)
Total Growthin Food
Demand,2009-2050 (%)
Total Change in
Food Prices,2009-2050 (%)
7.96 0.2 27 -50
9.15 0.3 52 0
10.46 0.3 73 42

Future Challenges in the Food Economy
• Climate change.
• Water scarcity and pricing.
• Technological improvement.
• Biofuel development.
• China and India