Manure treatment Technologies - Chesapeake Bay
130
MANURE TREATMENT TECHNOLOGIES Recommendations from the Manure Treatment Technologies Expert Panel to the Chesapeake Bay Program’s Water Quality Goal Implementation Team to define Manure Treatment Technologies as a Best Management Practice ABSTRACT Treatment technologies are used on livestock farms for three main purposes: to stabilize manure organic matter, to make manure easier to handle, and to generate on-farm energy. While performing these functions, manure treatment technologies profoundly affect the manner in which nutrients flow through the farm and environment. This report focuses on six broad categories of treatment technologies: Thermochemical Processing, Composting, Anaerobic Digestion, Settling, Mechanical Solid Liquid Separation, and Wet Chemical Treatments. The ability to reduce nitrogen by volatilization and to separate both nitrogen and phosphorous to a stream that is likely to be utilized off-farm is quantified for each technology. Transformation of nutrients to more plant-available forms is also discussed for each technology. First draft released for CBP partnership review: 3/31/16 Approved by the Agriculture Workgroup: TBD Approved by the Watershed Technical Workgroup: TBD Approved by the Water Quality GIT: TBD
Transcript of Manure treatment Technologies - Chesapeake Bay

MANURE TREATMENT
TECHNOLOGIES Recommendations from the Manure Treatment
Technologies Expert Panel to the Chesapeake Bay
Program’s Water Quality Goal Implementation Team to
define Manure Treatment Technologies as a Best
Management Practice
ABSTRACT Treatment technologies are used on livestock farms
for three main purposes: to stabilize manure organic
matter, to make manure easier to handle, and to
generate on-farm energy. While performing these
functions, manure treatment technologies profoundly
affect the manner in which nutrients flow through the
farm and environment. This report focuses on six
broad categories of treatment technologies:
Thermochemical Processing, Composting, Anaerobic
Digestion, Settling, Mechanical Solid Liquid
Separation, and Wet Chemical Treatments. The
ability to reduce nitrogen by volatilization and to
separate both nitrogen and phosphorous to a stream
that is likely to be utilized off-farm is quantified for
each technology. Transformation of nutrients to
more plant-available forms is also discussed for each
technology.
First draft released for CBP partnership review: 3/31/16
Approved by the Agriculture Workgroup: TBD
Approved by the Watershed Technical Workgroup: TBD
Approved by the Water Quality GIT: TBD

2
Executive Summary
The Manure Treatment Technologies Expert Panel convened in December 2014 and over
subsequent months worked to evaluate the nutrient reduction benefits associated with the
various categories of manure treatment technologies described in this report, specifically:
1. Thermochemical Conversion 2. Composting
3. Anaerobic Digestion
4. Settling
5. Mechanical Solid-Liquid Separation
6. Wet Chemical Treatment
The panel defined individual technologies within each category. Using data available in the
literature, the panel determined how each defined technology affects and transforms nitrogen
and phosphorus in the manure stream. The panel also chose to describe how the technology
affects manure organic matter in most cases.
The panel chose to approach each manure treatment technology as a Black Box (Figure ES.1).
As shown in Figure ES.1, nutrients are not typically removed by manure treatment
technologies. Rather treatment technologies transfer manure nutrients to three possible flow
paths (arrows leaving the box in Figure ES.1). Nutrients (both nitrogen and phosphorus) often
remain in treatment flow paths to be utilized on-farm via application to crops and pasture.
Nitrogen can be transferred (volatilized) to the atmosphere (dashed arrow in in Figure ES.1) as
either nitrogen gas (N2), ammonia (NH3), or various oxides of nitrogen (NOx). Nutrients (both
nitrogen and phosphorus) can be separated from the main manure flow path and transferred to
another flow path, which is more likely to be utilized off-farm.
Figure ES.1. Manure Treatment Technologies as a “Black Box”
Manure
Treatment
Technology
Nutrients
Entering
Nutrients Remaining
In the Main Flow Path and
Used On-farm
Transfer of Nitrogen to the
Atmosphere (Volatilization)
Separation of Nutrients to a
Flow Path More Likely to be Used
Off-Farm

3
The panel chose Mass Transfer Efficiency as the method to express how manure treatment
technologies alter nutrient flows. In terms of the black box given in Figure ES.1, mass transfer
efficiency is calculated as:
Mass Transfer Efficiency = (Mass of Nutrients in a Flow Path Leaving the Box) X 100 ES.1
(Mass of Nutrients Entering the Box)
Three specific transfer efficiencies were calculated for each technology: Nitrogen Volatilization
Efficiency (NVE), Nitrogen Separation Efficiency (NSE), and Phosphorus Separation Efficiency
(PSE). Equations used to calculate these efficiencies are given in ES.2, ES.3, and ES.4.
NVE = (Mass of Nitrogen Transferred to Atmosphere) X 100 ES.2
(Mass of Nitrogen Entering the Treatment Technology)
NSE = (Mass of Nitrogen Separated from Main Flow Path) X 100 ES.3
(Mass of Nitrogen Entering the Treatment Technology)
PSE = (Mass of Phosphorus Separated from Main Flow Path) X 100 ES.4
(Mass of Phosphorus Entering the Treatment Technology)
Mass Transfer Efficiency Recommendations
Two levels of mass transfer efficiencies are recommended by the panel for use by the
Chesapeake Bay Program:
1. Default Transfer Efficiency (Level 1) to be used when the only things known
about a treatment system are the manure and treatment technology type.
2. Defined Transfer Efficiency (Level 2) to be used when the manure type is known
and pertinent operating conditions of the treatment technology are known.
A third level of mass transfer may be used by the Chesapeake Bay Program if monitoring data
exists for the treatment system in question:
3. Data Driven Transfer Efficiency (Level 3) to be used when actual monitoring
data for a particular farm is available.
While the panel provides values about the NVE, NSE and PSE wherever possible, only
technologies that remove nutrients from the primary manure stream can receive a reduction
efficiency in the Phase 6.0 Chesapeake Bay Watershed Model. Only those technologies with a
NVE value (i.e., volatilization) remove nitrogen from the manure via the treatment technology.
“Removal” in this case means that the nitrogen is no longer present in the treated manure that
is available for field application or transport according to model procedures that occur post-
treatment. The following manure treatment practices may be reported to the National
Environmental Information Exchange Network (NEIEN) for credit in a Phase 6 progress
scenario or reported to the CBPO for creditused in a planning scenario:

4
Table ES.1. Manure Treatment BMPs eligible for crediting in the Phase 6.0 Watershed
Model and associated TN reduction
Practice Number Practice Category Technology Specifications*
TN Removal
(%)
MTT1† Thermochemical Slow Pyrolysis 25
MTT2 Thermochemical Fast Pyrolysis** 75
MTT3 Thermochemical Gasification-Low Heat 25
MTT4 Thermochemical Gasification-High Heat** 85
MTT5 Thermochemical Combustion 85
MTT6 Thermochemical Combustion-High Heat** 95
MTT7† Composting In-Vessel and Rotating Bin- Standard 10
MTT8 Composting In-Vessel and Rotating Bin- C:N>100** 11
MTT9 Composting In-Vessel and Rotating Bin- C:N<100** 13
MTT10 Composting Forced Aeration- Standard 25
MTT11 Composting Forced Aeration- C:N>100** 28
MTT12 Composting Forced Aeration- C:N<100** 32
MTT13 Composting Turned Pile and Windrow- Standard 25
MTT14 Composting Turned Pile and Windrow- C:N>100** 28
MTT15 Composting Turned Pile and Windrow- C:N<100** 32
MTT16 Composting Static Pile and Windrow- Standard 26
MTT17 Composting Static Pile and Windrow- C:N>100** 29
MTT18 Composting Static Pile and Windrow- C:N<100** 33
MTT19 Directly Monitored Monitored
* Definitions for specific thermochemical and composting technologies can be found in the report in
Sections 4 and 5, respectively.
**Information about process factors, as described in Section 4, pages 29 - 32, and Section 5, pages 43-
48, is needed to report these BMPs †MTT1 represents the default practice Thermochemical treatment systems, and MTT7 represents the
default for composting treatment systems.
[Editor’s note that will be removed in final version: The values in Table ES.1 and Table A.2 in
Appendix A will be revised at a future date to reflect a future decision from the Modeling
Workgroup on how to simulate and account for emissions and redeposition of reactive
nitrogen from BMPs within the watershed, including but not limited to the BMPs recommended
by this panel.]
Although manure treatment technologies without a NVE value do not remove nutrients from
the overall manure stream that is land applied or transported, they create numerous
environmental benefits. By stabilizing and reducing organic matter, they reduce nuisance
conditions and make plant nutrients more marketable for off-farm use. Manure treatment
technologies also transform nutrients, which, in most cases, enhance plant nutrient uptake.

5
Table of Contents 1. Background: Charge and Membership of the Expert Panel ................................................................ 6
2. Background: Livestock Manure Treatment in the Bay Watershed ................................................. 89
3. Treatment Technologies in Manure Handling Systems ................................................................ 1213
4. Thermochemical Conversion Processes .......................................................................................... 2223
5. Composting ............................................................................................................................................ 3837
6. Anaerobic Digestion ............................................................................................................................. 5553
7. Settling ..................................................................................................................................................... 7371
8. Mechanical Solid-Liquid Separation ................................................................................................... 8684
9. Wet Chemical Treatment .............................................................................................................. 106104
10. Data Collection and Reporting Protocols for Reporting Data Driven (Level 3) Transfer
Efficiencies .............................................................................................................................................. 120118
11. Future research and management needs .................................................................................. 127124
12. BMP Verification for manure treatment systems ................................................................... 128125
Appendix A Technical Appendix for Scenario Builder
Appendix B Conformity with BMP Protocol
Appendix C Report from AgWG ad hoc subgroup on manure treatment technologies
Appendix D Minutes from the expert panel
List of common acronyms used in this document
AFO Animal Feeding Operation
AgWG Agriculture Workgroup
BMP Best Management Practice
CAFO Concentrated Animal Feeding Operation
CBP Chesapeake Bay Program
CBPO Chesapeake Bay Program Office
CBWM Chesapeake Bay Watershed Model
EPA U.S. Environmental Protection Agency
MTT Manure Treatment Technology
NEIEN National Environmental Information Exchange Network
NSE Nitrogen Separation Efficiency
NVE Nitrogen Volatilization Efficiency
PSE Phosphorus Separation Efficiency
TCC Thermochemical Conversion
TN Total Nitrogen
TP Total Phosphorus
TS Total Solids
TSS Total Suspended Sediment
USDA U.S. Department of Agriculture
USDA NRCS U.S. Department of Agriculture, Natural Resources Conservation Service
VS Volatile Solids
WQGIT Water Quality Goal Implementation Team
WTWG Watershed Technical Workgroup

6
1. Background: Charge and Membership of the Expert Panel
In September 2013 the Chesapeake Bay Program’s Agriculture Workgroup (AgWG) approved
the membership and formation of a Manure Treatment Technology subgroup that developed a
report to detail the Charge and Scope of Work for an eventual expert panel that would
evaluate the water quality benefits associated with the technologies in their charge. The
subgroup’s report was approved by the AgWG in June 2014 and directed the expert panel to
evaluate the following technologies as new BMPs for the Chesapeake Bay Program (CBP)
partnership’s modeling tools:
Microbial digestion o Aerobic
o Anaerobic
Thermochemical
o Pyrolysis
o Gasification
o Combustion
o Torrefaction
Chemical treatments – dry manure
Chemical treatments – wet manure
Solid-liquid separation
Composting
The subgroup considered a number of other treatment technologies – such as biological
nutrient removal, pelletizing, enzymatic digestion, and baled poultry litter – but determined
those technologies can either be adequately captured through the existing “manure transport”
BMP (pelletizing and baled poultry litter) or did not have enough available data to review at this
time.
Table B.1 – Membership of the Manure Treatment Technologies BMP Expert
Panel
Panelist Affiliation
Keri Cantrell KBC Consulting (formerly with USDA-ARS)
John Chastain Clemson University
Doug Hamilton (Chair) Oklahoma State University
Andrea Ludwig University of Tennessee
Robert Meinen Penn State University
Jactone Ogejo Virginia Tech
Jeff Porter USDA-NRCS, Eastern National Technology Support Center
Panel support:
Jeremy Hanson (Coord.) Virginia Tech/CBPO
Brian Benham Virginia Tech (Cooperative Agreement Project Director)
Chris Brosch Delaware Dept. of Agriculture (WTWG rep)
Mark Dubin University of Maryland/CBP (AgWG Coord.)
Ashley Toy EPA Region 3 (Regulatory Support)
David Wood CRC/CBP (CBP modeling team rep)

7
Virginia Tech, under its cooperative agreement with EPA to facilitate BMP expert panels,
released a Request for Proposals in September 2014 to solicit the formation of a panel to fulfill
the Charge approved by the AgWG. The proposal submitted by Doug Hamilton (Oklahoma
State) was selected and presented to the AgWG and CBP partnership for comment. The panel
membership, as approved by the AgWG in November 2014, is summarized in Table B.1.
The panel convened for its first meeting and hosted a public stakeholder forum1 on December 15, 2014. Throughout its deliberations, the panel adhered to the procedures and expectations
described in the Water Quality Goal Implementation Team’s Protocol for the Development,
Review, and Approval of Loading and Effectiveness Estimates for Nutrient and Sediment Controls in the
Chesapeake Bay Watershed Model, or BMP Protocol.2
The panel would like to acknowledge Matt Johnston (University of Maryland, CBPO), Jeff
Sweeney (EPA, CBPO), members of the Agriculture workgroup and others whose continued
interest and input provided valuable contributions to the development of this report.
1 http://www.chesapeakebay.net/calendar/event/22245/ 2 http://www.chesapeakebay.net/publications/title/bmp_review_protocol

8
2. Background: Livestock Manure Treatment in the Bay Watershed
Manure from animal agriculture is the largest source of phosphorus (P) loads to the
Chesapeake Bay and the second largest source of nitrogen (N). Traditionally, the manure from
livestock and poultry has been a valuable resource for farmers as a cost-effective fertilizer.
When used appropriately, manure adds nutrients and organic matter that improves soil quality.
However, manure’s ratio of P to N is often higher than a crop’s agronomic need, so application
of manure at agronomic N rates frequently contributes to excess P in the soil. Manure is also a
bulky material that is costly and energy intensive to transport long distances to areas where it is
needed. Excess nutrients in some areas of watershed make nutrients in the soil more
susceptible to runoff.Nutrients are often applied at excessive rates in areas of the watershed
where excess manure exist. Resulting excess nutrient levels in soils in these areas increase
susceptibility to nutrient loss via runoff.
The need to rebalance the use of nutrients to protect water quality has generated interest and
investment in manure treatment technologies and alternate uses of manure. Additionally,
revisions to P management regulations (e.g., Maryland) further increase the need for such
manure technologies. Some technologies have been in use for decades (e.g., anaerobic
digesters) while others are much newer and still in the pilot or research stage.
How Nutrient Loads from Livestock Manure are Currently Simulated in the
Chesapeake Bay Watershed Model (v.5.3.2)
The Chesapeake Bay Watershed Model (CBWM) is one part of a larger suite of tools used by
Chesapeake Bay Program partners, as illustrated in Figure B.1. The Watershed Model combines
all BMP, land use and nutrient input data to estimate delivered loads of N, P and sediment to
the Chesapeake Bay. The Estuarine Model then uses these delivered loads to assess attainment
of water quality standards. The current version of the CBWM (Phase 5.3.2) is calibrated to water quality monitoring data over the period of 1985 to 2005.
Scenario Builder
Scenario Builder is a database management tool that combines a wide array of inputs for a given
year and processes them into a single, comprehensive scenario for the CBWM to run, as
illustrated in Figure 1 above. Scenario Builder is the tool where manure and nutrient inputs are
combined with BMP implementation data reported by the states through the National
Environmental Information Exchange Network (NEIEN).
How Scenario Builder simulates agricultural nutrient inputs from animal manures
The current version of Scenario Builder estimates nutrient applications to crops on a monthly
basis. Monthly nutrient needs for each crop in each county are estimated based upon acres of
crops reported by the USDA National Agricultural Statistics Service (NASS) Census of
Agriculture (Ag Census) and yield and application rate/timing data provided by the Ag Census,
literature sources and state agricultural agencies. The monthly nutrient need of each crop can
be met by organic nutrients (manure and biosolids) and/or by inorganic nutrients (fertilizer).

9
Nutrients are spread in a stepwise fashion in the current version of Scenario Builder. First, a
few high-need commodity crops receive inorganic nutrients to mimic common nutrient
Figure B.1 - Chesapeake Bay Program partnership modeling tools
application routines. Next, a portion of organic nutrients is deposited directly on pasture to
reflect manure deposition that occurs outside of the barnyard. Third, organic nutrients
deposited within the barnyard are spread to meet the nutrient needs for crops which
typicallyreceive organic nutrients. Finally, inorganic fertilizer is spread to supplement any
remaining crop nutrient need. Occasionally, there are more manure nutrients available in a
county than Scenario Builder estimates crops should receive. When this occurs, all remaining
manure is spread on specific crops in an order defined by each state. The next version of
Scenario Builder may simulate manure generation and nutrient application in slightly different
ways based on feedback and decisions by the CBP partnership. For the purposes of this panel,
the overall process is expected to remain similar enough that the panel’s recommendations can
reasonably be incorporated into the next version of the CBP modeling tools.
Overview on how manure is simulated in CBP partnership modeling tools
This section briefly summarizes how manure is simulated in the modeling tools, and the next
chapter describes how the panel approached treatment practices as related to the modeling
tools. Appendix A provides additional details on how the BMPs can be reported through
NEIEN and combined with other data (manure, nutrients, BMPs, etc.) in Scenario Builder.

10
Nutrients associated with manure go through five steps in the modeling tools. The steps
outlined below are shown conceptually in Figure B.2.
1. Manure is produced/excreted.
2. Manure is placed in storage.
3. Nutrients may be volatilized.
4. Nutrients may be lost via manure storage and transport activities. 5. Manure (and associated nutrients) are applied to crops and/or pasture.
Figure B.2 - Conceptual Diagram of Manure Nutrients in the Phase 5.3.2 Watershed Model.
The panel was asked to determine “how much, on a percentage basis, total nitrogen (TN) or
total phosphorus (TP) is lost or reduced as a result of the treatment technology or process?” If
the technology only transforms N or P constituents, then the panel could also consider a
corollary question, “how much of each constituent is transformed into a different constituent as
a result of the treatment?” These two questions were essential for the panel to consider due to

11
the way the modeling tools calculate the nutrient loads associated with manure are simulated in
the CBP modeling tools, Figure B.2.
For modeling purposes, manure treatment technology simulation is a function of technology
type, and the timing of when a given technology is applied to the manure. Manure treatment
technology BMPs treat manure before it is land applied, specifically anytime during or after Step
2 and before Step 5 in Figure B.2 above. The orange MTT:NVE box in Figure B.2 illutrates the
nitrogen that is extracted by certain treatment technologies (e.g., thermochemical or
composting) from the primary manure stream that is subsequently available for land application
or transport. The total overall nutrients remaining in that primary manure stream are not
changed as a result of the PSE or NSE values since those nutrients still remain to be land
applied or transported according to model procedures. Other assumptions and procedures in
the modeling tools (e.g., field application, runoff, losses from storage/handling) are outside the
scope of this Manure Treatment Technologies expert panel report and will apply to treated
manure streams the same as untreated manure streams since the overall nutrients are part of
the same overall “bucket” of manure nutrients at the county scale in the modeling tools.
Section 3 provides more information about how the panel approached how to conceptualize
and quantify the benefits of manure treatment technologies in the context of the CBP
partnership modeling tools.
References
Devereux, O. 2013. Manure-Receiving Land Uses Load Estimation Methodology. Accessed October
2014 from http://casttool.org/Documentation.aspx
Documentation for Scenario Builder, Version 2.4. Revised January 2013. Available online at
http://www.chesapeakebay.net/publications/title/documentation_for_scenario_builder
Kellogg, R.L., Lander, C.H., Moffitt, D.C., & N. Gollehan, 2000. Manure nutrients relative to the
capacity of cropland and pastureland to assimilate nutrients: spatial and temporal trends in the
United States. NRCS and ERS GSA Publ. No. nps00-0579. Washington, D.C.
Schoenian, S. Sheep 201. Maryland Cooperative Extension. Accessed by CBPO staff and cited in
Scenario Builder documentation, October, 2008, from http://www.sheep101.info/201/

12
3. Treatment Technologies in Manure Handling Systems
This panel was charged with developing definitions, determining loading effectiveness estimates,
and defining nutrient transformation pathways for selected manure treatment technologies.
The panel chose to concentrate on six broad categories of manure treatment technologies
based on this charge, the likelihood that a given technology will be used in the Chesapeake Bay
Watershed, and the availability of farm-scale performance data in the refereed literature.
The six technology categories the panel chose to examine were:
1. Thermochemical Conversion
2. Composting
3. Anaerobic Digestion
4. Settling
5. Mechanical Solid-Liquid Separation
6. Wet Chemical Treatment
The panel defined individual technologies within each broad category. Using data available in
the literature, the panel determined how each defined technology affects and transforms N and
P in a given manure stream. The panel also chose to describe how the technology affects
manure organic matter in most cases.
Treatment is a Component of the Manure Handling System
Livestock farms use systems for handling manure. A system is as a set of interdependent
components working together to accomplish a task. The general task of manure handling
systems is to move manure (the feces and urine excreted by livestock) from animal housing to a
place where it can be useful -- or at least less harmful -- to the environment. The system’s components are interdependent because you cannot change one part of the system without
affecting all of the other parts (Hamilton, 2011a).
Figure TT1 is a schematic representation of a manure handling system. The boxes are the
various components of the system: manure is produced by animals, collected in a barn,
transferred from place to place, utilized by crops, etc. The arrows in Figure TT.1 represent
flow of material from one component to another. Two of the arrows have only one head,
meaning manure flows generally from production to utilization. The three arrows into and out
of the transfer component have two heads. This means that manure can travel in both
directions between storage, treatment, and collection components. Stored, untreated manure
can move towards treatment, and treated manure can flow to a storage component. Treated
manure can be used to remove untreated manure from the collection system, by way of a
transfer component. Manure handling systems can become very complex. They may have
several flow paths with multiple components along each path.

13
Figure TT.1. Schematic Representation of Manure Handling Systems (from Figure 9-2 in
USDA NRCS, 1992).
The Role of Treatment in Manure Handling
Treatment components alter manure to make the system operate more efficiently, to reduce
nuisance conditions, and to allow better utilization of nutrients by the environment. They may
make manure easier to handle by separating the waste stream into a high and a low solids
stream. They may alter manure organic matter to reduce odors. They may extract energy
from manure organic matter. They may alter the form or concentration of plant nutrients to
prepare manure for utilization by crops. They may concentrate nutrients and stabilize organic matter so that manure may be transported greater distances away from the farm. With rare
exceptions, removing nutrients from the waste stream is not the intended purpose of manure
treatment technologies.
The Importance of Manure Consistency
Consistency is a measure of how material maintains its shape. Figure TT.2 shows the four
states of manure consistency based on its storage and handling requirements. Manure
consistency is highly dependent on the species of animal that produced the manure, the diet of
the animal, and moisture content. In general, the higher the moisture content, the more the
manure behaves as a liquid. The higher the solids content, the more it behaves as a solid.
Manure consistency has a huge effect on how manure transfer components are selected and
implemented. Whether manure is scraped, pumped, squeegeed, or augured depends on its
consistency. Treatment components are also heavily dependent on manure consistency. Some
Production
Collection
Transfer
Utilization
TreatmentStorage

14
Figure TT.2. The Four States of Manure Consistency (from Hamilton, 2011b)
treatment components only operate on certain consistencies of manure. Others are more
versatile, operating over a wide range of manure consistency.
Incorporation of Treatment into Chesapeake Bay Modelling Tools
The current version of Scenario Builder estimates nutrient applications to crops on a monthly
basis. The monthly nutrient needs for each crop in each county are estimated based upon
acres of crops reported in the county. The monthly nutrient need of each crop can be met by
organic nutrients (manure and biosolids) and inorganic nutrients (fertilizer). Nutrient application
relies heavily upon the amount of manure available in a county. Scenario Builder contains 14
types of animals and makes assumptions for animal weight, manure generation, and nutrient
content based on the best available sources. The vast majority of nutrients from manure in the watershed are generated by poultry, dairy, beef, and swine. The amount of manure nutrients
can be adjusted by various BMPs (Hanson and Johnston, 2014).
Figure TT.3 illustrates how manure BMPs are incorporated into the modeling tools. Manure
treatment technologies fit into this framework in three ways 1) as BMPs reducing the amount
of nutrients stored on AFOs and CAFOs, 2) by influencing the manure transport BMP by
making manure nutrients more likely to be transported over county lines, 3) as BMPs
transforming nutrients and making them generally more available to crops.

15
Figure TT.3. Incorporation of BMPs into Chesapeake Bay Program Modelling Tools (from
Devereux, 2013). Red arrows indicate decreasing amounts; green arrows indicate increasing amounts;
black paths indicate calculation procedures in Scenario Builder.

16
Nutrient Transfer
The panel chose to approach each manure treatment technology as a Black Box (Figure TT.4).
As shown in Figure TT.4.1, nutrients are not typically removed by manure treatment
technologies. Rather treatment technologies transfer manure nutrients to three possible flow
paths (arrows leaving box in Figure TT.4). Nutrients (both nitrogen and phosphorus) often
remain in treatment flow paths to be utilized on-farm via application to crops and pasture.
Nitrogen can be transferred (volatilized) to the atmosphere (dashed arrow in in Figure ES. 1) as
either nitrogen gas (N2), ammonia (NH3), or various oxides of nitrogen (NOx). Nutrients (both
nitrogen and phosphorus) can be separated from the main manure flow path and transferred to
another flow path, which is more likely to be utilized off-farm.
Figure TT.4. Manure Treatment Technologies as a “Black Box”
Now, consider the three flow paths in the context of Scenario Builder (TT.3). A manure
treatment technology may reduce the mass of N stored for land use by transferring manure N
to the atmosphere. A manure treatment technology can influence how much manure N and P
is available for use in the Manure Transport BMP by transferring those nutrients to a separate,
more transportable flow path.
Manure
Treatment
Technology
Nutrients
Entering
Nutrients Remaining
In the Main Flow Path and
Used On-farm
Transfer of Nitrogen to the
Atmosphere (Volatilization)
Separation of Nutrients to a
Flow Path More Likely to be Used
Off-Farm

17
The panel chose Mass Transfer Efficiency as the method to express how manure treatment
technologies alter nutrient flows. In terms of the black box given in Figure TT1, mass transfer
efficiency is calculated as:
Mass Transfer Efficiency = (Mass of Nutrients in a Flow Path Leaving the Box) X 100 TT.1
(Mass of Nutrients Entering the Box)
Three specific transfer efficiencies were calculated for each technology: Nitrogen Volatilization
Efficiency (NVE), Nitrogen Separation Efficiency (NSE), and Phosphorus Separation Efficiency
(PSE). Equations used to calculate these efficiencies are given in TT.2, TT.3, and TT.4.
NVE = (Mass of Nitrogen Transferred to Atmosphere) X 100 TT.2
(Mass of Nitrogen Entering the Treatment Technology)
NSE = (Mass of Nitrogen Separated from Main Flow Path) X 100 TT.3
(Mass of Nitrogen Entering the Treatment Technology)
PSE = (Mass of Phosphorus Separated from Main Flow Path) X 100 TT.4
(Mass of Phosphorus Entering the Treatment Technology)
Nutrient mass is expressed as total nitrogen (TN) and total phosphorus (TP) throughout this
report. Also, mass transfer efficiency is expressed as a percent; however, these efficiencies may
also be considered fractions. To determine the mass of N or P transferred by a manure
treatment technology, multiply the mass entering by transfer efficiency and divide by 100. To
determine the mass leaving in the main flow path, subtract mass entering by mass transferred to atmospheric and separation flow paths.
Nutrient Transformation
The third influence manure treatment technologies have on modelling tools is by transforming
nutrients. While converting manure organic matter to carbon dioxide (CO2) and water (H2O),
treatment technologies also convert organic N and P to inorganic forms. The transformation of
organic nutrients to more soluble, inorganic forms makes the nutrients more available to crops,
and potentially, more susceptible to environmental losses. Other treatment technologies cause
the precipitation of soluble N and P to less soluble salts. Transformation to inorganic salts
affects plant uptake and nutrient losses by allowing nutrients to be stored in the soil and slowly
released over time.
Nutrient transformations require looking into the inner workings of a given manure treatment
technology black box. The panel acknowledges the ability of manure treatment technologies to
transform nutrients. Data provided in the literature on nutrient transformation is reported in
each technology chapter. However, since the effect of nutrient transformation is seen during
storage or land application –which is outside the expertise and charge of this panel– the panel
did not provide specific numeric transformation performance estimates for each manure
treatment technology considered here.

18
How to Use Recommendations in this Report
Each manure treatment technology chapter in this report is broken into the following sections:
1. A short definition of the technology
2. Definitions of terminology used with the technology.
3. Detailed description of the types of technology evaluated by the panel
4. Short descriptions of related technologies not evaluated by the panel
5. Types of manure treated by the technology
6. Definition of mass transfer efficiencies as used for the particular technology.
7. Default transfer efficiencies to use in Scenario Builder (Level 1)
8. A thorough review of the literature on effectiveness of each technology (including
nutrient transformation)
9. Defined mass transfer efficiencies to use in Scenario Builder if process factors are
known for a particular farm (Level II)
10. Ancillary benefits of using the technology
11. Potential environmental hazards posed by the technology 12. List of references used in compiling the information given in the chapter.
Mass Transfer Efficiency Recommendations
Two levels of mass transfer efficiencies are recommended for use by the Chesapeake Bay
Program:
1. Default Transfer Efficiency (Level 1) to be used when the only things known
about a treatment system are the manure and treatment technology type.
2. Defined Transfer Efficiency Value (Level 2) to be used when the manure type is
known and pertinent operating conditions of the treatment technology are known.
In addition, actual monitoring data for an individual operation may be used if monitoring data
exists for the treatment system. With monitoring in hand, a third value may be used:
3. Data Driven Transfer Efficiency (Level 3) to be used when actual monitoring
data for a particular farm is available.
Use of monitoring data is covered in Section 10, Data Collection and Reporting Protocols for
Reporting Data Driven (Level 3) Transfer Efficiencies.
Combinations of Several Technologies
More than one manure treatment technologies may be used in a manure handling system. To
determine the effect of several technologies on nutrient transfer, remember that mass transfer
efficiencies are multiplicative for technologies combined in series. Figure TT.5 demonstrates
this principle. A swine farm uses flushing to remove manure from buildings. Flushed manure
enters a clarifier (a settling technology). Liquids leaving the clarifier is stored and irrigated onto
19
Figure TT.5. Combined Effect of a Clarifier and Centrifuge Working in Series on the Separation Removal of Phosphorus
from Flushed Swine Manure.
Clarifier
P Separation = 50%
Flushed
Swine Manure Liquid Effluent
Sludge
100 lbs P 50 lbs P
Centrifuge
Separator
P Separation = 50 %
Liquid Effluent
Solid
Cake
50 lbs P
25 lbs P
25 lbs P
75 lbs P
Irrigated
on Farm
25 lbs P
Trucked
out of
Watershed

Manure Treatment Technologies 20
cropland on the farm. Sludge leaving the clarifier enters a centrifuge (mechanical solid-liquid
separation technology) which further thickens the sludge slurry into a solid cake. Liquids
leaving the centrifuge are stored and irrigated along with the clarifier effluent. Both the clarifier
and the centrifuge have a phosphorus separation efficiency of 50%, meaning half of the TP
entering the black box exits in a flow path that is more likely to be used off-farm. Separation
efficiency of the combined treatments is 25%, because 75% of the TP excreted by pigs remains
on farm, while 25% is trucked out of the watershed.
Compatibility of Technologies and Manure Types
Not all technologies will be used on every single type of manure found in the Chesapeake Bay
watershed. Consistency of manure in the handling system is a major factor determining use of
technology. Table TT1 is a matrix of compatibility between technologies, manure consistency,
and type of livestock housed on a farm. The manure types given in Table TT1 is not meant to
be an exhaustive list, but a listing of the major types of manure contributing nutrients to the
Chesapeake Bay. Some minor manure types can be used with the technology. For instance,
composting is widely used to treat horse manure and horse stall cleanings in the Chesapeake
Bay Watershed.
Table TT.1. Compatibility of Manure Treatment Technologies Covered in this Report with Major
Manure Types Found in the Chesapeake Bay Watershed. Black rectangles indicate that the technology is
mostly compatible with the manure. Grey rectangles indicate that the technology is compatible but with major
pretreatment to the manure. White rectangles indicate that the technology and manure are incompatible.
Thermo-
chemical
Processing
Composting Anaerobic
Digestion Settling
Mechanical
Solid-
Liquid
Separation
Wet
Chemical
Treatment
Semi-Solid Dairy
Slurry Dairy
Liquid Dairy
Slurry Swine
Solid Poultry

Manure Treatment Technologies 21
References
Devereux, O. 2013. Manure-Receiving Land Uses Load Estimation Methodology. Accessed
October 2014 from http://casttool.org/Documentation.aspx
Hamilton, D.W. 2011a. What is a Waste Management System? OSU Factsheet BAE 1734.
Stillwater, OK: Oklahoma Cooperative Extension Service.
Hamilton, D.W. 2011b. Consistency of Manure/Liquid Mixtures. OSU Factsheet BAE 1751.
Stillwater, OK: Oklahoma Cooperative Extension Service.
Hanson, J., and M. Johnston. 2014. Memo to BMP Panel on Manure Treatment Technologies.
Annapolis, MD: Chesapeake Bay Partnership.
USDA NRCS. 1992. Agricultural Waste Management Field Handbook. Washington, DC: United
States Department of Agriculture, Natural Resources Conservation Service.
Manure Treatment Technologies 22
4. Thermochemical Conversion Processes
Thermochemical conversions (TCC) Processes are high-temperature chemical reforming
processes that convert organic matter into a combination of synthesis gas, bio-oil, and char/ash
(McKendry 2002; Kambo and Dutta 2015).
Thermochemical Conversion Terminology:
Synthesis Gas (Syngas) is a mixture of water vapor (H2O), Hydrogen (H2), Carbon
monoxide, (CO), Carbon Dioxide (CO2), Nitrogen (N2), hydrocarbon gases, tars, and other
contaminants. Once cleaned of dust, tars, metals, water and organic acids, Syngas can serve as a
fuel gas or bioenergy feedstock.
Bio-Oil is the highly oxygenated condensation product of synthesis gas. Bio-oil has
combustible qualities allowing it to be utilized potentially as a fuel source or bioenergy
feedstock.
Char/Ash is the un-volatilized, solid residual of thermochemical conversion. It is a
combination of minerals and fixed carbon. Manure based char is a nutrient-dense material that
has potential as an alternative fertilizer or soil amendment (Cantrell et al 2012). Following the
biochar standards published by the International Biochar Initiative (IBI), Biochar contains more
than 10% organic carbon (International Biochar Initiative 2014). For the purposes of this
report, the solid by-product from thermochemical processes with less than 10% organic carbon
is termed Ash.
Types of Thermochemical Processes
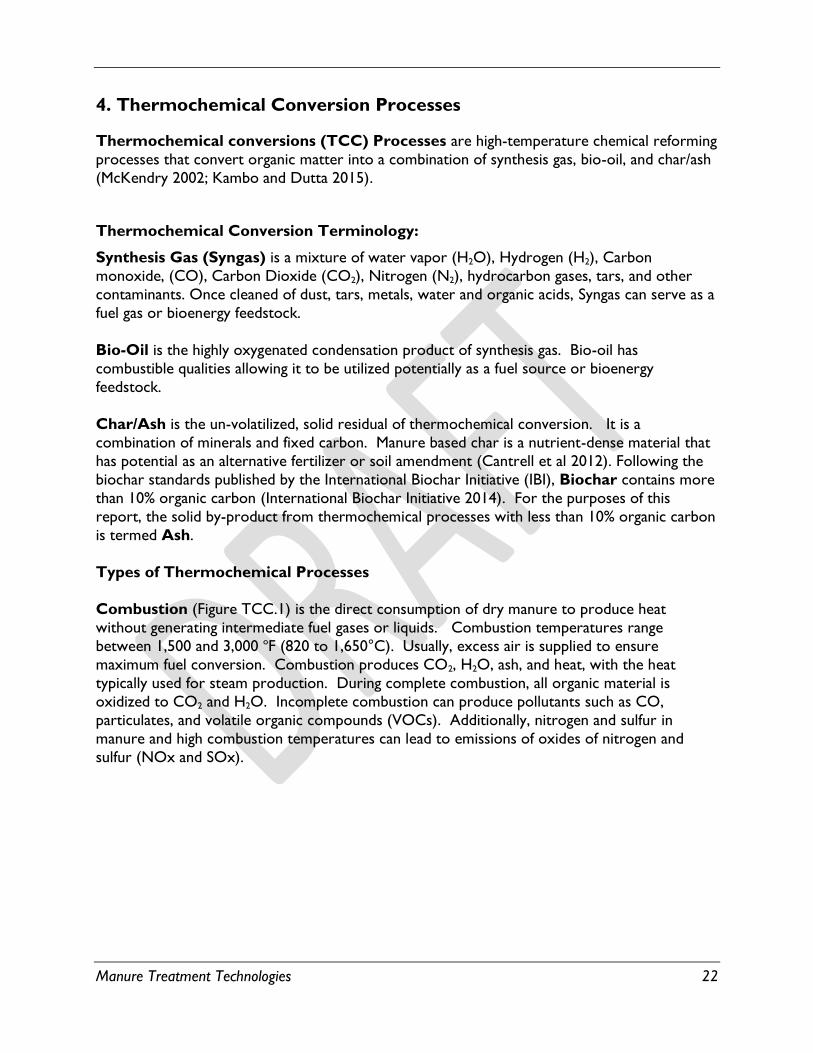
Combustion (Figure TCC.1) is the direct consumption of dry manure to produce heat
without generating intermediate fuel gases or liquids. Combustion temperatures range
between 1,500 and 3,000 oF (820 to 1,650°C). Usually, excess air is supplied to ensure
maximum fuel conversion. Combustion produces CO2, H2O, ash, and heat, with the heat
typically used for steam production. During complete combustion, all organic material is
oxidized to CO2 and H2O. Incomplete combustion can produce pollutants such as CO,
particulates, and volatile organic compounds (VOCs). Additionally, nitrogen and sulfur in
manure and high combustion temperatures can lead to emissions of oxides of nitrogen and
sulfur (NOx and SOx).

Manure Treatment Technologies 23
Figure TCC1. Blue Flame Combustion Boiler on Poultry Farm in Chesapeake Bay
Watershed (USDA NRCS).
Gasification (Figures TCC.2 and TCC.3) is the thermochemical reformation of biomass at
temperatures between 1,870 and 2,730oF (1,000 to1,500°C) in a low oxygen or starved oxygen
environment, using air or steam as reaction medium. The main purpose of gasification is to produce syngas. Syngas produced by gasification is primarily CO, H2, Methane (CH4), and other
light weight hydrocarbons. By-products of gasification include trace liquids (tars, oils, and other
condensates) and minor amounts of char or ash. The amount of char produced in gasification
depends on the ash content of the feedstock. Syngas can be used in internal combustion
engines or used to produce other fuels such as bio-diesel. Combustion of syngas results in the
same end products as direct combustion of manure, but with improved pollution control,
conversion efficiencies, and easier fuel storage and handling. There are several gasification
configurations; design is dependent of the desired application and by-products.

Manure Treatment Technologies 24
Figure TCC.2. Enginuity Gasification System on a Poultry Farm in the Chesapeake Bay
Watershed (USDA NRCS).
Figure TCC.3. Energy Works Gasification Facility near Gettysburg, PA (USDA
NRCS).
Manure Treatment Technologies 25
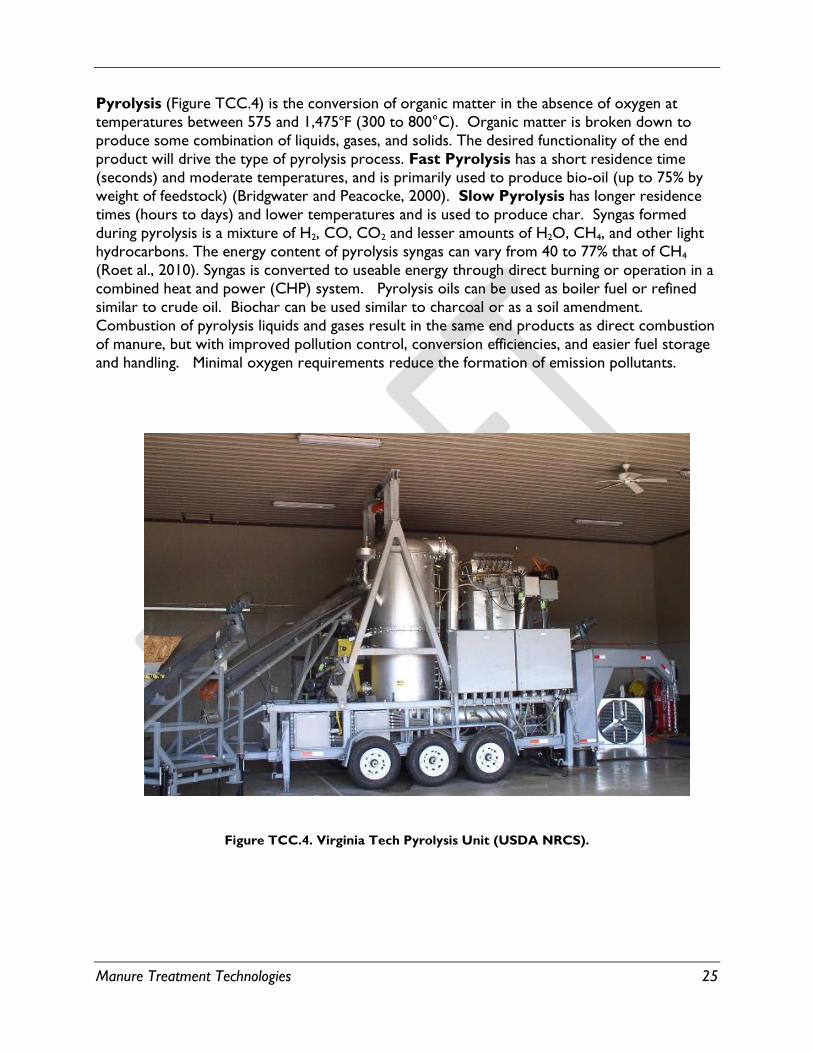
Pyrolysis (Figure TCC.4) is the conversion of organic matter in the absence of oxygen at
temperatures between 575 and 1,475oF (300 to 800°C). Organic matter is broken down to
produce some combination of liquids, gases, and solids. The desired functionality of the end
product will drive the type of pyrolysis process. Fast Pyrolysis has a short residence time
(seconds) and moderate temperatures, and is primarily used to produce bio-oil (up to 75% by
weight of feedstock) (Bridgwater and Peacocke, 2000). Slow Pyrolysis has longer residence
times (hours to days) and lower temperatures and is used to produce char. Syngas formed
during pyrolysis is a mixture of H2, CO, CO2 and lesser amounts of H2O, CH4, and other light
hydrocarbons. The energy content of pyrolysis syngas can vary from 40 to 77% that of CH4
(Roet al., 2010). Syngas is converted to useable energy through direct burning or operation in a
combined heat and power (CHP) system. Pyrolysis oils can be used as boiler fuel or refined
similar to crude oil. Biochar can be used similar to charcoal or as a soil amendment.
Combustion of pyrolysis liquids and gases result in the same end products as direct combustion
of manure, but with improved pollution control, conversion efficiencies, and easier fuel storage
and handling. Minimal oxygen requirements reduce the formation of emission pollutants.
Figure TCC.4. Virginia Tech Pyrolysis Unit (USDA NRCS).

Manure Treatment Technologies 26
Other Thermochemical Processes not Covered in this Report
Hydrothermal Processes are used to convert wet manure and sludge such as those
produced by swine and dairy operations. Hydrothermal techniques include Hydrothermal
Liquefaction (HTL) and Hydrothermal Carbonization (HTC) (Cantrell et al., 2007;
Libra et al., 2011; He et al., 2000). In HTL, aqueous organic matter is converted to organic oils
by applying relatively low heat (475 to 750 °F; 250 to 400 °C) and high pressure. He et al.
(2000) reported swine manure conversion at 90 atm). The desired product of HTC is carbon-
rich biochar. Hydrothermal carbonization is performed at slightly lower temperatures
(compared to HTL), where the reaction pressure is equivalent with the saturation vapor
pressure of water. To date, hydrothermal processes have been limited to laboratory scale
operations.
Types of Manure Used
Combustion, pyrolysis, and gasification are used to convert drier wastes such as poultry and
turkey litter. Wetter materials, such as slurry or semi-solid dairy and swine manure must
undergo desiccating pretreatment (solid-liquid separation, composting, or air drying) before
conversion by pyrolysis and gasification. Pretreatment processes may be energy intensive and reduce the economic and energetic efficiency of the overall process.
Transfer Efficiencies of Thermochemical Conversion Processes
Thermochemical Conversion Processes are shown as a black box in Figure TCC.5. By
definition, all of the manure entering a thermochemical conversion process is transformed to
ash, char, or bio-oil. There is not a stream of manure leaving the black box in Figure TCC.5.,
because the dry manure entering has all been transformed to ash, char or bio-oil. The nitrogen
and phosphorus contained in ash or char is more likely to be utilized off-farm compared to
nutrients contained in the original manure, hence the arrow for N and P in ash and char is
pointing downward, indicating that these nutrients have been separated from the main manure
flow. The second arrow leaving the box indicates the mass of N volatilized and transferred to
the environment as a component of syngas. Bio-oil is almost always used in a secondary
gasification or combustion process. Nutrients contained in bio-oil, therefore, exit the black
box in the syngas stream.

Manure Treatment Technologies 27
Figure TCC.5. Thermochemical Conversion Black Box Process
The three transfer efficiencies for thermochemical processes are defined in the terms of Figure
TCC.5 as:
NVE = (Mass of TN in Syngas) X 100 TCC.1
(Mass TN in Dry Manure)
NSE = (Mass of TN in Ash or Char) X 100 TCC.2
(Mass TN in Dry Manure)
PSE = (Mass of TP in Ash or Char) X 100 TCC.3
(Mass TP in Dry Manure)
Default Transfer Efficiencies for Thermochemical Processes
Without detailed knowledge of the process factors for a particular treatment system, the
default Nitrogen Volatilization Efficiencies (NVE), Nitrogen Separation Efficiencies (NSE) and
Phosphorus Separation Efficiencies (PSE) listed in Table TCC.1 should be used as inputs to the
Chesapeake Bay Model. If the operating temperature and holding time of the process is known,
values in Table TCC.5 may be used.
Thermochemical
Conversion
Process
Dry Manure
N and P in
Ash or Char
Volatilized N
In Syngas

Manure Treatment Technologies 28
Table TCC.1. Default Transfer Efficiencies for Thermochemical Conversion Processes.
Thermochemical Conversion
Process
Transfer Efficiency (%)
NVE NSE PSE
Combustion 85 15 100
Gasification 85 15 100
Pyrolysis 25 75 100
Review of Available Science on Thermochemical Conversion Processes
The primary thermochemical conversion processes currently evaluated and utilized within the
Chesapeake Bay Watershed are combustion, gasification and pyrolysis. Combustion of manure
yields heat that must be used immediately; thus, this method does not provide a storable
energy product. As such, pyrolysis and gasification have been the focus of most research, largely
due to their product versatility. Table TCC.2 shows the defining control parameters of each
thermochemical conversion process. Major end products of each process and their relative
distribution range are given in Table TCC.3. The values shown in Table TCC3 are meant to be
a qualitative comparison of the technologies rather than a quantitative reference on product
distribution (Boateng et al, 2015). Quantity and quality of end product are dependent on
operating temperature, reaction medium, heating rate, residence time, and ash content of
feedstock. Feedstock particle size, mode of operation (batch or continuous), heating
technique, and feedstock homogenization are secondary process factors affecting the efficiency
of operation. Approximate percent of feedstock total solids, total nitrogen, and total
phosphorus based on feedstock dry matter, ash content, and temperature range is given in
Table TCC.4.
Process Factors
Operating Temperature plays a major large role in the removal volatilization of N from
manure handling systems. Combustion systems typically operate at high temperatures
(>1500˚F) and with excess oxygen associated with the process, much of the nitrogen is
converted to various gaseous forms. Gasification processes cover a wide range of
temperatures. Generally, as the operating temperature is reduced, the amount of nitrogen
retained in the ash/char increases. Below 1,500o F, 75% of manure N is retained in char. Above
1,500o F, as much as 85% of manure N is lost in gaseous emissions. Even though nitrogen
retention in ash/char does not have the drastic change at a given temperature, using 1500˚F
provides a guide to use for systems without monitoring or testing data. This temperature could also vary depending on the system and operational performance.
Reaction Medium is an easy parameter with which to categorize heat treatment processes. In
order to consume all the reactionary portion of the feedstock, combustion processes operate
under an excess of oxygen. Gasification operates with a nominal amount, usually sub-
stoichiometric, of O2. Pyrolytic processes operate without O2 present. As more oxygen is

Manure Treatment Technologies 29
added to the system, more gases are released -- including the volatile gases Ammonia (NH3)
and light hydrocarbons.

Manure Treatment Technologies 30
Table TCC.2. Thermochemical Conversion Processes Conditions.
Thermochemical
Conversion Process
Feedstock
Consistency
Process Conditions
Temperature
(oF)
Pressure
(atm) Aeration Level
Residence
Time
Combustion Solid 1,500 - 3,000 ~1 Excess O2 Minutes to Hours
Gasification Solid 1,400 - 2,700 ~1 Limited O2 Minutes to Hours
Fast Pyrolysis Solid 750 - 1,100 ~1 No O2 Seconds
Slow Pyrolysis Solid 575 - 1,475 ~1 No O2 Hours to Days
Table TCC.3. Major End Product and End Product Distribution Ranges based on Ash-Free Feedstock Material
for Thermochemical Conversion Processes.
Thermochemical
Conversion Process Major End Products
End Product Distribution
Gas Liquid Solid
Combustion Heat, Ash 85 – 100 0 0 - 15
Gasification Syngas, Char or Ash 85 – 95 0 - 5 5 - 15
Fast Pyrolysis Syngas, Bio-oil, Bio-char 20 - 40 40 - 70 10 – 25
Slow Pyrolysis Syngas, Bio-char 40 - 75 0 - 15 20 - 60
Table TCC.4: Percent of Feedstock Solids, Nitrogen, and Phosphorus Retained1 in Char or Ash residual.
Thermochemical
Conversion Process
Temperature
Range
(°F)
TS
Retained in
Ash/Char
(%)
TN
Retained in
Ash/Char
(%)
TP
Retained in
Ash/Char
(%)
Combustion 1,500 – 3,000 Ash + 0.15 (100 - Ash)2 5 100
Gasification 1,500 – 2,700 Ash + 0.15 (100 - Ash) 15 100
Gasification <1,500 Ash + 0.15 (100 - Ash) 75 100
Fast Pyrolysis 750 – 1,100 Ash + 0.25 (100 - Ash) 25 100
Slow Pyrolysis 575 – 1,475 Ash + 0.60 (100 - Ash) 75 100 1Percent Removed from Manure Handling = 100 – Percent Retained in Char or Ash Residual
2Ash Content of Feedstock (%TS)

Manure Treatment Technologies 31
Heating Rates and Residence Times are a differentiating factor between fast and slow
pyrolysis. Fast pyrolysis uses heating rates that approach several hundred degrees Fahrenheit
per minute or second; consequently, the residence time of fast pyrolysis is on the order of
seconds to minutes. Heating rates are just a few hundred degrees Fahrenheit per hour in slow
pyrolysis; therefore, the material residence time in slow pyrolysis approaches hours to days.
Ash Content of Feedstock is an important component in estimating byproduct output. The
greater the ash content, the greater the ash/biochar/solid residual byproduct. The ash content
of manure can either be measured directly by the operator, or a generic value can be assumed
based on either the livestock type or output from another solid handling system.
Feedstock Particle Size influences heat transfer and the extent of material conversion.
Larger feedstock particles (some wood pyrolysis processes use logs) require a longer residence
time to ensure a uniformly converted product. Smaller particles have a larger unit volume
surface area, which leads to faster burnout and higher reactor temperature (Priyadarsan et al.,
2004; Cantrell et al., 2008). In fast pyrolysis, where high heating rates and short reaction times are desired, the feedstock commonly undergoes grinding to generate fine particles (Boateng et
al., 2015). Whether large or small, uniform particle size is important in maintaining consistent
peak temperature propagation rates. As shown in Figure TCC.5, smaller particles will achieve
their internal peak temperature faster than larger particles. If two dissimilar particles are
converted, there are uneven internal temperatures at a given reaction time.
Figure TCC.5. Dependence of Time to Reach Peak Temperature
on Particle Size.
Reaction Time
Peak
Tem
per
atu
re a
t C
ente
r o
f Pa
rtic
le

Manure Treatment Technologies 32
Mode of Operation and Heating Technique depend on equipment and the treatment
train. Batch processes focus on controlling high quality outputs such as biochar. Batch
processes have large start-up and cool-down costs. Continuous operation equipment offers a
constant flow of material with an even application of heat. Continuous flow units, however,
require greater process controls and a more intimate knowledge of the physical processing.
Heat transfer from the heat source to the feedstock may be autothermal -- the feedstock is
oxidized (burned) with a direct air or oxygen source. Alternatively, heat transfer can occur
through contact with hot gases or some other heat carrier (Boateng et al., 2015).
Feedstock Homogenization is necessary for quality control of the end products. Manure is
extremely diverse in moisture content, ash content, and particle size distribution. Therefore,
mixing, grinding, blending or pelletizing may be necessary to create uniform particle size and
homogeneous feedstock. Furthermore, the ash content and composition of manures may
adversely affect both the mechanical efficiency of the equipment (bed agglomeration and
reduced peak temperatures) and the end-products quantity and quality (Priyadarsan et al.,
2004). Homogeneously blending manures with bioenergy crops and other agricultural residues may decrease feedstock moisture content, leading to decreases in both the energy required for
drying feedstock, as well as, the energy required to maintain process temperature.
Nutrient Transformations
The only true loss of solids and nutrients from thermochemical conversion processes is
through creation of gaseous end products. Nutrients contained in bio-oil are lost as bio-oil is
generally utilized as an energy source. Any nutrients contained in bio-oil eventually end up in
gaseous form. The only portion of feedstock remaining in the manure handling system is char
or ash.
Organic carbon is lost through conversion to CO2 or other gaseous byproducts. The extent of
manure sediment and volume loss due to thermochemical conversion processes is largely due
to type of process and the ash content of feedstock.
One hundred percent of manure phosphorus remains in char or ash regardless of the
thermochemical process used. Minor losses (less than 1%) may occur because of vaporization
of phosphorous at extreme temperatures. The majority of the phosphorus in ash and char will
be in inorganic form. This is a result of the carbon being removed during thermochemical
conversion and cleaving any organic bonds to phosphorous. This form of phosphorous is highly
soluble and capable of moving easily into a soil-water system. However, other environmental
factors like the soil characteristics will influence phosphorous availability.
The typical gaseous nitrogen emissions from thermochemical processes include: ammonia
(NH3), nitrogen oxides (NOX), nitrous oxide (N2O), and nitrogen gas (N2). Losses of nitrogen
from the solid phase as ammonia emissions are generally less than 2% of total losses (Caron-
Lassiter 2014). Additionally, based on reported air permits (Energy Works Biopower, 2014)
and available EPA air emission data (www.epa.gov/air/emissions) NOX-N emissions can be
estimated as 10% of feed N. The Farm Manure-to-Energy Initiative (2015) reported on a
limited number of air emission tests which were conducted on gasification and combustion
systems for litter from small poultry operations. Results show that ammonia emissions were

Manure Treatment Technologies 33
less than 0.05% for all operations. Nitrogen oxides varied from 2.5 to 5.2% for the combustion
systems and 0.6% from gasification. (A portion of the NOX, especially for the higher operating
temperatures of the combustion systems, likely resulted from thermal NOX, but was not
considered for this work.) Nitrous oxide (NO) was estimated at 2.65% of the NOX (EPA AP-
52, Chapter 1.6, 2003) which accounted for 0.1% or less of the nitrogen being emitted.
Comparing these emitted values with the nitrogen retained in the ash/char (Farm Manure-to-
Energy, 2015) showed that for these combustion systems, the emissions associated with N2 was
approximately 90% and for gasification at greater than 96% of the total nitrogen emissions.
Similar data was not published for pyrolysis systems, but given the operating temperature and
lack of oxygen it would be expected that a pyrolysis system would release more of its nitrogen
in the form of N2 than a gasification system. However, to be conservative the gasification N2
rate of 96% could be used. The remainder of emitted nitrogen (10% for combustion; 4% for
gasification and pyrolysis) would be assumed to be in reactive forms as NOX or NH3. The
deposition fate of ammonia and NOX may be of interest to other technical groups (e.g., the
Modeling Workgroup) for adjustments in the modeling tools if desired by the partnership.
These percentages only apply to emitted nitrogen and do not change the panel's analysis of the N that remains in the ash/char (Table TCC.4) that would be available for application or
transport. It should be noted that these percentages are based on a very limited number of
systems and are not representative of all combustion or gasification systems.
The performance and subsequently the air emissions of each thermochemical system will vary
from other systems due to unique operational characteristics, e.g., the characteristics of the
manure or litter fed to the system, the feed rate, the system itself, system maintenance, pre-
treatment or other steps in the process, etc. The panel's recommended values represent their
best attempt at a reasonable estimate for that type of technology's performance considering the
potential variability. These generalized rates will serve for the CBP's purposes if the Modeling
Workgroup and the CBP Partnership need to make adjustments to the Default and Defined
TCC BMPs (MTT1-6) are made to account for redeposition within the watershed.
Gaseous emissions are considered true losses of nitrogen from the solid phase as ammonia
emissions are generally less than 2% of total losses (Caron-Lassiter, 2014). Additionally, based
on reported air permits (Energy Works Biopower, 2014) and available EPA air emission data
(www.epa.gov/air/emissions) NOx-N emissions can be estimated as 10% of feed N. The
deposition fate of ammonia and NOx may be of interest to other technical groups and/or
future iterations of the model.
Concerns with Relevant Data
Most of the research on thermochemical processes has been bench scale. Recently, through
the NRCS Conservation Innovation Grant program, several farm-scale thermochemical
technologies are being evaluated within and around the Chesapeake Bay watershed.
Unfortunately, within the working time frame of this working progress, project reports were
not publically available or peer-reviewed. Projects are located in Pennsylvania, Virginia, West
Virginia and South Carolina. All of these systems have focused on poultry systems (broiler,
turkey and layer operations). From this work, preliminary results show that the nutrient
concentration or loss (in relation to nitrogen) is strongly dependent on the technology used
and residence time. Most resulting ash products show a reduction of nitrogen of nearly 90

Manure Treatment Technologies 34
percent or more and a phosphorus concentration of 7 to more than 10 times the fresh poultry
litter. Processes producing bio-char or char-like products may only lose half of the nitrogen to
the atmosphere and concentrate phosphorus from 2.5 to 3 times the original concentration.
Defined Transfer Efficiencies based on Process Factors
If operating temperature of a given process is known, the transfer efficiencies given in Table
TCC.5 may be used as inputs to the Chesapeake Bay Model.
Table TCC5: Defined Transfer Efficiencies of Thermochemical Conversion Processes based on
Process Factors.
Thermochemical
Conversion Process
Operating
Temperature
(°F)
Transfer Efficiency (%)
NVE NSE PSE
Combustion 1,500 – 3,000 95 5 100
Gasification 1,500 – 2,700 85 15 100
Gasification <1,500 25 75 100
Fast Pyrolysis 750 – 1,100 75 25 100
Slow Pyrolysis 575 – 1,475 25 75 100
Ancillary Benefits of Thermochemical Processes
Energy Production
Just like other plant-based biomass, there is energy in manure. As a general rule, animal
manures can have energy values approaching 8,000 BTU/lb (dry basis). Table TCC5 lists typical
energy values for various types of animal manure in comparison with other energy sources.
This value can vary tremendously depending on the moisture and ash contents. As would be
expected, the higher the moisture and ash content the lower the energy value. It should also
be noted that sand and other bedding materials may influence not only the high heat value
(HHV), but also the distribution and quality of thermochemical process end products.
Table TCC.6. Typical Energy Values of Manure, Biobased Products and Coal (From He et al., 2000:
McKendry, 2002; Tumurulu, 2011; Cantrell et al., 2012).
Feedstock Ash
(%)
High Heat Value
(BTU lb-1 TS db)
Dairy Manure 24.2 8,990
Beef Feedlot Manure 28.7 8,770
Swine Manure 32.5 9,080

Manure Treatment Technologies 35
Poultry Litter 30.7 8,180
Switchgrass 9.8 7,000
Wood Waste 42.0 5,030
Coal (Central Appalachian – Long Fork) 11.5 12,110
Transportation Efficiency
Biochar and ash represent only a small fraction of the mass and volume of the manure
feedstock entering the thermochemical process. The end products are essentially free of
water. Given that all of the manure phosphorus and some portion of manure nitrogen remain
in the ash or char, it should be more economical to ship biochar or ash than manure due to its
lower weight.
Pathogen Control
One of the many ancillary benefits of thermochemical processes is control of pathogens. Ultra-
Heat Treated (UHT) milk is held at 284o F for 4 seconds. All of processes listed in Table TCC2
go far beyond UHT conditions. One could consider thermochemically processed manure
“beyond pasteurization”.
Potential Hazards of Thermochemical Processes
Polycyclic Aromatic Hydrocarbons (PAH) and other toxicants may be present in biochar.
PAHs can be created when the thermochemical process is not complete (Office of Solid Waste,
2008). These potential solid by-products can stay in the environment for long periods of time.
The effects of long term exposure to humans is not available. Heavy Metals may also be a
concern in biochar and ash. Any heavy metals present in the feedstock will be concentrated in the ash or char following the thermochemical processing. Errant gases from the conversion
process like NOx, SOx, and NH3 need to be addressed in air quality permits. Fire Hazards
may also be of concern when handling fine particles of feedstock and more importantly a
powdered carbonized product. Though slow-pyrolyzed char does not have the reactive surface
area as activated carbon, equivalent safe handling practices should be followed as for powdered
activated carbon.
References
Boateng, A.A., et al., Biochar Production Technology, in Biochar for Environmental Management:
Science, Technology, and Implementation, J. Lehmann and S. Joseph, Editors. 2015,
Routledge: New York, NY. p. 63 - 88.
Bridgwater, A.V. and G.V.C. Peacocke, Fast pyrolysis processes for biomass. Renewable &
Sustainable Energy Reviews, 2000. 4(1): p. 1-73.

Manure Treatment Technologies 36
Brown, R.C. and C. Stevens, Thermochemical Processing of Biomass: Conversion into Fuels, Chemicals
and Power. 2011: Wiley.
Cantrell, K.B., et al., Impact of pyrolysis temperature and manure source on physicochemical
characteristics of biochar. Bioresource Technology, 2012. 107: p. 419-428.
Cantrell, K.B., et al., Livestock waste-to-bioenergy generation opportunities. Bioresource Technology,
2008. 99(17): p. 7941-7953.
Cantrell, K., et al., Role of thermochemical conversion in livestock waste-to-energy treatments:
Obstacles and opportunities. Industrial and Engineering Chemistry Research, 2007. 46(26):
p. 8918-8927.
Carson-Lassiter, J., The Farm Manure to Energy Initiative: Chesapeake Bay Region, in From Waste to
Worth: Spreading Science & Solutions Conference. 2013, The Livestock & Poultry
Environmental Learning Center: Denver, CO.
Energy Works Biopower, Gettysburg Energy and Nutrient Recovery Facility: GENRF Diagonostic
Emissions Tests. 2014. p. 27.
He, B.J., et al., Thermochemical conversion of swine manure: An alternative process for waste
treatment and renewable energy production. Transactions of the ASAE, 2000. 43(6): p. 1827-1833.
International Biochar Initiative, Standard Product Definition and Product Testing Guidelines for
Biochar That Is Used in Soil, Version 2.0. 2014. p. 60.
Ippolito, J.A., et al., Biochar elemental composition and factors influencing nutrient retention, in
Biochar for Environmental Management: Science, Technology and Implementation J. Lehmann
and S. Joseph, Editors. 2015, Routledge: New York, NY.
Kambo, H.S. and A. Dutta, A comparitive review of biochar and hydrochar in terms of production,
physico-chemical properties and applications. Renewable & Sustainable Energy Reviews,
2015. 45: p. 359-378.
Libra, J., et al., A comparative review of the chemistry, processes and applications of wet and dry
pyrolysis. Biofuels, 2011. 2: p. 89-124.
McKendry, P., Energy production from biomass (part 2): Conversion technologies. Bioresource
Technology, 2002. 83(1): p. 47-54.
Office of Solid Waste, Polycyclic Aromatic Hydrocarbons (PAHs), U.E.P. Agency, Editor. 2008:
Washington, DC. p. 3
Priyadarsan, S., et al., Fixed-bed gasification of feedlot manure and poultry litter biomass.
Transactions of the ASAE, 2004. 47(5): p. 1689-1696.
Ro, K.S., et al., Catalytic wet gasification of municipal and animal wastes. Industrial & Engineering
Chemistry Research, 2007. 46(26): p. 8839-8845.

Manure Treatment Technologies 37
Ro, K.S., K.B. Cantrell, and P.G. Hunt, High-temperature pyrolysis of blended animal manures for
producing renewable energy and value-added biochar. Industrial & Engineering Chemistry
Research, 2010. 49(20): p. 10125-10131.
Sweeten, J.M., et al., Co-firing of coal and cattle feedlot biomass (FB) fuels. Part I. Feedlot biomass
(cattle manure) fuel quality and characteristics. Fuel, 2003. 82(10): p. 1167-1182.
Tumuluru, J.S., et al., A review of biomass densification systems to develop uniform feedstock
commodities for bioenergy application. Biofuels, Bioproducts and Biorefining, 2011. 5(8): p.
683-707.

Manure Treatment Technologies 38
5. Composting
Composting is the decomposition of solid organic materials in the presence of oxygen, leading
to a stable product with a carbon to nitrogen Ratio (C:N) less than or equal to 25.
Composting Terminology
Compost is the solid end-product of composting that meets minimum maturity requirements
with C:N less than or equal to 25. Measures of compost maturity require additional metrics as
delineated by industry accepted indices (California Compost Quality Council, 2001).
Compost Tea or Leachate is the liquid byproduct of composting. Liquid leaving properly
operating composting systems should have C:N less than 25.
Bulking Agent is material or media added to increase the porosity and aeration capacity of
manure. Some bulking agents such as wood chips, wood pulp, sawdust, dried leaves, straw, and
shredded paper also add degradable carbon to the composting mixture. These are known as
Carbonaceous Bulking Agents. Non-Carbonaceous Bulking Agents, such as shredded
tires, serve solely to increase compost porosity.
Co-Composting Agent is material added to manure to increase the volume and/or value of
compost. A co-composting agent may or may not increase porosity and aeration. Some readily
digested materials such as molasses serve as carbon sources, while others, such as food waste,
increase nitrogen content and must be counterbalanced with high carbon material.
Note: The CBWM and Scenario Builder do not explicitly account for potential nutrients
associated with bulking or co-composting agents, only the nutrients in the manure or litter itself
are explicitly accounted for. The panel believes its recommended N reductions for composting
are sufficiently conservative based on the literature that any potential or perceived discrepancy
resulting from added bulking or co-composting agents will be extremely minimal.
Types of Composting Systems
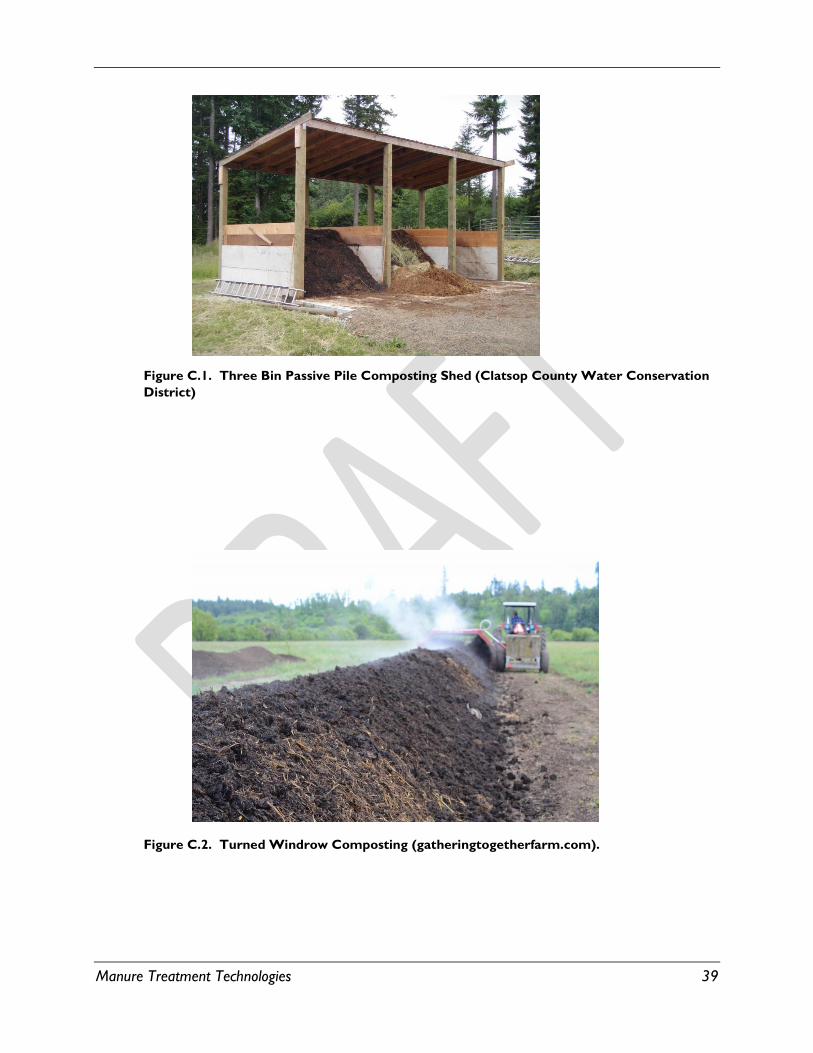
Passive Piles and Windrows rely on natural aeration. Heat generated during composting
rises and pulls air into the pile. Piles are turned or mixed occasionally. This is usually
accomplished by moving the pile from one bin to another (Figure C.1) or moving the windrow
to a new area.
Turned Piles and Windrows (Figure C.2) rely on frequent turning, usually with specialized
machinery, to aerate the compost.
Manure Treatment Technologies 39
Figure C.1. Three Bin Passive Pile Composting Shed (Clatsop County Water Conservation
District)
Figure C.2. Turned Windrow Composting (gatheringtogetherfarm.com).

Manure Treatment Technologies 40
Forced Aeration Piles and Windrows (Figure C.3) use mechanical ventilation to push air
into or draw air through the pile or windrow.
Figure C.3. Forced Aeration Pile (from O2Compost.com).
In-Vessel Composting (Figure C.4) is performed in an insulated silo, channel, or bin using a
high-rate, controlled aeration system designed to provide optimal conditions.
Figure C.4. Bin In-Vessel Composter at the University of British Columbia
(myuna.com)

Manure Treatment Technologies 41
Rotating Drum Composters (Figure C.5) are a subset of in-vessel composters that aerate
compost by turning the compost inside a rotating drum. Paddles within the drum move
compost towards the outlet of the drum.
Figure C.5. Rotating Drum Composter in Delaware County, OK. (Oklahoma
Cooperative Extension).
Other Composting Systems Not Covered in this Report
This report does not cover composting systems used to decompose animal mortalities.
Manure, particularly poultry litter, is frequently used to inoculate Mortality Composting,
however.
In-house windrowing of poultry litter is not considered composting in the view of the panel.
Although some auto-heating takes place in the process, the piles are not operated to create
marketable compost. In-house windrows are operated to achieve a small level of organic
matter stabilization and fly control between flocks. This process should be a storage process
rather than a treatment technology.

Manure Treatment Technologies 42
Vermicomposting is composting with aid of earthworms. The most common type of
earthworm used in vermicomposting is Eisenia fetida -- commonly called Red Wigglers,
Brandling Worms, Tiger Worms, Red Tiger Worms, or Lombrices Rojas Californianas. Eisenia
fetida survive in relatively diverse conditions, are voracious eaters, multiply quickly, and have
not been found to be invasive species. Vermicomposting was not considered in this report due
to the small number of farm-scale vermicomposting systems currently treating manure in the
Chesapeake Bay Watershed.
Types of Manure Used in Composting Systems
Composting is used to treat primarily solid or semi-solid manure such as beef and dairy cattle
manure, poultry litter, horse manure, horse stall cleanings, and filter cake separated from
manure slurries. Any manure can be composted if sufficient bulking agent is added to bring
moisture content and C:N within acceptable ranges.
Transfer Efficiencies of Composting Systems
Composting Systems are normally placed immediately after animal confinement for solid and
semi-solid manures, or after a solid-liquid separation process for manure slurries. Raw
materials may also be stored before processing -- especially in a centralized facility handling
manure from many farms.
Compost may be used on farm, but compost also has commercial value, making it more likely
to be used off-farm as a soil amendment to landscaping, turf grasses or gardening. When
retained on-farm it is primarily used in crop and pasture production. Compost tea also has
value as fertilizer and it is often collected and used either on or off-farm. For these reasons,
nutrients contained in compost and compost tea are shown as separated from the main manure
flow stream. Nitrogen is lost through volatilization during the composting process

Manure Treatment Technologies 43
Figure C.6. Composting Black Box Process
The three transfer efficiencies for composting are defined in the terms of Figure C.6 as:
NVE = (Mass of TN Volatalized) X 100 C.1
(Mass TN in Manure)
NSE = (Mass of TN in Compost and Compost Tea) X 100 C.2
(Mass TN in Manure)
PSE = (Mass of TP in Compost and Compost Tea) X 100 C.3
(Mass TP in Manure)
Default Transfer Efficiencies of Composting Systems
Without detailed knowledge of the process factors for a composting system, the default
Nitrogen Volatilization Efficiencies (NVE), Nitrogen Separation Efficiencies (NSE) and
Phosphorus Separation Efficiencies (PSE) listed in Table C.1 should be used as inputs to the
Chesapeake Bay Model. If the C:N of the bulking agent is known, values in Table C.8 may be
used.
Composter
Manure
N and P Contained in
Compost and Compost Tea
N Volatilized
to Atmosphere
Bulking Agent

Manure Treatment Technologies 44
Table C1. Default Transfer Efficiencies for Composting Systems.
Type of Composting System
Transfer Efficiency (%)
NVE NSE PSE
Turned Pile and Windrow 25 75 100
Static Pile and Windrow 26 74 100
In-Vessel and Rotating Bin 10 980 100
Forced Aeration 25 75 100
Review of Available Science on Composting
Compost quality is a direct product of the inputs to the composting process, which include
manure and bulking agents. The major concern of compost processes is the control of C and
N losses since they reduce the agronomic value of the product and, particularly in the case of
N, pose environmental threats.
Initial C:N Ratio
Carbon and N compounds are most likely to limit the composting process if not present in a
desirable balance. In general, 35 is considered the minimum C:N at which a sufficiently large
compost pile will auto heat. Carbon to nitrogen ratios for manures generally range from 13:1
in poultry manure to 20:1 in dairy manure, with swine manure falling somewhere in between.
Carbonaceous bulking agents generally have a high C:N ratios; i.e., 80:1 for yard wastes and
500:1 for woodchips. Manure provides nitrogen microbes need for protein synthesis, and
carbonaceous bulking agents provide the energy needed for microbial decomposition.
Other Process Factors
Other process factors that impact composting include temperature, pH, moisture, and oxygen
supply. Active management of moisture, temperature and oxygen supply is accomplished by
establishing an effective turning frequency or other mechanical means of aeration. Some
acceptable ranges for these factors are listed in the Table C.2., but conditions outside of these
ranges may also be acceptable depending on the individual operation. The selection of bulking
agents and control of optimal operating conditions affects the final product maturity and the
time it takes to reach maturity. If temperature, oxygen content, porosity of the pile, or pH falls
outside the optimal range for the composting process, then the overall time it takes for the
compost to reach maturity will increase proportional to the time it is outside of the optimal
parameters.
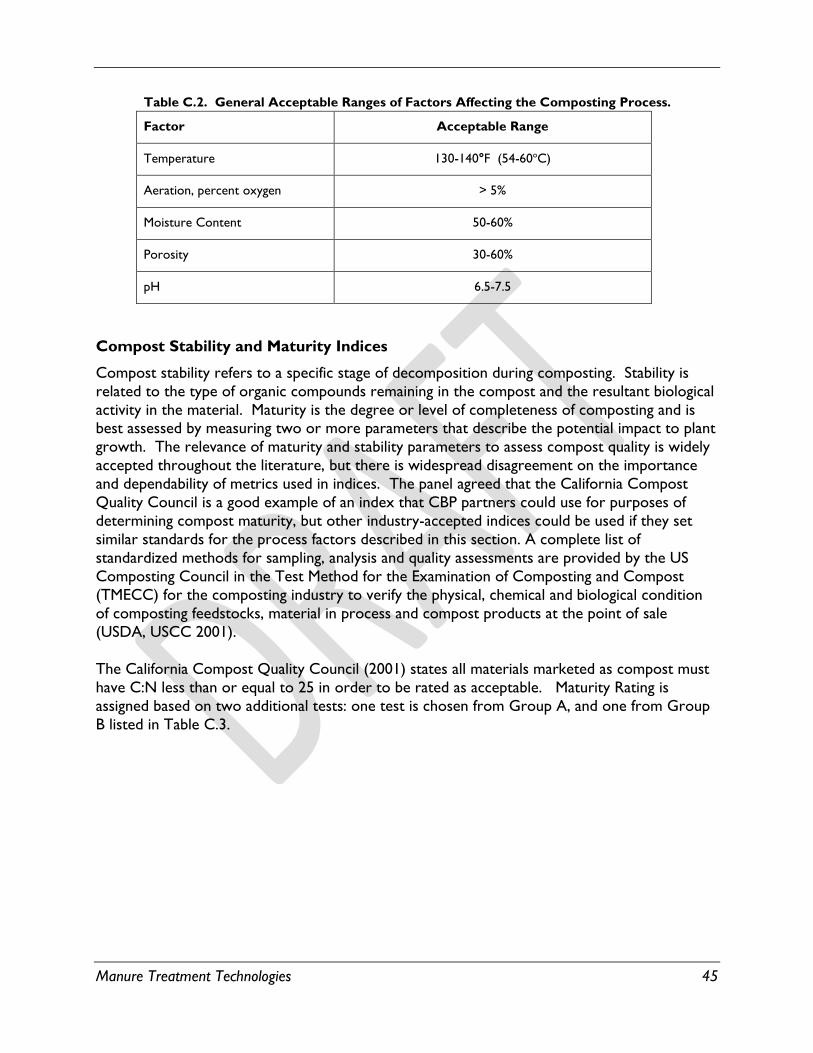
Manure Treatment Technologies 45
Table C.2. General Acceptable Ranges of Factors Affecting the Composting Process.
Factor Acceptable Range
Temperature 130-140°F (54-60oC)
Aeration, percent oxygen > 5%
Moisture Content 50-60%
Porosity 30-60%
pH 6.5-7.5
Compost Stability and Maturity Indices
Compost stability refers to a specific stage of decomposition during composting. Stability is
related to the type of organic compounds remaining in the compost and the resultant biological
activity in the material. Maturity is the degree or level of completeness of composting and is best assessed by measuring two or more parameters that describe the potential impact to plant
growth. The relevance of maturity and stability parameters to assess compost quality is widely
accepted throughout the literature, but there is widespread disagreement on the importance
and dependability of metrics used in indices. The panel agreed that the California Compost
Quality Council is a good example of an index that CBP partners could use for purposes of
determining compost maturity, but other industry-accepted indices could be used if they set
similar standards for the process factors described in this section. A complete list of
standardized methods for sampling, analysis and quality assessments are provided by the US
Composting Council in the Test Method for the Examination of Composting and Compost
(TMECC) for the composting industry to verify the physical, chemical and biological condition
of composting feedstocks, material in process and compost products at the point of sale
(USDA, USCC 2001).
The California Compost Quality Council (2001) states all materials marketed as compost must
have C:N less than or equal to 25 in order to be rated as acceptable. Maturity Rating is
assigned based on two additional tests: one test is chosen from Group A, and one from Group
B listed in Table C.3.

Manure Treatment Technologies 46
Table C3. The California Compost Quality Council Maturity Index (CCQC, 2001).
Rating
Very
Mature Mature Immature
Group A: Stability Methods
Oxygen Uptake Rate (OUR) O2 TS-1 hr-1 < 0.4 0.4-1.3 > 1.3
Specific Oxygen Uptake Rate (SOUR) O2 1BVS-1hr-1 < 0.5 0.5 -1.5 > 1.5
Carbon Dioxide Evolution Rate CO2 VS-1 day-1 < 2 2-8 > 8
Respiration Rate O2 VS-1day-1 < 5 5-14 > 14
Self-Heating Test Temp. Rise (°C) < 10 10-20 > 20
Group B: Maturity Methods
Ammonium : Nitrate Ratio < 0.5 0.5-3 > 3
Ammonia Concentration Ppm, dry basis < 100 100-500 > 500
Volatile Organic Acids Ppm, dry basis <200 200-1000 > 1000
Seed Germination % of 2control > 90 80-90 < 80
Plant Trails % of 2control > 90 80-90 < 80
1BVS – Biodegradable Volatile Solids. 2Control refers to germination or growth in only water or potting soil treatment.
The California Compost Quality Council (2001) suggests using maturity indices to regulate the
use of compost along the following lines:
Very Mature Compost should be used in soil and peat-based container plant mixes, in
alternative topsoil blends, and in turf top-dressing.
Mature Compost is recommended for general field use (pastures and hay, in vineyards and row
crops, and as a substitute for low-analysis organic fertilizers where applicable.
Immature Compost should be used in land application to fallow soil, and feedstock for further
composting.
Organic Matter Reduction Tthrough Composting
The second most important effect of composting, after stabilizing organic matter, is reduction in
the mass and volume of manure. This reduction in mass is accomplished by removing organic
carbon. Table C.4 lists the expected base removal efficiency of organic carbon of different
composting systems and manure types.

Manure Treatment Technologies 47
Table C4. Base Organic Carbon Volatilization Efficiencies (%) of Composting Systems.
Type of Composting System
Type of Manure Composted
Beef Dairy Poultry Swine Mixed
Turned Pile and Windrow 35 46 35 45 35
Static Pile and Windrow 40 40 30 50 30
In-Vessel and Rotating Bin 30 30 25 35 25
Forced Aeration 15 15 9 15 9
The values given in Table C.4 are for generic composting systems with unknown bulking agents
and represent base C mass removal efficiency. If the bulking agent is known to be wheat straw, cornstalks, or wood products, the base values in Table C.4 can be multiplied by the factor in
Table C.5 to determine a more accurate organic carbon volatilization efficiency. For example, if
a turned windrow beef manure composter uses straw as a bulking agent, multiply the value in
Table C4 (base C mass removal efficiency of 35%) by 1.2 to give a carbon mass removal
efficiency of 42%.
Table C.5. Factors for Modifying Organic Matter Removal Efficiencies based
on Bulking Agents.
Bulking Agent C:N Multiplicative Factor
Wheat Straw 40:1 to100:1 1.2
Cornstalk 30:1 to 80:1 1.15
Woodchips/Sawdust 100:1 to 500:1 1.1
Nutrient Transformations
Much of the N in manure is transformed to microbial biomass (Org-N) during composting.
Most of the remaining TN is in the form of NO3-N in mature compost. Manure nitrogen is lost
during the composting process by two pathways: 1) through liquid transport as leachate
(dissolved NO3-), or runoff (NH4
+ bound to particles or organic N contained in particles); and
2) through emissions of gases such as NH3 and NOx. The nitrogen lost through leaching can be
recovered as compost tea. Most states in the Chesapeake Bay Watershed require runoff water
to be contained either by covering the composting area or in a capture and reuse system.
Because of these factors, the only expected loss of manure TN is through nitrogen
volatilization. Sommer (2001) found that covering or compacting compost piles reduced
emissions up to 18%. These practices may be considered as recommended best management

Manure Treatment Technologies 48
practices where NH3 emissions are a concern. Table C.6 lists the expected base total nitrogen
volatilization efficiency of different composting systems.
Table C.6. Base Total Nitrogen Volatilization Efficiencies (%) of Composting Systems.
Type of Composting System
Type of Manure Composted
Beef Dairy Poultry Swine Mixed
Turned Pile and Windrow 25 25 25 30 25
Static Pile and Windrow 28 28 26 40 26
In-Vessel and Rotating Bin 12 12 10 15 10
Forced Aeration 25 25 35 30 25
If the bulking agent or the C:N ratio of the bulking agent is known, then the base total nitrogen
removal efficiencies given in Table C.6 may be adjusted by the multiplicative factors listed in
Table C.7. For example, if a turned windrow beef manure composter uses straw as a bulking
agent; multiply the value in Table C.7 (base value of 25%) by 1.25 to give a nitrogen mass
removal efficiency of 31.25%.
Table C.7. Factors for Modifying Base Total Nitrogen Volatilization Efficiencies
based on Bulking Agents.
Bulking Agent C:N Ratio Multiplicative Factor
Wheat Straw 40-100:1 1.25
Cornstalk 30-80:1 1.1
Woodchips/Sawdust 100-500:1 1.1
Phosphorus in compost is mainly found in inorganic fractions. Dissolved inorganic phosphorus can be lost during composting primarily as runoff, and as leachate during and
following rain events. Sharpley and Moyer (2000) suggest that water extractable phosphorus
may be used to estimate the potential for land-applied manure or composts to enrich leachate
and surface runoff.
Nutrient Transformations
Manure Nitrogen is transformed to microbial biomass (Org-N) during composting. Much of
the remaining TN exists as NO3-N in mature compost. Manure nitrogen is lost during the
composting process by three pathways: 1) liquid transport as leachate (dissolved NO3-), 2)

Manure Treatment Technologies 49
liquid transport in runoff (NH4+ bound to particles or Org-N contained in particles); and 3)
through emissions of gases such as NH3 and NOx. Eghball et al. (1997) found that 92% of
manure TN lost from windrow composting of beef manure was through gaseous emissions,
with the balance leaving in runoff and leachate.
Nitrogen lost through leaching can be recovered as compost tea. Most states in the
Chesapeake Bay Watershed require runoff water to be contained either by covering the composting area or in a capture and reuse system.
Almost all of the volatilized nitrogen leaves the compost pile as NH3. Less than 6% of nitrogen
is volatilized as N2O (Zeman et al., 2002). Ammonia emissions depend on both C:N of the pile
and the concentration of easily decomposable forms of nitrogen in manure (Tiquia et al., 2000;
Peigne and Biardin, 2004). Compost Piles with low initial C:N made from manure with high
concentrations of Nitrate (NO3-1), urea, and ammoniacal nitrogen emit the most NH3. Other
important factors in NH3 emission are pH and temperature. Basic compost piles with high
temperatures emit more NH3 than cool, acidic piles. Sommer (2001) found that most NH3
losses occur during the initial 5 to 19 days of pile formation as the piles are heating. Exposure
of pile surfaces to the atmosphere also increases NH3 volatilization. Sommer (2001) found
total nitrogen emissions losses were 28% for uncovered piles of deep bed dairy manure, and 12
to 18% for covered piles.
Nitrous oxide is formed during incomplete ammonia oxidation and incomplete denitrification,
and high temperatures inhibit formation of N2O (Rowan et al., 2009). Most authors found that
the greatest emissions of N2O occur in wet piles after the initial heating phase of composting,
when much of the readily available carbon has been depleted. (He et al., 2001; Sommer, 2001;
Amlinger et al., 2008; Brown and Subler, 2007). A few studies (Hellmann et al., 1995; Beck-Friis
et al., 2000) recorded high N2O emissions early in pile formation, but in these cases, N2O was
released by denitrification of NO3-1 present in the raw materials added to the composting pile.
Table C.6 lists the expected base total nitrogen volatilization efficiency of different composting
systems. This table takes into account the type of nitrogen compounds found in raw manure
and the amount of exposure the compost pile experiences.
Table C.6. Base Total Nitrogen Volatilization Efficiencies (%) of Composting Systems.
Type of Composting System
Type of Manure Composted
Beef Dairy Poultry Swine Mixed
Turned Pile and Windrow 25 25 25 30 25
Static Pile and Windrow 28 28 26 40 26
In-Vessel and Rotating Bin 12 12 10 15 10
Forced Aeration 25 25 35 30 25

Manure Treatment Technologies 50
Low initial C:N is a critical factor affecting N loss in composting (Tiquia et al., 2000). If the
bulking agent or the C:N ratio of the bulking agent is known, then the base total nitrogen
volatilization efficiencies given in Table C.6 may be adjusted by the multiplicative factors listed in
Table C.7. For example, if a turned windrow beef manure composter uses straw as a bulking
agent; multiply the value in Table C.7 (base value of 25%) by 1.25 to give a nitrogen mass
volatilization efficiency of 31.25%.
Table C.7. Factors for Modifying Base Total Nitrogen Volatilization Efficiencies
based on Bulking Agents.
Bulking Agent C:N Ratio Multiplicative Factor
Wheat Straw 40-100:1 1.25
Cornstalk 30-80:1 1.1
Woodchips/Sawdust 100-500:1 1.1
Phosphorus in compost is mainly found in inorganic fractions. Dissolved inorganic phosphorus can be lost during composting primarily as runoff, and as leachate during and
following rain events. Sharpley and Moyer (2000) suggest that water extractable phosphorus
may be used to estimate the potential for land-applied manure or composts to enrich leachate
and surface runoff.

Manure Treatment Technologies 51
Defined Transfer Efficiencies Based on Process Factors
If the C:N of the bulking agent used in a particular composting system is known, the defined
transfer efficiencies given in Table C.8 may be used for input into the Chesapeake Bay Model.
Table C8. Defined Transfer Efficiencies based on Composting System and C:N of Bulking Agent.
Type of
Composting
System
C:N of Bulking Agent <100 C:N of Bulking Agent >100
Transfer Efficiency (%) Transfer Efficiency (%)
NVE NSE PSE NVE NSE PSE
Turned Pile and
Windrow 32 68 100 28 72 100
Static Pile and
Windrow 33 67 100 29 71 100
In-Vessel and
Rotating Bin 13 87 100 11 89 100
Forced Aeration 32 68 100 28 72 100
Ancillary Benefits of Composting
Land Application
By definition, finished compost has C:N at or below 25. At this C:N, compost will not remove
N from the soil. Many types of manure, such as horse stall cleanings have C:N much higher
than 25. If these highly carbonaceous materials are land applied, they may rob nitrogen from
the soil – soil microorganisms that decompose carbonaceous use soil N in order to digest the
added carbon.
The stabilized organic matter in mature compost reduces nuisance conditions during
application. The less odorous organic matter does not draw flies or complaints from the neighbors.
Depending on the amount and type of bulking agent used, compost used for land application
may have less volume and mass than the original manure. This means less material must be
hauled out to the fields.
Marketing Potential
Composting should results in a reproducible product of known quality. This attribute along
with the stability of organic matter increases the likelihood that compost will be transported
greater distances than raw manure and potentially out of the watershed than raw manure.

Manure Treatment Technologies 52
Pathogen Reduction
During the initial stages of composting, temperature within a composting bin may reach
between 130 to 140o F. Completeness of pathogen kill depends on length of time the compost
is heated, as well as, how well the material is mixed during heating. Rotating bin composters
have an advantage in this area, because if sufficiently large and insulated the entire contents of
the bin will be heated and turning ensures complete mixing.
Potential Hazards of Composting
Bin Leachate
If compost tea is not contained, organic matter and nutrients can leach into groundwater or
runoff to surface water. For this reason, most states require farm-scale composting units to be
constructed under roof or on top of an impermeable surface. If open to the atmosphere, all
runoff from the compost area should be contained, stored, and either treated or recycled to
the compost pile.
Nitrogen Emissions:
If composting is not complete nitrogen may leave the pile in the form of ammonia gas. If the
pile contains anoxic areas and denitrification is not complete, nitrogen may be emitted as N2O gas, which is a potent greenhouse gas.
References
Bernal, M.P., Alburquerque, J.A., Moral, R., 2009. Composting of animal manures and chemical
criteria for compost maturity assessment. A review. Bioresource Technology, 100(22):
5444-5453.
California Compost Quality Council. 2001. Compost Maturity Index, Nevada City, CA.
Mahimairaja, S., Bolan, N.S., Hedley, M.J., Macgregor, A.N., 1994. Losses and transformation of
nitrogen during composting of poultry manure with different amendments: An
incubation experiment. Bioresource Technology, 47(3): 265-273.
Martins, O., Dewes, T., 1992. Loss of nitrogenous compounds during composting of animal
wastes. Bioresource Technology, 42(2): 103-111.
Ministry of Agriculture and Food, B.C., 1996. Characteristics of On-farm Composting Materials.
Sharpley, A., Moyer, B., 2000. Phosphorus Forms in Manure and Compost and Their Release
during Simulated Rainfall. Journal of Environmental Quality, 29(5): 1462-1469.
Sommer, S.G., 2001. Effect of composting on nutrient loss and nitrogen availability of cattle
deep litter. European Journal of Agronomy, 14(2): 123-133.
United States Department of Agriculture, US Composting Council, 2001. "Test Methods for
the Examination of Compostying and Compost." Editor: W. H. Thompson.

Manure Treatment Technologies 53
Zucconi, F.D.a.B., M, 1987. Compost specifications for the production and characterization of
compost from municipal solid waste. Compost: production, quality and use. . Elsevier,
New York.
References
Amlinger, F., P. Stefan, and C. Cuhls. 2008. Greenhouse gas emissions from composting and
mechanical biological treatement. Waste Management and Research 26:47-60.
Beck-Friis, B. M. Pell, U. Sonesson, H. Jonsson, and H. Kirchmann. 2000. Formation and
emission of N2O and CH4 from compost heaps of organic household waste.
Environmental Monitoring and Assessment. 62:317-331.
Bernal, M.P., Alburquerque, J.A., Moral, R., 2009. Composting of animal manures and chemical
criteria for compost maturity assessment. A review. Bioresource Technology, 100(22):
5444-5453.
Brown, S., and S. Subler. 2007. Composting and greenhouse gas emissions: a producer's
perspective. BioCycle. 48(3): 37-41.
California Compost Quality Council. 2001. Compost Maturity Index, Nevada City, CA.
Eghball, B., J.F. Power, J.E. Gilley, J.W. Doran. 1997. Nutrient, carbon, and mass loss during
composting of beef cattle feedlot manure. J. Env. Qual. 14:123-133.
He, Y. Y. Inamori, M. Mizuochi, H. Kong, N. Iwami, and T. Sun. 2001. Nitrous oxide emissions
from aerated composting of organic waste. Enivronmental Science and Technology.
35(11): 2347-2351.
Hellmann, B., L. Zelles, A. Palojarvi, and Q. Bai. 1997. Emission of climate relavant trace gases
and succession of microbial communities during open winrow composting. Appl.
Eiviron. Microbiology. 63(3):1011-1018.
Mahimairaja, S., Bolan, N.S., Hedley, M.J., Macgregor, A.N., 1994. Losses and transformation of
nitrogen during composting of poultry manure with different amendments: An
incubation experiment. Bioresource Technology, 47(3): 265-273.
Martins, O., Dewes, T., 1992. Loss of nitrogenous compounds during composting of animal
wastes. Bioresource Technology, 42(2): 103-111.
Ministry of Agriculture and Food, B.C., 1996. Characteristics of On-farm Composting Materials.
Peigne, J. and P. Birardin. 2004. Environmental impacts of farm-scale composting practices.
Water, Air, and Soil Pollution. 153:45-68.
Rowan, E., N. Nadkarni, V. Thompson, D. Lizas, and R. Freed. 2009. WARM organics
literature review update - estimages of GHG emissions during the composting process.
Memo to Jennifer Brady, USEPA. Washington, DC: ICF International.
Sharpley, A., Moyer, B., 2000. Phosphorus Forms in Manure and Compost and Their Release
during Simulated Rainfall. Journal of Environmental Quality, 29(5): 1462-1469.

Manure Treatment Technologies 54
Sommer, S.G., 2001. Effect of composting on nutrient loss and nitrogen availability of cattle
deep litter. European Journal of Agronomy, 14(2): 123-133.
Tiquia, S.M., T.L.Richard, and M.S. Honeyman. 2000. Carbon, nutrient, and mass loss during
composting. Nutrient Cycling in Agroecosystems. 62:15-24.
United States Department of Agriculture, US Composting Council, 2001. "Test Methods for
the Examination of Compostying and Compost." Editor: W. H. Thompson.
Zeman, C., Depken, D. and M. Rich. 2002. Research on how the composting process impacts
greenhouse gas emissions and global warming. Compost Sci. Util. 10:72-86.
Zucconi, F.D.a.B., M, 1987. Compost specifications for the production and characterization of
compost from municipal solid waste. Compost: production, quality and use. . Elsevier,
New York.

Manure Treatment Technologies 55
6. Anaerobic Digestion
Anaerobic Digestion uses naturally occurring microorganisms to rapidly decompose organic
matter in the absence of oxygen, forming biogas.
Anaerobic Digestion Terminology
Biogas is the gaseous material produced during the complete anaerobic breakdown of organic
matter. Biogas is a mixture of Methane (CH4), Carbon dioxide (CO2), and other minor, but not
insignificant gases: Hydrogen (H2), Hydrogen sulfide (H2S), Water Vapor (H2O) and Volatile
Fatty Acids (VFA). Methane is flammable with a high heat value of 1,000 BTU ft-3. The energy
content of biogas is dependent upon its methane content and is generally within the range 400
to 700 BTU ft-3.
Influent is the liquid, slurry, or semisolid material entering a digester. The digestible, organic
portion of influent is called Substrate.
Sludge is the material that settles in digestion reactors. Sludge may also refer to the portion
of settled material that is removed from the reactor. Sludge is a mixture of active
microorganisms, digested substrate, and inert material.
Effluent is the treated material leaving an anaerobic digester. Effluent may be a mixture of
sludge and treated liquids, or simply the liquid portion of a reactor’s content. Effluent may be
liquid, slurry, or semi-solid in consistency. Effluent is sometimes referred to as ‘Digestate’.
Co-Digestion Substrates are highly digestible organic materials added to influent to increase
biogas production.
Types of Anaerobic Digesters
Complete Mix Digesters (Figure AD.1) are mixed so that sludge is completely suspended in
the reactor vessel. The volume of effluent leaving a complete mixed digester is equal to the
amount of influent entering. Intermittent Mixed Digesters are a subcategory of completely
mixed digestion in which mixing is pulsed, and sludge is allowed to settle for extended periods
between mixing. Complete mix digesters work best when manure contains 3 to 6% solids. At
lower solids concentrations, the digester volume must be comparatively larger, and the energy
required to mix and heat the reactor may exceed the energy available in biogas.

Manure Treatment Technologies 56
Figure AD.1. Complete Mix Anaerobic Digesters Treating Dairy Manure Slurry and Food Waste
near Madison, WI. (Oklahoma Cooperative Extension Service).
Plug Flow Digesters (Figure AD.2) are similar to complete mix digesters in that manure
flowing into the digester displaces digester volume, and an equal amount of material flows out.
However, the contents of a plug flow digester are thick enough to keep particles from settling.
Manure moves through the digester as a plug, hence the name “plug flow”. Plug flow digesters
do not require mechanical mixing. Total solids content of manure should be at least 15%, and
some operators recommend feeding manure with solids as high as 20%. This means operators
may need to add extra material to increase the solids content of manure to use a plug flow
digester. In some designs, effluent is returned to the head of a plug flow digester to inoculate
the substrate with actively growing microbes.
. Figure AD.2. Plug Flow Anaerobic Digester Located on the Schrack Family Dairy Farm in
Clinton County, PA (Penn State Extension).

Manure Treatment Technologies 57
A Mixed Plug Flow Digester is a patented variation on a plug flow digester in which manure
flows down a hairpin raceway (Figure AD.3). The contents are heated along the central divider
and pressurized biogas is reintroduced into the reactor so that manure mixes in a corkscrew
pattern as the plug flows down the hairpin.
Figure AD3. Birds Eye Schematic Diagram of Mixed Plug Flow Anaerobic Digester based on US
Patent 8,202,721 (From Hamilton, 2014b).
Covered Lagoon Digesters take advantage of the low maintenance requirement of a lagoon
while capturing biogas under an impermeable cover (Figure AD.4). The first cell of a two-cell
lagoon is covered, and the second cell is uncovered (Figure AD.5). Both cells are needed for
the system to operate efficiently. The liquid level of the first cell remains constant to promote
efficient manure breakdown. The second stage acts as storage and its liquid level will vary as
effluent is removed for land application. Sludge may be stored in the first cell of covered lagoon
digesters for up to 20 years. Storing sludge in the first cell also means much of the fertilizer
nutrients, particularly phosphorus, remain trapped in the covered lagoon until sludge is cleaned
from the cell. It is very costly to heat covered lagoons for optimal biogas production. The
temperature of covered lagoons follows seasonal patterns; therefore, they are sometimes called Ambient Temperature Digesters, Because of their reliance on ambient temperatures
covered lagoon digesters are more common in regions south of the Chesapeake Bay
watershed.
Manure
Inflow
Effluent
Outflow
Partition
Heating Tubes
Wall

Manure Treatment Technologies 58
Figure AD4. First Cell of a Covered Lagoon Digester System Located on the Oklahoma
State University Swine Research and Education Center (Oklahoma Cooperative Extension
Service).
Figure AD5. Schematic Drawing of a Covered Lagoon Digester (From Hamilton, 2014b)
First Cell: Anaerobic Treatment
and Sludge Storage
Gas Tight Cover
Biogas Recovery
Second Cell: Odor Control Treatment
and Effluent Storage
Manure Inflow
Effluent OutflowFree Liquid Surface

Manure Treatment Technologies 59
Other Digestion Systems not covered in this Report
Anaerobic digesters can be arranged in single stage (all processes taking place in one reactor
vessel) or multi stage systems (separated reactors for different processes). For the purposes
of this report, we will only consider single stage complete mix, plug flow, mixed plug flow, and
covered lagoon digesters. The other digestion systems described below may become more
common on farms in the Chesapeake Bay Watershed.
High Rate Systems are digesters that increase biogas production efficiency by retaining living
biomass in the digestion reactor. Fixed Film Reactors are digesters in which biogas
producing microorganisms are cultivated in biofilms growing on solid media in the reactors,
Contact Stabilization Reactors are digesters in which biologically active solids are recycled
back to the reactor after settling or centrifuging effluent. Upflow Anaerobic Sludge
Blanket Reactors (UASB), Induced Sludge Blanket Reactors (IBR) and Anaerobic
Sequencing Batch Reactors (ASBR), are digesters that use the settling characteristics of
sludge solids to keep microorganisms in the reactor.
Anaerobic Membrane Bioreactors are similar to fixed filmed reactors in that biofilm is
cultivated on thin sheets of textile. High strength organic liquids pass through the membrane
under pressure where they are converted to biogas. Pieces of fabric are also added to UASB
reactors to increase biogas production. These digesters are called Suspended Particle
Attached Growth Reactors.
Solid State Anaerobic Digestion is a process in which solids degradation is performed on
solid, stackable material in a separate reactor prior to methane conversion. This is an
emerging technology that could potentially make wide-spread use of manure in the co-digestion
of lignocellulosic materials.
Types of Manure Used
The most common types of digesters used in the Chesapeake Bay Watershed are complete mix
reactors for dairy manure slurry, plug flow and mixed plug flow for semi-solid dairy manure,
and covered lagoon digesters for low-solids slurry swine and dairy manure.
Transfer Efficiencies of Anaerobic Digestion
Anaerobic digesters are normally placed immediately after animal confinement -- to receive the
freshest substrate possible. Anaerobic digestion may be preceded by a pretreatment system to
alter fresh manure to make it more useable in the digester. The two most common
pretreatment schemes are settling to concentrate substrate, and mechanical solid-liquid
separation to remove suspended solids from liquid influent. Co-digestion substrates may be
added to influent to increase biogas production.

Manure Treatment Technologies 60
A black box diagram for anaerobic digestion is shown in Figure AD.6. The box represents a
complete mix digester, a plug flow digester, a mixed-plug flow digester, or the first cell of a
covered lagoon digester.
Figure AD6. Anaerobic Digestion Black Box Process
Biogas contains only trace amounts of nitrogen, so nitrogen transfer by volatilization are
insignificant for all types of anaerobic digesters.
Sludge is mixed with liquid effluent in complete mix digester; therefore, nutrients are not
separated from the main manure flow. Likewise, the nutrients in the semi-solid effluent of plug
flow and mixed plug flow digester are not separated from the main manure stream. Sludge
settles to the bottom of the first cell of covered lagoon digesters. It may remain captured in
the first cell for up to 20 years, and once removed; lagoon sludge is often sold and spread away
from the original farm.
If sludge is stored in a covered lagoon for greater than 10 years, separation efficiencies can be
calculated using Equations AD.1 and AD.2.
NSE = (Mass of TN in Sludge) X 100 AD.1
(Mass of TN in Influent)
PSE = (Mass of TP in Sludge) X 100 AD.2
(Mass of TP in Influent)
Anaerobic
Digester
Manure Slurry, Liquid,
or Semi-Solid (Influent)
N or P in
Effluent
N or P in
Sludge

Manure Treatment Technologies 61
Default Transfer Efficiencies for Anaerobic Digestion
Without detailed knowledge of the process factors for anaerobic digester, the default Nitrogen
Volatilization Efficiencies (NVE), Nitrogen Separation Efficiencies (NSE) and Phosphorus
Separation Efficiencies (PSE) are zero (0).
If the sludge storage time of a covered lagoon digester exceeds 10 years, the transfer
efficiencies given in Table AD.3 may be used for input into the Chesapeake Bay Model.
Review of Available Science on Anaerobic Digestion
Anaerobic digestion is the biological decomposition of organic matter in the absence of oxygen.
The main effect of anaerobic digestion is to convert organic carbon to biogas. The conversion
process takes place in a number of biologically activated steps (Figure AD.7), with each step
requiring a separate community of microorganisms. The relationship is symbiotic, in that each
community completes a separate step in digestion. Each community produces its own waste,
and the waste of one is the food of another. Anaerobic digestion involves two to four steps,
depending on where you draw lines in the process (Figure AD.7). Communities of hydrolytic
bacteria (sometimes called liquefiers) break complex organic matter (OM) down into simpler compounds. Acid forming bacteria (acidifiers) convert the simple compounds to volatile fatty
acids (VFA) – principally acetic acid (vinegar). Hydrolysis (liquid formation) and acidosis (acid
formation) are commonly lumped together and called anaerobic fermentation. Some
microbiologists also distinguish between formation of mixed volatile fatty acids (acidosis) and
the creation of acetic acid (acetogenesis). Methanogens are methane forming microorganisms
belonging to the Archaea domain -- very simple, single-cell organisms similar to bacteria.
Methanogens take the end products of anaerobic fermentation – VFA, H2, CO2, and H2O – and
use them to form methane. Other byproducts of methanogenesis include Ammonium (NH4+1)
and Sulfide (S-1) ions.
Key Process Factors
Hydraulic Retention Time (HRT) is the average time liquid remains in an anaerobic
digester. Anaerobic digestion commonly takes place in a continuous flow reactor. If the working volume of the reactor does not change, and the volume entering the reactor (influent)
equals the volume leaving (effluent), HRT is calculated by dividing the reactor working volume
by the effluent flow rate.
Cell Retention Time is calculated by dividing the mass of microorganisms residing in the
reactor by the mass of organisms leaving the reactor. If cell retention time is greater than the
time required for microbes to reproduce, the microbial population remains stable. If cell
retention time is shorter than the reproduction time, a new cell will not replace one leaving the
reactor, and the population declines, or “washes out”.

Manure Treatment Technologies 62
Figure AD.7. Conversion of Organic Matter to Biogas through Anaerobic Digestion (from
Hamilton, 2014a).
Complex Organic MatterCarbohydrates, Proteins, Lipids
Soluble Organic MoleculesSugars, Amino Acids, Fatty Acids
Volatile Fatty
Acids
Acetic Acid H2, CO2, NH4
+, S
-
CH4 + CO2
3
1
2
44
1 Hydrolysis
2 Acidosis
3 Acetogenesis
4 Methanogenesis

Manure Treatment Technologies 63
Solids Retention Time (SRT) is often substituted for cell retention time, because it is easier
to measure the total mass of solid particles than the mass of living organisms in a reactor. Solids
retention time is calculated by dividing the mass of solids in the reactor by the mass of solids
leaving the reactor.
Food to Mass Ratio (F:M) is the ratio of digestible substrate fed to a digester to the mass of
active biomass in the reactor. Food to mass ratio defines where microbial communities are
situated on the generalized microbial growth curve.
Organic Loading Rate (OLR) is the mass of organic matter fed to a digester divided by the
volume of the reactor. Organic loading rate approximates F:M but does not require knowing
the mass of microorganism retained in the reactor.
Operating Temperature determines the species of microorganisms inhabiting the reactor.
Digesters are divided into four categories based on temperature: thermophilic (those operating
at temperatures greater than 122oF (50oC), mesophilic (those operating close to 95oF-35oC), cryophilic (operating at temperatures lower than 95oF-35oC), and ambient (those that follow
the naturally occurring temperature).
Optimum operating conditions for types of anaerobic digesters covered in this report are given
in Table AD.1.
Table AD.1: Optimum Operating Conditions for Single-Stage Anaerobic Digesters based on Type of
Reactor and Temperature Regime of Microflora.
Complete Mix and Plug Flow
Covered
Lagoon Thermophilic Mesophilic
Operating Temp (oF) 125-135 85-100 Variable
Solids Retention Time (days) 10-15 20-30 >60
Organic Loading Rate (lbs VS 1000 ft-3 day-1) 60-400 50-300 91
1based on climatic conditions existing in the Central Chesapeake Bay (NRCS, 2003).
Key Measures of Digester Performance
Organic Matter Removal Efficiency (OMRE) measures how thoroughly a reactor digests
substrates through anaerobic fermentation. Organic Removal Efficiency is calculated by
subtracting the mass of organic matter leaving the digester from the mass of organic matter
entering the digester and dividing by the mass of organic matter entering the digester. Either
Volatile Solids (VS) or Chemical Oxygen Demand (COD) can be used to measure organic

Manure Treatment Technologies 64
matter. Organic matter removal efficiency is the chief parameter used to measure the ability of
digesters to reduce the pollutant strength of influent.
Methane Yield (MY) is calculated by dividing the volume of CH4 gas produced over a given
time period (usually one day) by the mass of OM added to the reactor over the same time
period. Organic matter can be measured as either VS or COD; but, depending on the analysis
method used, MY may have a slightly different meaning. Two factors affect the percentage of
CH4 in biogas: substrate digestibility and F:M. As digestibility increases and F:M decreases, the
percentage of CH4 in biogas increases.
Volumetric Reactor Efficiency (VRE) is calculated by dividing the daily CH4 production rate
by the volume of reactor. Volumetric reactor efficiency is a rough measure of the net energy
production of a digester. If VRE is high, it is unlikely that “parasitic” loads (energy that is
diverted to operate the digester -- to mix or heat the reactor, for example) will be greater than
the energy output of the digester. It is important to report only the volume of CH4 produced
when calculating VRE, because the other gaseous components of biogas have little heating value.
Removal of Organic Matter
The highest expected OMRE for manure digested by the digestion systems covered in the
report is 60%. Actual VS removal is heavily dependent on OLR as shown in Figure AD.8.
Figure AD.8. Effect of OLR on OMRE for Farm-scale, Mesophilic, Single Cell Cattle and Swine
Manure Digesters (from Camarillo et al., 2013; Gooch and Labatut, 2014; Gooch and Pronto, 2008;
Pronto and Gooch, 2008a; Pronto and Gooch, 2009; Schievano et al., 2011; Shayya, 2008).
0
10
20
30
40
50
60
70
80
50 100 150 200 250 300
VS
Re
du
ctio
n E
ffic
ien
cy (
%)
Organic Loading Rate (lb VS 1,000 ft-3 day-1)

Manure Treatment Technologies 65
Given the dependence of organic matter removal on loading rate, the VS removal efficiency of
the digesters covered in this report can be estimated to be those tabulated in Table AD.2.
Table AD.2. Values for Volatile Solids Removal Efficiencies based on Digester Type, Operating
Temperature, Retention Time, and Organic Loading Rate.
Type of Digester
Operating
Temp
(oF)
Minimum HRT
(days)
OLR
(lbs VS 1000 ft-3 day-1)
VS
Removal
Efficiency
(%)
Plug Flow
Mixed Plug Flow
Complete Mix
90-105 20
<100
100-250
>250
50
40
20
Plug Flow
Mixed Plug Flow
Complete Mix
130-140 10
<150
150-350
>350
50
40
30
Covered Lagoon
HRT ≥ Value
Given in
Figure AD.9
OLR ≤ Value
Given in
Figure AD.10
50
Figure AD.9. Minimum Hydraulic Retention Time (days) for Covered Lagoon Digesters (From
NRCS , 2003)

Manure Treatment Technologies 66
Figure AD.10. Maximum Organic Loading Rate (lbs VS 1000 ft-3 day-1) for Covered Lagoon
Digesters (From NRCS, 2003)
With properly designed and operated digesters, it is expected that organic matter will be
completely digested to biogas, but in many cases – especially in overloaded digesters – organic
matter may be converted to volatile fatty acids, with only a small portion becoming biogas. This
incomplete digestion may actually increase the pollutant strength of manure, due to the high
oxygen demand of volatile organic acids. Alburquerque, et al. (2011) showed that land
application of effluent from heavily loaded, out-of-balance digesters leads to nitrogen
immobilization in soil. The undigested organic carbon in the effluent, combined with low
soluble nitrogen content, results in increased growth of microorganisms in the soil and removal
of soil nitrogen.
Nutrient Transformations
Anaerobic digestion does not alter the Total Nitrogen (TN) content of manure. A common
feature of digestion; however, is conversion of protein and urea nitrogen to inorganic nitrogen
(Field, et al., 1984). Inorganic nitrogen in digesters exists in two forms Ammonia Gas (NH3)
and Ammonium Ion (NH4+). Both forms are in equilibrium due to auto dissociation of NH3
with water, which is highly dependent on pH. Total Ammonia Nitrogen (TAN) is the
concentration of nitrogen held in both NH4+ ions and dissolved NH3 gas, and is sometimes
abbreviated as NH4+NH3-N. The increase in TAN during digestion is typically 20% to 30%;
however, increases greater than 50% are not unusual (Lansing, et al., 2010). Transformation of
Org-N to TAN appears to be a function of digester OLR (Figure AD.11). At lower loading
rates, inorganic nitrogen may be more likely to be reabsorbed into microbial biomass.

Manure Treatment Technologies 67
Figure AD.11. Effect of Organic Loading Rate on Concentration of Total Ammonia Nitrogen (TAN)
in Effluent of Farm-Scale, Mesophilic, Single Cell, Cattle and Swine Manure Digesters (from
Camarillo et al., 2013; Gooch and Labatut, 2014; Gooch and Pronto, 2008; Pronto and Gooch,
2008a; Pronto and Gooch, 2009; Schievano et al., 2011; Shayya, 2008).
Most reported losses of TN in anaerobic digesters are the result of solids accumulating in the
digester. Some of the TN reduction may also be the result of ammonia volatility and
subsequent loss of TAN from digester effluent. During land application, it is expected that
ammonia losses will be greater in surface applied digester effluent compared to raw or stored
manure. But, if incorporated or injected into the soil, digester effluent may increase crop
production due to the more readily available TAN.
Due to the higher solubility of TAN compared to Organic N (Org-N), most of the nitrogen
contained in a digester will remain in the liquid rather than solid portion. Camarillo, et al.
(2012) found that 70% of TN entering a digester left the system in liquid portion of digester
effluent. Beegle and Moncagave (2014) found similar ratios of TAN to TN in both digester
influent and effluent, but since the mass of liquids is greater than the mass of solid leaving a
solid-liquid separator, the greatest mass of nitrogen remains in the liquid stream.
Anaerobic digestion does not alter the Total Phosphorus (TP) content of manure. Most
reported losses of total P in digesters are related to solids accumulation in the reactor.
Anaerobic digestion, however, does convert organic phosphorus (Org-P) to phosphate (PO4+)
phosphorus (Field, et al., 1984). Typically, the increase in phosphate P between digester
influent and effluent is in the order of 10 to 30%. Conversion of Org-P to Phosphate does not
appear to be as dependent on OLR as conversion of Org-N to TAN.
Although there is a trend towards conversion to inorganic forms of phosphorus, this does not
mean that effluent phosphate is water soluble. Based on chemical equilibrium modelling, Wahal,
et al. (2010) showed most of the P in the effluent of digesters treating dairy manure was
precipitated as insoluble Ca and Mg salts. Field, et al. (1984) found that 60% of effluent P was
associated with solids in digesters treating both cattle and swine manure. Beegle and
Moncagave (2014) found that 30% of total phosphorus was present in the liquid portion of digester effluents, and 70% was in the sludge portion.
0.00
0.20
0.40
0.60
0.80
1.00
50 100 150 200 250 300
Effl
ue
nt
TAN
/TN
)
Organic Loading Rate (lb VS ft-3 day-1)

Manure Treatment Technologies 68
Settling will increase the amount of TP transported in the higher solids stream leaving a settling
tank or clarifier. Using a mechanical solid-liquid separator may not be as effective as settling to
concentrate TP, since separation efficiency is highly dependent on screen size. Digested solids
and crystalline precipitants tend to be smaller than their undigested counterparts, and may pass
through solid-liquid separator screens.
Defined Transfer Efficiencies Based on Process Factors.
If the type of digester and sludge storage capacity of covered lagoon digesters is known, the
transfer efficiencies given in Table AD.3. may be used for input to the Chesapeake Bay Model.
Table AD.3. Defined Transfer Efficiencies for Anaerobic Digestion for All Types of Manure.
Type of Digester
Transfer Efficiency (%)
NVE NSE PSE
Plug Flow and Mixed Plug Flow 0 0 0
Complete Mix 0 0 0
Covered Lagoon with Sludge Storage
Exceeding 10 Years 0 30 60
Ancillary Benefits of Anaerobic Digestion
Energy Production
In agriculture, production of energy is generally the primary use of anaerobic digester, and
solids reduction is an ancillary effect. Methane gas is flammable, with an energy content of
1,000 btu ft-3 (37 MJ m-3). Because biogas is composed of 40 to 70% CH4, energy content of
biogas lies in the range 400 to 700 btu ft-3 (19 to 26 MJ m-3). Efficiency of the anaerobic
digestion process is measured in methane yield. Biological efficiency of an individual digester is
measured as volumetric reactor efficiency. The energy efficiency of a digester system is
measured by the net energy production of the system (Energy produced through conversion of
biogas minus energy used in heating, mixing, and converting biogas energy to a useable form).
Methods to convert the potential energy of CH4 to useable energy are direct combustion of
biogas, combined heat and power systems using internal combustion or fuel cell technology,
upgrading biogas to pipeline quality natural gas, using cleaned biogas in compressed natural gas
vehicles, and injection of biogas into diesel engines. Major issues with use of biogas in engines
and fuel cells are H2O, CO2, and H2S content.

Manure Treatment Technologies 69
Waste Stabilization and Odor Reduction
Anaerobically treated manure is less odorous, less putrescible, and has a lower a C:N than raw
manure. Level of stabilization is directly related to removal of oxygen demand, which is
realtedrelated to, but generally greater than VS reduction. Chemical Oxygen Demand (COD)
removal efficiency of mesophilic digesters treating swine manure is in the range of 60 to 80%
(Boopathy, 1998; Andara & Esteban1999). As with VS reduction, COD reduction is dependent
upon the completeness of the anaerobic digestion process and is, therefore, impacted by HRT
and OLR.
Green House Gas Emission Reduction
Fugitive release of CH4 during manure storage, handling, and land application may contribute to
climate change. Anaerobic digestion reduces these fugitive sources by stabilizing manure
organic matter in a sealed vessel. Provided captured CH4 is converted to CO2 through
combustion or use a fuel as described above before release into the atmosphere, anaerobic
digestion reduces greenhouse gas potential because CO2 has a much lower heat trapping
potential than CH4. Though CH4 has a short lifespan in the atmosphere (12 years), on a pound-
for-pound basis its heat trapping potential is 28-36 times greater than CO2 over a 100 year period (US EPA 2015).
Pathogen Reduction
Anaerobic digestion effectively inactivate intestinal pathogens (Hashimoto 1983), and may
destroy viruses given sufficiently long HRT (Salminen & Rintala 2002). Destruction of manure
pathogens is more effective at thermophilic than at mesophilic temperatures (Shih 1987;
Bendixen 1994); However, even cryophilic systems (20 ºC for 20 days) can significantly reduce
total coliforms (97.94-100%), E.coli (99.67-100%) and indigenous strains of Salmonella,
Cryptosporidium and Giardia (Côté et al. 2006). Besides temperature, the destruction of
pathogens in anaerobic treatment systems is dependent upon HRT, with longer retention time
yielding greater bacterial and viral destruction (Kun et al. 1989).
Land Application
During land application it is expected that TAN losses will be greater in surface applied digester
effluent compared to raw or stored manure. But, if incorporated or injected into the soil,
digester effluent may increase crop production due to the more readily available TAN. The
positively charged NH4+ is more likely to be held in soil by negatively charged soil particles than
other forms of nitrogen, such as nitrate (NO3-). Because of this change in nitrogen distribution,
applying digested swine manure in place of undigested swine manure reduced nitrogen leakage
to the environment by about 20% (Blomqvist, 1993; Berglund & Börjesson, 2006). Add to this
the benefits of pathogen removal and odor control, land application of digester sludge and
effluent stands to increase the efficiency of nutrient application at reduced environmental
impact.

Manure Treatment Technologies 70
Potential Hazards of Anaerobic Digestion
The greatest environmental risk posed by anaerobic digestion is fugitive release of CH4 due to
leaking digester tanks, piping, etc. If biogas is not flared or used in combustion engines or fuel
cells, all the CH4 produced by digestion is released into the atmosphere.
Anaerobic digestion is a complex mechanical undertaking. Under current economic conditions,
anaerobic digestion has not been shown to be economically favorable unless the monetary value of reducing carbon dioxide equivalents is considered. Seeing that little nutrient removal is
achieved through digestion, producers must weigh the cost of implementation against energy
savings, manure handling improvements, and non-monetary environmental improvement before
considering anaerobic digestion.
References
Alburquerque, J.A., C. de la Fuente,C., and M.P.Bernal. 2011. Chemical properties of anaerobic
digestates affecting C and N dynamics in amended soils. Agriculture, Ecosystems and
Environment. 160:15.
Andara, A. R. & Esteban, J. M. L. 1999. Kinetic study of the anaerobic digestion of the solid
fraction of piggery slurries. Biomass and Bioenergy 17, 435-443.
Association of State Energy Research and Technology Transfer Institutions (ASERTTI). 2007. A
Protocol for Quantifying and Reporting the Performance of Anaerobic Digestion Systems for
Livestock Manures. Pullman, WA: ASERTTI.
Beegle, D. and J. Moncagave. 2014. Manure to Energy Digester Manure Energy Study. Internal
Report, University Park, PA:Pennsylvania State University.
Bendixen, H.J. 1994. Safeguards against pathogens in Danish biogas plants. Water Science and
Technology 30(12), 171-180.
Berglund, M. & Börjesson, P. 2006. Assessment of energy performance in the life-cycle of biogas
production. Biomass and Bioenergy 30, 254-266.
Blomqvist, J. 1993. Flytgödselns kväveeffekt och kväveulakning i kombination med och utan fånggröda [The effects on nitrogen supply and leakage from liquid manure fertilization in combination
with and without catch crops]. Borgeby, Sweden: Hushållningsssällskapet i Malmöhus län.
Boopathy, R. 1998. Biological treatment of swine waste using anaerobic baffled reactors.
Bioresource Technology 64, 1-6.
Camarillo, M.K, W.T. Stringfellow, C.L. Spier, J.S. Hanlon, and J.K. Domen. 2013. Impact of co-
digestion on existing salt and nutrient balances for a full-scale dairy energy project.
Journal of Environmental Management. 128:233-242.
Côté, C., Massé, D. I. & S. Quessy 2006. Reduction of indicator and pathogenic
microorganisms by psychrophilic anaerobic digestion in swine slurries. Bioresource
Technology 97, 686-691.

Manure Treatment Technologies 71
Field, J.A., J.S. Caldwell, S. Yeyanayagam, R.B. Reneau, W. Kroontje, and E.R. Collins. 1984.
Fertilizer recovery from anaerobic digesters. Transactions of ASABE. 27(6):1871.
Gooch, C. and R. Labatut. 2014. Evaluation of the Continuously-Mixed Anaerobic Digester System
at Synergy Biogas following the Protocol for Quantifying and Reporting the Performance of
Anaerobic Digesters for Livestock Manures (June 2012-May 2014). Ithaca, NY:Cornell
Universty.
Gooch, C. and J. Pronto. 2008. Anaerobic Digestion at AA Dairy: Case Study. Ithaca, NY:Cornell
Universty.
Hamilton, D.W. 2014a. Anaerobic Digestion of Animal Manure: Understanding the Basic Processes,
BAE-1747. Stillwater, OK: Oklahoma Cooperative Extension Service.
Hamilton, D.W. 2014b. Anaerobic Digestion of Animal Manure: Types of Digesters, BAE-1750.
Stillwater, OK: Oklahoma Cooperative Extension Service.
Hashimoto, A.G. 1983. Thermophilic and mesophilic anaerobic fermentation of swine manure.
Agric. Wastes. 6:175-191.
Kun, M. L., Brunner, J. B. F. & Atal, E. E. 1989. Destruction of enteric bacteria and viruses during
two-phase digestion. Journal of the Water Pollution Control Federation 61, 1421-1429.
Lansing, S., J.F. Botero. M. R. Botero, T. Nogueira da Silva, E. Dias da Silva. 2010. Wastewater
transformations and fertilizer value when co-digesting differing ratios of swine manure
and used cooking grease in low-cost digesters. Biomass and Bioenergy 31:1711-1720.
Loria, E., and J.E. Sawyer. 2005. Extractable soil phosphorus and inorganic nitrogen following
application of raw and anaerobically digested swine manure. Agron. J. 97:879-885.
Pronto, J. and C. Gooch. 2008a. Anaerobic Digestion at New Hope View Farm: Case Study. Ithaca,
NY: Cornell University.
Pronto, J. and C. Gooch. 2008b. Anaerobic Digestion at Ridgeline Farms: Case Study. Ithaca,
NY:Cornell Universty.
Pronto, J. and C. Gooch. 2009. Anaerobic Digestion at Noblehurst Farms, Inc.: Case Study. Ithaca,
Salminen, E. & Rintala, J. 2002. Anaerobic digestion of organic solid poultry slaughterhouse
waste – a review. Biosource Technology 83, 13-26.
Schievano, A., G. D’Imporzano, S. Salati, and F. Adani. 2011. On field study of anaerobic full-
scale plants (Part I): An on-field methodology to determine mass, carbon and nutrients
balance. Bioresource. Technology. 102:7737-7744.
Shayya, W. H. 2008. Anaerobic Digestion at Morrisville State College: A Case Study. Morrisville,
NY: Morrisville State College.
Shih, J. C. H. 1987. Ecological benefits of anaerobic digestion. Poultry Science 66, 946-950.
United States Department of Agriculture, Natural Resources Conservation Service (NRCS).
2003. Anaerobic Digester – Ambient temperature, Conservation Practice Standard Code 365.
Washington, DC: USDA-NRCS.

Manure Treatment Technologies 72
Wahal, S., S, Viamajala, and C.L. Hansen. 2010. Chemical speciation in effluent in an anaerobic
digester treating dairy waste: implications for nutrient recovery and reuse. Transactions
of ASABE 53(5):1727-1732.

Manure Treatment Technologies 73
7. Settling
Settling, sometime referred to as Sedimentation, is the use of gravity to remove suspended
solids from a liquid manure stream.
Settling Terminology
Influent is the liquid or slurry flowing into a settling device.
Effluent or Supernatant is the lower Total Solids (TS) liquid flowing out of a settling device.
Sludge is the higher TS material settling at the bottom of a settling device.
Suspended Solids are non-dissolved particles remaining after water is evaporated from a
liquid sample. By definition, suspended solids are solid particles that are retained on a 1.5
micron filter (APHA, 2012).
Overflow Velocity is the flow out of a settling device divided by its surface area. It is the
effective velocity a particle experiences as it travels the length of the device.
Types of Settling Devices
All settling or sedimentation devices rely on a low overflow velocity for particles to settle.
Settling devices are defined by three characteristics, 1) if they are operated continuously or as a
batch operation, 2) how sludge is stored in the device, and 3)what type of mechanism is used
for effluent to the device.
Clarifiers (Figures STTL.1, STTL.2) are an adaptation of sewage treatment technology.
Although rare in manure management, they are none the less, the most efficient devices for
sedimentation in terms of size and flow rate. Solids are removed from clarifiers at the rate at
which sludge accumulates, thus maintaining a constant sludge volume. The surface area is
designed for an overflow rate capable of removing the smallest settable particle existing in the
manure stream. Clarifiers are operated on a continuous basis, that is, influent flow is equal to
effluent flow and influent is constantly added to the clarifier. Clarifiers are very effective at
concentrating solids into sludge streams for further processing. For this reason, they are
sometimes called Sludge Thickeners.

Manure Treatment Technologies 74
.
Figure STTL.1. Rectangular Clarifier (Wikipedia.org)
Figure STTL.2. Circular Clarifier (copyright Monroe Environmental Corp, Monroe,
MI; from, Encyclopedia of Chemical Engineering Equipment : umich.edu )

Manure Treatment Technologies 75
Settling Basins are batch settling devices. Accumulated solids are stored in place. Once the
basin is filled with solids, slurry is directed to another settling basin. Settled sludge is allowed to
further dewater and dry in the basin. Two types of overflow mechanisms are used in settling
basins: Flashboards and Porous Dams. Flashboards (Figure STTL.3) are used to sequentially
raise and lower the basin’s liquid level. As solids accumulate, boards are added to keep the
clarifying layer above sludge storage. Once the basin is filled with solids, boards are removed to
dewater the accumulated sludge. Porous Dam basins are operated without liquid level
control. Manure enters the basin and solids are trapped by bridging behind a slatted wall
(Figure STTL.4). Porous dams are sometimes called Weeping Walls because liquids
continuously ooze out of the solids accumulated behind the dam. Regardless of overflow
mechanism, sludge is removed from the settling basin using a tractor and front end loader after
sludge dewatering (Figure STTL.5).
Figure STTL.3. Flashboard Dam Dewatering Device (forums.pondboss.com)

Manure Treatment Technologies 76
Figure STTL.4. Porous Dam Dewatering Device (Iowa State Extension).
Figure STTL.5. Weeping Wall Storage Basin on a Large Dairy Farm in
Erath County, Texas The Porous Dam has been Opened for Sludge Removal
(YouTube:OSUWasteManagement).

Manure Treatment Technologies 77
Settling Devices not Covered in This Report
Settling basins used to remove sand bedding from dairy manure are not covered in this report.
The settled sand is recycled to animal housing for bedding. Any nutrients adhering to the sand
is not removed from the system.
Weeping walls systems designed to contain manure greater than 10% TS do not use settling to separate solids, but rather contain semisolid manure in a dry, uncovered area. They are
considered storage, not treatment in context of this report.
Types of Manure Used
Any type of animal facility that uses flushing to remove manure from is a candidate for solid-
liquid separation by settling. Gravity settling works well for primary treatment of manure
flushed from dairy or swine facilities, milking center wastewater, or runoff from outside loafing
areas.
Transfer Efficiencies of Settling Devices
Mechanical Solid-Liquid Separators are normally placed immediately after animal confinement.
Chemicals are sometimes added to the manure upstream of the settling device to enhance
solids recovery. Chemical enhancement of settling is covered in the Wet Chemical Treatment
chapter of this report. Screw or belt presses are often used to increase the solids
concentration of settled sludge in clarifiers.
Settling is shown as a black box process in Figure STTl.6. Due to the short time manure
slurries stay in a settling device, very little nitrogen is volatilized. The main purpose of settling
devices is to separate the manure stream into two waste streams. Often the low solids effluent
stream is recycled to remove manure from confinement buildings. Nutrients in both the
effluent and sludge streams are utilized in land application; however the smaller volume and
mass of the sludge stream allows it to be transported more economically over great distances,
making sludge more likely to be utilized off-farm.

Manure Treatment Technologies 78
Figure STTL.6 . Settling as a Black Box.
Since settling devices do not remove Nitrogen through volatilization, NVE of settling devices is
always zero. Nitrogen and phosphorus separation efficiencies as calculated as shown in
Equations STTL.1 and STTl.2
NSE = (Mass of TN in Sludge) X 100 Equation STTL.1
(Mass TN in Influent Slurry)
PSE = (Mass of TP in Sludge) X 100 Equation STTL.2
(Mass TN in Influent Slurry)
Default Transfer Efficiencies for Settling
Without detailed knowledge of the process factors for a particular treatment system, the
default Nitrogen Volatilization Efficiencies (NVE), Nitrogen Separation Efficiencies (NSE) and
Phosphorus Separation Efficiencies (PSE)in Tables STTL.1 should be used in the Chesapeake Bay
Model. If type of settling device type of manure, and TS content of influent manure slurry are
known, the defined values shown in Table STTL.5 may be used.
Settling
Device
Manure Slurry
(Influent)
N and P in
Low Solids Effluent
N and P in
High Solids Sludge

Manure Treatment Technologies 79
Table STTL1. Default Transfer Efficiencies of Gravity Settling based on Type of Influent.
Type of Influent
Transfer Efficiency (%)
NVE NSE PSE
Milking Center Wash Water 0 20 47
Flushed Dairy Manure 0 25 45
Flushed Swine Manure 0 20 50
Review of Available Science on Settling
Gravity settling of suspended solids is an effective method of solid-liquid separation for manure
slurries with solids content less than 3% TS. Solid-liquid separation by gravity can be achieved
using a large variation of designs; however, they can generally be divided into two types:
clarifiers, which operate on a continuous basis and store sludge for a relatively short period of
time; and basins which settle solids in batches and store sludge for periods ranging from a few
days to several months (Worley and Das, 2000). Provided that solids build-up is not excessive,
the performance of the two types is similar. Basins designed with porous outlets to allow dairy
manure solids to drain are called weeping wall basins (Muktar et al., 2011; and Meyer et al.,
2004). Sometimes weeping walls are used to store and dewater semi-solid manure.
The main requirements for gravity solid-liquid separation are: 1) flow velocities low enough to
allow solids to settle (less than 0.5 ft/sec), 2) a detention time sufficient to allow capture of the
settling solids (generally 20 minutes or longer), and 3) sufficient solids storage below the settling
zone to maintain settling efficiency.
Mass versus Concentration Efficiency
The mass flows for a gravity settling basin are shown in Figure STTL7. The volumes shown in
the diagram correspond to the time period of interest. For example, the volume loaded into the basin would be the average influent flow rate (QIN) multiplied by the total time influent
flowed into the basin. In most cases, information is gathered to determine the total volume
loaded per day. The volume of manure to be removed is the sum of total volume of settled
material that will accumulate over the defined time period and the volume of supernatant that
will not be removed in the outfall (QOUT). The volume of settled solids to be removed at
planned time intervals is termed the storage volume, VSM.

Manure Treatment Technologies 80
Figure STTL.7. Mass flows for a settling basin.
Where,
[CIN] = concentration of a manure component in the influent liquid manure (),
VIN = QIN ∆t = volume of wastewater treated over time period ∆t (L),
[Ceff] = concentration of a manure component in the outfall (g/L),
Veff = QOUT ∆t = volume of treated liquid that flows out of the basin (L),
[CST] = concentration of a manure component in the storage volume (g/L), and
VSM = volume of settled material that accumulates over ∆t (L).
Applying of the law of conservation of mass to the basin shown in Figure STTL7 gives:
CIN VIN = Ceff Veff + CST VSM. STTL.3
The relationship for the mass removal separation efficiency for a settling basin can be written
as:
MRE = 100 X (CIN VIN – Ceff Veff) / CIN VIN STTL.4
Concentration removal separation efficiency, which is what farmers sometimes measure by
taking grab samples of influent and effluent, is defined as:
CRE = 100 X (Cin – Ceff)/ Cin STTL.5
Concentration removal separtation efficiency is not equivalent to mass removal separtion.
Some volume will always be stored as sludge. If sludge solids concentration is low, the
difference between mass and concentration removal separation can be substantial. Therefore,
removal separation efficiency should always be measured as mass removalseparation.
Measuring flow into and out of a settling device is critically important in analyzing their
performance.

Manure Treatment Technologies 81

Manure Treatment Technologies 82
Measured Performance of Settling Basins
The solids, nitrogen, and phosphorous removal separation measured for gravity settling of dairy
and swine manure is summarized in Tables STTL.2, STTL.3 and STTL.4. Gravity settling does
not change the concentration of soluble plant nutrients, such as TAN or nitrate, since only solid
particles are removed from the liquid fraction that flows through the settler. The amount of
soluble nutrients removed is a function of the amount of liquid removed with the settled solids. In general, gravity settling provides higher separation efficiencies than mechanical solid-liquid
separation. However, the separated solids generally have higher moisture content and require
more space for storage, and must be handled as a slurry or semi-solid.
STTL.2. Summary of Separation Efficiency Data for Gravity Settling of Dairy Manure (Barrow, et
al., 1997; Sherman et al., 2000; Chastain, et al., 2001; Converse and Karthikeyan, 2004; Chastain et
al., 2005; Hjorth, 2010; Chastain, 2011).
Manure Description Settling
Time (hr)
Influent
TS (%)
Separation Efficiency (%) Settled
Volume
Fraction
TS
VS
TN
TP
Milking Center
Wastewater 1.0
0.7 41 47 21 48 0.093
Milking Center
Wastewater 1.0
1.7 61 66 41 45 0.254
Dairy manure 0.33 1.0 28 --- 17 63 0.165
Dairy manure 0.33 1.0 63 --- 22 60 NA
Dairy manure 0.5 4.2 98 98 96 96 0.95
Dairy manure 1.0 4.2 96 96 92 94 0.90
Dairy manure 4.0 1.3 52 --- 35 42 0.25
Dairy manure 24 2.5 42 --- 33 46 0.25
Dairy manure 1200 3.2 55 --- 35 70 0.25

Manure Treatment Technologies 83
Table STTL.3. Performance of Weeping Wall Basins to Separate Dairy Manure (from Meyers et al., 2004 and
Mukhtar et al., 2011).
Locatio
n Description
Influent
TS (%wb)
Separation Efficiency %
TS VS TN TP
California Single Basin 1.14 to 1.76 48 – 60 46 – 60 NA NA
Texas First Basin in Two-Basin Series 3 67 67 60 55
Texas Combined Two-Series Basin 3 88 89 84 86
Table STTL.4. Summary of separation efficiency data for gravity settling of liquid swine manure
(from Vanotti and Hunt, 1999; Worley and Das, 2000. Powers and Flatow, 2002; Chastain and
Vanotti, 2003;).
Manure Description
Settling
Time
(hr)
Influent
TS
(%)
Separation Efficiency (%) Settled
Volume
Fraction
TS
VS
TN
TP
Growing pigs 0.2 0.24 51 NA 17 0.06
Nursery Pigs NA 0.18 0.02 NA 3.0 23 0.0002
Flushed swine 1.0 0.5 37 46 23 50 0.08
Flushed swine 1.0 1.0 51 56 30 66 0.13
Gravity Settling Pond NA 1.5 60 --- 20 38 NA
Flushed swine 1.0 2.0 68 70 46 81 0.31

Manure Treatment Technologies 84
Defined Transfer Efficiencies Based on Process Factors
If the type and solids content of manure is known, the values for TN and TP mass removal
separation efficiency can be used in the Chesapeake Bay Model for the type of settling device as
indicated in Table STLL.5.
Table STTL.5. Defined Transfer Efficiencies of Settling Devices based on Type of Device, Type of
Manure, and Manure TS Content.
Type of Device Type of Manure Manure
TS (% wb)
Transfer Efficiency (%)
NVE NSE PSE
Clarifier
Dairy,
Dairy Milking
Center
Swine
<3% 0 20 50
Basin
Dairy
<5% 0 35 45
Basin
Dairy Milking
Center
<2% 0 20 48
Basin
Swine
<3% 0 30 60
Weeping Wall
Basin
Dairy
3 to 10% 0 60 55
Ancillary Benefits of Settling
Settling does not remove nutrients from the manure stream. The stream is essentially divided
into two streams one with solids higher than the original manure and one with solids content
lower than the original manure. Roughly 20 to 30 % of the manure nitrogen and 40 to 60% of
the manure phosphorus will be contained in the higher solids stream. When farms are
fractured and scattered over a large land area, farmers can more efficiently management their
manure by spreading high solids manure on more distant fields and irrigating low solids manure
on fields closest to the barn.
Potential Hazards of Settling
Settling devices do not pose an inherent environmental hazard. A potential increase in
environmental damage may occur if concentrated sludge should leak from a settling device and
enter surface water. Storage of sludge in settling basin may also increase the chance that
greenhouse gases such as CH4 and N2O could form from raw manure.

Manure Treatment Technologies 85
References
Barrow, J.T., H.H. Van Horn, D.L. Anderson, R.A. Nordstedt. 1997. Effects of Fe and Ca
additions to dairy wastewaters on solids and nutrient removal by sedimentation. Applied
Engineering in Agriculture, 13(2):259-267.
Chastain, J.P., M.B. Vanotti, and M.M. Wingfield. 2001a. Effectiveness of liquid-solid separation
for treatment of flushed dairy manure: a case study. Applied Engineering in Agriculture,
17(3): 343-354.
Chastain, J.P., K.B. Cantrell, and K.P. Moore. 2005. Composition and Settling Characteristics of
Milking Center Wastewater: A Case Study. ASABE Paper No. 054102. St. Joseph, Mich.:
ASABE.
Chastain, J.P. 2011. Hindered Settling of Animal Manure. ASABE Paper No. 1111188. St. Joseph,
Mich.: ASABE.
Chastain, J.P. and M.B. Vanotti. 2003. Correlation Equations to Predict the Solids and Plant
Nutrient Removal Efficiencies for Gravity Settling of Swine Manure. In: R.T. Burns (ed),
Animal, Agricultural and Food Processing Wastes IX : Proceedings of the Ninth
International Symposium, pp 487-495, St. Joseph, Mich.:ASABE.
Converse J.C., Karthikeyan K.G. 2004. Nutrient and solids separation of flushed dairy manure
by gravity settling, Applied Engineering in Agriculture 20, 503–507.
Hjorth, M., K.V. Christensen, M.L. Christensen, and S.G. Sommer. 2010. Solid-liquid separation
of animal slurry in theory and practice. a review. Agronomy for Sustainable
Development, 30:153-180.
Meyer, D., J. P. Harner, E. E. Tooman, and C. Collar. 2004. Evaluation of weeping wall efficiency
of solid liquid separation. . Applied Engineering in Agriculture, 20(3): 349−354.
Mukhtar, S., S. Borhan and J. BesedaII. 2011. Evaluation of a Weeping Wall Solid-Liquid
Separation System for Flushed Dairy Manure. Applied Engineering in Agriculture, 27(1):
135‐142.
Powers, W.J., and L.A. Flatow. 2002. Flocculation of swine manure: influence of flocculant, rate
of addition, and diet. Applied Engineering in Agriculture, 18(5):609-614.
Sherman, J.J., H.H. Van Horn, and R.A. Nordstedr. 2000. Use of flocculants in dairy wastewaters
to remove phosphorous. Applied Engineering in Agriculture, 16(4):445-452.
Vanotti, M.B., and P.G. Hunt. 1999. Solids and nutrient removal from flushed swine manure
using polyacrylamides. Transactions of the ASAE, 42(6):1833-1840.
Worley, J.W. and K. C. Das. 2000. Swine manure solids separation and composting using alum
.Applied Engineering in Agriculture, 16(5): 555-561.

Manure Treatment Technologies 86
8. Mechanical Solid-Liquid Separation
Solid-liquid Separation divides manure slurries into two fractions. The solid fraction,
sometimes called cake, is the portion leaving the separator with higher total solids content (TS)
than the manure entering. The liquid fraction has lower TS content than the original manure.
Mechanical Solid-Liquid Separation Terminology
Influent is manure slurry entering a mechanical solid-liquid separator.
Effluent or Liquor is lower solids liquid stream leaving a mechanical solid-liquid separator.
Cake is the higher solids stream leaving a mechanical solid-liquid separator.
Types of Solid-Liquid Separators
Stationary Screen Separators are perforated metal plates or mesh screens that trap solid
particles too large to pass through openings. Liquids pass through screen separators by gravity
alone; hence, these devices are sometimes called Gravity Screen Separators. There are two
primary types of screen separators: inclined screens and in-channel flighted conveyers.
Inclined Screen Separators (Figures MSLS.1and MSLS.2) are screens set at an angle, so as
Influent is added to the top of the screen, separated solids slide down and thicken at the
bottom of the screen. In-Channel Flighted Conveyor Separators (Figure MSLS.3) are
designed to remove solids from manure flushed into a tank or cross channel. Manure solids are
removed from the tank and are carried up an inclined screen by paddles on a continuous chain.
Liquids drain back into the tank after being removed from the manure by gravity.
Rotating Screen Separators (Figure MSLS.4) separate solids using a large, porous drum
constructed from wedge-wire screen attached to a frame. The drum slowly rotates around its
horizontal axis. Manure is distributed evenly on the top of the rotating screen at a rate compatible with the rotational speed of the drum and screen size. Liquids passing through the
drum by gravity are collected in a channel below the screen. The separated solids on the
outside of the screen are removed by a stationary scraper.
Screw Press Separators (Figure MLSS.5) use a large screw to force manure down a tube and
through a cylindrical screen. A plug of manure solids forms at the end of the tube where
manure is forced through a small opening. The resulting internal pressure within the tube
forces liquids through the screen. The pressure, and flow of separated solids leaving the
separator, is controlled by a set of pressure plates. The amount of force exerted by the
pressure plates affects the moisture content of the separated solids.

Manure Treatment Technologies 87
Figure MSLS.1. Inclined Screen Solid-Liquid Separator
(from Shutt et al., 1975).
Figure MSLS.2. Dual Inclined Screen Solid Separators in use on a Dairy Farm in
Comanche County, Texas (YouTube:OSUWasteManagement).

Manure Treatment Technologies 88
Figure MSLS.3. In-Channel Flighted Conveyor Screen Solid-Liquid Separator (from
Fleming, 1986).
Figure MSLS.4. Rotating Screen Solid-Liquid Separator (from Ford
and Fleming, 2002).

Manure Treatment Technologies 89
Figure MSLS.5. Screw Press Solid-Liquid Separator (from Møller et al., 2000).
Belt Press Separators (Figure MSLS.6) consist of a flat, fabric belt that runs horizontally
between two rollers. Slurry is discharged onto the belt and the rollers squeeze the liquid
fraction through the porous belt. The dewatered cake remains on the belt and scrapped off and
expelled to a solids collection area. The liquid fraction is collected and transferred to storage or
additional treatment.
Figure MSLS.6. Belt Press Separator (From Møller et al., 2000).

Manure Treatment Technologies 90
Brushed Screen Roller Press Separators (Figure MLSS.7) use two concave screens in
series to separate manure solids and liquids. Manure is added to the first screen, which is kept
clean by rotating brushes moving solids onto the second screen. A roller press squeezes more
liquid out of the manure through the second screen. Manure solids are brushed out of the
device by brushes attached behind the rollers.
Figure MSLS7 Brushed Screen Roller Press Separator (from Ford and Fleming, 2002).
Centrifuges exploit the difference between particle and liquid density for removal separation
of suspended material. Particles are accelerated by rotating the manure about a fixed axis.
Particle acceleration is a function of the speed and radius of rotation. A common type of centrifuge used for manure treatment is the Decanter (or Decanting) Centrifuge (Figures
MSLS.8, MSLS.9). The decanter centrifuge uses an auger turning inside a rotating cylinder.
Manure slurry is pumped into centrifuge through the hollow auger axis. Manure exits through
holes in the auger and is thrown to the outside of the cylinder by centrifugal force -- separating
the manure into a liquid and a solid layer. The auger rotates at a higher speed and in the
opposite direction of the cylinder, moving the solid fraction towards the conical end of the
cylinder, where it is discharged. A small lip or weir holds liquids in the rotating cylinder. A
portion of the separated liquid “decants” over the weir as liquid accumulates in the spinning
cylinder.

Manure Treatment Technologies 91
Figure MSLS.8. Decanter Centrifuge (from Hutchinson Hayes Separations Inc., Hutch-Hayes.com).
Figure MSLS.9. Decanter Centrifuge (Green and Silver Device on Trailer) being Demonstrated on
a Dairy Farm (GEA.com)

Manure Treatment Technologies 92
Devices not Covered in This Report
Mechanical devices that separate sand bedding from dairy manure are not covered in this
report. The separated sand is recycled to animal housing for bedding. Sand is a nutrient free,
inert material which never purposefully leaves the housing area. Any manure nutrients adhering
to the sand eventually find their way into the manure stream and are then accounted for as
manure the Chesapeake Bay Model.
There are a number of mechanical solid-liquid separators in addition to the six described in
detail in this report. They have not been included because of limited on-farm performance data
in the literature.
Vibratory Screens are another variation of a stationary screen. Usually, the screen is circular
and is oriented horizontally instead of inclined. Solids are moved to the outside of the screen
by a combination of vibration and a slight bowing in the screen. Liquids flow through the
screen by gravity.
Centrifilters are spinning circular screens or filter cloths. Manure solids are thrown off of the
screen by centrifugal force and liquids flow through the screen by gravity. Ridges in the screen
help concentrate solids and direct them to the edge of the spinning plate.
Hydrocyclones are cone-shaped separators with no moving parts except for a high-pressure
booster pump used to spray manure into the cone. Influent is introduced against the cone wall
at the top, wide end at high speed. The strong swirling motion pushes the solids to the outside
the cone where they slide down the wall by gravity.
Filter Presses are widely used in the food industry to separate juice from fruit pulps. Plates
separated by filter fabric form pockets, which are filled with wet material. The pockets are
squeezed in an accordion fashion. Liquids ooze through the filter fabric while solids remain in
the pockets.
Transfer Efficiency of Mechanical Solid-Liquid Separation
Mechanical Solid-Liquid Separators are normally placed immediately after animal confinement.
The separator may be preceded by a pretreatment system to alter fresh manure to make it
more useable. Two common forms of pretreatment are addition of flocculants and thickening
by sedimentation to enhance separation.
A black-box schematic of mechanical solid-liquid separation is given in Figure MSLS.10. Solid-
Liquid Separators do not remove solids or nutrients from a manure handling system, but rather,
separate the manure stream into two waste streams. Nutrients in both streams are utilized in
land application. However the the lower weight and smaller volume of the cake makes it more
likely to be transported more economically over great distances.

Manure Treatment Technologies 93
Figure MSLS.10 . Mechanical Solid-Liquid Separation Black Box
Since mechanical solid-liquid separators do not remove nitrogen through volatilization, NVE of
mechanical solid-liquid separators is always zero. Nitrogen and phosphorus separation
efficiencies as calculated as shown in Equations MSLS.1 and MSLS.2
NSE = (Mass of TN in Cake) X 100 MSLS.1
(Mass TN in Influent Slurry)
PSE = (Mass of TP in Cake) X 100 MSLS.2
(Mass TN in Influent Slurry)
Default Transfer Efficiencies for Mechanical Solid-Liquid Separation
If the type of manure or wastewater treated on a particular farm and the type of mechanical
solid-liquid separator used to treat the waste are known, default Nitrogen Volatilization
Efficiencies (NVE), Nitrogen Separation Efficiencies (NSE) and Phosphorus Separation
Efficiencies (PSE)in Tables MSLS.1 should be used in the Chesapeake Bay Model. If the manure
type, influent slurry TS content, and screen or belt opening size of screen and belt separators is
known, Tables MSLS.8 through MSLS.10 may be used for input to the Chesapeake Bay Model.
If the manure type, influent slurry TS content, and rotational speed of decanting centrifuges are
known, Table MSLS.11 may be used for input to the Chesapeake Bay Model.
Mechanical
Solid-Liquid
Separator
Manure Slurry
(Influent)
N or P in
Low Solids Effluent
N or P in
High Solids Cake

Manure Treatment Technologies 94
Table MSLS.1. Default Transfer Efficiencies for Mechanical Solid-Liquid Separators given Types of
Separator and Manure.
Type of Separator
Transfer Efficiency (%)
NVE NSE PSE
All Types of
Manure
Dairy
Manure
Swine
Manure
Dairy
Manure
Swine
Manure
Stationary Screen 0 13 3 11 2
Rotating Screen 0 0 5 0 3
Screw Press 0 8 5 6 8
Belt Press 0 10 10 15 18
Brushed Screen Roller
Press
0 13 6 15 6
Centrifuge 0 20 10 45 50
Review of Available Science on Solid-Liquid Separation
Solid-liquid separation divides manure into two fractions. The solid fraction (sometimes called
cake) is the portion that has total solids content (TS) greater than the manure entering the
device (influent). The liquid fraction (effluent) has a TS content that is less than the manure
removed from the facility. Mechanical solid-liquid separators do not alter or transform the
nutrients in the manure stream. The sole effect of these devices is to concentrate soluble
nutrients such as TAN or water soluble phosphorus in effluent and less soluble nutrients such
as organic nitrogen in cake.
Mass versus Concentration Removal Separation Efficiency
A general mass balance for single, mechanical solid-liquid separator is shown in Figure MSLS.11.
Figure MSLS11. Mass flows for a solid-liquid separator.

Manure Treatment Technologies 95
Application of the continuity of mass (mIN = mOUT) to the situation shown gives:
CIN VIN = CEFF VEFF + CMSS mSS (MSLS.3)
Where,
CIN = Concentration of C in the influent manure (g/L),
VIN = Volume the influent manure (L), CEFF = Concentration of C in the liquid effluent flowing from the separator ( g/L),
VEFF = Volume of the liquid effluent (L),
CMSS = Concentration of C in the separated solids (g / kg),
mSS = Mass of separated solids collected (kg)
The mass removal separation efficiency for a particular component, MRE, can be calculated if at
least two of the three masses can be can be determined from data. The three relationships for
MREC are given below. The equation used to calculate the mass removal separation efficiency
depends of the measurements made on the separator.
MRE = 100 × (CIN VIN - CEFF VEFF) / CIN VIN MSLS.4
MRE = 100 × CMSS mSS / CIN VIN MSLS.5
MRE = 100 × CMSS mSS / (CEFF VEFF + CMSS mSS) MSLS.6
Equipment manufactures often report the efficiency of their separators using Concentration
Removal Separation Efficiency (CRE) which is calculated by:
CRE = 100 X (Cin – Ceff)/ Cin MSLS.7
Concentration removal separation efficiency is not equivalent to mass removal separation
efficiency, because the volume of influent (Vin) does not equal the volume of effluent (Veff).
Some portion of the influent volume will also exit with cake. If cake is very wet, the differences
can be substantial. Removal Separation Efficiency should always be reported on a mass, not a
concentration, basis.
Performance of Different Types of Mechanical Solid-Liquid Separators
Stationary Screen: The performance of screen separators is affected by several factors. The
most important factors are the screen opening size, TS content of the influent manure, particle
size distribution, and the manure flow rate. In general, the highest separation efficiencies have
been obtained with manure that has the largest particle sizes (i.e. dairy vs swine), smaller screen
sizes, and influent manure with a higher TS content. Typically the flow rate of the machine is set
by the manufacture to ensure that the screen is not over loaded.
A summary of the available separation data and cake TS content for both inclined screen and in-
channel flighted stationary screen separators is provided in Table MSLS.2. Stationary screen

Manure Treatment Technologies 96
separators are more effective for treating liquid dairy manure compared to liquid swine
manure. In addition, solids fraction removed from dairy manure is relatively dry and can be
handled as a solid (20 – 25% TS). Screen separated cake from swine manure has a slurry
consistency (5 -10% TS). For this reason, stationary screen type separators are not generally
used on swine farms using flushing and pit recharge manure removal systems; although they
may be somewhat effective for separating solids from scraped swine manure.
Rotating Screen: Rotating screen separators are much less common than inclined screens.
Advantages of rotating screens are their compact size, and they have slightly better separation
efficiency for low solids swine manure than stationary screens. Cake TS concentration is also
higher for swine manure than gravity screens. The available separation efficiency data for
rotating screen separators is given in Table MSLS.3.
Screw Press: A summary of the available data for screw press separators is given in Table
MSLS.4. Separation efficiency of screw presses is highly dependent on the TS content of the
influent manure. Separation efficiency increases as influent TS concentration increases. Figure
MSLS.11 shows the relationship between influent solids concentration, separation efficiency, and
material through-put for screw presses treating dairy manure. Presses are best used to provide primary treatment for dairy and swine manure with a total solids content of 3% or more. The
main advantage of screw press separators is the high solids concentration of filter cake for both
dairy and swine manure. Often, dairy solids separated by screw press filters are recycled back
to the barn as bedding.
Belt Press: A summary of available data for belt press separators is given in Table MSLS.5.
Separation Efficiency is dependent on TS concentration of influent, tightness of weave of the
press fabric, and to some extent pressure applied by rollers. Belt presses have better
performance with swine manure than all but centrifuge separators, and produce a slightly less
solid cake than screw press separators.
Brushed Screen Roller Press: Less farm-scale data is available for brushed screen roller
presses compared to the other 5 separators in this report. Separation efficiency is function of
screen size and influent solids content. Cake solids content is similar to that produced by
screw presses. A summary of available data for brushed screen roller presses is given in Table
MSLS.6.
Centrifuge: Centrifuge separators are unique among the devices reviewed in this report in
that separation efficiency is not dependent on the ability of manure solids to pass through a
hole. Separation efficiency is highly dependent on influent solids content, however. In general,
the more dilute the influent, the faster the centrifuge must spin to achieve the same separation
efficiency. Centrifuges give the best separation efficiency for swine waste, provided cylinder
speed is matched to influent TS concentration. The main drawback to centrifuge separators is
the high maintenance and energy costs associated with a constantly moving mechanical device.

Manure Treatment Technologies 97
Table MSLS.2. Summary of Separation Efficiency Data for Stationary Screen Separators Treating
Dairy and Swine Manure (from Graves et al. 1971; Shutt, et al., 1975; Piccinini and Corellini, 1987;
Auvermann and Sweeten, 1992; Zhang and Westerman, 1997; Fulhage and Hoehne, 1998; Møller et
al., 2000; Chastain et al., 2001a; Hjorth, 2010).
Manure
Type
Screen
Opening
(mm)
Influent
TS
(% wb)
Separation Efficiency (%) Cake
TS
(% wb)
TS
VS
TN
Org-N
TAN
TP
Dairy
NA 1.5 19 24 13 NA NA 18 19
0.5 NA 55 – 74 57 – 75 25 - 42 33 – 52 18 – 33 NA NA
1.5 3.8 61 63 49 52 46 53 20
1.5 NA 45 50 17 19 8 11 23
3.0 7.1 56 NA 49 NA NA 49 NA
Swine
1.0 1.0 – 4.5 6 - 31 5 - 38 3 - 6 NA NA 2 - 12 5
1.0 0.2 – 0.7 35 NA NA NA NA NA 9
1.5 0.2 – 0.7 9 NA NA NA NA NA 6
Table MSLS.3. Summary of Separation Efficiency Data for Rotating Screen Separators Treating
Dairy and Swine manure (from Hegg et al., 1981; Piccinini and Corellini, 1987; Zhang and
Westerman, 1997).
Manure
Type
Screen
Opening
(mm)
Influent
TS
(% wb)
Separation Efficiency (%) Cake
TS
(%wb)
TS
VS
TN
TP
Dairy 0.75 0.5 – 3.0 0 - 14 NA NA NA 6 – 11
Swine
0.75 2.5 – 4.1 4 – 8 NA NA NA 16 - 17
0.80 1.0 – 4.5 5 - 24 9 - 31 5 - 11 3 – 9 12

Manure Treatment Technologies 98
Table MSLS.4. Summary of Separation Efficiency Data for Screw Press Separator Treating Dairy
Manure, Anaerobically Digested Dairy Manure, and Swine Manure (from Converse et al., 1999;
Converse et al., 2000; Gooch et al., 2005; Møller et al., 2000; Chastain, et al., 2001b; Wu, 2007;
Hjorth et al., 2010).
Manure
Type
Screen
Opening
(mm)
Influent
TS (%)
Separation Efficiency (%) Cake
TS
(%wb) TS VS TN Org.-N TAN TP
Dairy
0.50 2.6 25 NA 8 13 2 6 26
0.75 10. 70 77 24 29 20 24 25
2.38 2.0 16 NA NA NA NA 9 26
2.38 10. 47 NA NA NA NA 29 34
2.38 5.0 33 --- 13 20 3 10 29
3.00 7.1 40 13 --- --- 21 NA
Anaerobically
Digested
Dairy
0.50 7.4 50 56 16 18 14 24 24
0.50 8.3 46 52 17 20 14 20 25
2.25 5.5 4 5 1 2 1 1 29
Swine
0.50 3.0 7 10 5 7 4 8 23 – 34
0.50 5.0 16 29 12 16 10 16 23 – 34
0.50 7.0 24 32 20 24 17 24 23 – 24
0.50 NA 15 20 9 16 7 15 28
0.90 5.7 28 NA 6 NA NA 12 NA

Manure Treatment Technologies 99
Figure MSLS.11. Effect of Influent TS Concentration on Performance of Screw Press
Separators treating Dairy Manure (from Burns and Moody, 2001; Hamilton, 2006).
MSLS.6 Table MSLS.5. Summary of separation efficiency data for belt presses treating dairy and
swine manure (Møller et al., 2000; Ford and Fleming, 2002; Fernandes et al., 1988; Pieters et al.,
1999; Hjorth et al., 2010).
Manure Type
Belt
Opening
(mm)
Influent
TS (%)
Separation Efficiency (%) Solids
Fraction TS
(%)
TS
VS
TN
TP
Dairy 1.0 to 2.0 7.1 32 NA 10 15 15
Swine
0.1 3.0 47 NA 32 18 18
0.1 8.0 59 NA 35 21 14
1.0 to 2.0 5.7 22 NA 10 20 19
0
10
20
30
40
50
60
0 1 2 3 4 5 6 7 8 9
Influent TS (%)
Ma
ss
Re
mo
va
l E
ffic
ien
cy
(%
)
0
20
40
60
80
100
120
Liq
uo
r F
low
Ra
te (
lite
rs/m
inu
te)
Mass Removal Efficiency Liquor Flow Rate

Manure Treatment Technologies 100
MSLS.6. Summary of Separation Efficiency Data for Brush Screen Roller Presses Treating
Dairy and Swine Manure (Pos et al., 1984; Rorick et al., 1980; Gooch et al., 2005).
Manure Type
1st and 2nd
Screen
Opening
(mm)
Influent
TS
(%)
Separation Efficiency (%) Solids
Fraction TS
(%)
TS
VS
TN
TP
Dairy
3.2/3.2 5.2 36 41 15 15 14
NA 4.5 10 NA NA NA 26
NA 9.9 25 NA NA NA 30
NA 10.3 40 45 18 13 24
Swine 1.6/1.6 6.3 21 25 6 6 20
Table MSL.7 . Summary of Data from Centrifuge Separators Treating Dairy and Swine Wastes
(Reinman, 1989; Møller et al., 2002; Westerman and Ogejo, 2005; Møller et al., 2007; Hjorth et al.,
2010).
Manure Type
Cylinder
Speed
(rpm)
Influent
TS
(%)
Separation Efficiency (%)
TS TN TP
Dairy
4,100 4.5 55 27 79
NA 6.0 44 23 48
4,100 6.4 65 49 82
2,200 7.0 63 29 55
Swine
5,000 1.5 51 21 61
4,100 2.6 33 13 66
4,100 5.3 60 29 62
2,200 4.0 52 17 70
2,200 5.1 51 17 71
2,200 6.8 70 36 82
NA 7.0 70 32 52
2,050 8.9 69 34 87

Manure Treatment Technologies 101
Defined Separation Efficiencies Based on Process Factors
Separation efficiencies to use in the Chesapeake Bay Model provided pertinent process factors
are known for stationary screens, screw press, belt press and centrifuge separators are given in
Tables MSLS.8 through MSLS.10.
Table MSLS.8. Defined Separation Efficiencies for Stationary Screen Separators
based on Process Factors.
Type of
Manure
Screen
Opening Size
(mm)
Influent
TS Content
(%)
Removal Separation Efficiency
(%)
NSE PSE
Dairy 1.5 or less 2-7 15 29
Swine 1.0 or less 1-10 4 7
Table MSLS.9. Defined Separation Efficiencies for Screw Press Separators based
on Process Factors.
Type of
Manure
Screen
Opening
Size
(mm)
Influent
TS Content
(%)
Removal Separation Efficiency
(%)
NSE PSE
Dairy 2.5 or less
<3 8 6
3-10 13 10
>10 24 24
Swine 0.1 3-5 5 8

Manure Treatment Technologies 102
Table MSLS.10. Defined Separation Efficiencies for Belt Press Separators
based on Process Factors
Type of Manure
Belt
Opening
Size
(mm)
Influent
TS Content
(%)
Removal Separation Efficiency (%)
NSE PSE
Dairy
1.0 to 2.0
0-5 10 15
Swine 0-7 10 20
Swine 0.1 0-10 30 20
Rotating screen and brushed screen roller separators require a great deal of adjustment to
consistently separate manure solids. The default values of NSE and PSE given in Table MSLS1
for these devices should be used in the Chesapeake Bay Model unless direct monitoring data is
available.
If the TS content of influent dairy or swine slurry, and the cylinder speed of a decanting
centrifuge are known, the values for separation efficiencies given in Table MSLS.11 may be used
for the Chesapeake Bay Model.
Table MSLS.11. Defined Separation Efficiencies for Centrifuge Separators
Treating Dairy and Swine Manure based on Process Factors.
Manure Type
Influent
TS
(%)
Cylinder
Speed
(rpm)
Removal Separation Efficiency
(%)
NSE PSE
Dairy
< 4.0 4,100 25 50
4.0 to 6.0 4,100 25 50
>6.0 2,200 25 50
Swine
< 2.0 5,000 10 50
2.0 to 4.0 4,100 10 65
4.0 to 7.0 2,200 15 70
>6.0 2,050 20 70

Manure Treatment Technologies 103
Ancillary Benefits of Mechanical Solid-Liquid Separation
Mechanical solid-liquid separation does not remove nutrients from the manure stream. The
stream is essentially divided into two streams one with solids higher than the original manure
and one with solids content lower than the original manure. Solid-liquid separation is often used as the primary treatment step prior to biological treatment such as a treatment lagoon. In
such cases, solid-liquid separation reduces the organic loading on anaerobic or aerobic
treatment processes, and may also reduce the rate of sludge build-up. In recent years, it has
become more common to use solid-liquid separation to dewater anaerobically digested slurry
on dairy farms (e.g. Gooch et al., 2005). In such cases, solid-liquid separation is used as the final
treatment step prior to storage, land application, or composting of separated solids. Other
reasons for solid-liquid separation in manure handling are to produce stackable solids that can
be re-used as bedding on dairy farms, to facilitate off-farm transport of manure for composting
or to remote fields, to remove solids to facilitate irrigating manure.
Potential Hazards of Solid-Liquid Separation
There are very few environmental hazards with solid-liquid separation. The only potential
hazard is that farmers may underestimate volumes of cake and effluent produced by the
separator, which could result in overflow of concentrated pollutants into waterbodies.
References
Auvermann, B. W., and J. M. Sweeten. 1992. Solids separation systems for livestock manure and
wastewater. Agricultural Engineering. College Station, Tex.: Texas A&M University.
Burns, R.T., and L.B. Moody. 2001. Vincent KP-6L solids separator performance test results
using the University of Tennessee testing protocol, AWM-01-02. University of
Tennessee Agricultural and Biological Engineering Department: Knoxville, TN
Chastain, J.P., M.B. Vanotti, and M.M. Wingfield. 2001a. Effectiveness of liquid-solid separation
for treatment of flushed dairy manure: a case study. Applied Engineering in Agriculture,
17(3): 343-354.
Chastain, J.P., W.D. Lucas, J.E. Albrecht, J.C. Pardue, J. Adams, III, and K.P. Moore. 2001b.
Removal of solids and major plant nutrients from swine manure using a screw press
separator. Applied Engineering In Agriculture, 17(3): 355-363.
Chiumenti, R., L. Donatoni and S. Guercini. 1987. Liquid / Solid Separation Tests on Beef Cattle
Manure. In: Seminar of the 2nd Technical Section of the C.I.G.R., pp 34-44. University of
Illinois, Illinois.

Manure Treatment Technologies 104
Converse, J.C., R.G. Koegel, and R.J. Straub. 1999. Nutrient and solids separation of dairy and
swine manure using a screw press separator. ASAE paper No. 99-4050, St. Joseph,
Mich.:ASABE.
Converse, J.C., R.G. Koegel, and R.J. Staub. 2000. Nutrient separation of dairy manure. In:
Animal, Agricultural, and Food Processing Wastes, Proccedings of the 8th International
Symposium, pp 118-131, St. Joseph, Mich.:ASABE.
Fernandes, L., E. McKeys, and L. Obidniak. 1988. Performance of a continuous belt
microscreening unit for solid liquid separation of swine wastes. Canadian Agricultural
Engineering, 30(1):151-155.
Ford, M., and R. Fleming. 2002. Mechanical Solid Separation of Livestock Manure Literature Review.
Ridgetown, Ontario, Canada: Ridgetown College, University of Guelph.
Fleming, R. 1986. Solids-Liquid Separation of Manure , Factsheet No. 86-032. Toronto, Ontario, Canada: Ontario Ministry of Agriculture and Food.
Fulhage, C.D., and J.A. Hoehne. 1998. Performance of a screen separator for flushed dairy
manure. In: (ed) J.P. Chastain, Proceedings of the Fourth International Dairy Housing
Conference, pp 130 – 135 St. Joseph, Mich: ASABE.
Gooch, C.A., S.F. Inglis, and K.J. Czymmek. 2005. Mechanical solid-liquid manure separation:
performance evaluation on four New York state dairy farms —a preliminary report.
ASABE Paper no. 05-4104. St. Joseph, Mich.: ASABE.
Glerum, J.C., G. Klomp, and H.R. Poelma. 1971. The separation of solid and liquid parts of pig
slurry. In: Proceedings of the First International Symposium on Livestock Wastes, 345-
347, St, Joseph, Mich.: ASABE.
Graves, R.E., J.T. Clayton, and R.G. Light. 1971. Renovation and reuse of water for dilution and
hydraulic transport of dairy cattle manure. ASAE Publication PROC-271, St. Joseph,
Mich.:ASABE.
Hamilton, D.W. 2010. Solids Separation in Swine Manure Handling Systems. eXtension Hogs,
Pigs, and Pork. http://www.extension.org/pages/27470/solids-separation-in-swine-
manure-handling-systems#.Uyyb7ahdV0M
Hegg, R.O., R.E. Larson, and J.A. Moore. 1981. Mechanical liquid-solid separation in beef, dairy,
and swine slurries. Transactions of the ASAE, 24(1):159-163.
Hjorth, M., K.V. Christensen, M.L. Christensen, and S.G. Sommer. 2010. Solid-liquid separation
of animal slurry in theory and practice. a review. Agronomy for Sustainable
Development, 30:153-180.
Møller H.B., Lund I., Sommer S.G. 2000. Solid–liquid separation of livestock slurry: efficiency
and cost, Bioresource Technology, 74, 223–229.

Manure Treatment Technologies 105
Møller H.B., Sommer S.G., Ahring B.K. 2002. Separation efficiency and particle size composition
in relation to manure type and storage conditions, Bioresource Technology. 85, 189–
196.
Møller H.B., Hansen J.D., Sørensen C.A.G. 2007. Nutrient recovery by solid-liquid separation
and methane productivity of solids, Transactions of the ASABE 50, 193–200.
Piccinini, S., and L. Cortellini. 1987. Solid-liquid separation of animal slurries. In: Proceedings of
the 4th International CIEC Symposium, Agricultural Waste Management and
Environmental Protection, pp 219-229. Braunschweig-Voelkenvode, Germany:
International Scientific Center of Fertilizers (CEIC) and Federal Agric. Research Center
(FAL).
Pieters J.G., G.G.J. Neukermans, and M.B.A. Colanbeen. 1999. Farm-scale membrane filtration
of sow slurry, Journal of Agricultural Engineering Research 73, 403–409.
Pos J., R. Trapp, and M. Harvey. 1984. Performance of a brushed screen roller press manure
separator, Transactions of the ASAE, 27, 1112–1118.
Reimann W. 1989. Fest-flüssig-trennung von gülle und gülleaufbereitungsprodukten, Arch.
Acker- Pflanzenbau Bodenkd. (Berlin) 33, 617–625.
Rorick, M.B., D.J. Warburton, S.L. Spahr and D.L. Day. 1980. Performance of a perforated
pressure roller solid/liquid separator on dairy manure. In: Proceedings of the 4th
International Symposium on Livestock Wastes, pp 426-429, St. Joseph, Mich.: ASABE.
Shutt, J.W., R.K. White, E.P. Taiganides and C.R. Mote. 1975. Evaluation of solids separation
devices. In Managing Livestock Wastes, pp 463-467. St. Joseph, Mich.: ASABE.
Sneath R.W., M. Shaw, and A.G. Williams .1988. Centrifugation for separating piggery slurry. 1.
The performance of a decanting centrifuge, J.Agr. Eng. Res., 39, 181–190.
Westerman, P.W., and J.A. Ogejo. 2005. Centrifuge solids/liquid separation of swine flushed
manure and lagoon sludge. ASAE Paper No. 054080. St. Joseph, Mich.: ASABE.
Wu Z. 2007. Phosphorus and nitrogen distribution of screw press separated dairy manure with
recovery of bedding material, Applied Engineering in Agriculture, 23, 757–762.
Zhang, R.H. and P.W. Westerman. 1997. Solid-Liquid Separation of Animal Manure for Odor
Control and Nutrient Management. Applied Engineering in Agriculture, 13(5): 657-664.

Manure Treatment Technologies 106
9. Wet Chemical Treatment
Wet chemical treatment of manure involves three processes: Precipitation, Coagulation,
and Flocculation. Suspended solids are created from dissolved nitrogen and phosphorus by
precipitation. Coagulation and flocculation enhance the removal separation of suspended
solids by bunching individual particles into larger, more settleable groups of solids. All three
processes require settling or mechanical solid-liquid separation to remove nutrients from the
manure.
Wet Chemical Treatment Terminology
Precipitation is the formation of solid particles -- generally colloidal in size -- from dissolved
solids by adding chemicals to transform soluble ions into less soluble precipitates.
Coagulation is the removal of repulsive forces between small particles – usually by reducing
electrical charges – to form larger, more easily removed particles.
Flocculation is the binding together of small particles to form larger, more cohesive particles
called flocs.
A Precipitate is an insoluble chemical compound created through a chemical reaction
between dissolved ions.
A Precipitant is a chemical used to activate precipitation reactions in solution.
A Colloidal Particle is a very fine particle (smaller than 0.1 micron) that remains suspended
in water under quiescent conditions.
Suspended Solids are the non dissolved particles that remain after water is evaporated from
a liquid sample. By definition, suspended solids are solid particles that are retained on a 1.5
micron filter (APHA, 2012).
Dissolved Solids are particles that remain after water is evaporated from a sample, but are
dissolved (exist as separated ions) in water. By definition (APHA, 2012), they are solids that
pass through a 1.5 micron filter.
Settleable Solids are non-dissolved particles that settle out of a liquid under quiescent
conditions.
Chemical Treatment not Covered in this Report
Chemicals added to Treat Poultry Litter generally lower litter pH, which reduces the loss
of ammonia gas to the atmosphere by shifting the auto dissociation of ammonia towards the
non-volatile ammonium ion. Some additives also causes precipitation of orthophosphate
phosphorus into less water soluble forms of phosphorus. Although chemical additions to

Manure Treatment Technologies 107
poultry litter may be an effective method of temporary immobilizing nitrogen and phosphorus,
its action takes place within animal housing, and may more accurately be described as manure
storage rather than treatment.
Two additional physical processes, adsorption and absorption, often associated with chemical
treatments are not covered in this report. Adsorption is immobilization of nutrients by fixing
them to the surface of chemical compounds or materials. An example of adsorption is fixing
ammonia nitrogen on the surface of certain clays, soaps, and zeolites (Johnston et al., 1981;
Bernal and Lopez Real, 1993). Absorption is the incorporation of nutrients within the
structure of a chemical or material. Bedding absorbs moisture from manure. The absorbed
liquid may contain dissolved nitrogen and phosphorus. However, using bedding does not
reduce the mass of nutrients leaving the barn.
Types of Manure Used
Precipitation is used as the first step in removing nutrients from liquid and slurry dairy and
swine manure. Precipitation is also a polishing step in removing phosphorus from clarified
liquids, lagoon effluent, composting leachate, aerobic treatment effluent, and anaerobic digester effluent originating from all types of manure. Flocculation and coagulation are used to enhance
removal separation of nutrients by settling and mechanical solid-liquid separation from all types
of manure liquid and slurry.
Transfer Efficiencies Wet Chemical Treatment
There are two primary types of wet chemical treatment: 1) chemcial additions to enhance
separation of settling devices and mechanical solid-liquid separators, and precipitation 2)
Formation of precipitants from clarified manure liquids. Black box approximations of settling
and mechanical solid-liquid separation are given in Figures STTL.1 and MSLS.1. Figure WCT.1 is
a black box schematic of chemical precipitation of clarified liquid manure.
Since neither settling devices, mechanical solid-liquid separators, nor chemical precipitators
remove nitrogen through volatilization, NVE wet chemical treatment is always zero. Nitrogen
and phosphorus separation efficiencies as calculated as shown in Equations WCT.1 and WCT.2:
NSE = (Mass of TN in Sludge, Cake, or Precipitated Solids) X100 WCT.1
(Mass TN in Influent)
PSE = (Mass of TP in Sludge, Cake or Precipitated Solids) X100 WCT.2
(Mass TP in Influent)

Manure Treatment Technologies 108
Figure CP1. Black Box Schematic of a Chemical Precipitator.
Default Transfer Efficiencies of Wet Chemical Treatment
Since removal separation of phosphorus and nitrogen by wet chemical treatment is heavily
dependent on chemical dosing, and the ultimate removal separation of precipitated, coagulated,
and flocculated solids relies on a secondary removal separation system (settling, mechanical
solid-liquid separation), no transfer of nutrients can be assumed in Chesapeake Bay Model
unless monitoring data from an individual treatment system is provided.
Review of Available Science on Wet Chemical Treatments
The first step of wet chemical treatment is precipitation. In precipitation, dissolved ions are
chemically transformed to non-soluble, colloidal crystals called precipitates. Solids are further removed from suspension through the use of coagulating and flocculating agents. Coagulants
collapse the electrical, generally positive, charges that repel particles. With the repulsive
charges removed, colloidal and suspended particles stick together to form conglomerates. The
conglomerated particles are weak and gelatinous in consistency. Flocculants are filamentous
chemicals that bind together and strengthen conglomerated particles allowing them to settle at
much greater rate. Strengthening particles with flocculants also allows the particles to remain
intact when subjected to mechanical methods of solid-liquid separation.
Location of Chemical Addition in the Manure Handling System
Figure WCT.2 shows a generic layout of manure treatment on a dairy farm. Not all of these
technologies are currently being used on dairy farms -- the figure is presented to show possible
Chemical
Precipitator
Liquid Manure
(Influent)
N or P in
Precipitated Solids
Activation Chemicals
N or P inLiquid Effluent

Manure Treatment Technologies 109
locations within the manure treatment system where chemicals could be applied for nutrient
removal. In location A (just before a solid-liquid separation) coagulants and flocculants are used
to enhance solids separation and thus separate P and N form the liquid stream. In location B
(effluent of anaerobic digester) coagulants and flocculants are added to enhance solids removal
separation and precipitants along with coagulants and flocculants to remove dissolved P and N.
Activation chemicals can also be added along with coagulants and flocculants added in Location
C (after nitrification) and D (after advanced treatment systems such as enhanced biological
removal reactors or denitrification reactors) to remove dissolved P. Due to higher solids
content, applying chemical at location A may require a higher chemical dosage compared to
other locations, and may also lead to nutrient deficient conditions if manure treatment
technologies downstream of the separator are biological systems. If the manure treatment
system is not set up for continuous chemical P removal, P can be removed by adding chemicals
to storage tanks before land application. When using the batch method, producers should be
sure to have contingency plans to flush liquid from barns if recycled, treated manure is used to
clean barns.
Figure WCT.2 . Generic Dairy Manure Handling System Showing Areas to Add Chemicals
for Treatment.

Manure Treatment Technologies 110
Precipitation and Coagulation Using Metal and Calcium Salts
The nature of precipitates formed during chemical P removal separation is not well
understood. Some properties of the chemicals for P removal separation and a partial list of the
solids that can be formed by adding metal and calcium salts are presented in Table WCT.1.
Other solids not containing phosphates that can be formed are also included in Table WCT.1.
Table WCT.1. Properties of Metal and Calcium Salts used to Remove Phophorus by Precipitation
and Some Precipitates Formed.
Precipitant
Molecular
Weight
(g/mole)
Availability Possible
Precipitates Form Concentration (%)
Aluminum sulfate (Alum)
Al2(SO4)3 •14H2O 594
Liquid 4.3 to 4.5 Al
Aluminum phosphate
Aluminum hydroxide
Dry 9.0 to 9.2 Al
Aluminum chloride
AlCl3 133.5 Liquid 5.3 to 5.8 Al
Ferric chloride
FeCl3 162.2 Liquid 11.3 to 14.5 Fe
Ferric phosphate
Ferric hydroxide Ferric sulfate
Fe2(SO4)3•9H2O 562
Granular 18.5 to 20.5 Fe
Liquid 10 to 14 Fe
Calcium hydroxide (Lime)
Ca(OH)2•2H20 74.1
Dry 63-73 (CaO) Hydroxyapatite
Ca10(PO4)6(OH)2
Dicalcium phosphate
Tricalcium phosphate
Calcium carbonate
Slurry 15-20 (CaO)
Powder 85-99 (CaO)
Aluminum and Iron Salts behave similarly when used for phosphorus removal. The simple
chemical reactions for precipitating phosphorus using aluminum and iron salts are given in
Equations WCT.3 and WCT.4. Under ideal circumstances, 55 pounds of iron or 28 pounds of
aluminum will precipitate 100 pounds of phosphate. However, there are many competing
reactions that occur associated with these metals including the effects of alkalinity, pH, trace
elements, and organic complexes when these chemicals are added to manure. Because of these
competing reactions, the required chemical doses are usually larger than those predicted by the
chemical relationships of WCT2 and WCT3. The exact quantities are usually established using
bench scale tests. The optimum pH range for P removal using Al and Fe is 4 to 7.

Manure Treatment Technologies 111
𝑨𝒍𝟑+ + 𝑷𝑶𝟒𝟑− → 𝑨𝒍𝑷𝑶𝟒 WCT.3
𝑭𝒆𝟑+ + 𝑷𝑶𝟒𝟑− → 𝑭𝒆𝑷𝑶𝟒 WCT.4
When Lime (Figure WCT3) is added to liquid manure, it first reacts with the natural alkalinity.
The reaction with alkalinity produces calcium carbonate, CaCO3 (WCT.4). As more lime is
added and alkalinity consumed, the pH of the manure increases. When manure pH increases
beyond a value of 10, the excess calcium ions in solution react with phosphate to precipitate
hydroxyapatite (WCT.5). Thus, the quantity of lime required to precipitate phosphate depends
primarily on the alkalinity of manure. The optimum pH for P removal using lime is high (over
10), thus if lime is used to remove P, the pH of the resulting liquid manure may need to be
adjusted if a lower pH is desired at the final point of use.
Figure WCT.3. Wastewater from an Alligator Ranch before and after Lime
Treatment (YouTube: OSUWasteManagement).

Manure Treatment Technologies 112
𝑪𝒂(𝑶𝑯)𝟐 + 𝑯𝑪𝑶𝟑− → 𝑪𝒂𝑪𝑶𝟑(𝑺) + 𝑯𝟐𝑶 WCT.5
𝟏𝟎𝑪𝒂𝟐+ + 𝟔𝑷𝑶𝟒𝟑− + 𝟐𝑶𝑯− ↔ 𝑪𝒂𝟏𝟎(𝑷𝑶𝟒)𝟔(𝑶𝑯)𝟐 WCT.6
Figure WCT.4 shows the effect of adding metal and calcium salts to enhance removal of
dissolved P from dairy manure by settling. The 40% Ferric chloride solution was not added in
doses exceeding 2,000 mg/l, because Fe salts produce gases that make solids float. For this
reason, FeCL2 is more commonly used as an additive in Dissolved Air Flotation Systems (DAF),
which is not covered in this report.
Figure WCT.4. Removal of Soluble Phosphorus from Separated, Sand-Bedded Dairy
Manure after Adding Alum, Lime, or Ferric chloride and Settling for One Hour
(from Kirk et al., 2003).
The metal salts of iron, aluminum, and calcium are also the most common coagulants used in
agriculture. When these salts are added in sufficient quantities to manure, the newly formed
particulates present in the manure coagulate to form larger particles. Some of the parameters
that highly influence the effectiveness of chemical coagulation include pH, suspended solids,
dissolved organic matter, type and dose of chemical used, and where the chemical is applied in
the manure treatment and handling system.
Figure WCT.5 shows the effect of alum, lime and ferric chloride in separating total P from dairy
manure by settling. The results of Figure WCT.5, which used the same manure as the study
shown in WCT.4, show that alum and lime are equally effective at separating TP from the
manure stream. The liquid manure used in this study contained 196 mg/l soluble P and 2,831
0
10
20
30
40
50
60
70
80
90
100
0 2,000 4,000 6,000 8,000 10,000
Rem
oval o
f S
olu
ble
P o
ver
Co
ntr
ol (%
)
Chemical Dose (mg/l)
40% Alum
5% Lime
40% Ferric Chloride

Manure Treatment Technologies 113
mg/L Total P (< 10% Soluble). These figures taken together suggest that, although alum may act
as a better precipitant than lime, the two chemicals have similar coagulant properties.
Figure WCT.5. Removal of Total Phosphorus from Separated, Sand-Bedded Dairy
Manure after Adding Alum, Lime, and Ferric chloride and Settling for One Hour
(from Kirk et al., 2003).
Figures WCT.4 and WCT.5 suggest that the removal of phosphorus from manure is dependent
on the dosing rate of chemicals. In other words, the more activation chemical added, the more
phosphorus is removed. Dosing rate is calculated as the ratio of the activate element in the
precipitant (Al, Ca, Fe) to the element to be removed (P). Figure WCT.6 shows the effect of
alum dosage on the removal of Total P from dairy manure by settling.
Determining the dosing rate can be very difficult, and due to the complex chemistry of manure,
is virtually impossible to achieve without experimental data. A laboratory technique called a
Jar Test is used to determine the optimum dose of chemicals needed for a particular
wastewater. The jar test requires a container (1 liter volume), a timer, a mixer (one with
variable speed preferred), and graduated cylinders (or a way of measuring volume). In a jar test,
a sample of manure to be treated is poured into a series of beakers. Different doses of the
chemicals are then applied to each beaker. The contents are rapidly stirred immediately after
the chemical is applied to simulate rapid mixing followed by gentle stirring to allow flocculation
to occur. After some time, the stirring is stopped to allow the flocs formed to settle. The most
important things to note during the jar test are the floc size and clarity of the supernatant
liquid.
-20
0
20
40
60
80
100
0 2,000 4,000 6,000 8,000 10,000
Rem
oval o
f T
ota
l P
over
Co
ntr
ol (%
)
Chemical Dose (mg/l)
40% Alum
5% Lime
40% Ferric chloride

Manure Treatment Technologies 114
Figure WCT.6. Effect of Alum Dosing on Total Phosphorus Removal Efficiency after
Settling for 24 Hours. (Sherman, et al., 2000; Kirk et al., 2003)
The following procedure is suggested for performing the jar test for metal and calcium salts. Measure 1L of manure sample into the 1L container (or containers if more than 1). Select the
chemicals and the range or concentrations to be tested. Obtain the chemicals and prepare
desired concentrations to be used in the test. Turn the mixer on and set the speed to high (100
rpm, if mixer has a speed indicator). Add the selected volume or dose of chemical to the each
jar. Mix for about 2 min at the high speed and then reduce the speed to about 30 rpm and mix
for about 5 min. After mixing, settle the chemically treated manure for 60 min. Observe the
container noting particle size, settling characteristics, and the clarity of the supernatant. Analyze
the supernatant for P, suspended solids, and color to determine which dose produced the
desired level of treatment. Use the results to select the chemical or combination of chemicals
that achieves the desired result to calculate the quantity of the selected chemical required.
Coagulation and Flocculation using Organic Polymers
Polymers are high molecular weight compounds usually made of synthetic material. Polymers
can be cationic (positively charged) or anionic (negatively charged). The fibrous nature of
polymers allows them to form bridges between particles, and their electrical charges allow
them to attract particles and act as coagulants. The most common flocculants used for manure
are cationic polyacrylamides (PAM). Polymers may be supplied as a prepared stock solution
ready for addition to the treatment process or as a dry powder. The best approach in selection
of polymers is to contact a supplier or manufacturer for recommended practice and use.
Flocculants in combination with coagulants or flocculants alone are used to enhance separation
in screen type mechanical solid-liquid separators (stationary screens, rotating screens, screw
press, belt press, brushed screen roller press). The fibrous flocculant adds strength to
conglomerated particles. Without the added strength of the flocculant these particles are likely
0
20
40
60
80
100
0.1 1.0 10.0
To
tal P
ho
sph
oru
s R
em
oval over
Co
ntr
ol (%
)
Alum Dosing (mg Alum Al: mg TP)

Manure Treatment Technologies 115
to be squeezed through or smeared across the screens. Effect of dosing of cationic PAM to
enhance removal of swine manure phosphorus through screening is shown in Figure WCT.7.
Figure WCT.7 Effect of Cationic Polyacrylamide Flocculant Dosing on Total
Phosphorus Remvoval from Swine Manure by Screening (from Vanotti and Hunt,
1999; Vanotti et al., 2002).
If polymer is to be used alone or with coagulants to remove P, the jar testing procedure
outlined for metal and calcium salts should be done in the following three steps: add chemical
to manure and mix for 2 min. at 100 rpm; then add polymer and mix for 2 min. at 200 rpm and
then reduce the speed to 30 rpm and mix for a further 5 min.; and then settle for 60 min. After
settling, analyze the supernatant as suggested above.
Precipitation of Struvite (Magnesium Ammonium Phosphate)
Precipitation of Struvite (MgNH4PO4•H2O) has been the curse of swine farmers as long as
anaerobic lagoon effluent has been used to flush hog barns. Struvite deposits whenever excess
Mg+2, NH4+1 and PO4-3 are available, reducing conditions exist, and seed crystals bump into each
in turbulent flow. In other words crystalline struvite deposits in pipes, pipe fittings, and on
pump impellors. Equally calamitous conditions exist when pumping anaerobic digester
(Borgerding, 1972) and swine lagoon effluent (Booram et al, 1975). Buchanan et al. (1994),
Ohlinger et al (1999), and Nelson et al. (2000) led early efforts to turn the curse into a blessing
by exploring the conditions under which struvite is formed with the intention of precipitating
the salt before it enters pipe networks. The common ingredients were adjusting pH to create
0
20
40
60
80
100
0.00 0.05 0.10 0.15 0.20 0.25
To
tal P
ho
sph
oru
s R
em
oval
Eff
icie
ncy (
%)
PAM Dosing (Cationic Charge : mg TP)
1.1% TS Swine Manure
35% Charge Density Cationic PAM
0.65% TS Swine Manure
20% Charge Density Cationic PAM

Manure Treatment Technologies 116
basic conditions, and adding sufficient Mg+1 to stimulate precipitation. Under laboratory
conditions, removal efficiency of TP by struvite precipitation runs between 80 and 90% (Burns
et al., 2003; Nelson et al., 2003; Laridi et al., 2005). The kinetic experiments led to
development of a cone-shaped fluidized bed crystallizer (Figure WCT.5) to effectively remove
struvite from lagoon effluent (Bowers and Westerman, 2005a). Total Phosphorus removal
efficiency of the cone crystallizer using synthetic swine manure and controlled conditions was
60 to 80% (Bowers and Westerman, 2005b); however using effluent from a covered lagoon
digester on a working swine farm gave mean TP removal efficiency of 55% ± 10% and
orthophosphate phosphorus removal efficiency of 65% ± 5% (Westerman et al., 2010).
Figure WCT5. DemontrationDemonstration of the Latest Generation of Cone Struvite
Crystallizer on a Dairy Farm near Massey, Maryland (Sassafrassriver.org).
Removal of TP from dairy manure by struvite is much more difficult. Sheffield et al. (2005)
found that the cone crystallizer removed TP from untreated dairy manure in the 8 to 19%
range. Shen et al. (2011) found that suspended solids and excess Ca+2 inhibited struvite
precipitation in liquid dairy manure. They were able to increase TP removal efficiency of dairy
manure above 60% by reducing manure to pH 4.5, adding EDTA or oxalic acid to remove Ca+2,
and raising pH to 7.5.
Forty-five pounds of ammonia nitrogen removed for every 100 pounds of phosphorus
precipitated as struvite. Removal efficiency of TN depends on the TAN:TP ratio of the treated
manure and pH at time of precipitation.

Manure Treatment Technologies 117
Defined Separation Efficiencies based on Process Factors
Transfer efficiency of N and P by wet chemical treatments is highly dependent on chemical
dosing. For this reason, defined separation efficiencies for settling and mechanical solid-liquid
separation given in previous chapters should be used with the CBWM instead of estimating the
effect of enhancing these processes using activation chemicals. Monitoring data from individual
units should be used for separation efficiencies of lime and struvite precipitation.
Ancillary Benefits of Wet Chemical Treatment
Chemical precipitation is a well-established technology and is widely practiced in the water and
wastewater treatment processes. Equipment and chemicals are readily available to adapt these
practices to agriculture. Precipitation can yield very high phosphorus removal efficiency at
optimum pH and chemical dosing. An ancillary benefit is production of high phosphorus
content fertilizer from relatively dilute manure. This chemical fertilizer may be sold at a
premium resulting in an extra source of revenue for the farmer. The lower cost of
transporting the highly concentrated fertilizer increases the chance that the nutrients will be
shipped out of the Chesapeake Bay Watershed. The chemicals produced, whether struvite,
hydroxyapatite, or Aluminum phosphate, have a known composition and can be applied precisely to meet the needs of a receiving crop – inside or outside the watershed.
Using coagulants and flocculants on raw manure will increase the separation efficiency of
downstream processes. The resultant sludge can be dried and transported further at lower
cost, increasing the chance that the manure nutrients will be shipped out of the Chesapeake
Bay Watershed.
Disadvantages of Wet Chemical Treatments
The principal disadvantage of wet chemical treatment is cost of activation chemicals. Because of
this cost, producers may attempt to reduce dosing and therefore render the treatment
ineffective. Also attempts to recover more nutrients by adding additional chemicals can be
counterproductive because overdosing can reduce the treatment effectiveness. Other costs of
implementation are skilled labor required to handle chemicals and determine proper dosing,
proper storage and handling of potentially corrosive chemicals, disposal of chemical containers,
and the specialized pumping and plumbing required to deliver the chemicals.
Compared to biological P removal, wet chemical treatments produce excessive sludge. For
example lime addition can increase manure solids by up to 50%. Competing reactions and
varying levels of alkalinity and other factors make calculation of dosing difficult; therefore,
frequent jar tests are necessary for confirmation of optimal treatment.

Manure Treatment Technologies 118
References
American Public Health Association (APHA). 2012. Total suspended solids dried at 103-
105oC. Method 2540D in Standard Methods for the Examination of Water and Wastewater,
22nd ed. Washington, DC: APHA.
Bernal, B.P., and J.M. Lopez Real. 1993. Natural zeolites and sepiolite as ammonium and
ammonia adsorbent materials. Bioresource Tech. 46:27-33.
Booram, C.V., R.J. Smith, and T.E. Hazen. 1975. Crystalline phosphate precipitation from
anaerobic animal waste treatment lagoon liquors. Trans. of ASAE 18:340-343.
Borgerding, J. 1972. Phosphate deposits in digestion systems. J. WPCF. 44(5):813-819.
Bowers, K.E., and P.W. Westerman. 2005. Design of cone-shaped fluidized bed struvite
crystallizers for phosphorus removal from wastewater. Trans. of ASAE.
48(3):1217−1226.
Bowers, K.E., and P.W. Westerman. 2005. Performance of cone-shaped fluidized bed struvite
crystallizers in removing phosphorous from wastewater. Trans. of ASAE. 48(3):
1227−1234.
Buchanan, J.R., C.R. Mote, and R.B. Robinson. 1994. Thermodynamics of struvite formation.
Trans. of ASAE. 37(2):617-621.
Burns R.T., L.B. Moody, I. Celen, J.R. Buchanan. 2003. Optimization of phosphorus
precipitation from swine manure slurries to enhance recovery. Water Sci.Tech. 48:139–
146.
Johnston, N.L., C.L. Quarles, D.J. Fagerberg. D.D. Caveny. 1981. Evaulation of yucca saponin
on performance and ammonia suppression. Poultry Sci. 60:2289-2295.
Kirk, D.M., W.G. Bickert, S. Hashsham, and S. Davies. 2003. Chemical additions for phosphorus
separation from sand free dairy manure. ASAE Paper No. 034122. St. Joseph, Mich.:
ASABE.
Laridi R., J.C. Auclair, and H. Benmoussa. 2005. Laboratory and pilot-scale phosphate and
ammonium removal by controlled struvite precipitation following coagulation and
flocculation of swine wastewater. Environ. Tech. 26: 525–536.
Nelson, N.O., R.L. Mikkelson, and D.L. Hesterberg. 2000. Struvite formation to remove
phosphorus from anaerobic swine lagoon liquid. In, Animal, Agricultural and Food
Processing Wastes, Proceedings of the 8th International Symposium. St Joseph, MI: ASABE.
Nelson N.O., R.L., Mikkelsen, and D.L. Hesterberg. 2003. Struvite precipitation in anaerobic
swine lagoon liquid: effect of pH and Mg:P ratio and determination of rate constant.
Bioresource Tech. 89: 229–236.

Manure Treatment Technologies 119
Ohlinger, K.N., T.M. Young, E.D. Schoeder. 2000. Postdigestion struvite precipitation using a
fluizided bed reactor. J. Environ. Eng. 126: 368
Sheffield, R., K. Bowers, and J. Harrison. 2005. Phosphorus removal on dairies in the Pacific
Northwest: applying a cone shaped fluidized bed phosphorus crystallizer. in, The
Development of Alternative Technologies for the Processing and Use of Animal Waste:
Proceedings of the Animal Waste Management Symposium. Raleigh, NC: North Carolina
State University.
Shen, Y., J.A. Ogejo, K.E. Bowers. 2011. Abating the effects of calcium on struvite precipitation
in liquid dairy manure. Trans. of ASABE. 54(1):325-336.
Sherman, J. J., H. H. Van Horn, and R. A. Nordstedt. 2000. Use of flocculants in dairy
wastewaters to remove phosphorus. App. Eng. Agric., 16(4): 445-452.
Westerman, P.W., K.E. Bowers, and K.D. Zering. 2010. Phosphorus recovery from covered
digester effluent with a continuous-flow struvite crystallizer. Appl. Eng. in Agri.
26(1):153-161.
Vanotti, M.B., and P.G. Hunt. 1999. Solids and nutrient removal from flushed swine manure
using polyacrylamides. Transactions of ASAE, 42(6):1833-1840.
Vanotti, M.B., D..C. Rashash, and P.G. Hunt. 2002. Solid-liquid separation of flushed swine
manure with PAM: effect of wastewater strength. Transactions of ASAE, 45(6):1959-1969.

Manure Treatment Technologies 120
10. Data Collection and Reporting Protocols for Reporting Data Driven
(Level 3) Transfer Efficiencies
This section describes the general expectations and protocols that are proposed as a data-
driven BMP category that can apply to a manure treatment system that has monitoring data to
determine the nitrogen load that will be eliminated from the primary manure stream. This section does not apply to the Default (Level 1) and Defined (Level 2) categories described
elsewhere in this report. Data Driven (Level 3) Transfer Efficiency can be applied to a
treatment system that utilizes one or more manure treatment technologies described
previously in this report. The technologies being used may be proprietary or non-proprietary
and may be used in any sequence to produce one or more end products for subsequent
transport or land application. On-farm or multi-farm, centralized manureT treatment systems
reported under this category will have unique transfer efficiencies that must be determined
using monitoring data collected on site. The reported performance data will include the mass of
N volatilized as gaseous emissions. If mass of N lost through emissions is not monitored, then a
quantifiable mass balance of the system’s N inputs and outputs is required. The calculated
transfer efficiency will vary annually from system to system. Transportation or land applications
of any end products from these types of systems should be reported via NEIEN under separate
BMPs (e.g. Manure Transport, manure injection/incorporation). Manure treatment systems that
lack adequate annual performance data to support a Data Driven Transfer Efficiency (i.e., Level
3) should be reported using the appropriate Level 1 or Level 2 Transfer Efficiency for that
system’s primary manure treatment technology.
Existing monitoring data collection and reporting requirements will vary by manure treatment
system and jurisdiction and/or supplemental funding program(s), if any. Permit requirements
may exist for some treatment systems, but will also vary based on a variety of factors, including
whether the treatment system is associated with a permitted CAFO or AFO, the capacity and type of system, the system’s air emissions, and applicable state and federal regulations that
cover relevant areas such as air emissions or the handling/treatment/disposal of animal manure.
This chapter provides some basic guidance for the partnership with the understanding that any
specific regulatory and programmatic requirements for the monitoring, sampling or reporting of
data for a manure treatment system is determined by the jurisdiction. Given the panel’s scope,
and due to the potentially complex nature of federal and state regulations, program
requirements and guidance, the panel understood early on that it would only be able provide
general reporting and monitoring guidance to be usedfor the partnership when seeking to
establish a category for Level 3 transfer efficienciesy in the modeling tools. By not prescribing
specific methods the panel does not inhibit the ability of state and federal partners to work with
each other, producers and third parties to determine effective monitoring and verification
protocols that can simultaneously ensure rigorous data collection and reporting while not being
overly burdensome or costly to implement.
The panel acknowledges that some states have existing programmatic and regulatory structures
that will guide and inform the necessary data collection tracking and reporting to establish
report Level 3 transfer efficiencies for eligible manure treatment systems. Other states may not
have such programmatic structures at this time because these treatment technologies may only
be in pilot stages or are not common enough in their state to warrant more explicit regulations
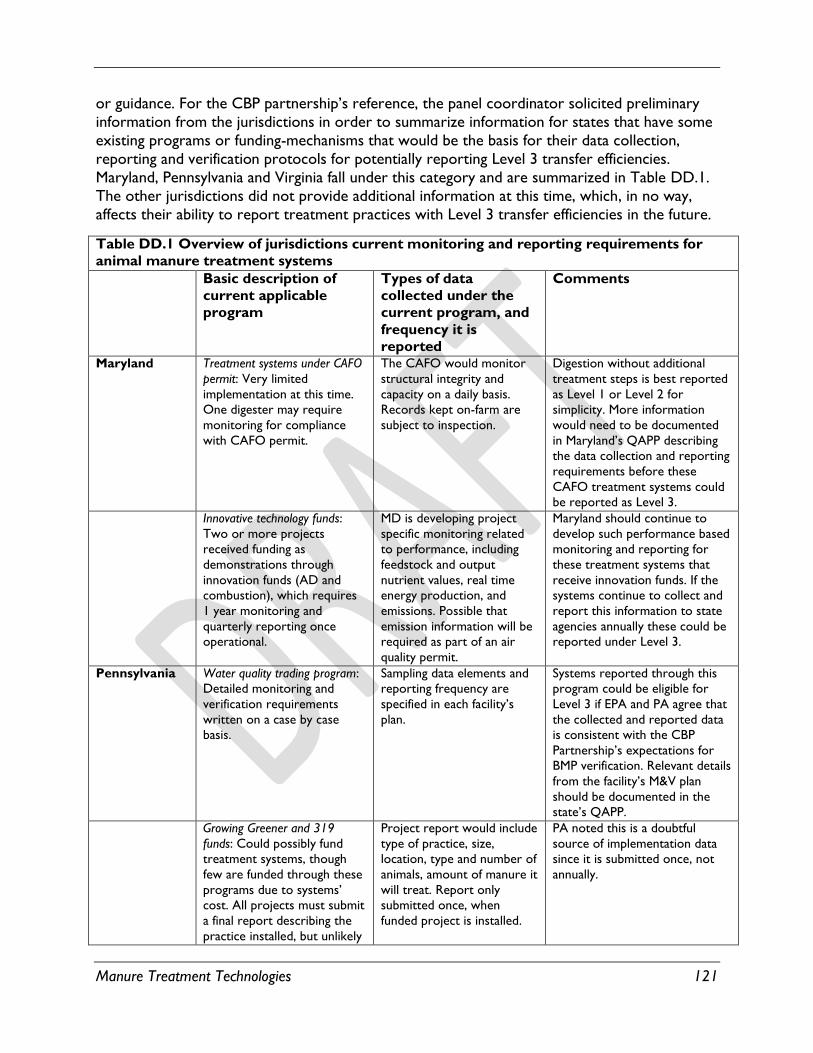
Manure Treatment Technologies 121
or guidance. For the CBP partnership’s reference, the panel coordinator solicited preliminary
information from the jurisdictions in order to summarize information for states that have some
existing programs or funding-mechanisms that would be the basis for their data collection,
reporting and verification protocols for potentially reporting Level 3 transfer efficiencies.
Maryland, Pennsylvania and Virginia fall under this category and are summarized in Table DD.1.
The other jurisdictions did not provide additional information at this time, which, in no way,
affects their ability to report treatment practices with Level 3 transfer efficiencies in the future.
Table DD.1 Overview of jurisdictions current monitoring and reporting requirements for
animal manure treatment systems
Basic description of
current applicable
program
Types of data
collected under the
current program, and
frequency it is
reported
Comments
Maryland Treatment systems under CAFO
permit: Very limited
implementation at this time.
One digester may require
monitoring for compliance
with CAFO permit.
The CAFO would monitor
structural integrity and
capacity on a daily basis.
Records kept on-farm are
subject to inspection.
Digestion without additional
treatment steps is best reported
as Level 1 or Level 2 for
simplicity. More information
would need to be documented
in Maryland’s QAPP describing
the data collection and reporting
requirements before these
CAFO treatment systems could
be reported as Level 3.
Innovative technology funds:
Two or more projects
received funding as
demonstrations through
innovation funds (AD and
combustion), which requires
1 year monitoring and
quarterly reporting once
operational.
MD is developing project
specific monitoring related
to performance, including
feedstock and output
nutrient values, real time
energy production, and
emissions. Possible that
emission information will be
required as part of an air
quality permit.
Maryland should continue to
develop such performance based
monitoring and reporting for
these treatment systems that
receive innovation funds. If the
systems continue to collect and
report this information to state
agencies annually these could be
reported under Level 3.
Pennsylvania Water quality trading program:
Detailed monitoring and
verification requirements
written on a case by case
basis.
Sampling data elements and
reporting frequency are
specified in each facility’s
plan.
Systems reported through this
program could be eligible for
Level 3 if EPA and PA agree that
the collected and reported data
is consistent with the CBP
Partnership’s expectations for
BMP verification. Relevant details
from the facility’s M&V plan
should be documented in the
state’s QAPP.
Growing Greener and 319
funds: Could possibly fund
treatment systems, though
few are funded through these
programs due to systems’
cost. All projects must submit
a final report describing the
practice installed, but unlikely
Project report would include
type of practice, size,
location, type and number of
animals, amount of manure it
will treat. Report only
submitted once, when
funded project is installed.
PA noted this is a doubtful
source of implementation data
since it is submitted once, not
annually.

Manure Treatment Technologies 122
this program will be a source
of reporting data for BMP
implementation.
PennVest: Available to fund
treatment projects. Generally
does not require monitoring
beyond completion of
installation. Many projects
also receive USDA funding
which does not report
monitoring data.
Unclear what types of data
are collected or provided in
report, which appears to be
limited to project
completion.
With this amount of information
the system is better suited for
reporting under Level 1 or Level
2, if reported at all. However,
systems funded in this manner
may report their data under
other programs, e.g. water
quality trading.
Virginia Individual permits and the
VPA AFO General Permit.
Four options for permitting
AFOs in Virginia: two are
general permits and two are
individual permits.
Owner of the AFO facility
required to sample, analyze
and keep record of TKN,
Ammonia N, TP, total K, Ca,
Mg, and moisture content.
Composite sample must be
analyzed for each of the
parameters once each year,
or every 3 years for poultry.
A sample is taken from each
type of waste stream
produced by treatment
system used by the AFO.
Data elements collected as
required under the permits
would be inspected by DEQ
staff at the facility. GP
requires recordkeeping but
not reporting, while
individual permits VPDES
CAFO IP and VPA AFO IP)
require annual reporting to
regional DEQ offices
electronically or by hard
copy. Records are inspected
by the regional DEQ staff.
The collected information
appears sufficient for reporting
these systems under Level 3, but
if systems under the GPs are not
reported to DEQ then they
could not be reported to EPA as
Level 3 BMPs and would need to
be reported as Level 1 or Level
2 instead. Systems that report
annually under the individual
permits should already be
providing the necessary
information to DEQ to be
reported under Level 3.
General or
watershed-wide
comments
The data collection, sampling
and reporting requirements
for state programs are highly
variable due to a number of
factors, e.g. regulatory vs.
voluntary, cost-share vs. loan
vs. grant vs. seed money for
innovative approaches, etc.
Level 1 BMPs are expected
to be the most commonly
reported due to the
relatively minimal data
needs. Jurisdictions should
be encouraged to strive for
Level 2 and Level 3 BMPs
whenever they are able to
develop or enhance their
ability to receive and submit
the necessary data from the
treatment system operator.
Monitoring, sampling and
reporting requirements for any
manure treatment system
reported under Level 3 must be
clearly documented in the
jurisdiction’s QAPP. If a system
reports data under multiple
programs, the jurisdiction only
needs to document and describe
the program(s) from which the
data submitted to the CBP is
received.

Manure Treatment Technologies 123

Manure Treatment Technologies 124
Table DD.1 summarizes applicable data collection or reporting requirements as described by
Maryland, Pennsylvania and Virginia when contacted by the Panel Coordinator in the course of
developing this report. The table is not intended to be a comprehensive description of
applicable programs in the three states, as other programs may apply or be created in the
future. The table is provided to serve as a basic reference and starting point for future
discussions by the partnership as these systems start to be reported for annual progress runs.
The information may be less useful to the jurisdictions who already have a deeper
understanding of these programs and associated data, but others may benefit from the basic
overview provided in the table. Other jurisdictions not shown in Table DD.I may also have
their own programs or may create ones in the future. The table is provided as an informational
guide to illustrate how, or if, a Level 3 transfer efficiency could be reported for a manure
treatment system covered under the programs shown in Table DD.I.
Systems could be covered under one or more programs based on its source funding or
regulatory requirements, so each system willmay need to be described in the jurisdiction’s
QAPP in order for the jurisdiction and EPA to determine its eligibility, on a case-by-case basis,
for a Level 3 mass transfer efficiency. For these reasons it is likely that initially only a handful of
systems will report Level 3 transfer efficiencies, but that number will likely grow if
implementation incentives are accelerated. If the cumulative reductions for manure treatment
systems reporting Level 3 treatment efficiencies becomes > 1% of a state’s net nutrient
reductions for one or more progress runs, the partnership should evaluate the reporting
requirements for these systems and discuss whether improvements to the data collection,
reporting and verification system are warranted.
Any jurisdiction reporting a manure treatment system with a Level 3 transfer
efficiency must document its data collection and reporting requirements for the
associated system in its Quality Assurance Project Plan (QAPP) submitted to and
reviewed by EPA. If there are variations in requirements or data collection between individual systems, the jurisdiction will need to clarify those differences in its QAPP.
Specific data collection and reporting requirements will be determined by the applicable state
agency, in coordination with any appropriate federal agencies who have oversight or
implementation roles (e.g., EPA or USDA-NRCS). State-federal coordination may be required
in certain cases and may already occur in most instances, but, if not, it should be strongly
encouraged for purposes of effective management. In all cases, the collected and reported
data will need to meet the expectations described in the CBP partnership’s BMP
Verification Framework. Such a determination will be made by EPA and state partners
during the submission and review of annual BMP progress data.
While specific requirements or decisions will be made by state and federal partners, the panel suggests the following for their consideration when constructing or evaluating an appropriate
sampling, reporting and verification protocol for determining manure treatment system Level 3
transfer efficiencies:
There is no one-size-fits-all protocol for monitoring or sampling. Sampling and testing of the influent (manure) and effluent (treated end products) should be conducted

Manure Treatment Technologies 125
at a frequency appropriate to the size, scale, type(s) of treatment(s) and technologies
being used.
Sampling or monitoring data should be reported to the appropriate state/federal agency
at least twice per year, preferably on a quarterly basis, even if only reported through NEIEN to the CBP once per year for annual progress runs.
Calculating the Level 3 Transfer Efficiencies
Lbs Removed/Year = Mass of N lost as gaseous emissions = NVE (see equation TT.2)
Note: if the system incorporates other feedstock(s) that represent 5% or more of the total
mass of N in the system, then the reported transfer efficiency should be adjusted accordingly.
If the operator does not directly measure the amount of N removed from the treated manure
in the form of gaseous emissions, then the operator can alternatively calculate a mass balance
to determine their transfer efficiency.
N lost as gaseous emissions = (lbs-N of all inputs) – (sum of lbs-N remaining in all solid and
liquid outputs)
The jurisdiction should use new or existing programs in order to maintain accurate records
that may serve to enhance their reporting, tracking or verification efforts. This may include, but
is not restricted to the following:
The amount (in tons or lbs) of manure that is treated by the system.
The type of livestock manure (or litter) being treated.
Source location of the manure. If the treated manure is from another site (i.e. the
system is not associated with one livestock operation), then the source county of the
manure should also be recorded.
End-use or fate of treated manure or other end-products. If the treated effluent or the
end-product from the treatment process is transported to another county or outside
the watershed, this information should also be recorded and could potentially be
reported through other BMPs such as Manure Transport.
An annual summary of the manure input and the fate/transport of the treated manure or
any end products should be provided to the jurisdiction if the jurisdiction does not
already collect or require this information.
The dominant type of treatment technology or technologies utilized in the system, e.g.
anaerobic digestion, pyrolysis, gasification, combustion, etc.
While the BMP could still be credited and simulated in the modeling tools without all of the
above information, it will improve the accuracy of the simulation if the full set of information is
available. Some information (amount of manure treated and location) is required for any system
reported under the transfer efficiencies for Levels 1, 2 or 3 as described in Appendix A. If data

Manure Treatment Technologies 126
elements are not reported available for Level 3 then the system will be simulated under the
appropriate Level 2 or Level 1 BMP based on the provided available informationdata.
Note: The estimated nitrogen reductions associated with a given manure treatment system
reported under Level 3 and calculated in the Chesapeake Bay Program Partnership
environmental modeling tools will not necessarily be equal to credits generated (in pounds of
TN) for water quality trading purposes. Water quality trading programs, whether intrastate or interstate, may have different calculation steps, retirement ratios, additionality requirements, or
other factors that are not considered for this panel’s purposes. This may be a source of
confusion if attempts are made to compare the reductions credited for a treatment system in
the CBP partnership modeling tools with any water quality trading credits associated with that
same manure treatment system under a state’s water quality trading program.
Table DD.1 summarizes applicable data collection or reporting requirements as described by
Maryland, Pennsylvania and Virginia when contacted by the Panel Coordinator in the course of
developing this report. The table is not intended to be a comprehensive description of
applicable programs in the three states, as other programs may apply or be created in the
future. Other jurisdictions not shown in Table DD.I may also have their own programs or may
create ones in the future. The table is provided as an informational guide to illustrate how, or if,
a Level 3 transfer efficiency could be reported for a manure treatment system covered under
the programs shown in Table DD.I.
Systems could be covered under one or more programs based on its source funding or
regulatory requirements, so each system will need to be described in the jurisdiction’s QAPP in
order for the jurisdiction and EPA to determine its eligibility, on a case-by-case basis, for a Level
3 mass transfer efficiency. For these reasons it is likely that initially only a handful of systems will
report Level 3 transfer efficiencies, but that number will likely grow if implementation incentives
are accelerated. If the cumulative reductions for manure treatment systems reporting Level 3
treatment efficiencies becomes > 1% of a state’s net nutrient reductions for one or more
progress runs, the partnership should evaluate the reporting requirements for these systems
and discuss whether improvements to the data collection, reporting and verification system are
warranted.

Manure Treatment Technologies 127
11. Future research and management needs
The panel conducted a thorough review of published data on manure treatment technologies.
The recommendations found in this report are as accurate as possible given the current state of
science and technology. We fully expect this subject to be revisited by a future panel. To aid a
future panel in its mission to improve upon our recommendations, the current panel suggests
the scientific community consider the following recommendations for further research.
Farm-Scale Data Collection
Perhaps the greatest obstacle to accurately determine the performance of manure treatment
technologies is the availability of data at the farm scale. Technologies developed in the
laboratory do not necessarily perform at the same level when placed on farm in real conditions.
We suggest coupling installation of new manure treatment technologies on farm to the applied
research programs of land grant universities and the USDA Agriculture Research Service.
Nutrient Transformations
Mass balances of nutrients into and out of manure treatment systems should be performed as a
part of all applied research projects on treatment technologies. These mass balances should
also account for all forms of nutrients in waste streams, as well as, in fugitive losses. Data
collection is most critical for determination of atmospheric losses of nitrogen in the form of N2,
NH3, and NOx.
Additional Categories of Technologies
A future panel will undoubtedly find additional categories of technology in use on farms in the Chesapeake Bay Watershed. Two categories of biological treatment that have already shown
promise are liquid aerobic treatment of liquid manure and anaerobic treatment of solid manure.
Liquid aerobic and anoxic technologies commonly used in domestic sewage treatment are
making their way into the agricultural sector. Usually placed in conjunction with anaerobic
digestion, these technologies further treat nutrients through nitrification-denitrification and
biological phosphorus removal. Anaerobic composting and solid-state anaerobic digestion are
two forms of treatment that may find use on farm, particularly to incorporate municipal,
domestic, and food processing wastes into the manure handling system.
Additional Defined Technologies
Each section of this report contained a list of technologies that are available for manure
treatment but are either not currently used in the Chesapeake Bay Watershed or farm-scale
data is not available to make recommendations for nutrient transfer or transformation. More
and better data may become available for future panels to expand the list of defined nutrient
transfer efficiencies.
Manure Treatment Technologies 128
12. BMP Verification for manure treatment systems Manure Treatment Technologies represents a new suite of BMPs for the CBP modeling tools
starting with Phase 6. As such, the practice is not included in the jurisdiction's verification plans
that were submitted to the CBP in late 2015.3 As with all BMPs, the jurisdictions will be
expected to document their verification protocols and procedures in their Quality Assurance
Project Plan (QAPP) for manure treatment technologies that are reported to the CBP for
nitrogen crediting reductions under the recommended BMPs. The jurisdictions will be able to
do so after this expert panel recommendation report is approved by the CBP partnership
following the BMP Protocol, and before the jurisdictions are able to start submitting these
BMPs in the Phase 6 modeling tools. As the states consider how to verify manure treatment
technologies and as they document those procedures in their QAPP, state partners should
follow the existing Agriculture Workgroup’s BMP Verification guidance.
The AgWG’s current verification guidance breaks BMPs into three general categories: Visual
Assessment BMPs (Single Year), Visual Assessment BMPs (Multi-Year), and Non-Visual
Assessment BMPs. The complete AgWG guidance is quite extensive (79 pages long, including all
tables and its own appendices) and is not restated in this section. The panel is not proposing
any new or unique aspects of BMP verification for purposes of the BMPs described in this
report. This section simply explains how the recommended BMPs correspond to the existing
BMP verification guidance.
As described in Section 3 of this report, manure treatment is part of a larger manure
management system that often involves multiple physical components (e.g., a compost bin, a
digester, a screw press, a storage shed, etc.) which can be visually assessed over time. Manure
treatment practices also incorporate non-visual components (e.g. manure transport) in addition to management plans or other documentation as needed under applicable state or federal
agricultural permits and/or programs. Thus, manure treatment systems can reasonably be
verified using elements of both the Non-Visual Assessment and Visual Assessment (Multi-Year)
categories described by the AgWG.
Each state will determine the most appropriate methods for verifying the various MTT systems
given their specific priorities, programs, needs, and capacity. For example, one state may lean
more heavily on the Visual Assessment (Multi-Year) elements by leveraging existing site visits to
farms to also verify that the composting facility meets applicable state or federal standards and
specifications. Or, the state may determine that available records are detailed enough to
provide sufficient verification through spot-checks. Ideally the state will leverage elements of
both categories to verify that the physical treatment system is operating as intended, and that
the data in their records are accurate and up-to-date.
To verify the default thermochemical and composting BMPs recommended in this report for
nitrogen reduction credits in the Phase 6 CBWM (level 1), jurisdictions can reasonably follow
the AgWG’s guidance for Non-Visual Assessment BMPs. Verification for Non-Visual
Assessment BMPs depend more on oversight and checks on records or documentation rather
than visual assessment of a physical structure. The nitrogen reductions for default BMPs
3 http://www.chesapeakebay.net/about/programs/bmp/additional_resources

Manure Treatment Technologies 129
described in this report can be verified following the AgWG’s guidance for non-visual
assessment BMPs since it is an annually reported BMP, and the most important criteria (i.e. type
of treatment system, animal manure type treated, amount of manure that was treated) should
be documented somewhere in records available to the applicable state agency. Given the close
association between manure treatment and other CBP-approved BMPs (e.g., manure transport)
the state agency can potentially verify the type and amount of manure that was treated via one
of the thermochemical or composting systems described by the panel. If the state agency finds
that even this basic information cannot be verified through its spot-checks or other annual BMP
verification procedures described in its QAPP, then the BMP cannot satisfy the definitions and
expected nitrogen reductions described in this report.
When the state agency has more detailed information available for both reporting and
verification purposes, then they may be able to report the given system under the defined (level
2) category. By providing a separate category for the higher nitrogen reductions (defined, level
2), the panel provides a framework with additional built-in elements of BMP verification. If
records available to the applicable state agency do not document the process factors described for that technology, then the given system should be reported under the corresponding default
(level 1) BMP using the more basic information that is available. By assigning lower estimated
reductions when only basic information is available, it is less likely that a reported treatment
system will not provide the estimated nitrogen reductions developed by the panel. This
reinforces the basis of BMP verification, i.e. that the reported practice is implemented and
operating as intended. With more detailed information about the process factors, verified
according to the AgWG’s guidance, the partnership can have more confidence that the given
manure treatment system is operating more effectively to remove nitrogen from the treated
manure.
Manure treatment systems reported under the data driven (Level 3) category described in
Section 10 demand more rigorous record-keeping and quality control of records to determine
their reported nitrogen reductions. As discussed in Section 10, state and/or federal programs
already exist that may require extensive data collection, sampling and reporting by the given
farm or centralized manure treatment operation as part of a permitting or regulatory
program.
For more information about the CBP Partnership’s BMP Verification Framework
The full CBP partnership BMP Verification Framework is available online (scroll down to
October 2014 Basinwide BMP Verification Framework Document):
http://www.chesapeakebay.net/about/programs/bmp/additional_resources
The current Agriculture Workgroup’s BMP Verification Guidance is included in Appendix B of
the full Framework Document. For the AgWG’s guidance only, go here:
http://www.chesapeakebay.net/documents/Appendix%20B%20-
Ag%20BMP%20Verification%20Guidance%20Final.pdf

Manure Treatment Technologies 130
APPENDICES
For convenience the appendices are provided as separate documents for duration of CBP
partnership review. They will be combined into one document with the report following
WQGIT approval.
Appendix A Technical Appendix for Scenario Builder
Appendix B Conformity with BMP Protocol
Appendix C Report from AgWG ad hoc subgroup on manure treatment technologies
Appendix D Minutes from the expert panel