Manure happens: Altering the global nitrogen cycle by feeding about seven billion carnivorous humans
43
Manure Happens: Altering the Global Nitrogen Cycle by Feeding About Seven Billion Carnivorous Humans Eric A. Davidson September 9, 2014
description
Presented by Eric A. Davidson at the Livestock Systems and Environment (LSE) Seminar, ILRI, Nairobi, 9 September 2014
Transcript of Manure happens: Altering the global nitrogen cycle by feeding about seven billion carnivorous humans
Manure Happens: Altering the Global Nitrogen Cycle by Feeding About Seven Billion Carnivorous
Humans
Eric A. DavidsonSeptember 9, 2014
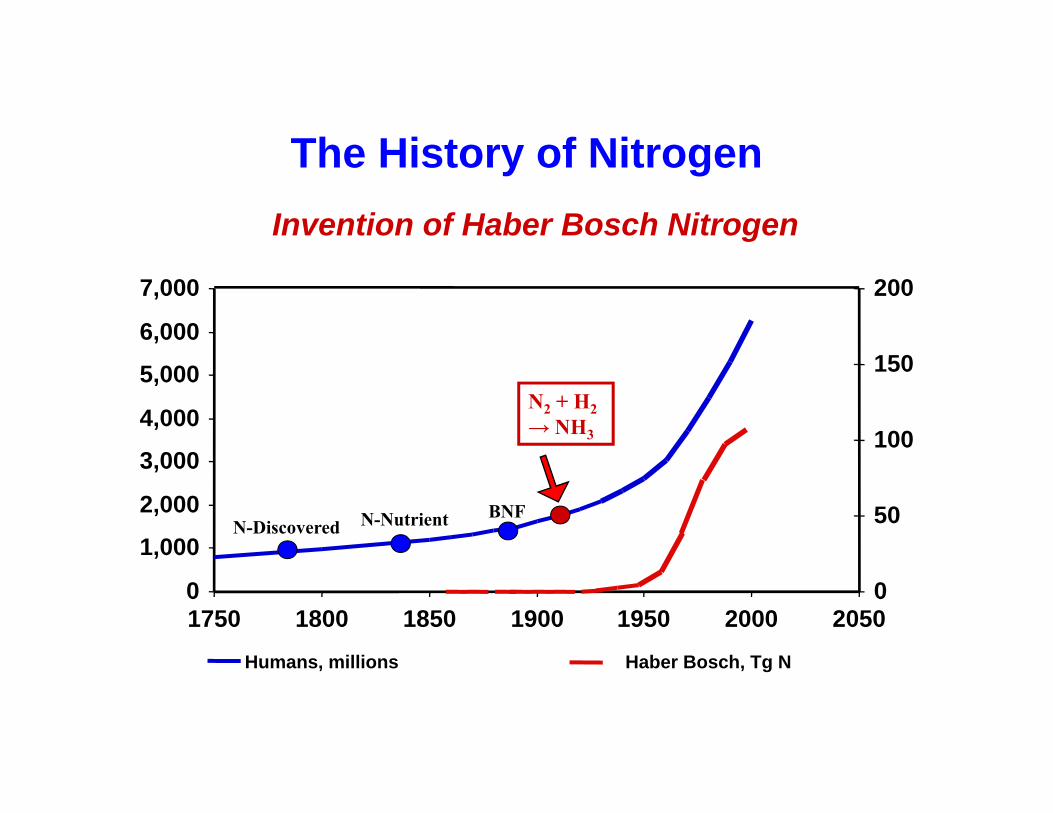
The History of Nitrogen
0
1,000
2,000
3,000
4,000
5,000
6,000
7,000
1750 1800 1850 1900 1950 2000 20500
50
100
150
200
Humans, millions Haber Bosch, Tg N
N-Discovered N-Nutrient BNF
N2 + H2→ NH3
Invention of Haber Bosch Nitrogen
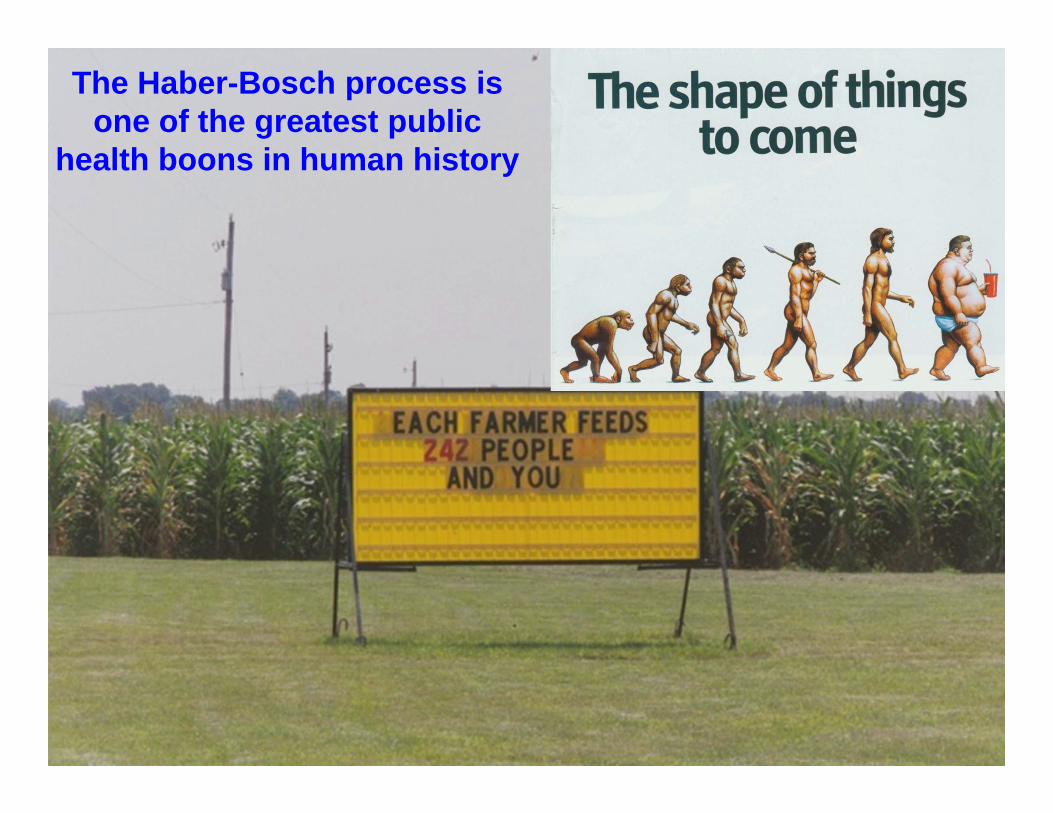
The Haber-Bosch process is one of the greatest public
health boons in human history
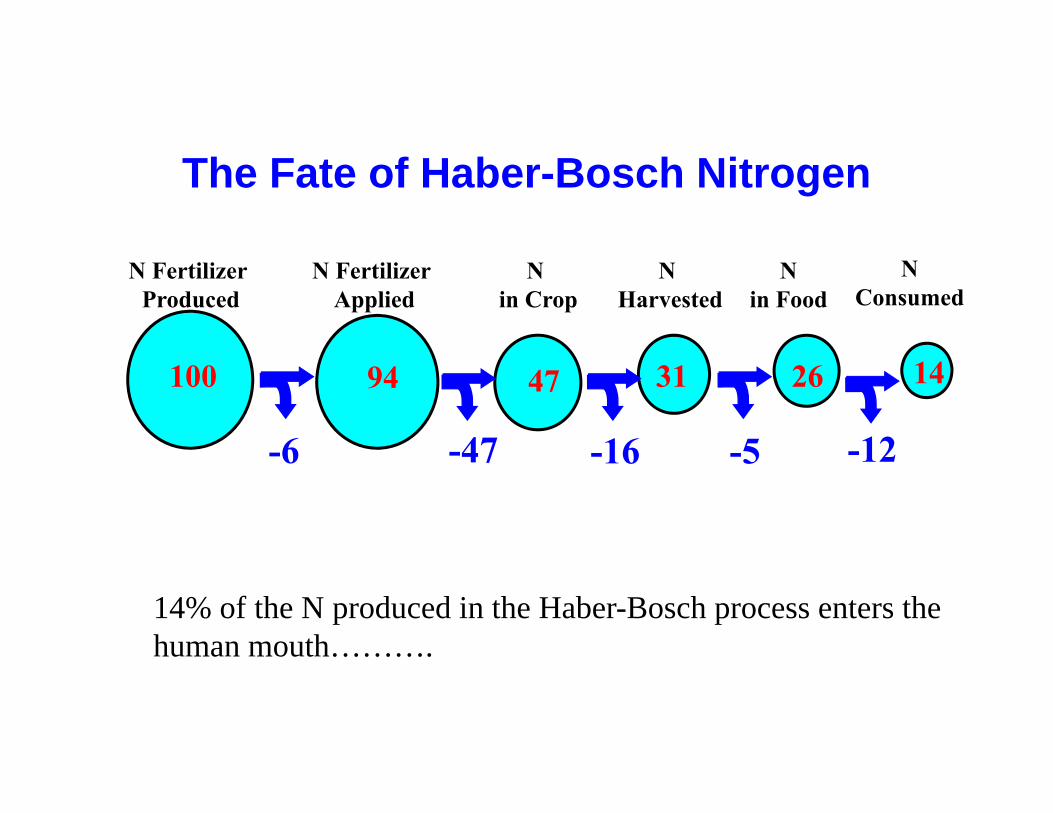
N Fertilizer Produced
N Fertilizer Applied
N in Crop
N Harvested
Nin Food
NConsumed
-6 -47 -12
100 144794 2631
-5
The Fate of Haber-Bosch Nitrogen
-16
14% of the N produced in the Haber-Bosch process enters thehuman mouth……….
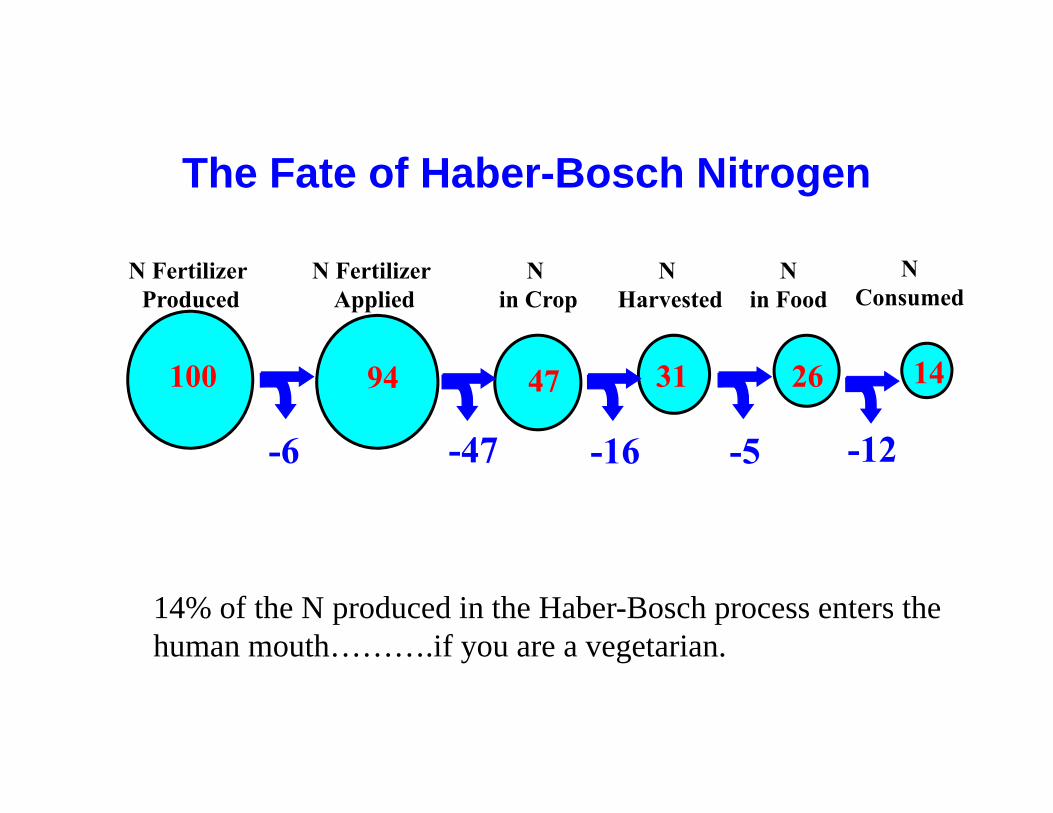
N Fertilizer Produced
N Fertilizer Applied
N in Crop
N Harvested
Nin Food
NConsumed
-6 -47 -12
100 144794 2631
-5
The Fate of Haber-Bosch Nitrogen
-16
14% of the N produced in the Haber-Bosch process enters thehuman mouth……….if you are a vegetarian.
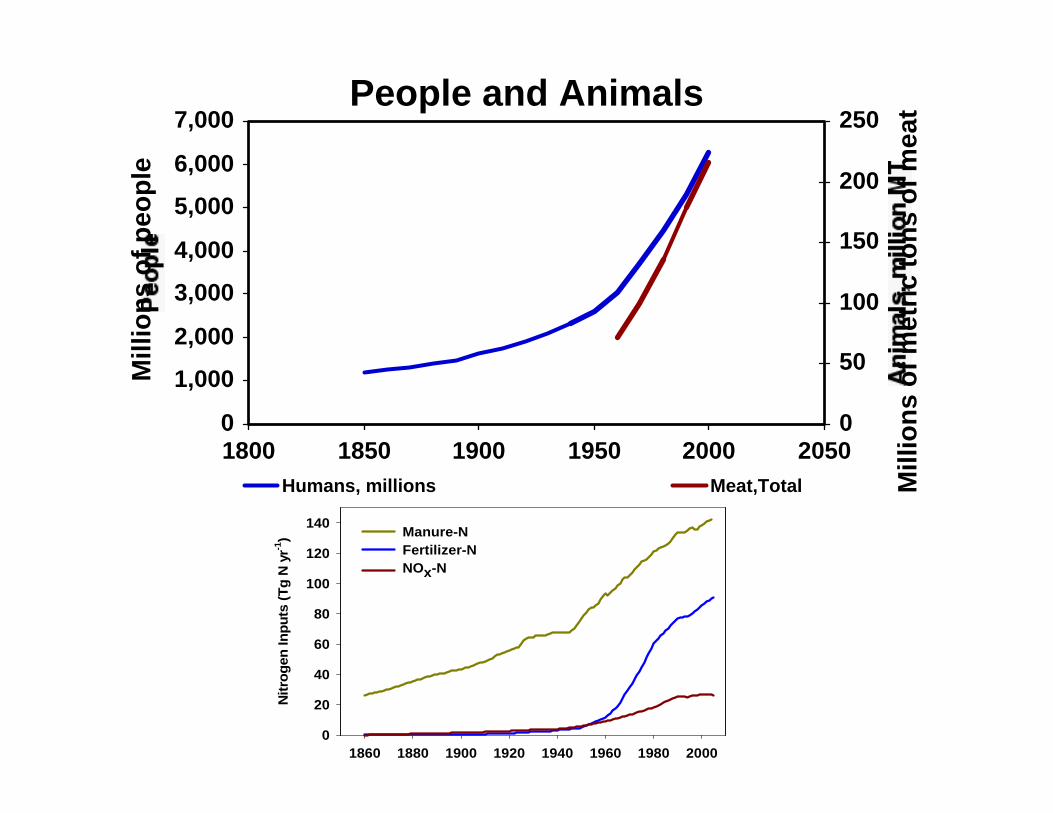
People and Animals
0
1,000
2,000
3,000
4,000
5,000
6,000
7,000
1800 1850 1900 1950 2000 20500
50
100
150
200
250
Humans, millions Meat,Total
Mill
ions
of p
eopl
e
Mill
ions
of m
etric
tons
of m
eat
1860 1880 1900 1920 1940 1960 1980 2000
Nitr
ogen
Inpu
ts (T
g N
yr-1
)
0
20
40
60
80
100
120
140 Manure-N Fertilizer-N NOx-N
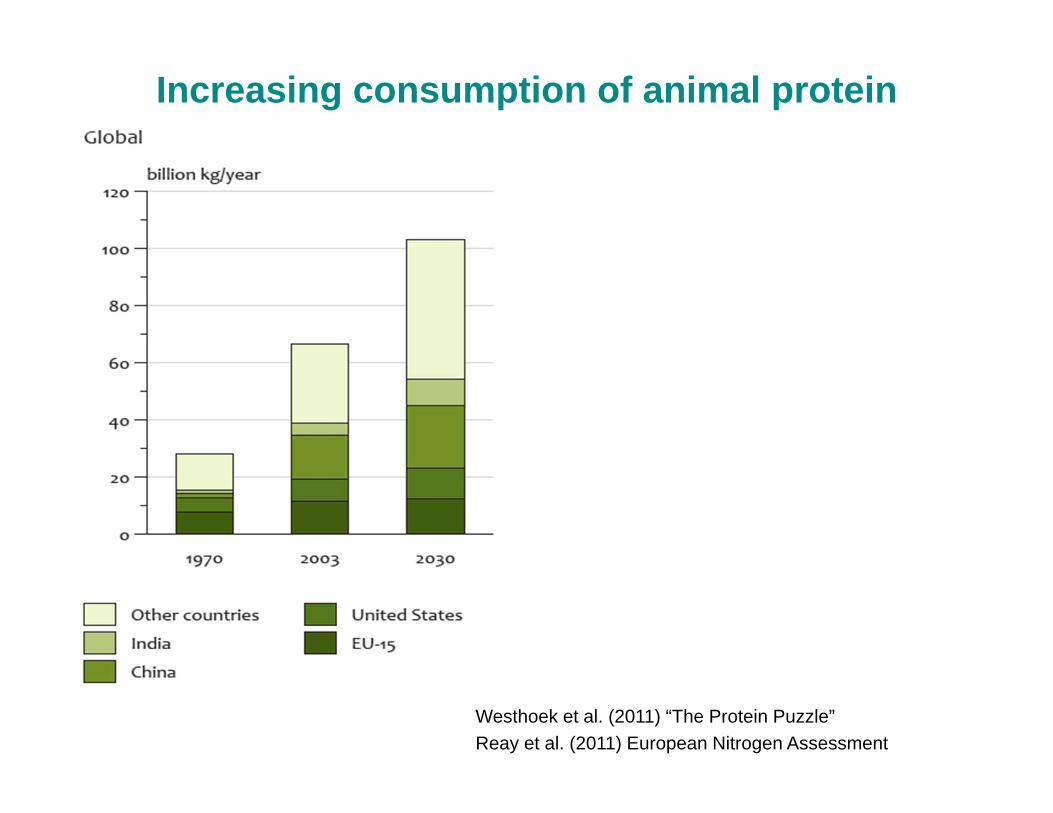
Increasing consumption of animal protein
Westhoek et al. (2011) “The Protein Puzzle”Reay et al. (2011) European Nitrogen Assessment
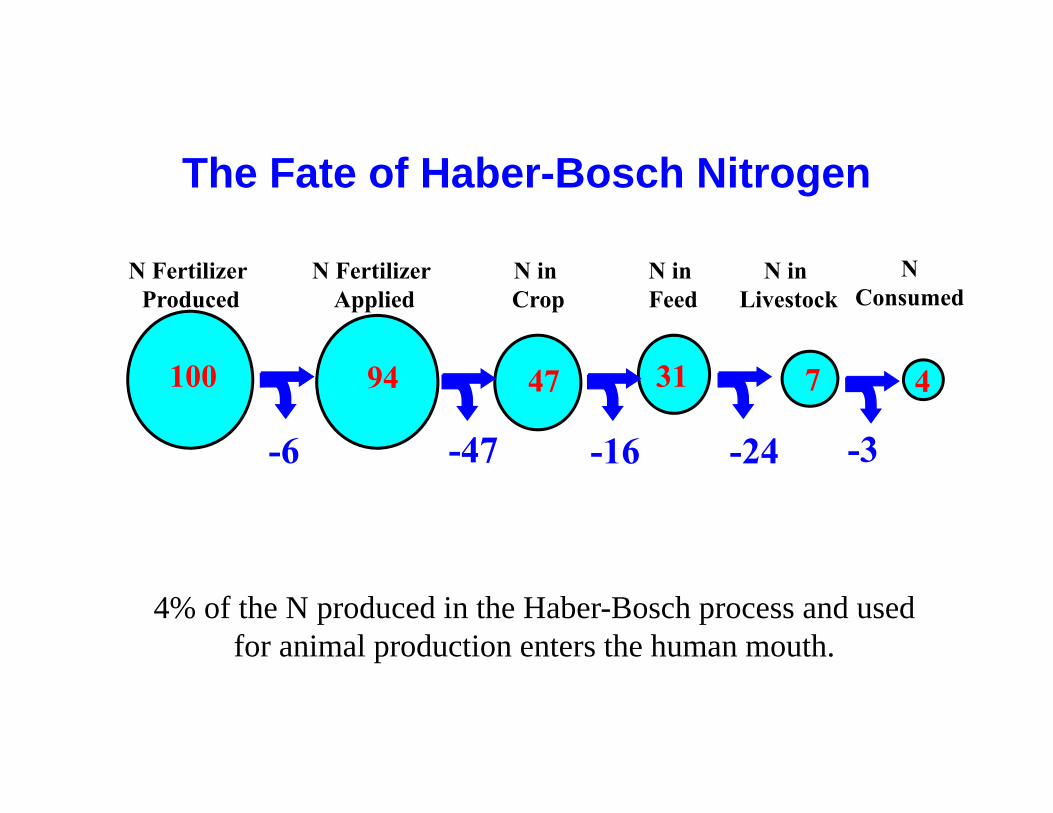
N Fertilizer Produced
N Fertilizer Applied
N in Crop
N inFeed
N in Livestock
NConsumed
-6 -47 -3
100 44794 731
-24
The Fate of Haber-Bosch Nitrogen
-16
4% of the N produced in the Haber-Bosch process and usedfor animal production enters the human mouth.
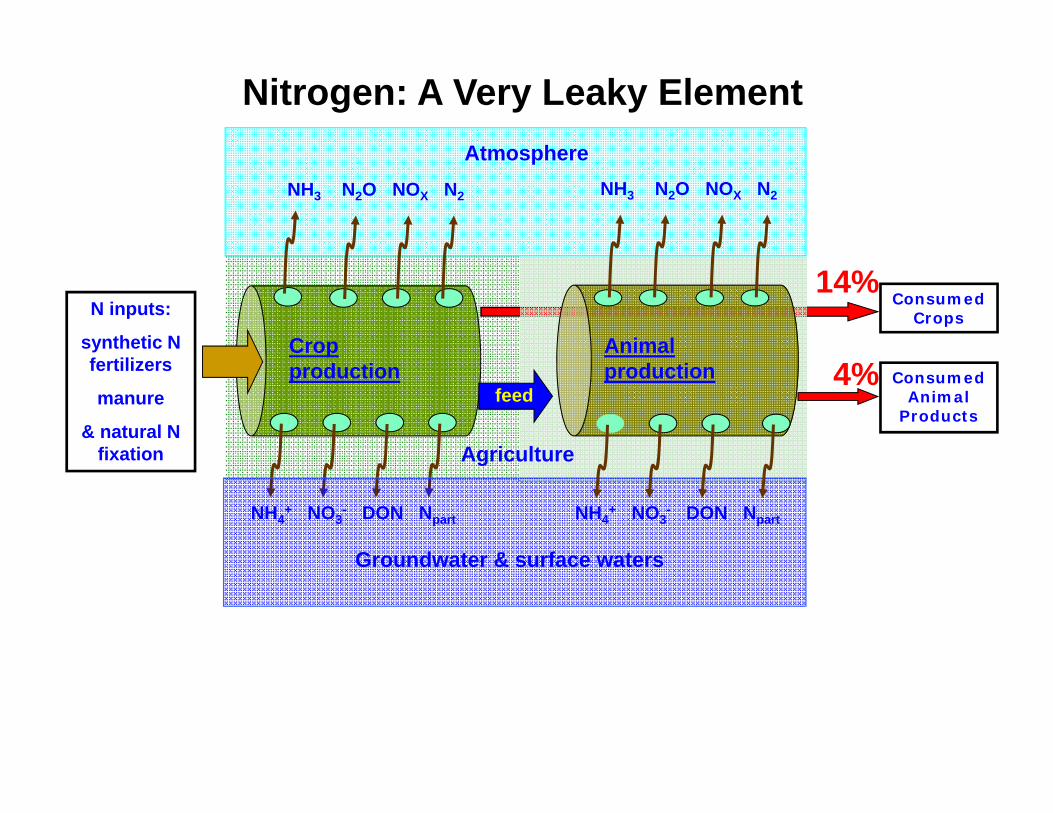
Consumed Animal
Products
N inputs:
synthetic N fertilizers
manure
& natural N fixation
Consumed Crops
Crop production
Groundwater & surface waters
NH4+ NO3
- DON Npart
NH3 N2O NOX N2
NH4+ NO3
- DON Npart
NH3 N2O NOX N2
Atmosphere
feed
Agriculture
14%
4%Animal production
Nitrogen: A Very Leaky Element
Energy12%
Food51%
Fiber2%
Industrial products35%
N in Products
Natural19%
Intentional67%
Unintentional14%
Total N Fixation
Vehicles63%
Utility and Industry35%
Other2%
Unintentional N Fixation
H‐B Fertilizer46%
H‐B Industry25%
C‐BNF29%
Intentional N Fixation
Lightning2%
BNF98%
Natural N Fixation
6.5 Tg N 4.8 Tg N
24.7 Tg N
23.3 Tg N13.7 Tg N
N2O3%
NOx20%
NH313%
Hydrologic N21%
N lost to the Environment
Unknown20 – 40%
N2
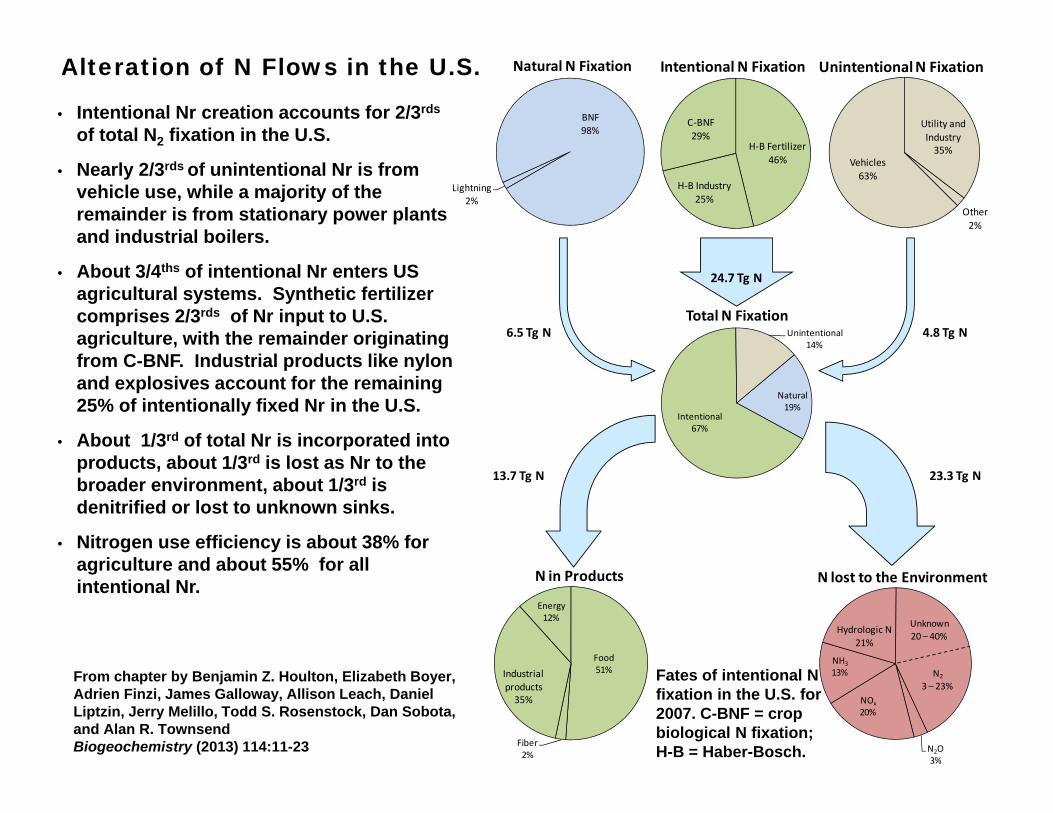
3 – 23%Fates of intentional N fixation in the U.S. for 2007. C-BNF = crop biological N fixation; H-B = Haber-Bosch.
Alteration of N Flows in the U.S.
• Intentional Nr creation accounts for 2/3rds
of total N2 fixation in the U.S.
• Nearly 2/3rds of unintentional Nr is from vehicle use, while a majority of the remainder is from stationary power plants and industrial boilers.
• About 3/4ths of intentional Nr enters US agricultural systems. Synthetic fertilizer comprises 2/3rds of Nr input to U.S. agriculture, with the remainder originating from C-BNF. Industrial products like nylon and explosives account for the remaining 25% of intentionally fixed Nr in the U.S.
• About 1/3rd of total Nr is incorporated into products, about 1/3rd is lost as Nr to the broader environment, about 1/3rd is denitrified or lost to unknown sinks.
• Nitrogen use efficiency is about 38% for agriculture and about 55% for all intentional Nr.
From chapter by Benjamin Z. Houlton, Elizabeth Boyer, Adrien Finzi, James Galloway, Allison Leach, Daniel Liptzin, Jerry Melillo, Todd S. Rosenstock, Dan Sobota, and Alan R. TownsendBiogeochemistry (2013) 114:11-23
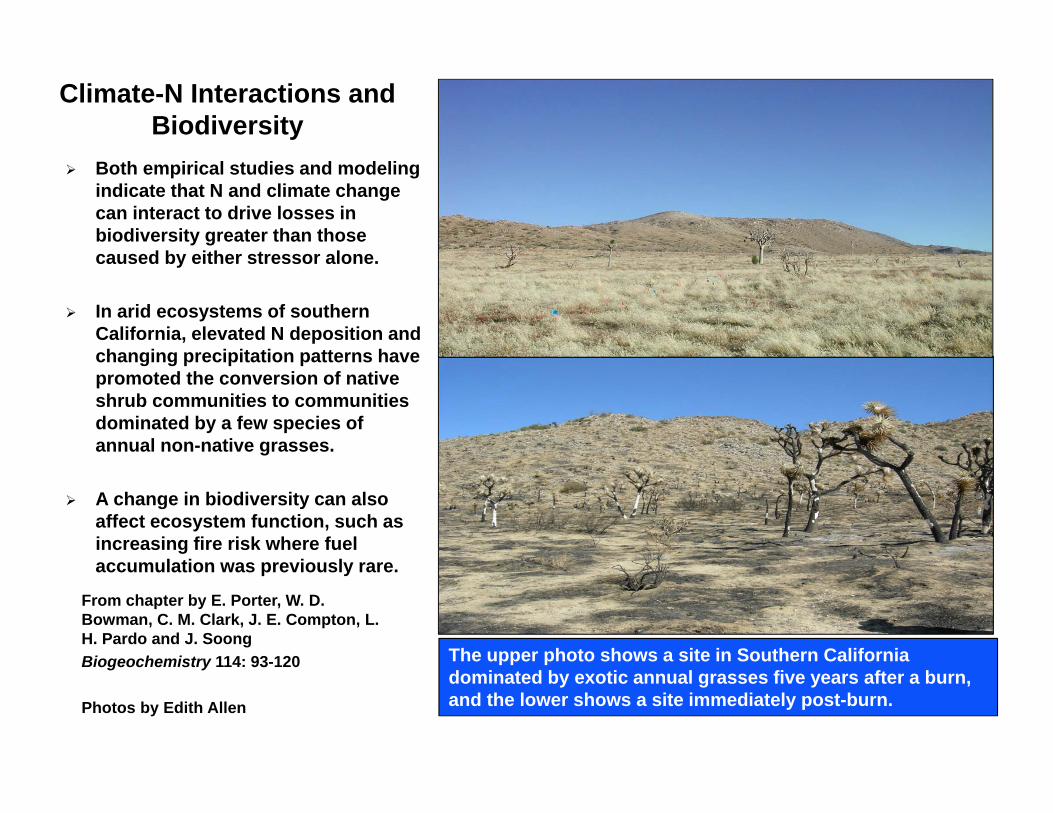
The upper photo shows a site in Southern California dominated by exotic annual grasses five years after a burn, and the lower shows a site immediately post-burn.
Both empirical studies and modeling indicate that N and climate change can interact to drive losses in biodiversity greater than those caused by either stressor alone.
In arid ecosystems of southern California, elevated N deposition and changing precipitation patterns have promoted the conversion of native shrub communities to communities dominated by a few species of annual non-native grasses.
A change in biodiversity can also affect ecosystem function, such as increasing fire risk where fuel accumulation was previously rare.
Climate-N Interactions and Biodiversity
From chapter by E. Porter, W. D. Bowman, C. M. Clark, J. E. Compton, L. H. Pardo and J. SoongBiogeochemistry 114: 93-120
Photos by Edith Allen
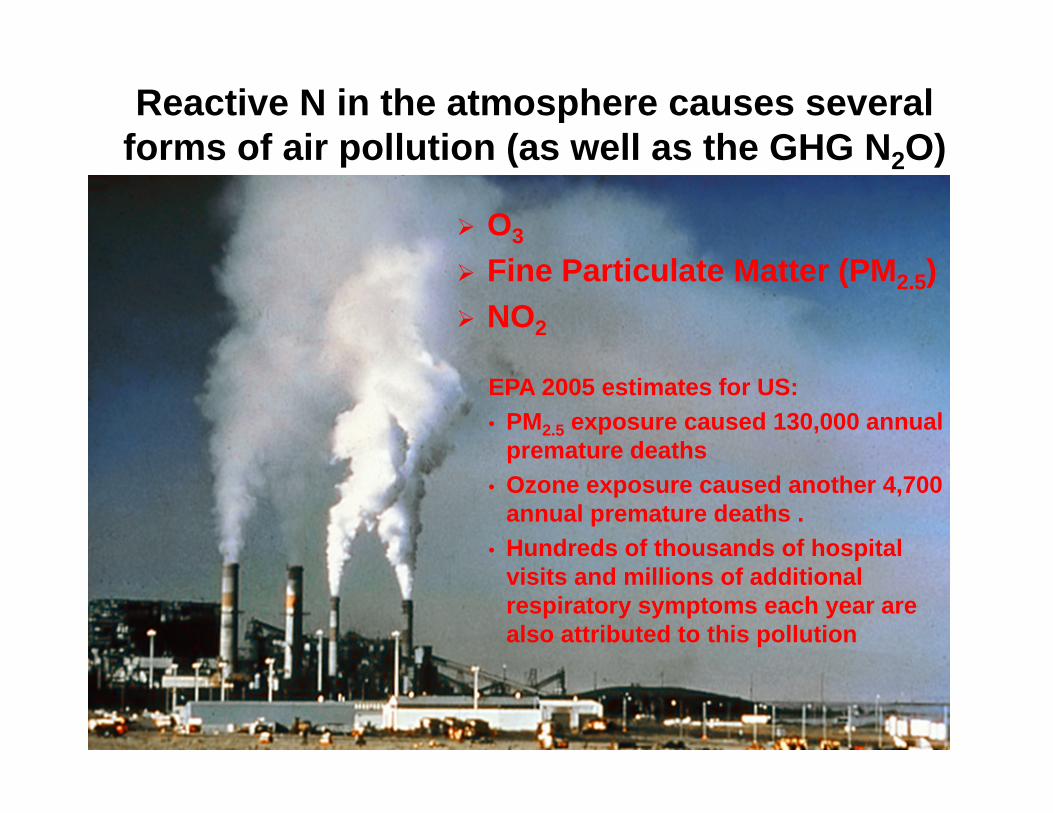
Reactive N in the atmosphere causes several forms of air pollution (as well as the GHG N2O)
O3
Fine Particulate Matter (PM2.5) NO2
EPA 2005 estimates for US:• PM2.5 exposure caused 130,000 annual
premature deaths • Ozone exposure caused another 4,700
annual premature deaths . • Hundreds of thousands of hospital
visits and millions of additional respiratory symptoms each year are also attributed to this pollution
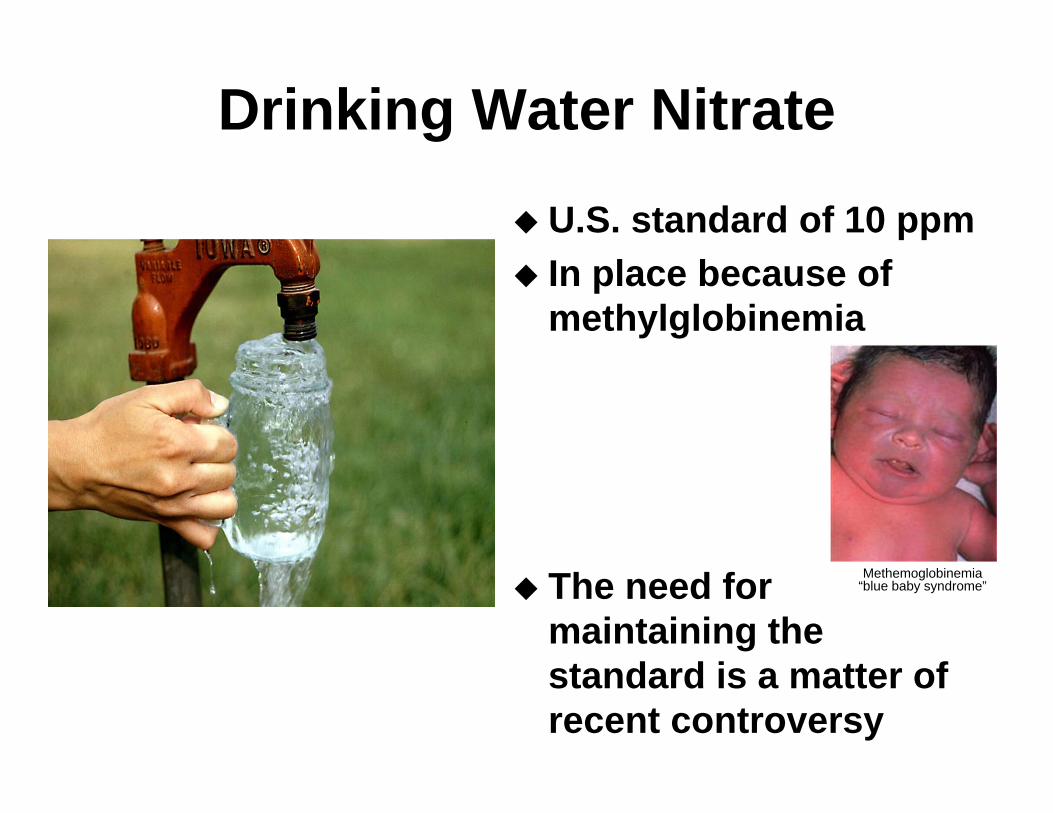
Drinking Water Nitrate
U.S. standard of 10 ppm In place because of
methylglobinemia
The need for maintaining the standard is a matter of recent controversy
Methemoglobinemia“blue baby syndrome”
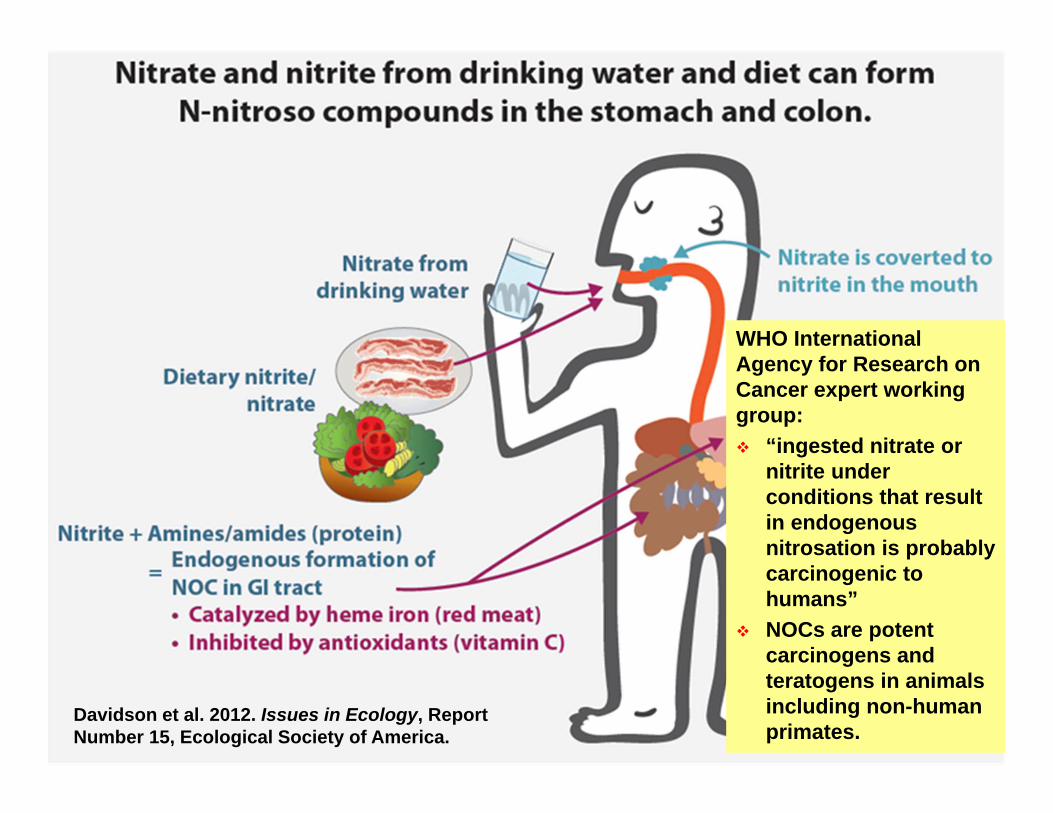
Davidson et al. 2012. Issues in Ecology, Report Number 15, Ecological Society of America.
WHO International Agency for Research on Cancer expert working group: “ingested nitrate or
nitrite under conditions that result in endogenous nitrosation is probably carcinogenic to humans”
NOCs are potent carcinogens and teratogens in animals including non-human primates.
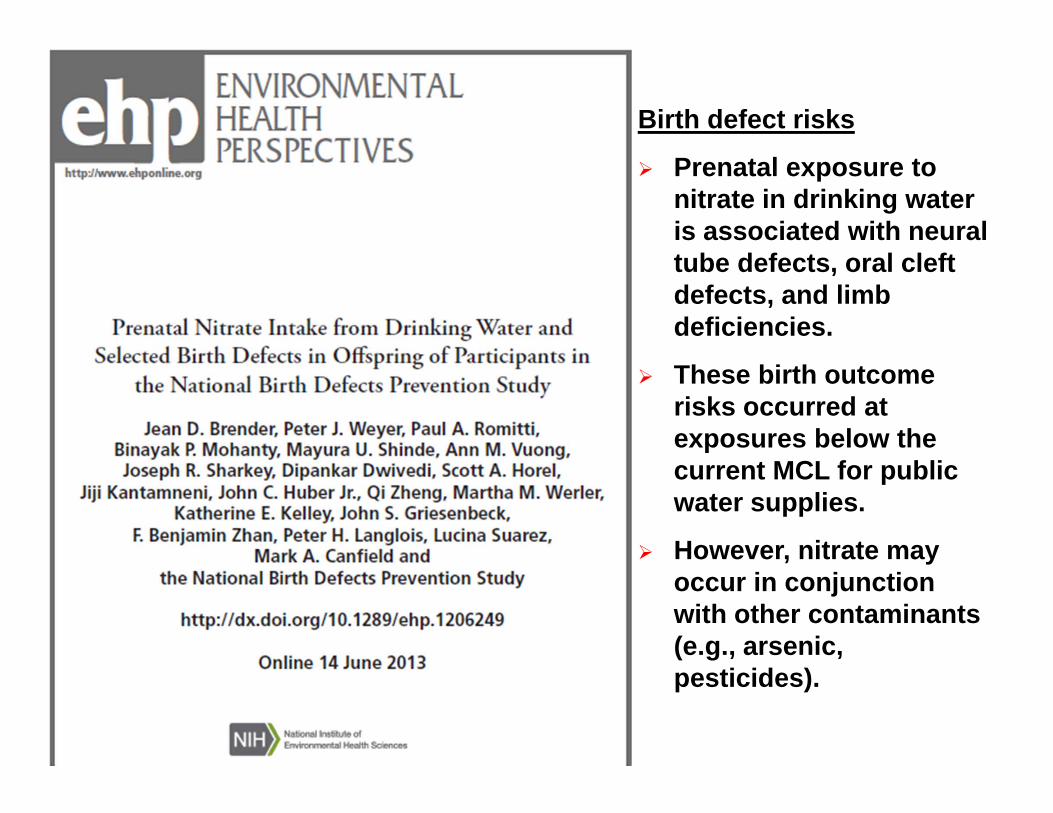
Birth defect risks
Prenatal exposure to nitrate in drinking water is associated with neural tube defects, oral cleft defects, and limb deficiencies.
These birth outcome risks occurred at exposures below the current MCL for public water supplies.
However, nitrate may occur in conjunction with other contaminants (e.g., arsenic, pesticides).
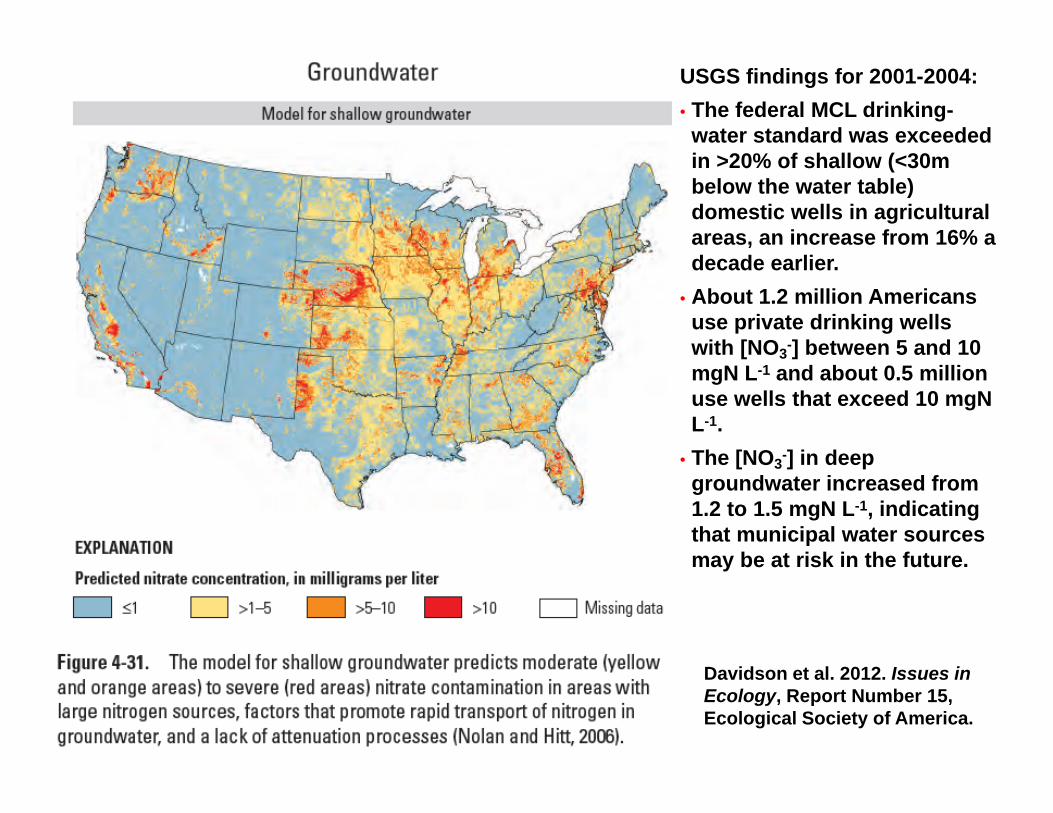
USGS findings for 2001-2004:• The federal MCL drinking-water standard was exceeded in >20% of shallow (<30m below the water table) domestic wells in agricultural areas, an increase from 16% a decade earlier.
• About 1.2 million Americans use private drinking wells with [NO3-] between 5 and 10 mgN L-1 and about 0.5 million use wells that exceed 10 mgNL-1.
• The [NO3-] in deep groundwater increased from 1.2 to 1.5 mgN L-1, indicating that municipal water sources may be at risk in the future.
Davidson et al. 2012. Issues in Ecology, Report Number 15, Ecological Society of America.
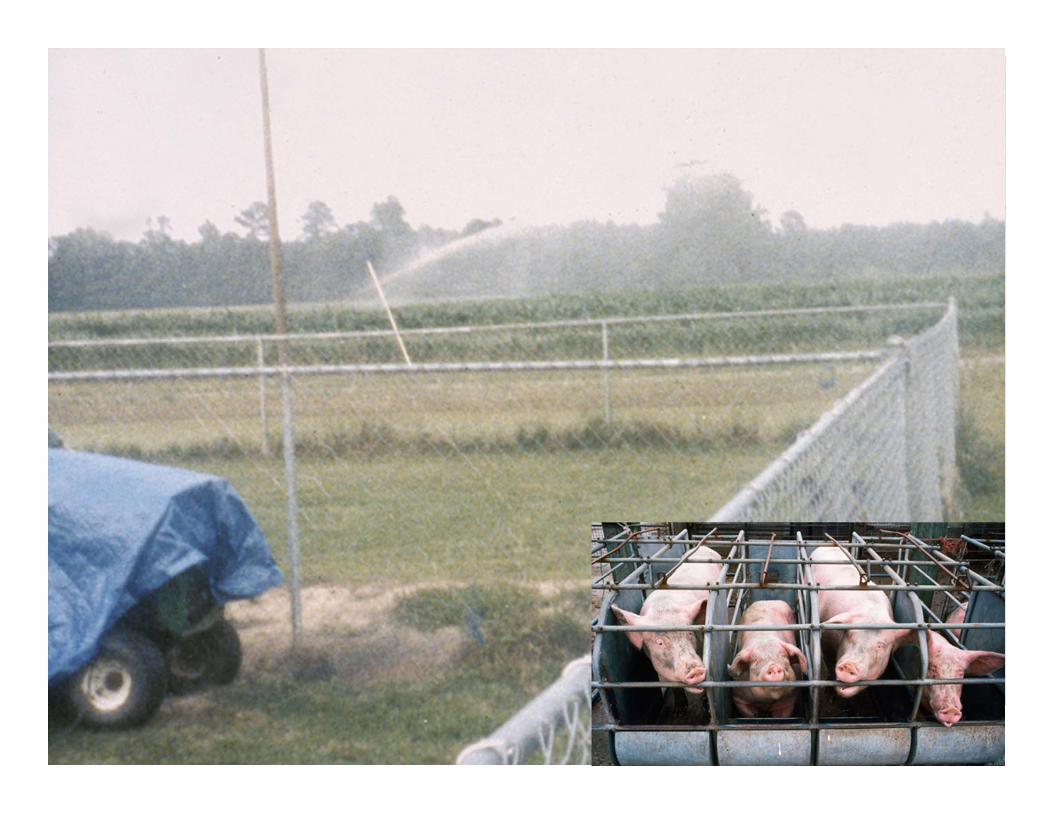
Hog production
NH3 emissions
Costaleutrophication
Grain production
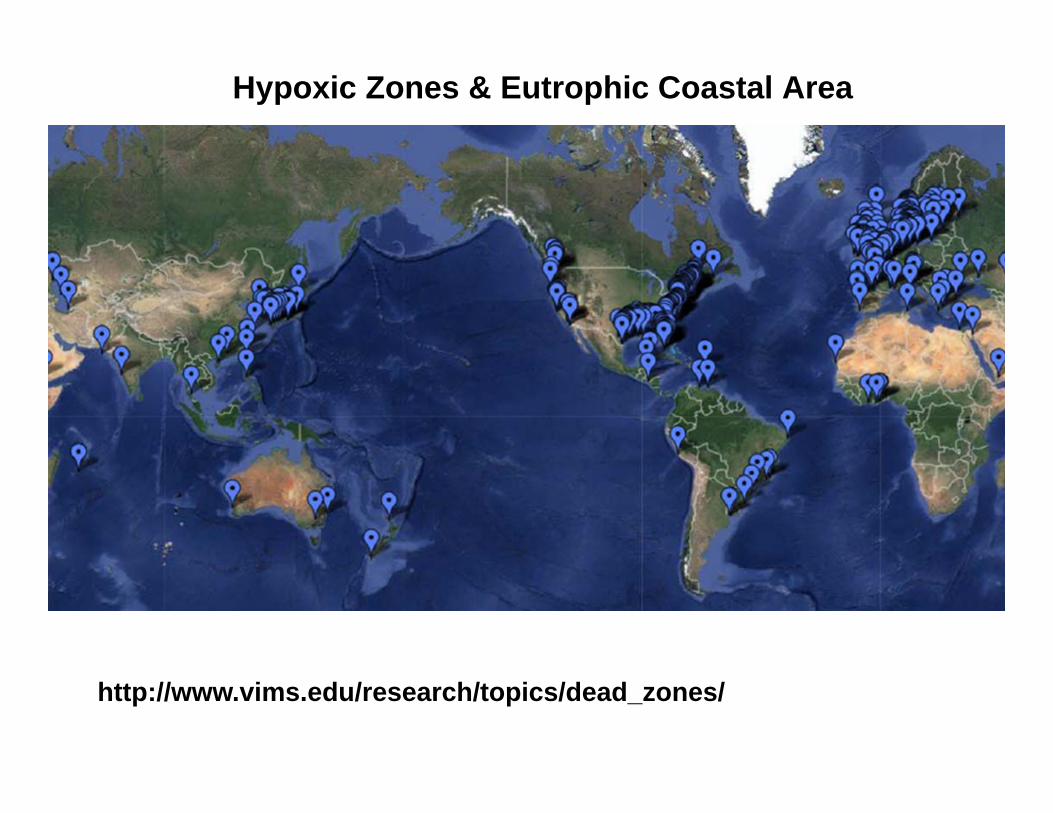
Hypoxic Zones & Eutrophic Coastal Area
http://www.vims.edu/research/topics/dead_zones/

An American family with food for one weekA German family with food for one week A Somalian family with food for one week
Hungary Planet: What the World EatsFaith D'Aluisio and Peter Menzel, Random House, 2005
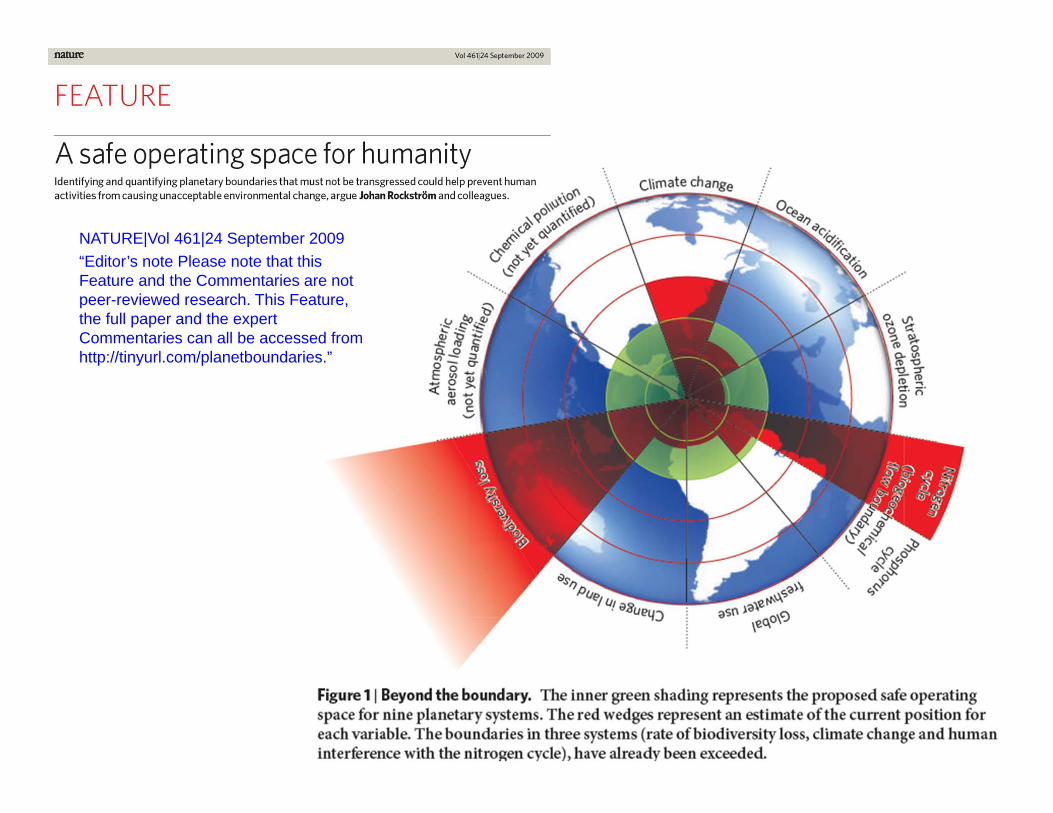
NATURE|Vol 461|24 September 2009“Editor’s note Please note that this Feature and the Commentaries are not peer-reviewed research. This Feature, the full paper and the expert Commentaries can all be accessed from http://tinyurl.com/planetboundaries.”
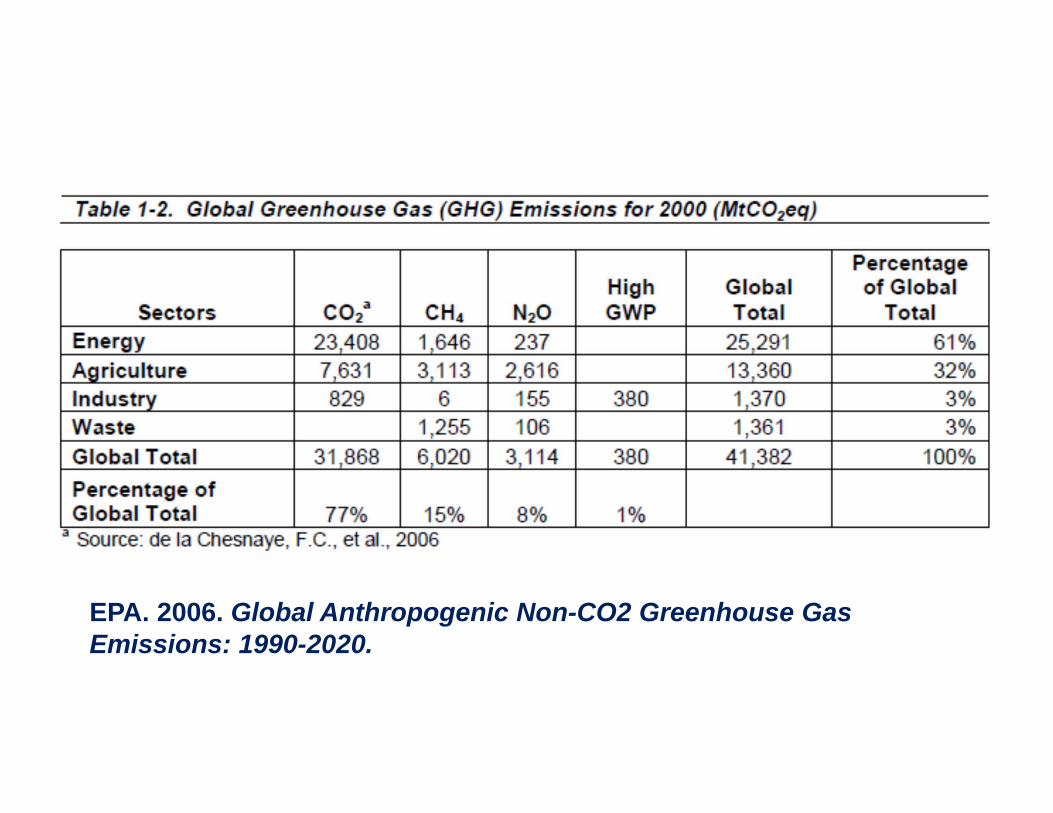
EPA. 2006. Global Anthropogenic Non-CO2 Greenhouse Gas Emissions: 1990-2020.
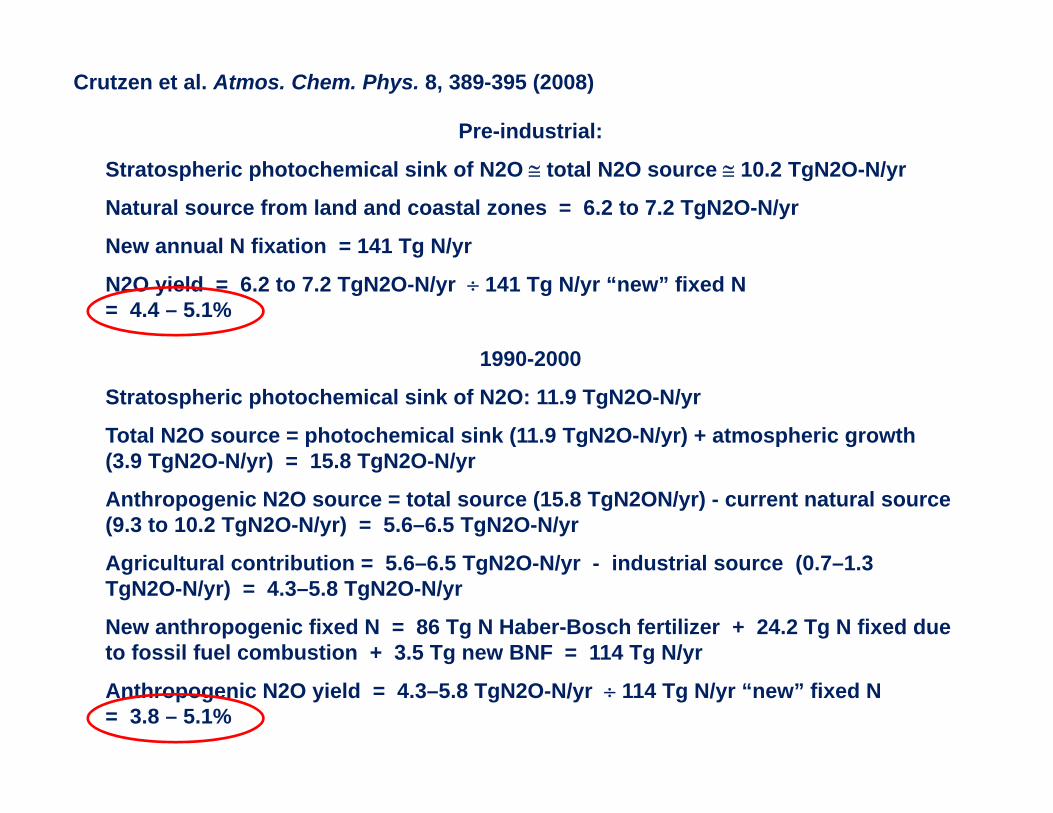
1990-2000
Stratospheric photochemical sink of N2O: 11.9 TgN2O-N/yr
Total N2O source = photochemical sink (11.9 TgN2O-N/yr) + atmospheric growth (3.9 TgN2O-N/yr) = 15.8 TgN2O-N/yr
Anthropogenic N2O source = total source (15.8 TgN2ON/yr) - current natural source (9.3 to 10.2 TgN2O-N/yr) = 5.6–6.5 TgN2O-N/yr
Agricultural contribution = 5.6–6.5 TgN2O-N/yr - industrial source (0.7–1.3 TgN2O-N/yr) = 4.3–5.8 TgN2O-N/yr
New anthropogenic fixed N = 86 Tg N Haber-Bosch fertilizer + 24.2 Tg N fixed due to fossil fuel combustion + 3.5 Tg new BNF = 114 Tg N/yr
Anthropogenic N2O yield = 4.3–5.8 TgN2O-N/yr 114 Tg N/yr “new” fixed N = 3.8 – 5.1%
Pre-industrial:
Stratospheric photochemical sink of N2O total N2O source 10.2 TgN2O-N/yr
Natural source from land and coastal zones = 6.2 to 7.2 TgN2O-N/yr
New annual N fixation = 141 Tg N/yr
N2O yield = 6.2 to 7.2 TgN2O-N/yr 141 Tg N/yr “new” fixed N = 4.4 – 5.1%
Crutzen et al. Atmos. Chem. Phys. 8, 389-395 (2008)
270
280
290
300
310
320
1860 1880 1900 1920 1940 1960 1980 2000
Atm
osph
eric
N2O
(ppb
)Observed
Crutzen model
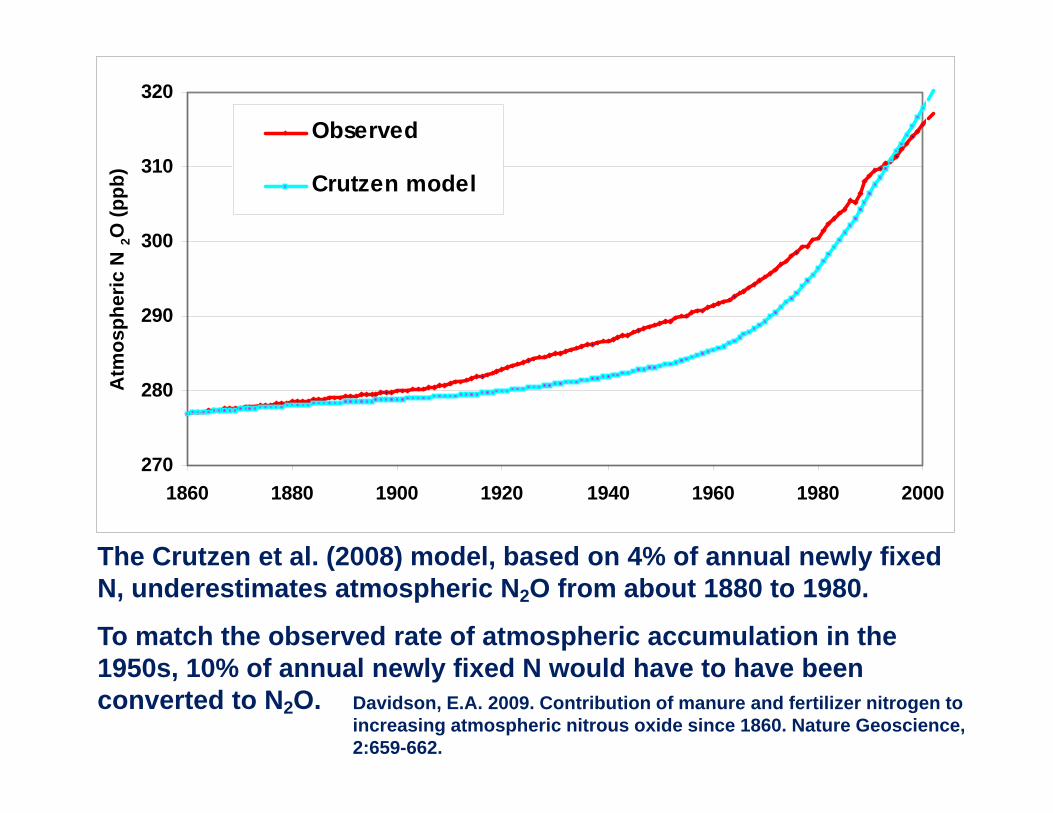
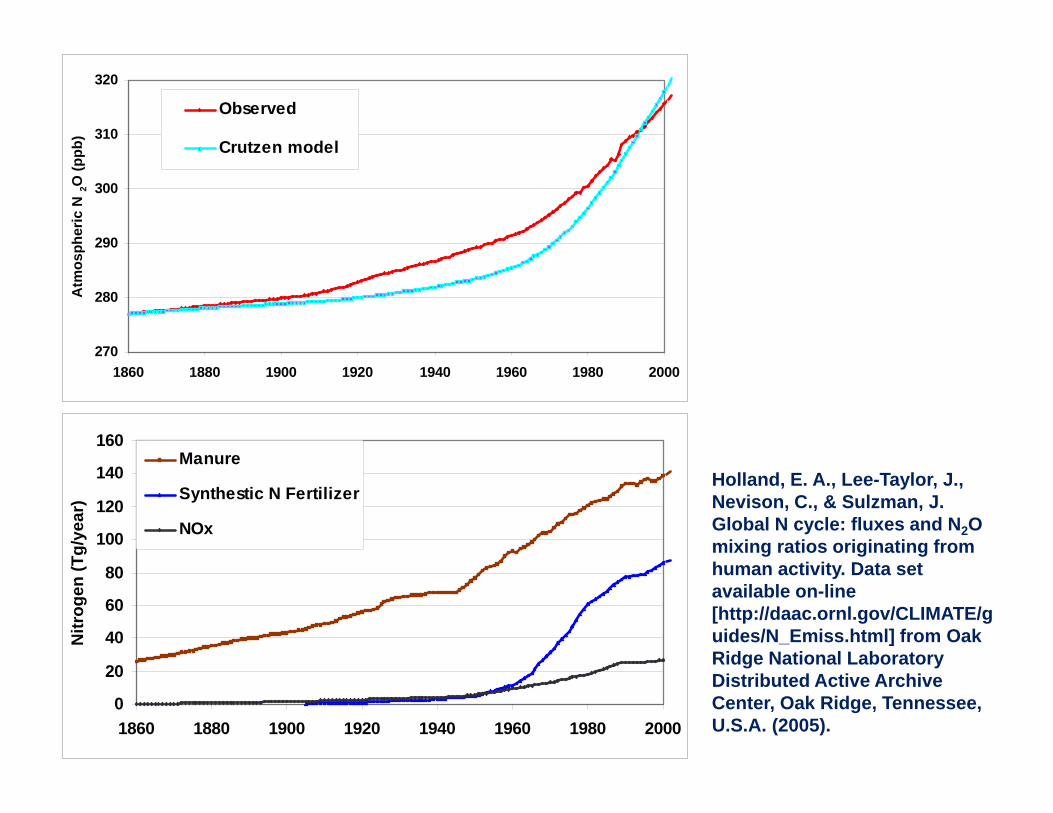
The Crutzen et al. (2008) model, based on 4% of annual newly fixed N, underestimates atmospheric N2O from about 1880 to 1980.
To match the observed rate of atmospheric accumulation in the 1950s, 10% of annual newly fixed N would have to have been converted to N2O. Davidson, E.A. 2009. Contribution of manure and fertilizer nitrogen to
increasing atmospheric nitrous oxide since 1860. Nature Geoscience, 2:659-662.
270
280
290
300
310
320
1860 1880 1900 1920 1940 1960 1980 2000
Atm
osph
eric
N2O
(ppb
)
Observed
Crutzen model
0
20
40
60
80
100
120
140
160
1860 1880 1900 1920 1940 1960 1980 2000
Nitr
ogen
(Tg/
year
)
Manure
Synthestic N Fertilizer
NOx
Holland, E. A., Lee-Taylor, J., Nevison, C., & Sulzman, J. Global N cycle: fluxes and N2O mixing ratios originating from human activity. Data set available on-line [http://daac.ornl.gov/CLIMATE/guides/N_Emiss.html] from Oak Ridge National Laboratory Distributed Active Archive Center, Oak Ridge, Tennessee, U.S.A. (2005).
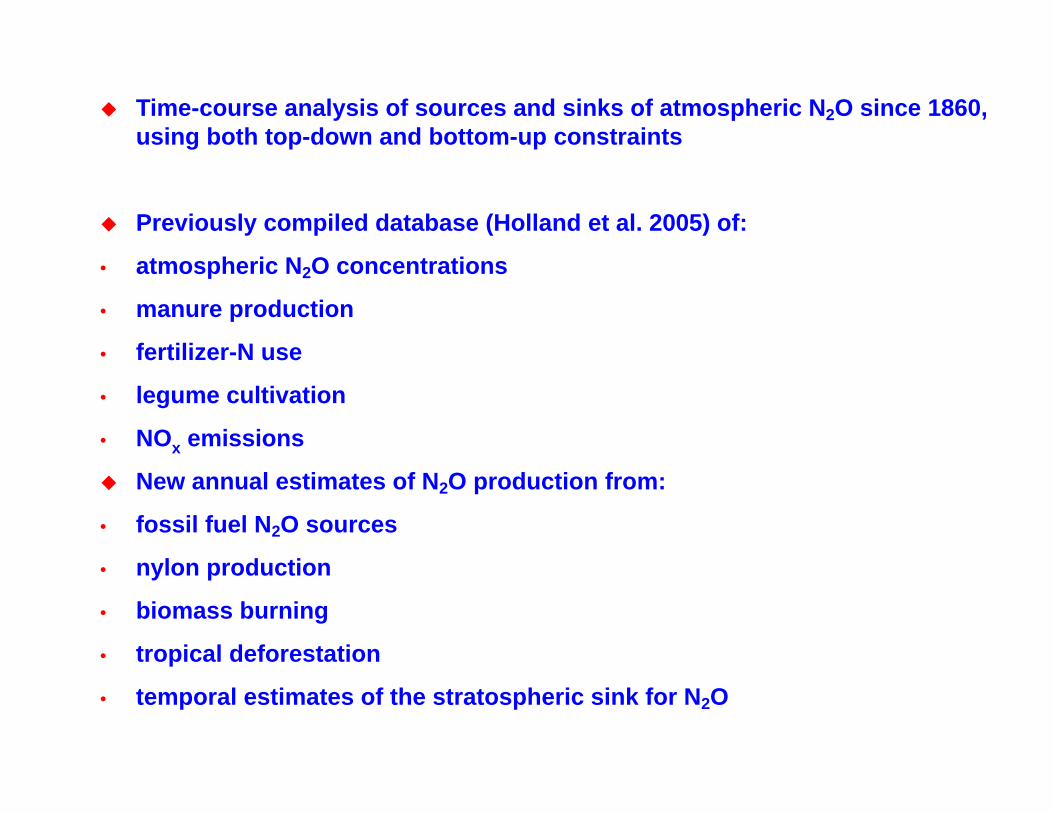
Time-course analysis of sources and sinks of atmospheric N2O since 1860, using both top-down and bottom-up constraints
Previously compiled database (Holland et al. 2005) of:
• atmospheric N2O concentrations
• manure production
• fertilizer-N use
• legume cultivation
• NOx emissions
New annual estimates of N2O production from:
• fossil fuel N2O sources
• nylon production
• biomass burning
• tropical deforestation
• temporal estimates of the stratospheric sink for N2O
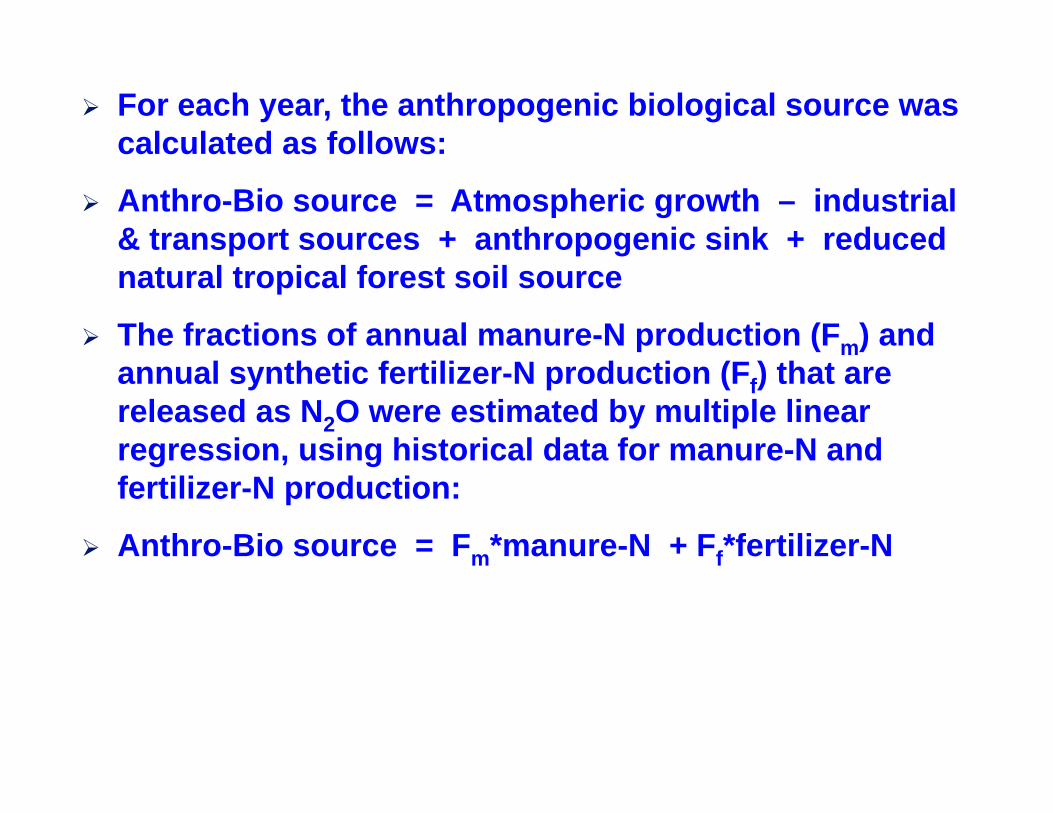
For each year, the anthropogenic biological source was calculated as follows:
Anthro-Bio source = Atmospheric growth – industrial & transport sources + anthropogenic sink + reduced natural tropical forest soil source
The fractions of annual manure-N production (Fm) and annual synthetic fertilizer-N production (Ff) that are released as N2O were estimated by multiple linear regression, using historical data for manure-N and fertilizer-N production:
Anthro-Bio source = Fm*manure-N + Ff*fertilizer-N
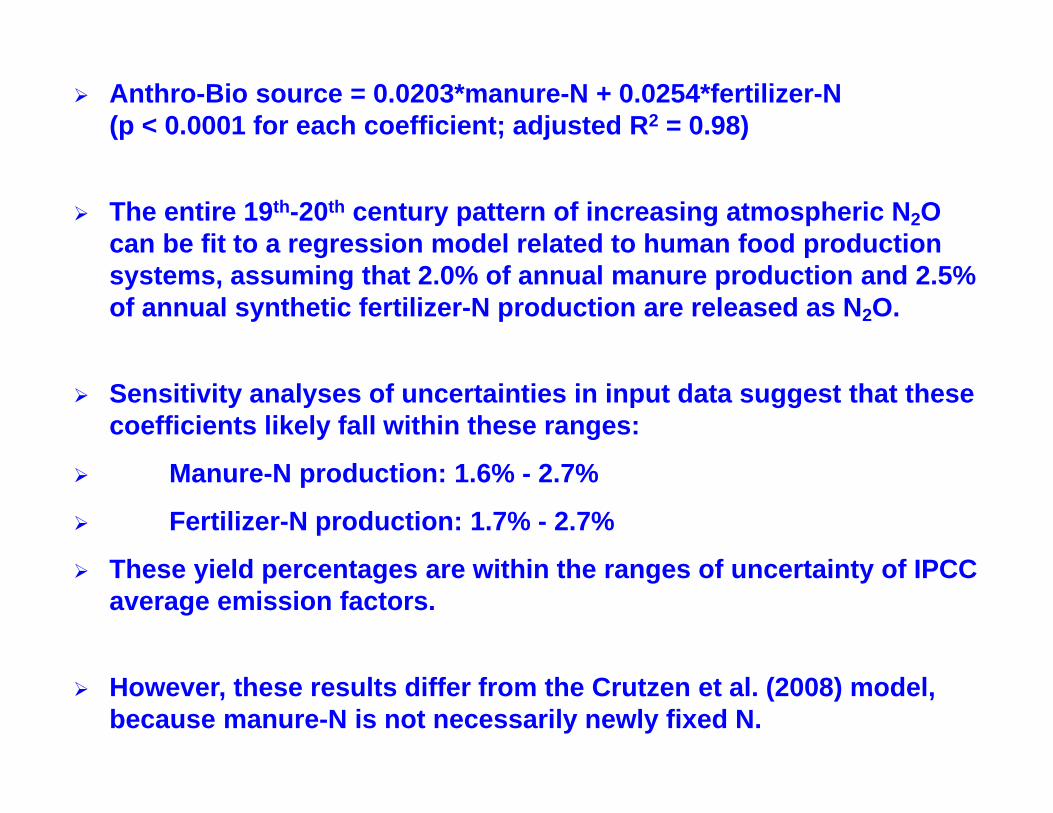
Anthro-Bio source = 0.0203*manure-N + 0.0254*fertilizer-N (p < 0.0001 for each coefficient; adjusted R2 = 0.98)
The entire 19th-20th century pattern of increasing atmospheric N2O can be fit to a regression model related to human food production systems, assuming that 2.0% of annual manure production and 2.5% of annual synthetic fertilizer-N production are released as N2O.
Sensitivity analyses of uncertainties in input data suggest that these coefficients likely fall within these ranges:
Manure-N production: 1.6% - 2.7%
Fertilizer-N production: 1.7% - 2.7%
These yield percentages are within the ranges of uncertainty of IPCC average emission factors.
However, these results differ from the Crutzen et al. (2008) model, because manure-N is not necessarily newly fixed N.
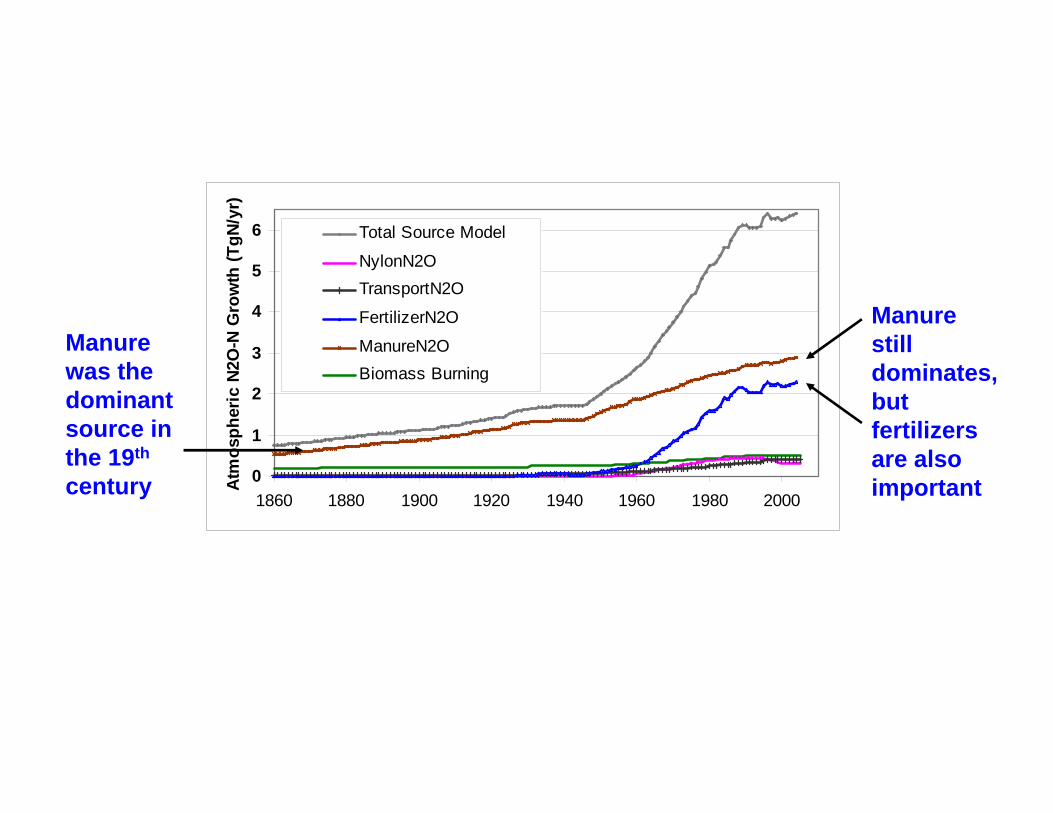
Manure was the dominant source in the 19th
century 0
1
2
3
4
5
6
1860 1880 1900 1920 1940 1960 1980 2000
Atm
osph
eric
N2O
-N G
row
th (T
gN/y
r)Total Source Model
NylonN2OTransportN2O
FertilizerN2O
ManureN2OBiomass Burning
Manure still dominates, but fertilizers are also important
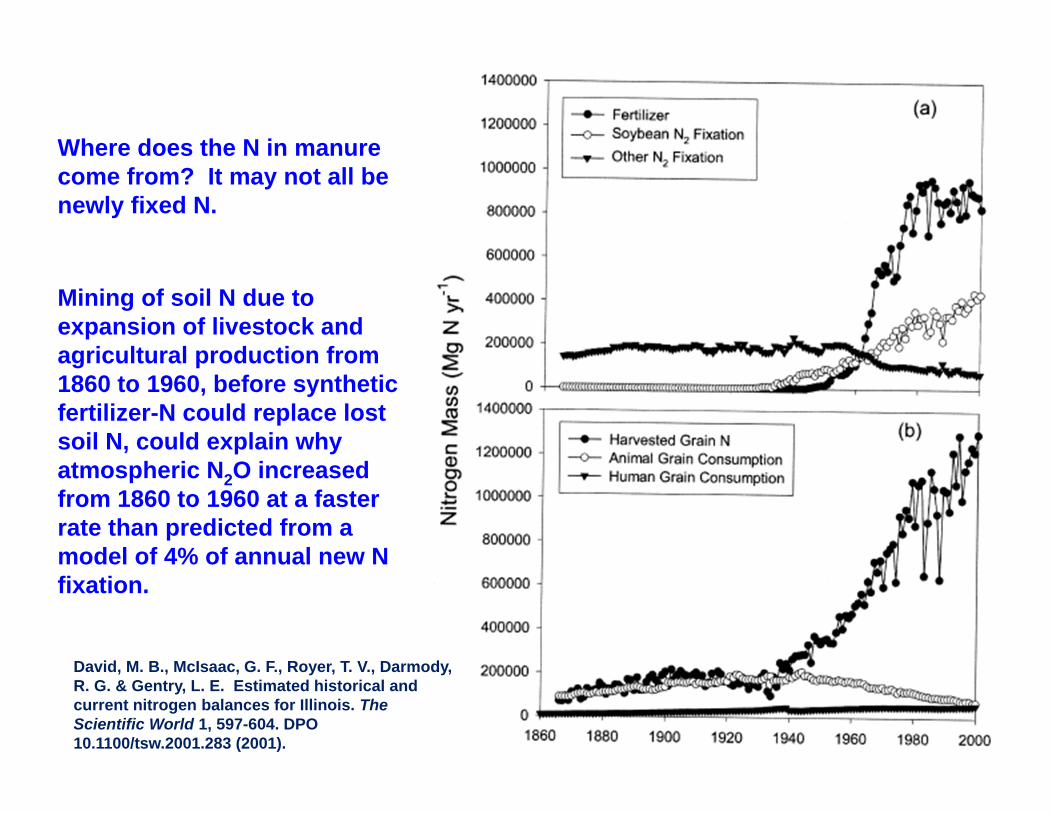
Where does the N in manure come from? It may not all be newly fixed N.
Mining of soil N due to expansion of livestock and agricultural production from 1860 to 1960, before synthetic fertilizer-N could replace lost soil N, could explain why atmospheric N2O increased from 1860 to 1960 at a faster rate than predicted from a model of 4% of annual new N fixation.
David, M. B., McIsaac, G. F., Royer, T. V., Darmody, R. G. & Gentry, L. E. Estimated historical and current nitrogen balances for Illinois. The Scientific World 1, 597-604. DPO10.1100/tsw.2001.283 (2001).
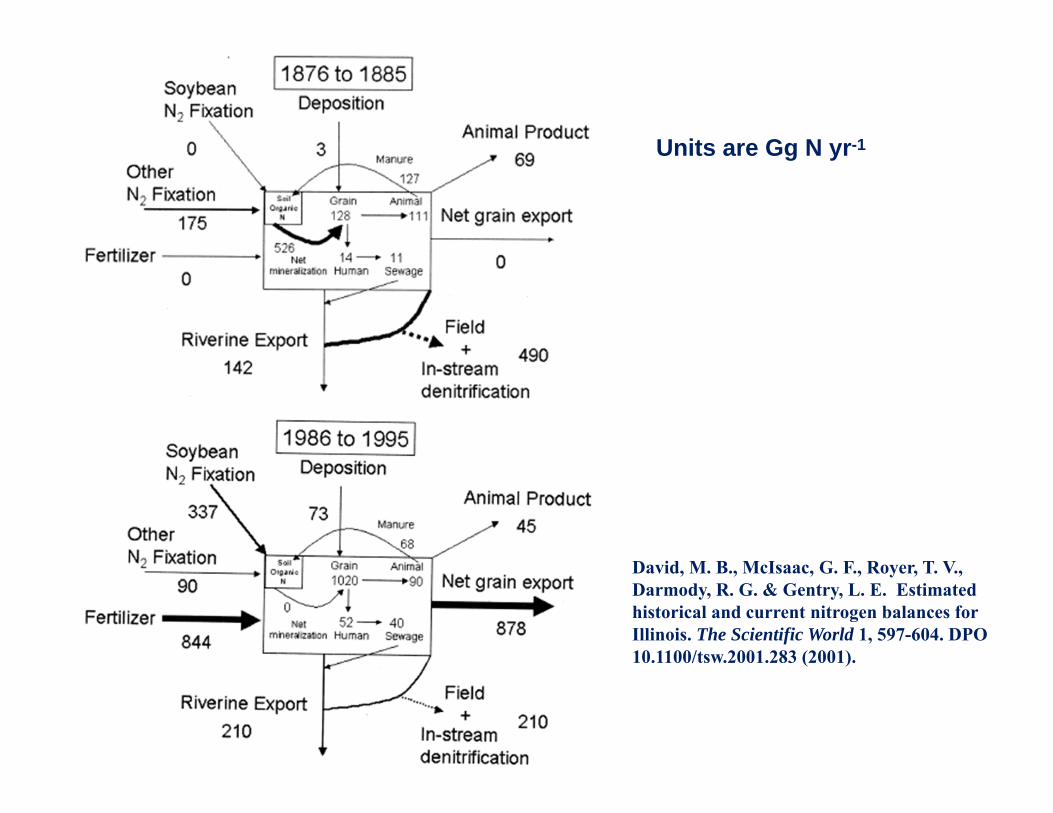
David, M. B., McIsaac, G. F., Royer, T. V., Darmody, R. G. & Gentry, L. E. Estimated historical and current nitrogen balances for Illinois. The Scientific World 1, 597-604. DPO10.1100/tsw.2001.283 (2001).
Units are Gg N yr-1
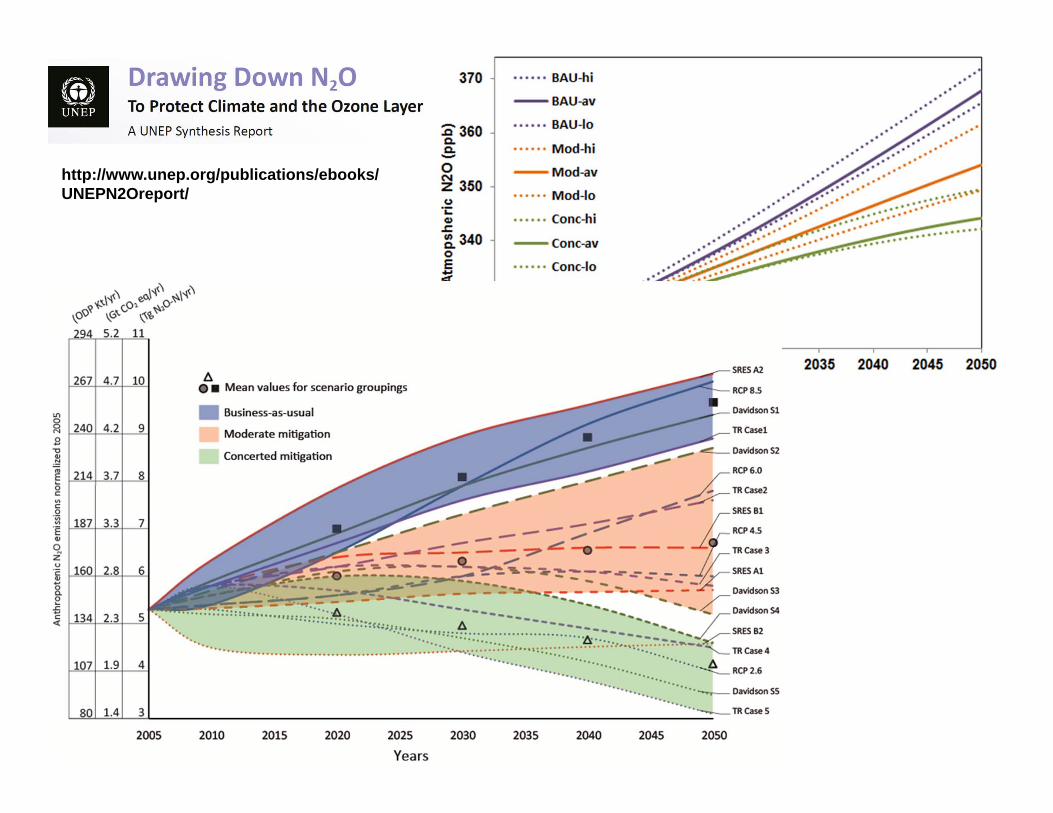
http://www.unep.org/publications/ebooks/UNEPN2Oreport/
What are the technical, economic, and social impediments and opportunities for increased nitrogen use efficiency in crop and animal production systems?
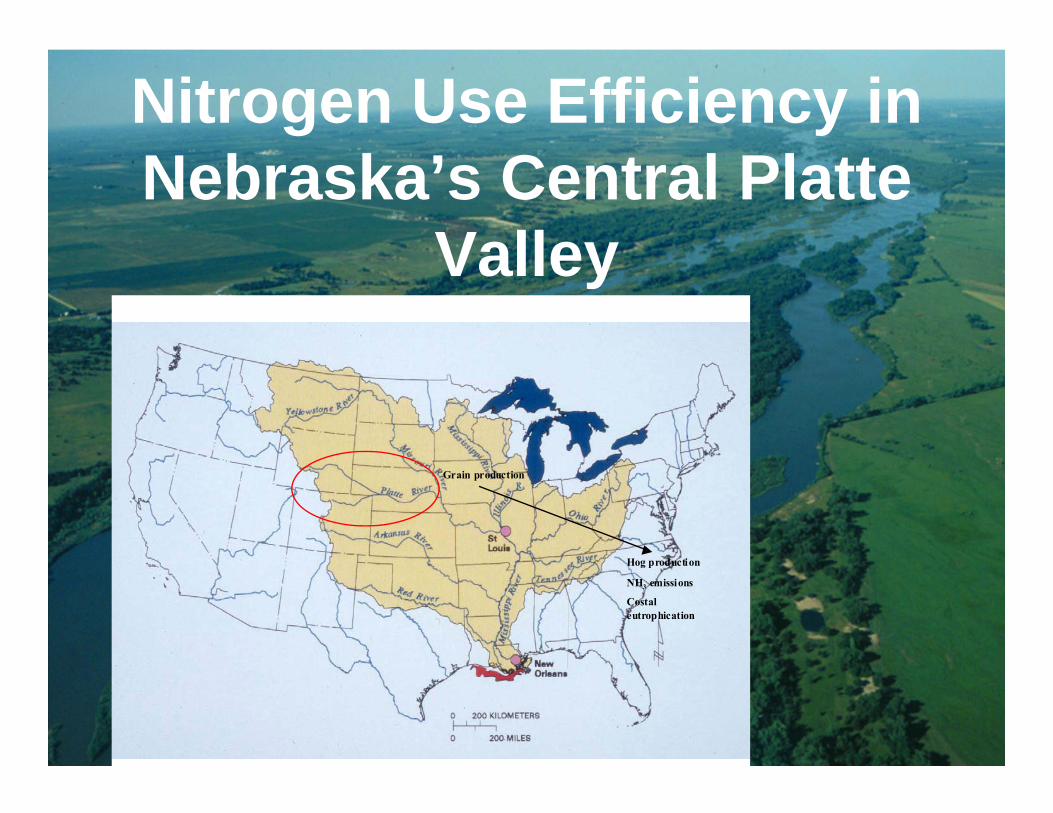
Nitrogen Use Efficiency in Nebraska’s Central Platte
Valley
Richard B. FergusonProfessor of Soil ScienceDepartment of Agronomy & HorticultureUniversity of Nebraska-Lincoln
Hog production
NH3 emissions
Costaleutrophication
Grain production
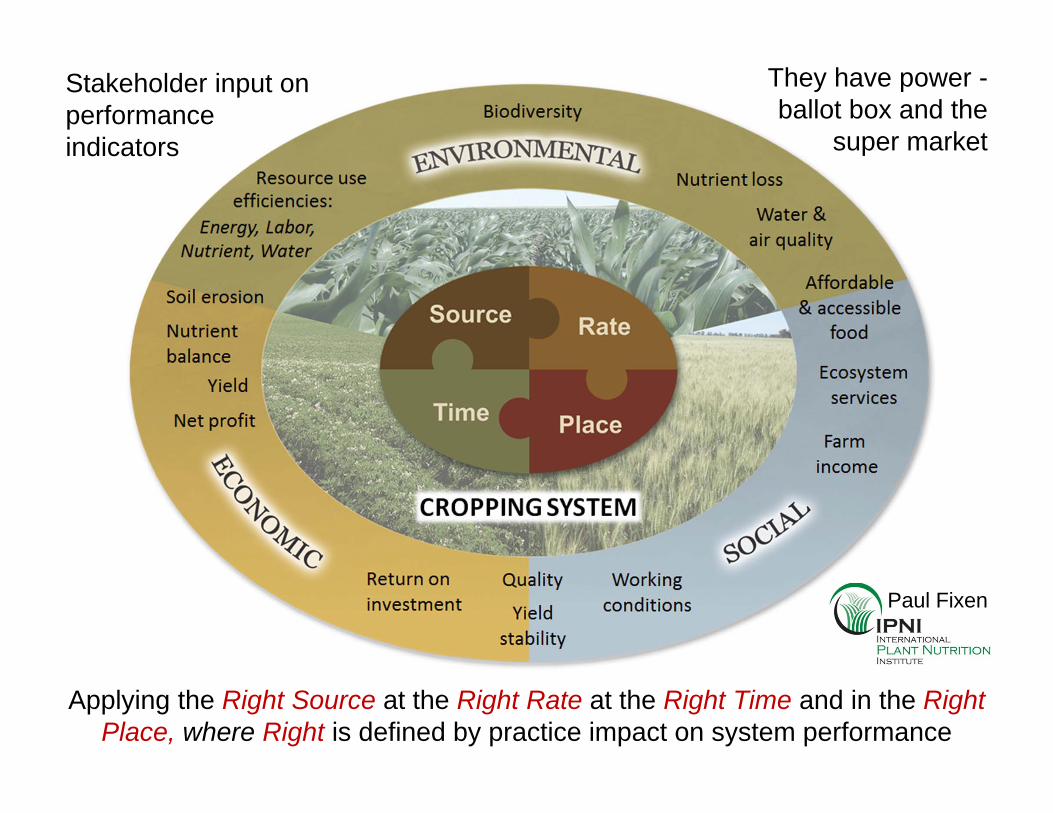
Stakeholder input on performance indicators
They have power -ballot box and the
super market
Applying the Right Source at the Right Rate at the Right Time and in the Right Place, where Right is defined by practice impact on system performance
Paul Fixen
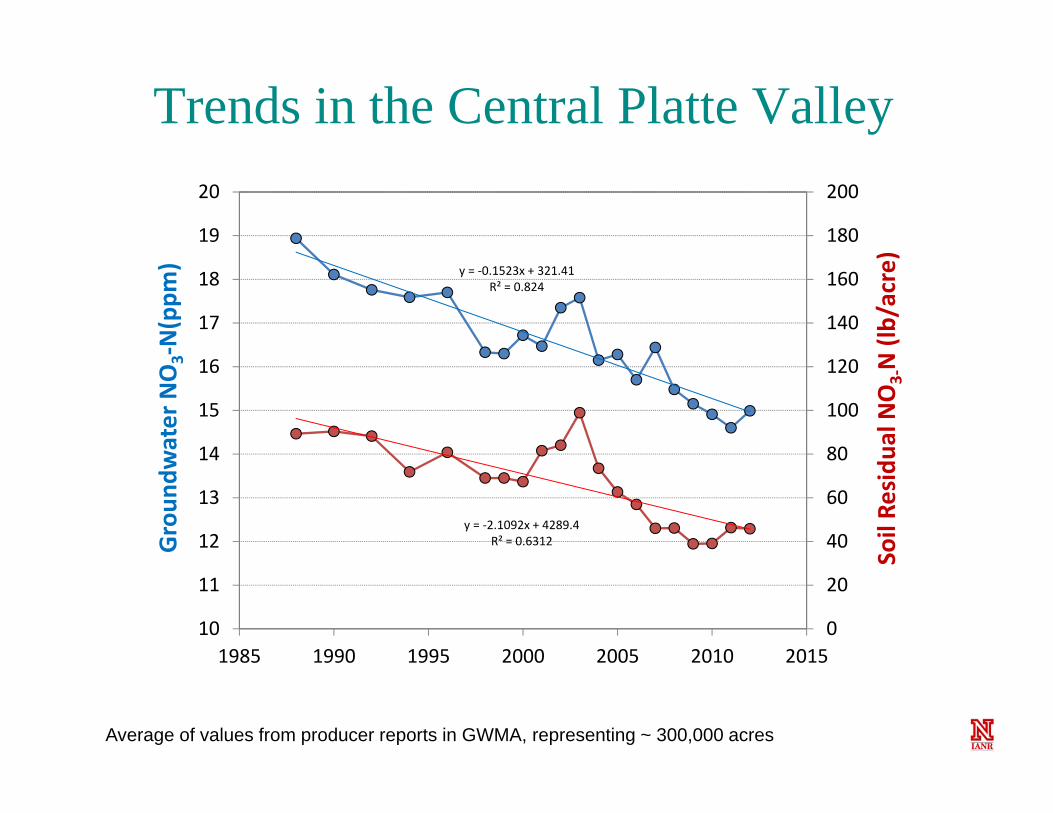
Trends in the Central Platte Valley
Average of values from producer reports in GWMA, representing ~ 300,000 acres
y = ‐0.1523x + 321.41R² = 0.824
y = ‐2.1092x + 4289.4R² = 0.6312
0
20
40
60
80
100
120
140
160
180
200
10
11
12
13
14
15
16
17
18
19
20
1985 1990 1995 2000 2005 2010 2015
Soil Re
sidu
al NO3‐N (lb/acre)
Groun
dwater NO3‐N(ppm
)
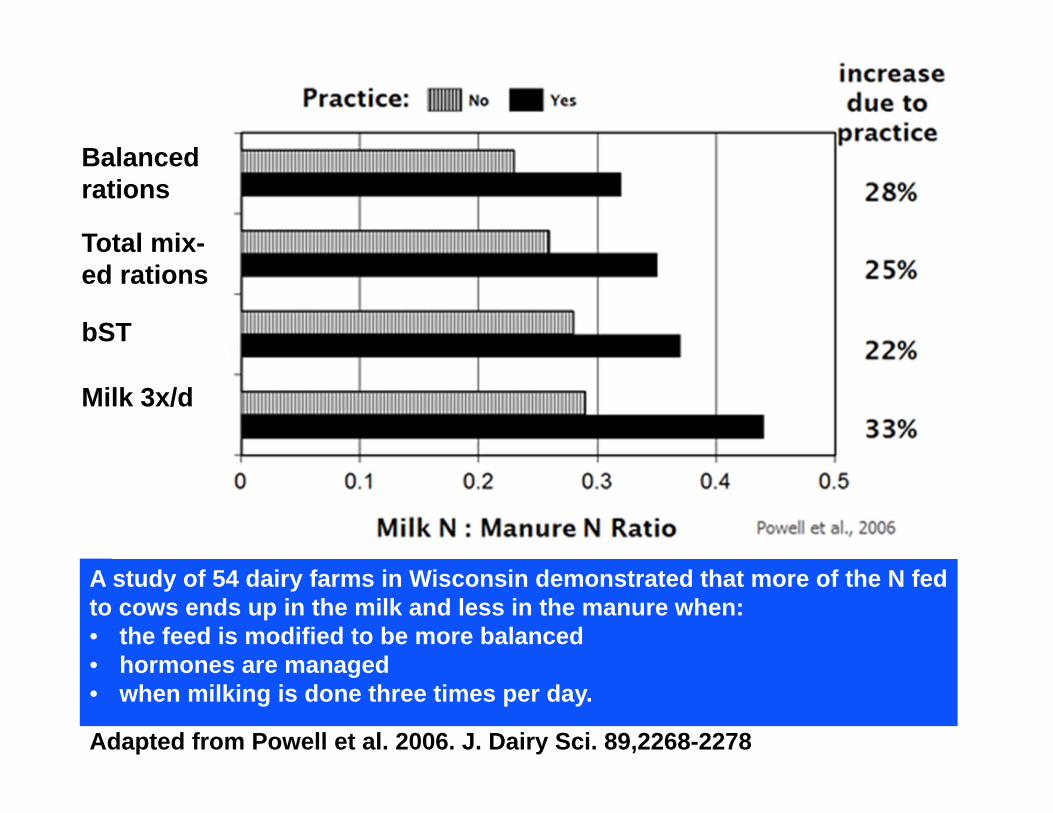
A study of 54 dairy farms in Wisconsin demonstrated that more of the N fed to cows ends up in the milk and less in the manure when:• the feed is modified to be more balanced• hormones are managed• when milking is done three times per day.
Adapted from Powell et al. 2006. J. Dairy Sci. 89,2268-2278
Balanced rations
Total mix-ed rations
bST
Milk 3x/d
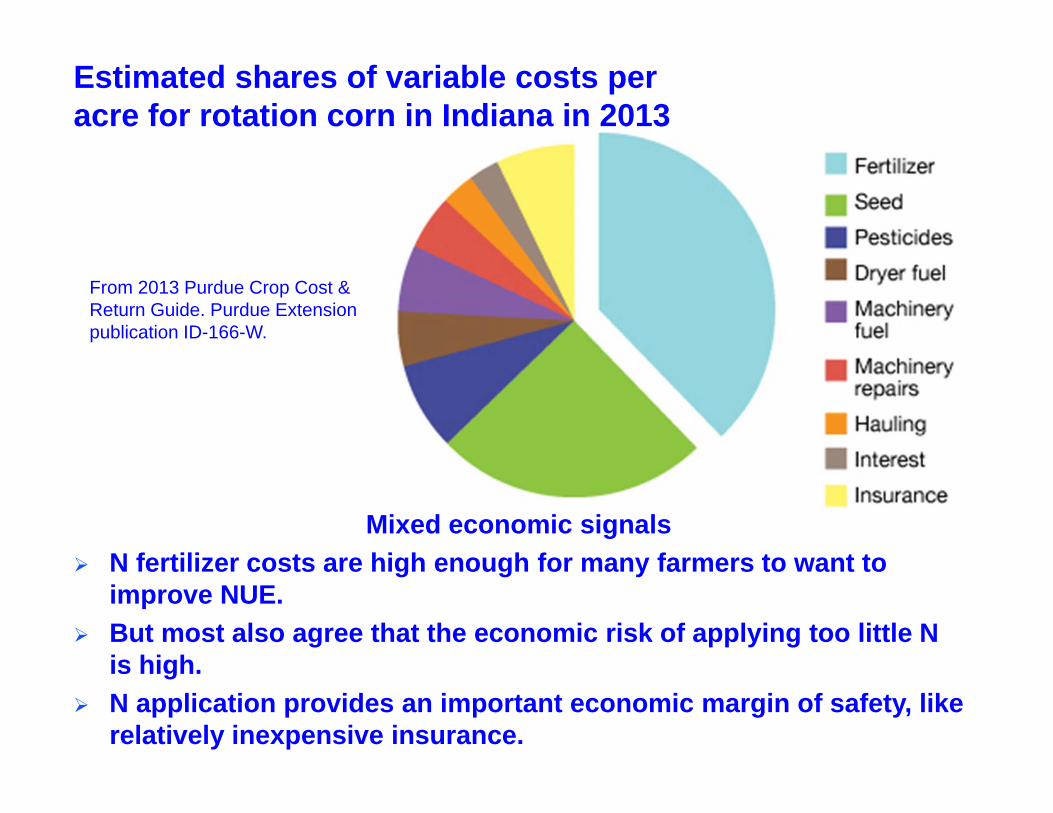
Mixed economic signals N fertilizer costs are high enough for many farmers to want to
improve NUE. But most also agree that the economic risk of applying too little N
is high. N application provides an important economic margin of safety, like
relatively inexpensive insurance.
Estimated shares of variable costs per acre for rotation corn in Indiana in 2013
From 2013 Purdue Crop Cost & Return Guide. Purdue Extension publication ID-166-W.
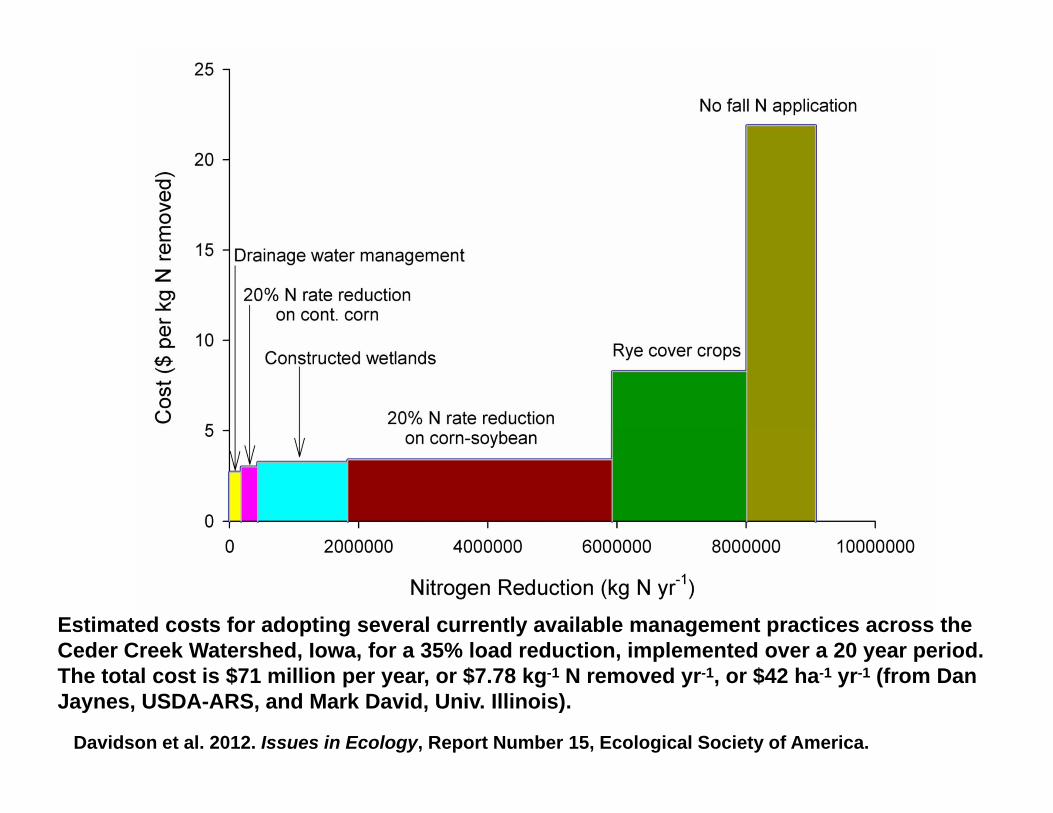
Estimated costs for adopting several currently available management practices across the Ceder Creek Watershed, Iowa, for a 35% load reduction, implemented over a 20 year period. The total cost is $71 million per year, or $7.78 kg-1 N removed yr-1, or $42 ha-1 yr-1 (from Dan Jaynes, USDA-ARS, and Mark David, Univ. Illinois).
Davidson et al. 2012. Issues in Ecology, Report Number 15, Ecological Society of America.
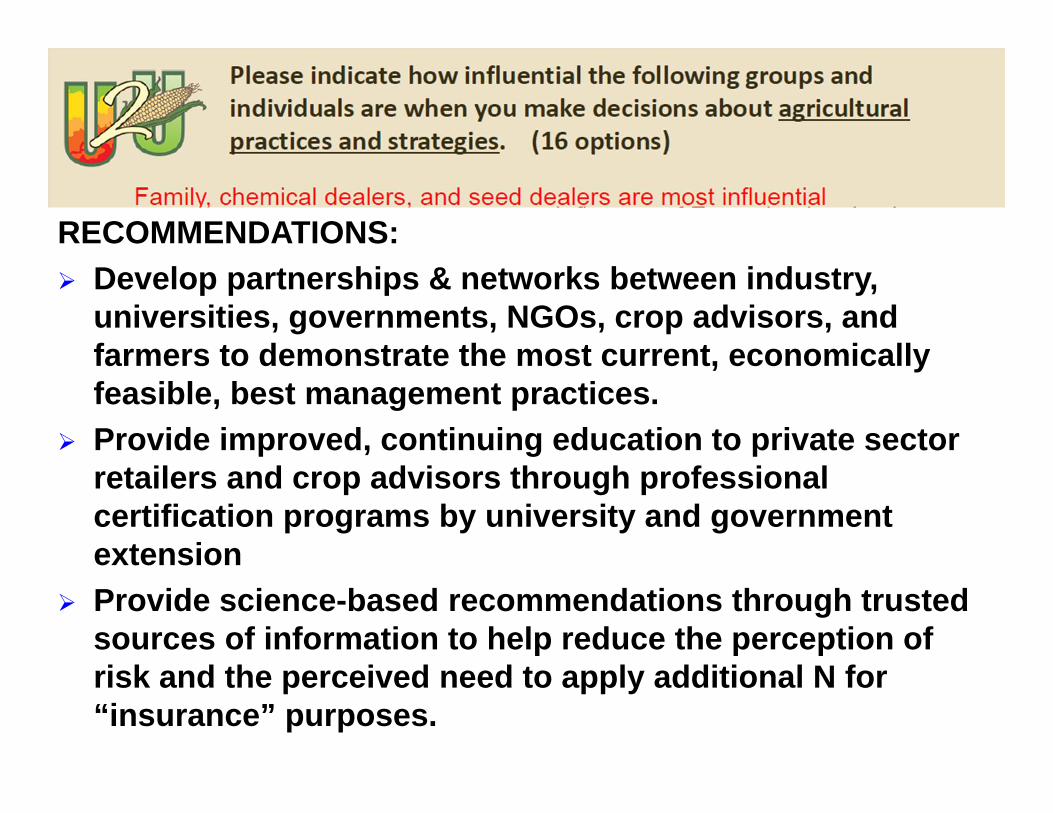
Linda ProkopyPurdue Univ.
RECOMMENDATIONS: Develop partnerships & networks between industry,
universities, governments, NGOs, crop advisors, and farmers to demonstrate the most current, economically feasible, best management practices.
Provide improved, continuing education to private sector retailers and crop advisors through professional certification programs by university and government extension
Provide science-based recommendations through trusted sources of information to help reduce the perception of risk and the perceived need to apply additional N for “insurance” purposes.
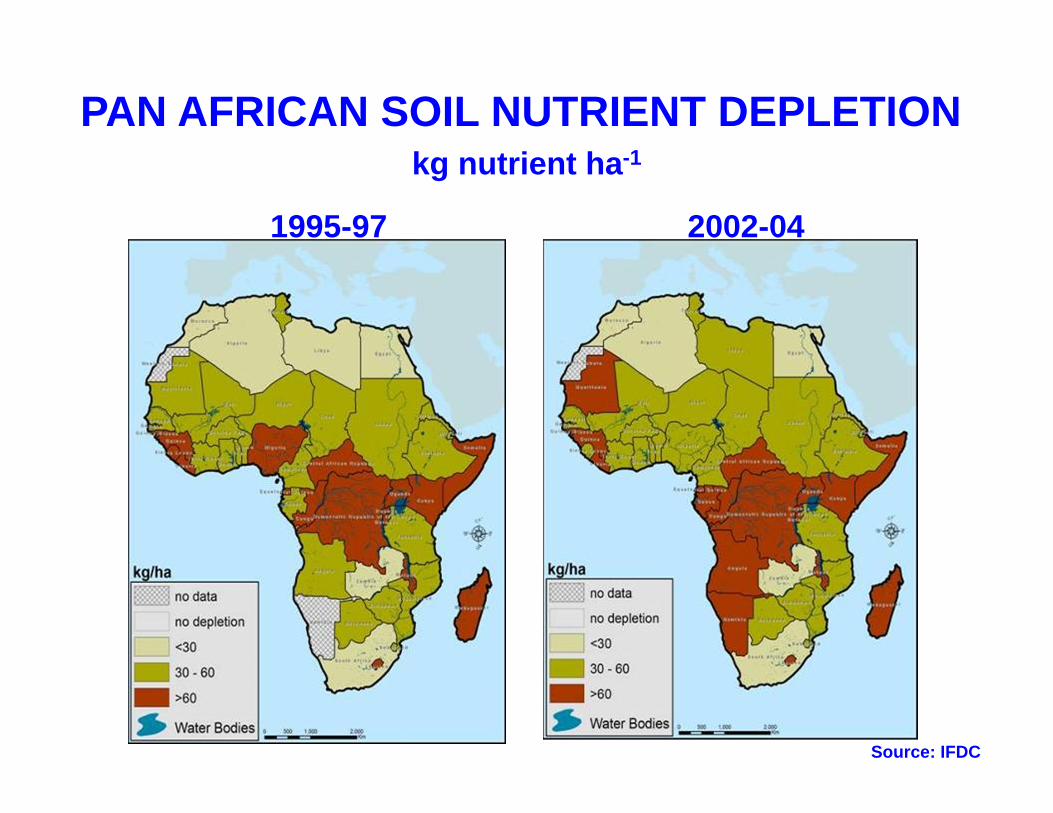
1995-97 2002-04
Source: IFDC
PAN AFRICAN SOIL NUTRIENT DEPLETION kg nutrient ha-1
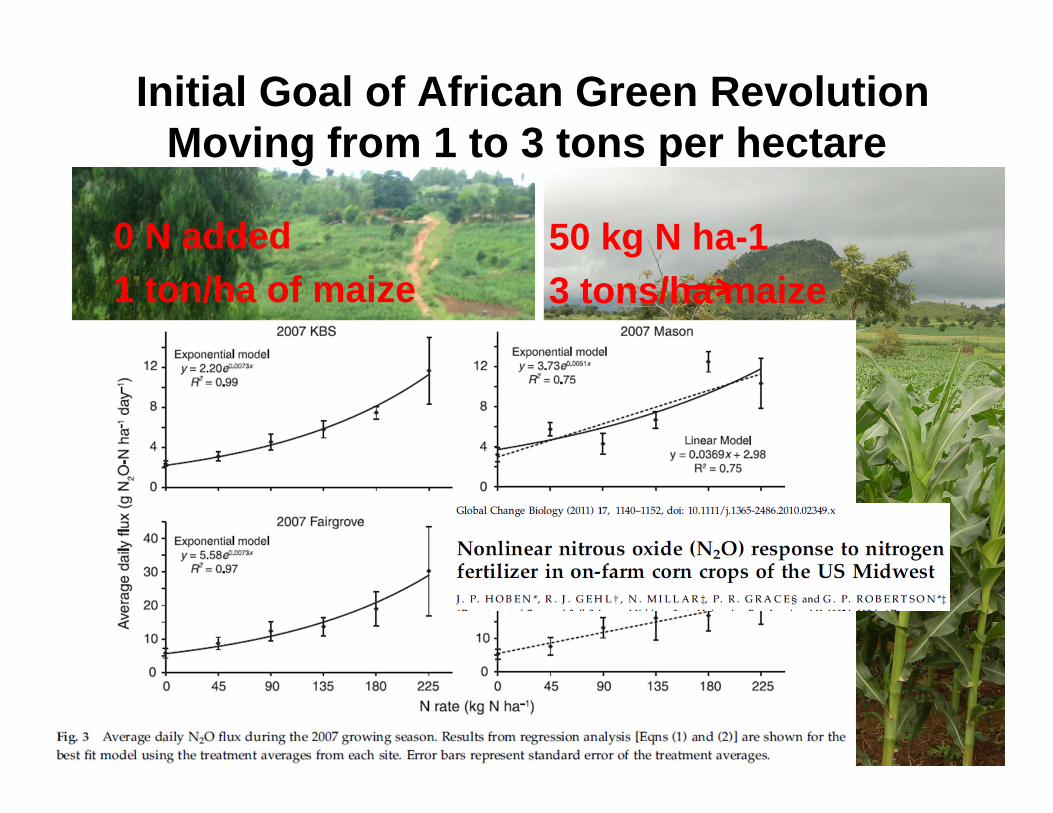
Initial Goal of African Green RevolutionMoving from 1 to 3 tons per hectare
0 N added 1 ton/ha of maize
50 kg N ha-13 tons/ha maize