Manufacturing Wages On The Rise
17
SE7EN SUMMITS GROUP Fast Rise in Manufacturing Wages Gabriela Alessio Meredith Leigh Nirmal Shah Brian Sackey Cause Analysis and Effects
-
Upload
gabriela-alessio-robles -
Category
Economy & Finance
-
view
199 -
download
0
Transcript of Manufacturing Wages On The Rise
S E 7 E N S U M M I T S
G R O U P
Fast Rise in Manufacturing Wages
Gabriela AlessioMeredith Leigh
Nirmal ShahBrian Sackey
Cause Analysis and Effects
AGENDA
S E 7 E N S U M M I T S
G R O U P
1. Summary
2. Manufacturing in the U.S.
3. The Disconnect: Perception & Facts
4. Current Situation in the U.S.
5. The Reality
6. Examples
7. What Can Management Do?
8. Operational Leverage
9. Conclusion
10.Bibliography2
SUMMARY
S E 7 E N S U M M I T S
G R O U P
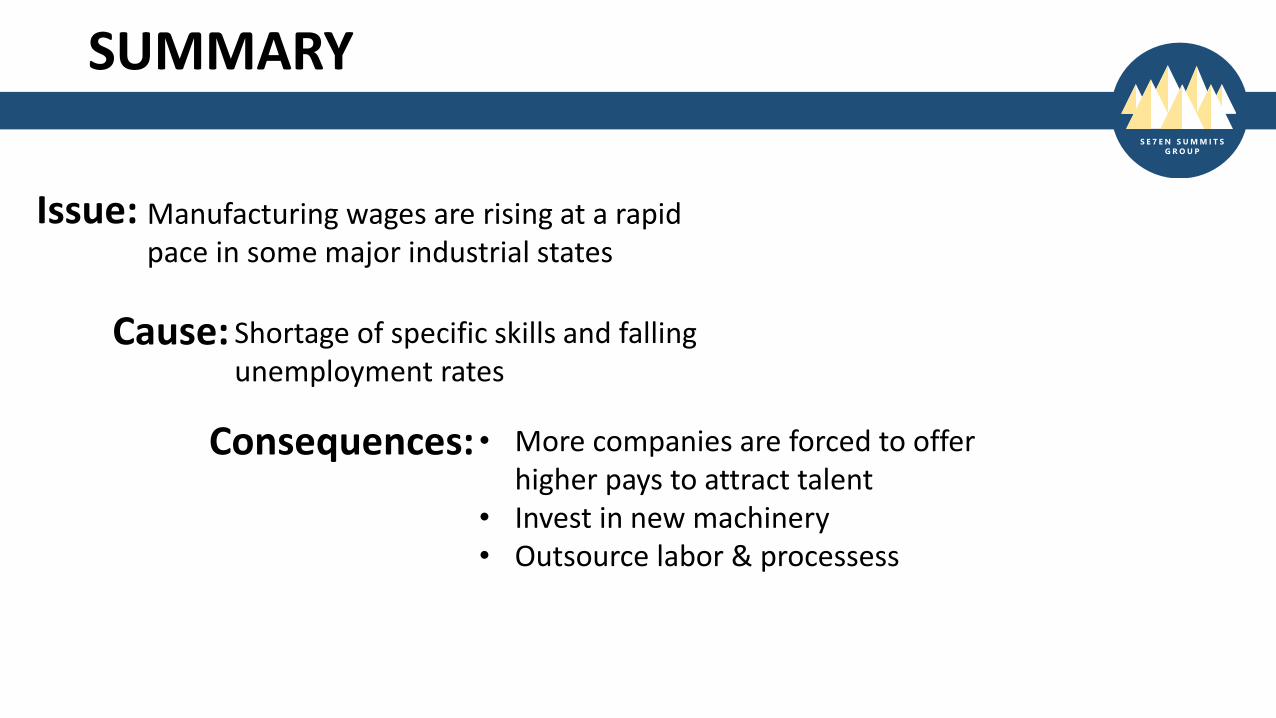
Issue: Manufacturing wages are rising at a rapid pace in some major industrial states
Cause: Shortage of specific skills and falling unemployment rates
• More companies are forced to offer higher pays to attract talent
• Invest in new machinery• Outsource labor & processess
Consequences:

Manufacturing in the U.S.
S E 7 E N S U M M I T S
G R O U P
$ R & D x2.91
$1 of goods produced = $1.32 additional
5 states add over half a trillion dollars a year
75% of private R&D 1 manufacturing job creates 2.91 other jobs
Source: The National Association of Manufacturers, Skills Gap Report 2013
In 2013, manufacturers contributed $2.08 trillion to the economy,
up from $2.03 trillion in 2012. This was 12.5% of GDP.

The Disconnect: Perception & Facts
S E 7 E N S U M M I T S
G R O U P
Source: The National Association of Manufacturers, Skills Gap Report 2013
While Manufacturing is filled with high paying jobs, people aren’t joining the field
Only 30% of parents encourage their kids to enter manufacturing
77% of Americans fear the loss of domestic manufac-turing jobs to other countries
+70%
77%
+70% of Americans view Manufacturing as the most important industry for a strong economy
Only 17% of people consider manufacturing as a top career choice
STEM
17%
?
BUT
Current situation in the U.S.
S E 7 E N S U M M I T S
G R O U P
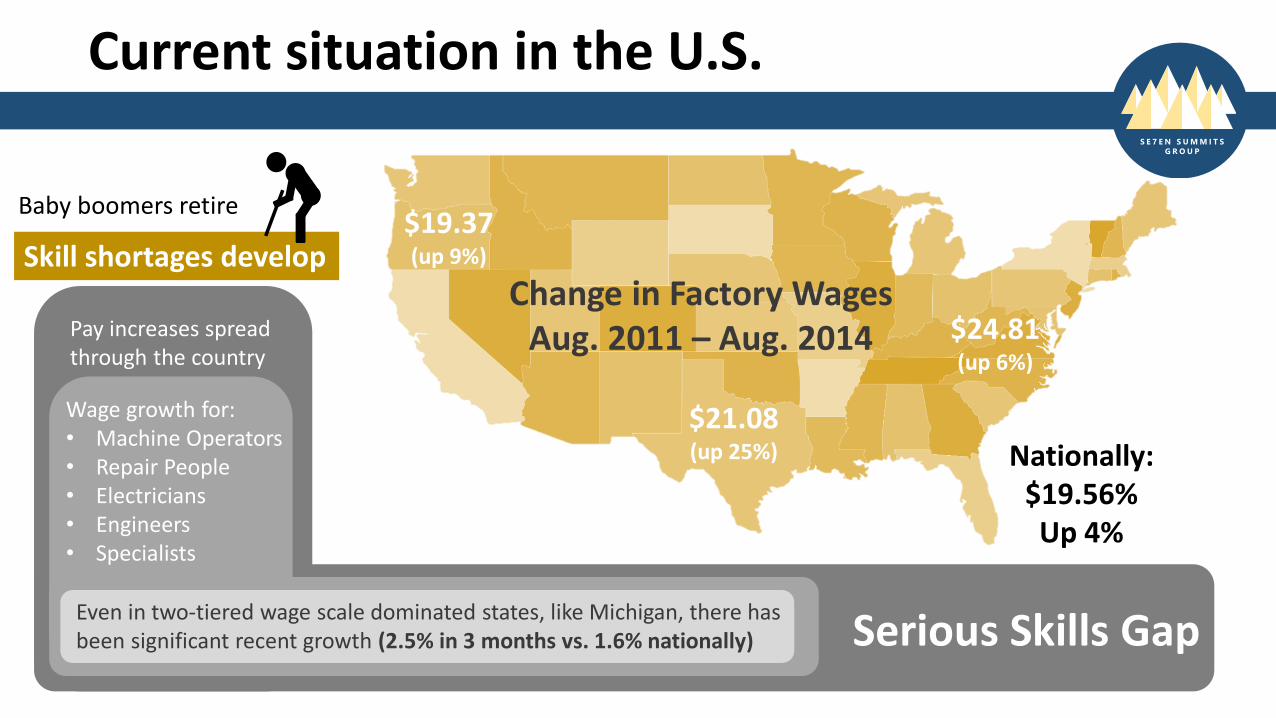
$21.08 (up 25%)
$19.37 (up 9%)
$24.81(up 6%)
Nationally:$19.56%Up 4%
Change in Factory Wages Aug. 2011 – Aug. 2014
Baby boomers retire
Skill shortages develop
Pay increases spread through the country
Wage growth for:• Machine Operators• Repair People• Electricians• Engineers• Specialists
Even in two-tiered wage scale dominated states, like Michigan, there has been significant recent growth (2.5% in 3 months vs. 1.6% nationally) Serious Skills Gap

The Reality
S E 7 E N S U M M I T S
G R O U P
A 2014 Skills Gap Report from The National Association of Manufacturers shows:
82% a moderate to severe shortage of available, qualified workers
Reported
67% Anticipate the shortage to grow worse in the next 3 to 5 years
Source: Jim Timmon’s Remarks to the SMART Manufacturing Summit, May 20, 2014
Companies are being forced to use temporary agencies at nearly double the cost of staff workers
“Job hoppers” who change companies to achieve higher wages attain much higher wage growth than workers who stay in the same place
What can management do to cope this expenses?

Examples
Sullivan Palatek
(Michigan)
Using welders from temp-agencies at double the cost of staff weldersCEO considering buying robotic equipment or bringing in workers from Mexico
-250 on waitlist for welding school in TX-One student works 55-60 hours a week at $17, but with overtime, takes home upwards of $800 a week.
S E 7 E N S U M M I T S
G R O U P
ThorIndustries (Elkhart, IN)
Strong rebound on engines & recreational vehicles, but still short on staff.
Help wanted signs everywhere, driving wage cost up pinched profit margins in 4th quarter (ending July 31)
LoadcraftIndustries (Brady, TX)
Wages have risen 4-5% this year compared to 2-3% in recent years.
Workers who are offered higher wages across town are suddenly just gone.

What can Management do?
S E 7 E N S U M M I T S
G R O U P
Fixed Costs Variable Costs Wages as Fixed Costs Wages as Variable Costs
$
$$
$
$
Invest in new machinery and automatization
Outsource partial operations
Outsource employees
Pay higher wages
• Tax• Fixed overhead• Depreciation• Insurance• Leases• Interest on loans• Supervisor salaries*
• Direct Materials• Variable overhead• Transportation
• LABOR
FIXED VARIABLE

What can Management do?
S E 7 E N S U M M I T S
G R O U P
$
$$
$
$
Investing on Machines
Rising Wages even more
Outsourcing People or Processes
$
MAXIMIZE ProfitMINIMIZE Cost
$ $ $ $$ $
$$
FIXED VARIABLE
OPERATIONAL LEVERAGE
Manage the
right mix of
fixed & variable costs
VARIABLEFIXED

Operational Leverage
S E 7 E N S U M M I T S
G R O U P
Degree to which a firm or project incurs a
combination of fixed and variable costs
• High Gross Margin• High proportion of Fixed Costs
High Fixed Cost Company
More Operational Leverage
• High Gross Margin• Low proportion of Fixed Costs
Low Fixed Cost Company
Less Operational Leverage
Pros
Cons
• Magnifies results, making gains look better
• Magnifies results, making losses look worse• Increases risks because it makes returns less predictable over time
$100.0 $100.0
$35.0 $65.0
$65.0 $35.0
$50.0 $20.0
$15.0 $15.0
$-
$50.0
$100.0
$150.0
$200.0
$250.0
$300.0
$350.0
$400.0
High Fixed Cost Company Low Fixed Cost Company
Base Case(Thousands of dollars)
Revenue Variable Costs Gross Profit Fixed Costs Net Income
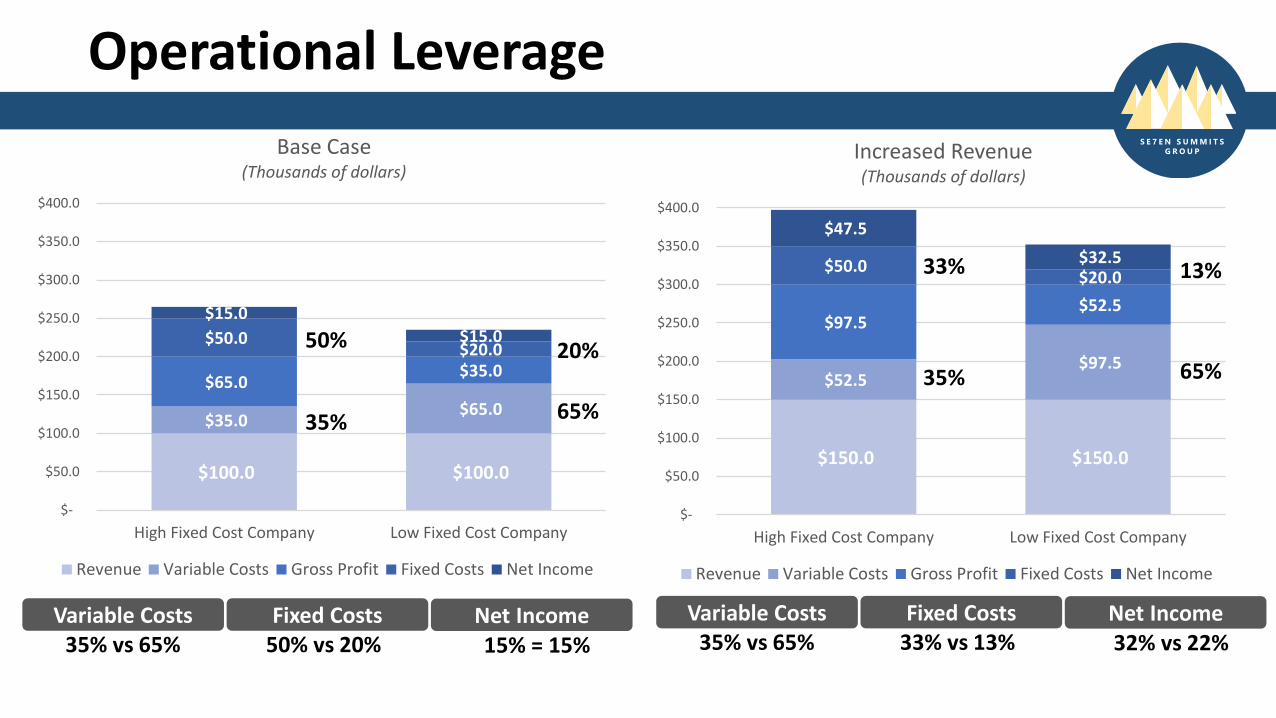
Operational Leverage
35%
50%
65%
20%
$150.0 $150.0
$52.5 $97.5
$97.5 $52.5
$50.0 $20.0
$47.5
$32.5
$-
$50.0
$100.0
$150.0
$200.0
$250.0
$300.0
$350.0
$400.0
High Fixed Cost Company Low Fixed Cost Company
Increased Revenue(Thousands of dollars)
Revenue Variable Costs Gross Profit Fixed Costs Net Income
S E 7 E N S U M M I T S
G R O U P
35%
33%
65%
13%
35% vs 65%Variable Costs Fixed Costs
50% vs 20%Net Income15% = 15% 35% vs 65%
Variable Costs Fixed Costs33% vs 13%
Net Income32% vs 22%

$100.0 $100.0
$35.0 $65.0
$65.0 $35.0
$50.0 $20.0
$15.0 $15.0
$-
$50.0
$100.0
$150.0
$200.0
$250.0
$300.0
$350.0
$400.0
High Fixed Cost Company Low Fixed Cost Company
Base Case(Thousands of dollars)
Revenue Variable Costs Gross Profit Fixed Costs Net Income
Operational Leverage
35%
50%
65%
20%
35% vs 65%Variable Costs Fixed Costs
50% vs 20%
$150.0 $150.0
$52.5 $97.5
$97.5 $52.5
$50.0 $20.0
$47.5
$32.5
$-
$50.0
$100.0
$150.0
$200.0
$250.0
$300.0
$350.0
$400.0
High Fixed Cost Company Low Fixed Cost Company
Increased Revenue(Thousands of dollars)
Revenue Variable Costs Gross Profit Fixed Costs Net Income
S E 7 E N S U M M I T S
G R O U P
35%
33%
65%
13%
Net Income15% = 15% 35% vs 65%
Variable Costs Fixed Costs33% vs 13%
Net Income32% vs 22%
∆= 17% vs 7%
$50.0 $50.0
$17.5 $32.5 $32.5 $17.5
$50.0 $20.0
$(17.5) $(2.5)
$(50.0)
$-
$50.0
$100.0
$150.0
$200.0
$250.0
$300.0
$350.0
$400.0
High Fixed Cost Company Low Fixed Cost Company
Decreased Revenue(Thousands of dollars)
Revenue Variable Costs Gross Profit Fixed Costs Net Income
$100.0 $100.0
$35.0 $65.0
$65.0 $35.0
$50.0 $20.0
$15.0 $15.0
$-
$50.0
$100.0
$150.0
$200.0
$250.0
$300.0
$350.0
$400.0
High Fixed Cost Company Low Fixed Cost Company
Base Case(Thousands of dollars)
Revenue Variable Costs Gross Profit Fixed Costs Net Income
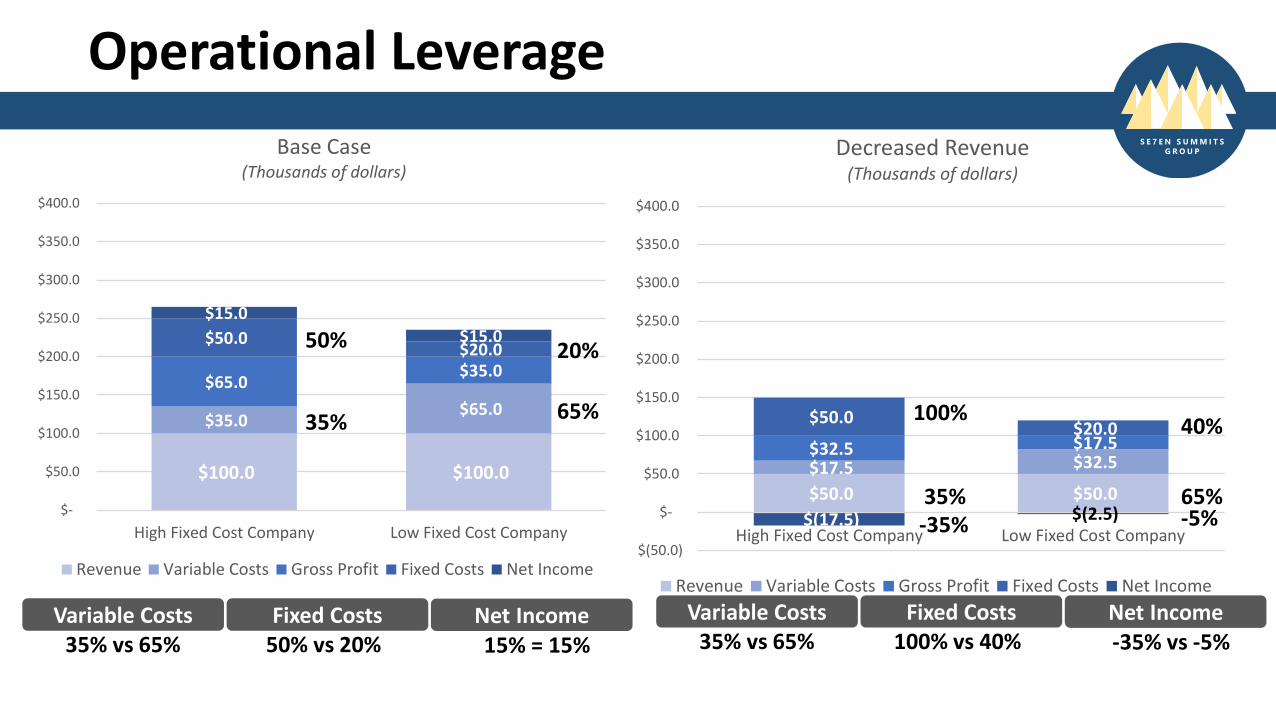
Operational Leverage
35%
50%
65%
20%
35% vs 65%Variable Costs Fixed Costs
50% vs 20%
S E 7 E N S U M M I T S
G R O U P
35%
100%
65%
40%
Net Income15% = 15% 35% vs 65%
Variable Costs Fixed Costs100% vs 40%
Net Income-35% vs -5%
-35% -5%
$50.0 $50.0
$17.5 $32.5 $32.5 $17.5
$50.0 $20.0
$(17.5) $(2.5)
$(50.0)
$-
$50.0
$100.0
$150.0
$200.0
$250.0
$300.0
$350.0
$400.0
High Fixed Cost Company Low Fixed Cost Company
Decreased Revenue(Thousands of dollars)
Revenue Variable Costs Gross Profit Fixed Costs Net Income
$100.0 $100.0
$35.0 $65.0
$65.0 $35.0
$50.0 $20.0
$15.0 $15.0
$-
$50.0
$100.0
$150.0
$200.0
$250.0
$300.0
$350.0
$400.0
High Fixed Cost Company Low Fixed Cost Company
Base Case(Thousands of dollars)
Revenue Variable Costs Gross Profit Fixed Costs Net Income
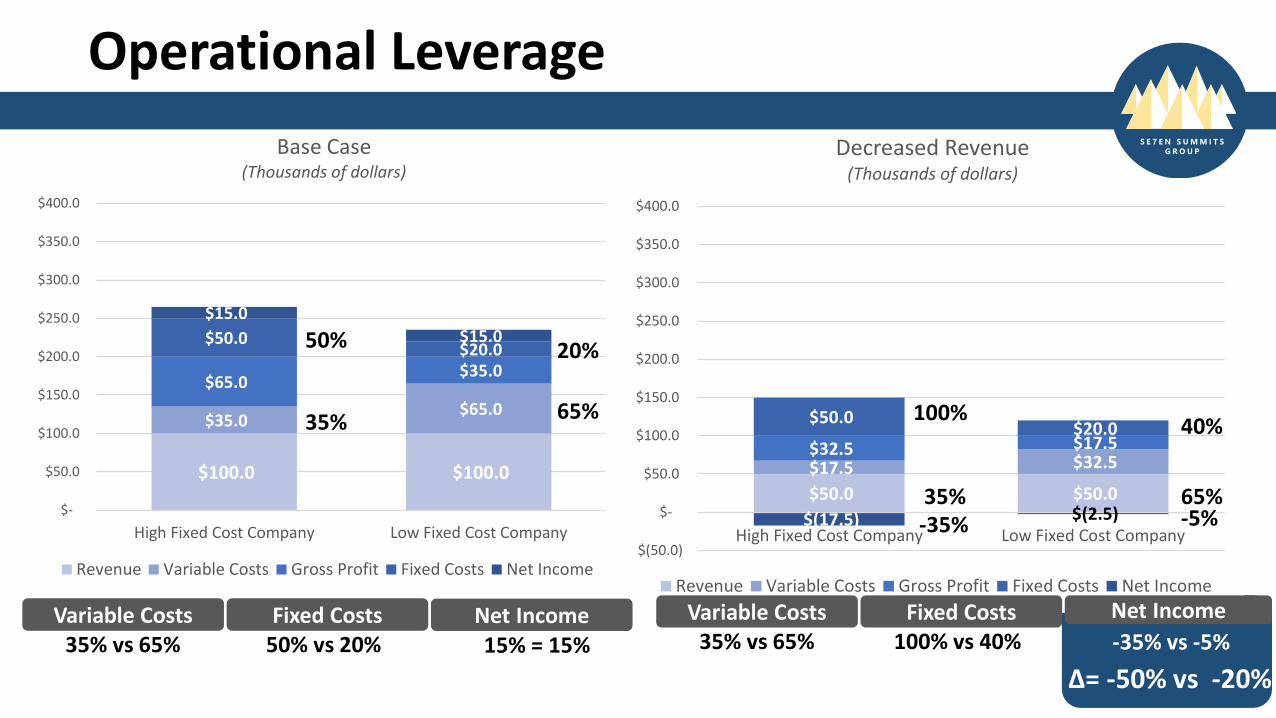
Operational Leverage
35%
50%
65%
20%
35% vs 65%Variable Costs Fixed Costs
50% vs 20%
S E 7 E N S U M M I T S
G R O U P
35%
100%
65%
40%
Net Income15% = 15% 35% vs 65%
Variable Costs Fixed Costs100% vs 40%
Net Income
-35% vs -5%
-35% -5%
∆= -50% vs -20%

Conclusion
S E 7 E N S U M M I T S
G R O U P
• Manufacturing companies should consider increasing their degree of
operating leverage with the purchase of new machines to maximize profit
in times of increased production
• Increased re-shoring due to wage hikes internationally, including China,
will continue to boost domestic production levels.
• Automation decreases need for high-cost, low supply labor force, and
produces the most beneficial cost structure for companies in the
manufacturing industry considering the economic climate

Bibliography
S E 7 E N S U M M I T S
G R O U P
Hagerty, James. "Manufacturing Wages Rise Fast in Some Areas." The Wall Street Journal. Dow Jones & Company, 8 Oct. 2014. Web. 14 Nov. 2014.
Espinoza, Richard. "3 Trends Affecting US Manufacturing." Environmental Leader RSS. N.p., 7 Aug. 2014. Web. 14 Nov. 2014. <http://www.environmentalleader.com/2014/08/07/3-trends-affecting-us-manufacturing/>.
Jan, Obaidullah. "Degree of Operating Leverage." Accounting Explained. N.p., n.d. Web. 13 Nov. 2014. <http://accountingexplained.com/managerial/cvp-analysis/operating-leverage>.
Schmedt, Fred. "The Concept of Operating Leverage." The Samuel Roberts Noble Foundation. N.p., n.d.Web. 14 Nov. 2014. <http://www.noble.org/ag/economics/operatingleverage/>.