MANUFACTURING SOFTWARE - Syspro · PDF file14 Infor VISUAL 15 Exact Macola 16 SAP...
39
¨ MANUFACTURING SOFTWARE June 2017
Transcript of MANUFACTURING SOFTWARE - Syspro · PDF file14 Infor VISUAL 15 Exact Macola 16 SAP...

¨
MANUFACTURING SOFTWAREJune 2017

CONTENTS46
Introduction
Defining Manufacturing Software
The Quadrant
Manufacturing FrontRunners Index
Runners Up
Methodology Basics
8
3336
7

FRONTRUNNERS9 SAP Business One
10 Oracle JD Edwards EnterpriseOne
11 IQMS
12 SYSPRO
13 Deltek Costpoint
14 Infor VISUAL
15 Exact Macola
16 SAPManufacturingExecution
17 Microsoft Dynamics 365
18 MIE Trak Pro
19 TrueERP
20 Acumatica Cloud ERP
21 IFS Applications
22 Global Shop Solutions One-System ERP
23 Cetec ERP
24 xTupleManufacturingEdition
25 abas ERP
26 Statii
27 Datacor Chempax
28 Solumina
29 ECi M1
30 Made2ManageERP
31 EpicorManufacturing
32 PBSManufacturing

4J U N E 2 0 1 7
INTRODUCTION
This FrontRunners analysis is a data-driven assessment identifying products in the
Manufacturing market that offer the best capability and value for small businesses. For a given market, products are evaluated and given a score for the capability (x-axis) and value (y-axis) they bring to users. FrontRunners then plots the top 25-30 products in a quadrant format.
In the Manufacturing FrontRunners graphic, the Capability axis starts at 2.50 and ends at 4.20, while the Value axis starts at 2.30 and ends at 4.30.
To be considered for the Manufacturing FrontRunners, a product needed a minimum of 10 user reviews, a minimum capability user rating score of 3.2 and a minimum value user rating score of 3.4. In most cases, we evaluate hundreds of products and feature 20-25 as FrontRunners; all products that qualify as FrontRunners are top performing products in their market.

I N T R O D U C T I O N
5J U N E 2 0 1 7
Each product falls within a designated quadrant based on their axis scores. Dependent on the specific needs of the software buyer, a product placed in any quadrant category could be a good fit.
QUADRANT CATEGORIES:
» Upper Right = Leaders: Leaders are all-around strong products. They offer a wide range of functionality to a wide range of customers. These products are considered highly valuable by customers.
» Upper Left = Masters: Masters may focus more heavily on certain key features or market segments than Leaders do. If you need a more specialized set of functionality without bells and whistles, then a product in the Masters quadrant might be right for you.
» Lower Right = Pacesetters: Pacesetters may offer a strong set of features, but are not rated as highly on value. For example, a Pacesetter might offer greater functionality, but cost more.
» Lower Left = Contenders: Contenders may focus on a more specialized set of capabilities that are priced at a higher point. This makes them ideal for companies willing to pay more for specific features that meet their unique needs.

6J U N E 2 0 1 7
Manufacturing software helps organizations manage the planning and execution of
manufacturing processes.
Software Advice’s FrontRunners quadrant is focused on the North American Manufacturing software market. We identify this set of core capabilities for the Manufacturing software category: material requirements planning (MRP), manufacturing execution system (MES), quality management and product lifecycle management, as well as at least one of the following: configure/price/quote(CPQ), financialmanagement, asset management, human resources (HR), customer relationship management (CRM), business intelligence (BI) and/or supply chain management (SCM).
In addition, we identify some related features that organizations purchasing Manufacturing software may also need or wish to consider: sales management, field service management and warehouse management.
DEFINING MANUFACTURING SOFTWARE

7J U N E 2 0 1 7
THE QUADRANT
Masters Leaders
Contenders PacesettersCapability Score
Valu
e Sc
ore
SAPBusinessOne
Oracle JD EdwardsEnterpriseOne
IQMSSAP ManufacturingExecution
DeltekCostpoint
ExactMacola
MicrosoftDynamics 365
MIE Trak ProInforVISUAL
SYSPRO
TrueERP
Datacor Chempax
PBS Manufacturing
Made2Manage ERP
Global Shop SolutionsOne-System ERP
ECi M1
Epicor Manufacturing
IFS Applications
xTuple Manufacturing Edition
Statii
Cetec ERP
abas ERP
AcumataCloudERP
Solumina
All products that qualify as FrontRunners are top performing
products in their market.

8J U N E 2 0 1 7
MANUFACTURING FRONTRUNNERS INDEX
9 SAP Business One
10 Oracle JD Edwards EnterpriseOne
11 IQMS
12 SYSPRO
13 Deltek Costpoint
14 Infor VISUAL
15 Exact Macola
16 SAP Manufacturing Execution
17 Microsoft Dynamics 365
18 MIE Trak Pro
19 TrueERP
20 Acumatica Cloud ERP
21 IFS Applications
22 Global Shop Solutions One-System ERP
23 Cetec ERP
24 xTuple Manufacturing Edition
25 abas ERP
26 Statii
27 Datacor Chempax
28 Solumina
29 ECi M1
30 Made2Manage ERP
31 Epicor Manufacturing
32 PBS Manufacturing

9
The scores below are based on numeric value between 1 and 5.
CAPABILITY VALUE
Capability User Rating Value User Rating
Functionality Breadth Adoption Score
Features Customer Base
Integrations Reviews Volume
Confidence Score Google Searches
Customer Base Skills Base
Employee Base
Customer Growth
Employee Growth
J U N E 2 0 1 7
FRONTRUNNERS SCORECARDSAP BUSINESS ONE
QUADRANT PLACEMENT: LEADERS
3.88 4.26
4.14 4.02
3.15 4.50
2.40 4.60
3.90 3.60
4.10 5.00
4.60 4.60
4.00
3.90
3.90

10
The scores below are based on numeric value between 1 and 5.
CAPABILITY VALUE
Capability User Rating Value User Rating
Functionality Breadth Adoption Score
Features Customer Base
Integrations Reviews Volume
Confidence Score Google Searches
Customer Base Skills Base
Employee Base
Customer Growth
Employee Growth
J U N E 2 0 1 7
FRONTRUNNERS SCORECARD
ORACLE JD EDWARDS ENTERPRISEONE
QUADRANT PLACEMENT: LEADERS
3.88 4.12
3.98 3.98
3.85 4.27
4.00 4.50
3.70 3.60
3.70 4.00
4.50 4.50
5.00
1.90
3.40

11
The scores below are based on numeric value between 1 and 5.
CAPABILITY VALUE
Capability User Rating Value User Rating
Functionality Breadth Adoption Score
Features Customer Base
Integrations Reviews Volume
Confidence Score Google Searches
Customer Base Skills Base
Employee Base
Customer Growth
Employee Growth
J U N E 2 0 1 7
FRONTRUNNERS SCORECARDIQMS
QUADRANT PLACEMENT: LEADERS
4.12 3.81
4.28 4.06
4.25 3.55
3.60 3.30
4.90 5.00
3.65 3.10
3.30 3.30
2.80
4.00
4.50

12
The scores below are based on numeric value between 1 and 5.
CAPABILITY VALUE
Capability User Rating Value User Rating
Functionality Breadth Adoption Score
Features Customer Base
Integrations Reviews Volume
Confidence Score Google Searches
Customer Base Skills Base
Employee Base
Customer Growth
Employee Growth
J U N E 2 0 1 7
FRONTRUNNERS SCORECARDSYSPRO
QUADRANT PLACEMENT: LEADERS
3.69 4.22
4.32 4.42
3.30 4.02
3.60 4.20
3.00 4.50
2.80 2.80
4.20 4.20
2.70
2.50
1.80

13
The scores below are based on numeric value between 1 and 5.
CAPABILITY VALUE
Capability User Rating Value User Rating
Functionality Breadth Adoption Score
Features Customer Base
Integrations Reviews Volume
Confidence Score Google Searches
Customer Base Skills Base
Employee Base
Customer Growth
Employee Growth
J U N E 2 0 1 7
FRONTRUNNERS SCORECARDDELTEK COSTPOINT
QUADRANT PLACEMENT: MASTERS
3.23 4.12
4.10 4.11
1.65 4.13
1.50 4.00
1.80 4.90
3.08 3.30
4.00 4.30
3.40
2.50
2.40

14
The scores below are based on numeric value between 1 and 5.
CAPABILITY VALUE
Capability User Rating Value User Rating
Functionality Breadth Adoption Score
Features Customer Base
Integrations Reviews Volume
Confidence Score Google Searches
Customer Base Skills Base
Employee Base
Customer Growth
Employee Growth
J U N E 2 0 1 7
FRONTRUNNERS SCORECARDINFOR VISUAL
QUADRANT PLACEMENT: LEADERS
3.91 3.43
4.01 3.74
4.15 3.12
4.00 3.60
4.30 1.80
3.48 3.70
3.60 3.00
3.90
3.60
2.80

15
The scores below are based on numeric value between 1 and 5.
CAPABILITY VALUE
Capability User Rating Value User Rating
Functionality Breadth Adoption Score
Features Customer Base
Integrations Reviews Volume
Confidence Score Google Searches
Customer Base Skills Base
Employee Base
Customer Growth
Employee Growth
J U N E 2 0 1 7
FRONTRUNNERS SCORECARDEXACT MACOLA
QUADRANT PLACEMENT: MASTERS
3.35 3.94
4.22 4.27
2.10 3.62
1.80 4.30
2.40 1.50
2.85 3.60
4.30 4.00
3.30
1.30
2.50

16
The scores below are based on numeric value between 1 and 5.
CAPABILITY VALUE
Capability User Rating Value User Rating
Functionality Breadth Adoption Score
Features Customer Base
Integrations Reviews Volume
Confidence Score Google Searches
Customer Base Skills Base
Employee Base
Customer Growth
Employee Growth
J U N E 2 0 1 7
FRONTRUNNERS SCORECARD
SAP MANUFACTURING EXECUTION
QUADRANT PLACEMENT: LEADERS
3.38 3.71
3.49 3.56
2.75 3.87
1.20 3.70
4.30 3.10
3.80 4.90
3.70 3.90
4.00
3.60
3.90

17
The scores below are based on numeric value between 1 and 5.
CAPABILITY VALUE
Capability User Rating Value User Rating
Functionality Breadth Adoption Score
Features Customer Base
Integrations Reviews Volume
Confidence Score Google Searches
Customer Base Skills Base
Employee Base
Customer Growth
Employee Growth
J U N E 2 0 1 7
FRONTRUNNERS SCORECARDMICROSOFT DYNAMICS 365
QUADRANT PLACEMENT: PACESETTERS
3.81 3.17
3.95 4.04
4.20 2.30
3.60 1.80
4.80 2.40
3.13 4.20
1.80 1.80
4.50
5.00
1.20

18
The scores below are based on numeric value between 1 and 5.
CAPABILITY VALUE
Capability User Rating Value User Rating
Functionality Breadth Adoption Score
Features Customer Base
Integrations Reviews Volume
Confidence Score Google Searches
Customer Base Skills Base
Employee Base
Customer Growth
Employee Growth
J U N E 2 0 1 7
FRONTRUNNERS SCORECARDMIE TRAK PRO
QUADRANT PLACEMENT: LEADERS
3.49 3.40
4.56 4.68
2.85 2.12
2.40 1.50
3.30 4.60
2.00 1.90
1.50 1.60
1.90
1.00
3.60

19
The scores below are based on numeric value between 1 and 5.
CAPABILITY VALUE
Capability User Rating Value User Rating
Functionality Breadth Adoption Score
Features Customer Base
Integrations Reviews Volume
Confidence Score Google Searches
Customer Base Skills Base
Employee Base
Customer Growth
Employee Growth
J U N E 2 0 1 7
FRONTRUNNERS SCORECARDTRUEERP
QUADRANT PLACEMENT: PACESETTERS
3.90 2.97
4.41 4.32
3.85 1.62
2.80 1.50
4.90 2.70
2.93 1.00
1.50 1.50
1.30
4.60
4.30

20
The scores below are based on numeric value between 1 and 5.
CAPABILITY VALUE
Capability User Rating Value User Rating
Functionality Breadth Adoption Score
Features Customer Base
Integrations Reviews Volume
Confidence Score Google Searches
Customer Base Skills Base
Employee Base
Customer Growth
Employee Growth
J U N E 2 0 1 7
FRONTRUNNERS SCORECARDACUMATICA CLOUD ERP
QUADRANT PLACEMENT: LEADERS
3.53 3.30
4.03 4.34
2.60 2.27
2.80 2.70
2.40 1.00
3.45 2.40
2.70 2.40
2.20
4.30
4.60

21
The scores below are based on numeric value between 1 and 5.
CAPABILITY VALUE
Capability User Rating Value User Rating
Functionality Breadth Adoption Score
Features Customer Base
Integrations Reviews Volume
Confidence Score Google Searches
Customer Base Skills Base
Employee Base
Customer Growth
Employee Growth
J U N E 2 0 1 7
FRONTRUNNERS SCORECARDIFS APPLICATIONS
QUADRANT PLACEMENT: LEADERS
3.46 3.36
3.44 3.45
3.50 3.27
4.00 3.90
3.00 1.20
3.45 3.40
3.90 3.60
3.60
3.00
3.30

22
The scores below are based on numeric value between 1 and 5.
CAPABILITY VALUE
Capability User Rating Value User Rating
Functionality Breadth Adoption Score
Features Customer Base
Integrations Reviews Volume
Confidence Score Google Searches
Customer Base Skills Base
Employee Base
Customer Growth
Employee Growth
J U N E 2 0 1 7
FRONTRUNNERS SCORECARD
GLOBAL SHOP SOLUTIONS ONE-SYSTEM ERP
QUADRANT PLACEMENT: MASTERS
3.33 3.37
3.97 4.01
2.55 2.73
1.80 3.00
3.30 4.00
2.83 1.00
3.00 2.70
2.40
2.80
3.10

23
The scores below are based on numeric value between 1 and 5.
CAPABILITY VALUE
Capability User Rating Value User Rating
Functionality Breadth Adoption Score
Features Customer Base
Integrations Reviews Volume
Confidence Score Google Searches
Customer Base Skills Base
Employee Base
Customer Growth
Employee Growth
J U N E 2 0 1 7
FRONTRUNNERS SCORECARDCETEC ERP
QUADRANT PLACEMENT: PACESETTERS
3.57 3.03
4.36 4.58
3.05 1.47
2.80 1.20
3.30 2.80
2.50 1.00
1.20 1.30
1.20
4.60
3.00

24
The scores below are based on numeric value between 1 and 5.
CAPABILITY VALUE
Capability User Rating Value User Rating
Functionality Breadth Adoption Score
Features Customer Base
Integrations Reviews Volume
Confidence Score Google Searches
Customer Base Skills Base
Employee Base
Customer Growth
Employee Growth
J U N E 2 0 1 7
FRONTRUNNERS SCORECARD
XTUPLE MANUFACTURING EDITION
QUADRANT PLACEMENT: CONTENDERS
3.29 3.30
4.49 4.75
2.45 1.85
2.80 1.90
2.10 1.60
1.73 1.90
1.90 1.90
1.50
1.60
1.90

25
The scores below are based on numeric value between 1 and 5.
CAPABILITY VALUE
Capability User Rating Value User Rating
Functionality Breadth Adoption Score
Features Customer Base
Integrations Reviews Volume
Confidence Score Google Searches
Customer Base Skills Base
Employee Base
Customer Growth
Employee Growth
J U N E 2 0 1 7
FRONTRUNNERS SCORECARDABAS ERP
QUADRANT PLACEMENT: CONTENDERS
3.35 3.13
3.73 3.63
2.45 2.63
2.80 2.80
2.10 2.10
3.48 1.90
2.80 3.10
2.10
4.20
4.80
26
The scores below are based on numeric value between 1 and 5.
CAPABILITY VALUE
Capability User Rating Value User Rating
Functionality Breadth Adoption Score
Features Customer Base
Integrations Reviews Volume
Confidence Score Google Searches
Customer Base Skills Base
Employee Base
Customer Growth
Employee Growth
J U N E 2 0 1 7
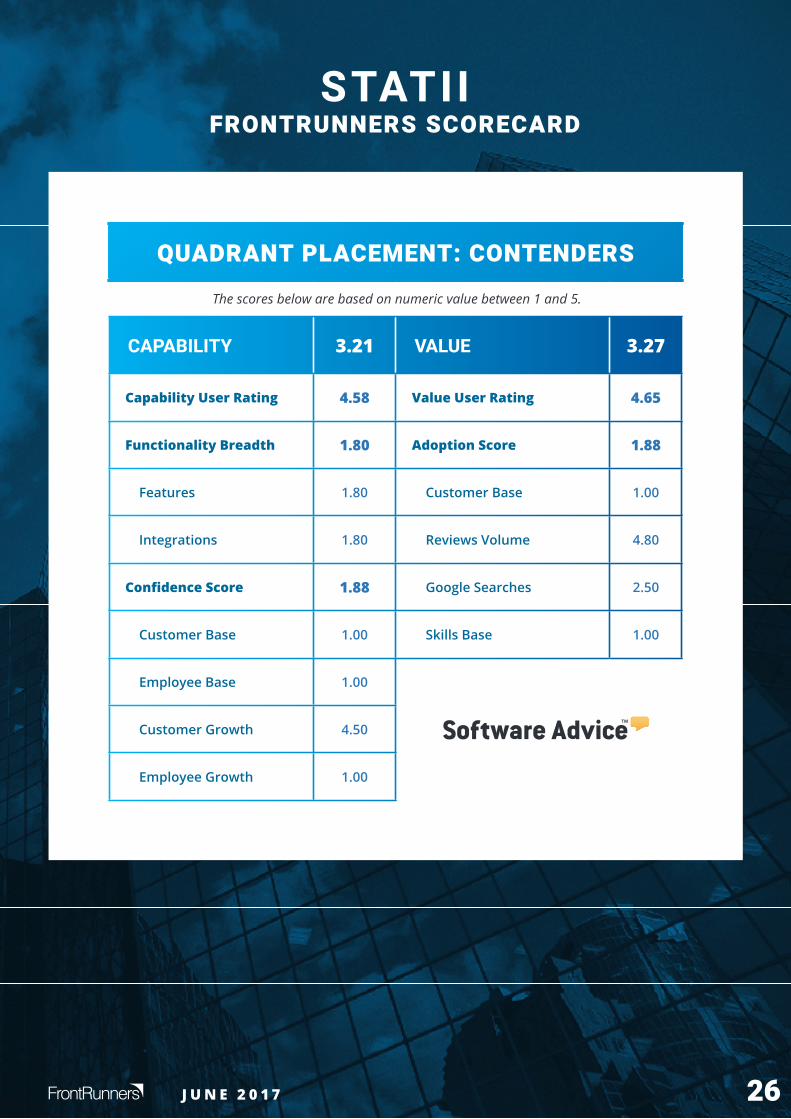
FRONTRUNNERS SCORECARDSTATII
QUADRANT PLACEMENT: CONTENDERS
3.21 3.27
4.58 4.65
1.80 1.88
1.80 1.00
1.80 4.80
1.88 2.50
1.00 1.00
1.00
4.50
1.00

27
The scores below are based on numeric value between 1 and 5.
CAPABILITY VALUE
Capability User Rating Value User Rating
Functionality Breadth Adoption Score
Features Customer Base
Integrations Reviews Volume
Confidence Score Google Searches
Customer Base Skills Base
Employee Base
Customer Growth
Employee Growth
J U N E 2 0 1 7
FRONTRUNNERS SCORECARDDATACOR CHEMPAX
QUADRANT PLACEMENT: CONTENDERS
3.14 3.25
4.21 4.10
1.35 2.40
1.50 2.50
1.20 2.80
2.80 1.00
2.50 2.80
1.80
1.90
5.00

28
The scores below are based on numeric value between 1 and 5.
CAPABILITY VALUE
Capability User Rating Value User Rating
Functionality Breadth Adoption Score
Features Customer Base
Integrations Reviews Volume
Confidence Score Google Searches
Customer Base Skills Base
Employee Base
Customer Growth
Employee Growth
J U N E 2 0 1 7
FRONTRUNNERS SCORECARDSOLUMINA
QUADRANT PLACEMENT: MASTERS
3.03 3.33
3.73 4.08
1.70 2.58
1.00 2.20
2.40 1.20
2.95 2.50
2.20 3.70
2.50
3.40
3.70

29
The scores below are based on numeric value between 1 and 5.
CAPABILITY VALUE
Capability User Rating Value User Rating
Functionality Breadth Adoption Score
Features Customer Base
Integrations Reviews Volume
Confidence Score Google Searches
Customer Base Skills Base
Employee Base
Customer Growth
Employee Growth
J U N E 2 0 1 7
FRONTRUNNERS SCORECARDECI M1
QUADRANT PLACEMENT: CONTENDERS
2.99 3.30
3.77 3.61
1.80 2.98
2.40 3.40
1.20 3.30
2.63 1.00
3.40 3.40
3.00
1.90
2.20

30
The scores below are based on numeric value between 1 and 5.
CAPABILITY VALUE
Capability User Rating Value User Rating
Functionality Breadth Adoption Score
Features Customer Base
Integrations Reviews Volume
Confidence Score Google Searches
Customer Base Skills Base
Employee Base
Customer Growth
Employee Growth
J U N E 2 0 1 7
FRONTRUNNERS SCORECARDMADE2MANAGE ERP
QUADRANT PLACEMENT: CONTENDERS
3.01 3.23
3.41 3.42
2.75 3.03
4.00 3.10
1.50 4.20
2.48 2.80
3.10 2.50
3.10
1.80
1.90

31
The scores below are based on numeric value between 1 and 5.
CAPABILITY VALUE
Capability User Rating Value User Rating
Functionality Breadth Adoption Score
Features Customer Base
Integrations Reviews Volume
Confidence Score Google Searches
Customer Base Skills Base
Employee Base
Customer Growth
Employee Growth
J U N E 2 0 1 7
FRONTRUNNERS SCORECARDEPICOR MANUFACTURING
QUADRANT PLACEMENT: CONTENDERS
3.03 3.04
3.47 3.43
2.75 2.65
4.00 2.10
1.50 3.40
2.45 3.90
2.10 2.20
3.70
1.30
2.70

32
The scores below are based on numeric value between 1 and 5.
CAPABILITY VALUE
Capability User Rating Value User Rating
Functionality Breadth Adoption Score
Features Customer Base
Integrations Reviews Volume
Confidence Score Google Searches
Customer Base Skills Base
Employee Base
Customer Growth
Employee Growth
J U N E 2 0 1 7
FRONTRUNNERS SCORECARDPBS MANUFACTURING
QUADRANT PLACEMENT: CONTENDERS
3.02 2.79
4.40 4.27
1.10 1.32
1.20 1.20
1.00 2.10
2.18 1.00
1.20 1.20
1.60
1.00
4.90

33J U N E 2 0 1 7
Providers listed as Runners Up were considered for inclusion in the quadrant, but were ultimately
not included for one or more reasons: they did not have enough reviews; they did not meet the reviews score minimum; they did not meet the ultimate Value and Capability minimum scores; or they did not meet our functionality requirements for the market.
RUNNERS UP
Ability 585 ERP
Adjutant
Aegis FactoryLogix MES
AIM Vision
AIMS
AMT
Asprova
BatchMaster ERP
bcFood
Cosential
CSB-System
Cybake
DBA Manufacturing
De Facto ERP
Delfoi Planner
DELMIA Ortems Agile Manufacturing
Deskera MRP
Enterprise 21 ERP
Epicor ERP
Epicor Manufacturing Express Edition
ERP MARK 7
ERP123
EVO~ERP
Exact Globe
Exact JobBOSS
Exact MAX
Exact Online
Expandable ERP
FactoryTalk
Fitrix ERP
FORCAM FORCE
Genius Manufacturing
Henning Visual EstiTrack ERP
In-Style ERP

34J U N E 2 0 1 7
RUNNERS UP
Infor Discrete Manufacturing Essentials
Infor ERP
Infor M3 Enterprise Management System
Infor Process Manufacturing Essentials
InterLink QMS Platform
Intuitive ERP
JOBSCOPE
JustFoodERP
Kenandy Cloud ERP
Kinaxis RapidResponse
Kosmas
LillyWorks
Mestec Cloud MES
MISys Manufacturing
MRPEasy
NetSuite Inventory Management
NetSuite Manufacturing Edition
NGIMES
NolaPro
OASIS by IntelliTek
Oneir
Optessa
Oracle E-Business Suite
Oracle SCM Cloud
Planvisage SCM
PolyPM
Precision Manufacturing
ProcessPro Premier
ProfitFab ERP
PropulsionMRP
QAD Cloud ERP
QT9 Quality Management Software
Rapid Response Manufacturing
Resource Manager DB
Ross - ERP
S2K Enterprise
Sage X3
SAP Anywhere
SAP Business ByDesign
Schedlyzer
SCP 4.0
Sequence Enterprise
Shopfloor-Online
shopVOX
ShopVue
Simio
Slingshot Enterprise Business Suite
SMARTer Manager
SyteLine
Tactic

35J U N E 2 0 1 7
The Decision Builder
The Plex Manufacturing Cloud
ToolTrack
Turnsmith
WIPtrac
WorkWise ERP
RUNNERS UP

36J U N E 2 0 1 7
The FrontRunners methodology assesses and calculates a score for products on two primary
dimensions: Capability on the x-axis and Value on the y-axis.
THE CAPABILITY SCORE IS AN OVERALL WEIGHTED AVERAGE OF SCORES INCLUDING:
» End-user ratings of one to five stars on the product’s functionality.
» End-user ratings of one to five stars on the product’s ease of use.
» End-user ratings of one to five stars on the product’s customer support.
» A score, relative to other products in the market, for the product’s inclusion of key functionality for the software category.
» A score, relative to other products in the market, representing the number of other products that integrate with it.
METHODOLOGY BASICS

M E T H O D O L O G Y B A S I C S
37J U N E 2 0 1 7
THE VALUE SCORE IS AN OVERALL WEIGHTED AVERAGE OF SCORES INCLUDING:
» End-user ratings of one to five stars on overall satisfaction with the product.
» End-user ratings of one to five stars on how valuable users consider the product to be relative to its price.
» End-user ratings of one to five stars on how likely they are to recommend the product to others.
» A score, relative to other products in the market, for the size of the product’s customer base.
» A score, relative to other products in the market, for the number of professionals in the market who have experience with the product (e.g., users, developers, administrators).
» A score, relative to other products in the market, representing the total number of user reviews across the three Gartner web properties.
» A score, relative to other products in the market, representing the average number of times per month internet users search for the product on Google.

M E T H O D O L O G Y B A S I C S
38J U N E 2 0 1 7
Markets are defined by a core set of functionality, and products considered for, and included in, FrontRunners must offer that core set of functionality. Additional related functionality can contribute to the capability score for a product. To qualify for consideration in a FrontRunners quadrant, a product must have a minimum number of unique, user-submitted product reviews across the three Gartner Digital Markets web properties: softwareadvice.com, capterra.com and getapp.com. The minimum number of reviews required per product may differ by category, but will generally be between 10 and 20 unique reviews.

¨