MANUFACTURING QA/QC SOLUTIONS - PerkinElmer · 2019-02-18 · a Pharma Manufacturing QA/QC...
47
Pharma Manufacturing QA/QC Solutions Compendium MANUFACTURING QA/QC SOLUTIONS PHARMA
Transcript of MANUFACTURING QA/QC SOLUTIONS - PerkinElmer · 2019-02-18 · a Pharma Manufacturing QA/QC...

Pharma Manufacturing QA/QC Solutions Compendium
MANUFACTURING QA/QC SOLUTIONS
PHARMA

a
Pharma Manufacturing QA/QC Solutions Compendium
Table of Contents
Pharmaceutical Assay and Multicomponent Analysis using the LAMBDA 365 .................................3
FT-IR Imaging Capabilities in Pharmaceutical and Biopharmaceutical Segment for Impurity Characterization Studies ................................................................................7
Testing and Validation of Antacids for Class 1 and Class 2 Elemental Impurities ............................11
Identification of Counterfeit Statins by Near-Infrared Spectroscopy ................................................16
Identification of Counterfeit Phosphodiesterase Inhibitors using NIR Spectroscopy and Chemometrics .............................................................................................20
Validation of the Performance of the PerkinElmer FL 6500 and FL 8500 Fluorescence Spectrometers for Pharmaceutical and Industrial Analysis ..........................................24
High Resolution Characterization of Pharmaceutical Polymorphs Using Power Compensation DSC .............................................................................................................27
Spectral Transmission of Pharmaceutical Containers in Accordance with USP 671 ..........................30
Spectrum Two N FT-NIR Pharma Raw Materials Identification .......................................................33
Analysis of Pharmaceutical Raw Materials Through Packaging Using an FT-NIR Fiber Optic Probe ................................................................................................................38
Residual Solvents In Pharmaceuticals by USP Chapter <467> Methodology ..................................41

Authors:
Kathryn Lawson-Wood
Ian Robertson
PerkinElmer, Inc. Seer Green, England
A P P L I C A T I O N N O T E
UV/Visible Spectroscopy
Introduction Combination drugs containing Paracetamol and Aspirin, displayed in Figure 1, are widely used analgesics with anti-inflammatory properties for treatment of migraines.
Both active ingredients have a similar mode of action, whereby they inhibit the cyclooxygenase (COX) enzyme, by preventing the production of prostaglandins which cause pain, inflammation, and fever. UV/Vis spectrometry is a fast and commonly used technique in quality control laboratories for routine analysis of purity and quantity of components within various stages of a product’s manufacture in many industries.
Pharmaceutical Assay and Multicomponent Analysis using the LAMBDA 365 UV/Vis Spectrophotometer
3

2
Title 21 of the Code of Federal Regulations (CFR), which establishes the Food and Drug Administration (FDA) regulations to ensure traceability, requires FDA-regulated industries to keep electronic records, audits, and documentation for systems used, and also to perform installation, operational, and performance qualification (IQ/OQ/PQ).1 This application describes the efficient use of the LAMBDA 365™ in determining the quantity and percent assay of Paracetamol according to U.S. Pharmacopeia’s (USP) methods, and component concentration in pharmaceutical formulations, while achieving 21 CFR Part 11 compliance.
Principle
Single component pharmaceutical assays can be determined using single-point standardization, which involves measuring the absorbance spectrum of a standard solution of the reference sample and a sample solution. The Beer-Lambert law, as shown in Equation 1, states that the absorbance of a particular species in a sample is directly proportional to the concentration of the absorbing species, providing the pathlength of the sample remains constant. As a result, the concentration of the single component in the sample can be determined from this relationship.
Equation 1 Beer-Lambert law (A – absorbance, ɛ – molar extinction
coefficient, c – concentration, l – pathlength) A = ɛ. c. l
This proportionality remains valid for multicomponent samples that contain more than one absorbing species. In a mixture, the absorbance at a particular wavelength is equal to the sum of the individual absorbance contributions from each absorbing species at that wavelength. As a result, for assay of substances in multicomponent samples, a simultaneous equation method can be used to determine the concentration of each component as shown below for a binary mixture (x and y).3
A' (x + y) = A' x + A' y = ɛ' x c x l + ɛ'y c y l
A" (x + y) = A" x + A" y = ɛ" x c x l + ɛ"y c y l
Where:
A' - absorbance at wavelength'
A" - absorbance at wavelength"
ɛ' - molar extinction coefficient at wavelength'
ɛ" - molar extinction coefficient at wavelength"
c - concentration
l - pathlength of sample
Paracetamol Assay
MethodParacetamol powder meeting USP specifications was obtained from Sigma-Aldrich (A5000). A stock solution of Paracetamol (100 mg/L) was prepared in a 100 mL volumetric flask by dissolving Paracetamol powder (10 mg) in 1 mL of methanol and diluting to the total volume with deionised (DI) water. A working Paracetamol standard in 100 mL was prepared by taking 10 ml of the stock solution and using DI water as the diluent. A test sample was also prepared using the same method as the working standard.4
Using UV Express™ software and the LAMBDA 365, the spectra of the working standard and test sample were scanned between 200 - 400 nm, using DI water as the blank. The absorbance of these samples was measured at the wavelength of maximum absorption (λmax) of 243 nm using the instrument parameters shown in Figure 2.
Results
Figure 1. Chemical structures of Paracetamol (left) and Aspirin (right).2
Figure 2. LAMBDA 365 instrument parameters and wavelength monitoring setup.
Figure 3. Spectrum scan of standard and test sample.
4

3
Figure 3 shows spectra of the Paracetamol standard and test sample, where the absorbance at 243 nm was determined to be 0.693 and 0.667 respectively. The quantity and percent assay of Paracetamol in the test sample was calculated using equations in 2a and 2b.
Equation 2a.
The quantity of Paracetamol in the test sample was determined to be 10.1 mg and, using this calculated value, the percent assay was determined to be 98.1%. USP 29 states a test sample should contain “not less than 98.0 percent and not more than 101.0 percent C8H9NO2, calculated on the anhydrous basis.”5 The Paracetamol test sample was found to be within this range and thus in accordance with USP methods.
Multicomponent Analysis
MethodTwo individual stock solutions of 100 mg/L Paracetamol and 100 mg/L Aspirin were prepared in 100 ml volumetric flasks by dissolving each powder (10 mg) using 0.1 M HCl as the diluent and sonicating for 20 minutes. From these stock solutions, 10 mg/L Paracetamol and Aspirin working standards were prepared in 100 ml volumetric flasks by dilution with 0.1 M HCl.
Using the Multicomponent Analysis (MCA) mode in the UV Express software, the LAMBDA 365 scan parameters were set to measure the wavelength range 200 - 400 nm. The two pure 10 mg/L Paracetamol and Aspirin solutions were measured as standards, Figure 4, in 10 mm pathlength quartz cuvettes, using 0.1 M HCl as the blank. Three sample solutions were prepared in 4 mL, using the pure Paracetamol and Aspirin solutions in varying proportions, shown in Table 1, to create two-component mixture samples. The absorbance spectrum of each sample was measured to determine the concentration of each component in the mixtures.
Results
Overlaid absorbance spectra of the pure Paracetamol and Aspirin standards are shown in Figure 5 and sample mixture spectra shown in Figure 6. Table 2 displays the calculated concentrations, using the software’s simultaneous equation algorithm, in comparison with the expected ratios. The calculated concentrations of Paracetamol and Aspirin in sample 2 are 4.82 mg/L and 5.03 mg/L respectively, close to the 5:5 expected ratio. The results show a good level of accuracy over the component concentration ranges.
Equation 2b.
Paracetamol in test sample = 10.1 mg
Parcetamol percent assay in test sample = 98.1 %
Figure 4. Multicomponent analysis setup.
Figure 5. Absorbance spectra of Paracetamol (λmax = 243 nm) and Aspirin (λmax = 228 nm) standards.
Paracetamol in test sample (mg) =
Standard sample weight (mg) ×A243 (Test sample)
A243 (Standard sample)
Paracetamol percent assay in test sample =
= 10.5 mg ×0.667
0.693
Paracetamol percent assay in test sample (mg)
Weight of test sample (mg)× 100
= × 10010.1 mg
10.3 mg
Table 1. Concentrations for 2-component mixtures.
SampleConcentration of
Paracetamol (mg/L)Concentration of Aspirin
(mg/L)
1 7.50 2.50
2 5.00 5.00
3 2.50 7.50
5

For a complete listing of our global offices, visit www.perkinelmer.com/ContactUs
Copyright ©2016, PerkinElmer, Inc. All rights reserved. PerkinElmer® is a registered trademark of PerkinElmer, Inc. All other trademarks are the property of their respective owners. 012622_01 PKI
PerkinElmer, Inc. 940 Winter Street Waltham, MA 02451 USA P: (800) 762-4000 or (+1) 203-925-4602www.perkinelmer.com
Conclusion
In this application, the percent Paracetamol assay was determined to be in accordance with the USP 29 assay test for Paracetamol, and multicomponent analysis of pharmaceutical mixtures was achieved with a high level of accuracy. The LAMBDA 365 with UV Express software enables rapid and easy determination of pharmaceutical assays, and accurate quantitative determination of multicomponent mixtures, while achieving 21 CFR Part 11 compliance. Additional software features enable the LAMBDA 365 to support a full range of applications and methods to those requiring regulatory compliance.
References
1. U.S. Department of Health and Human Services Food and Drug Administration, ‘Guidance for Industry Part 11, Electronic Records; Electronic Signatures — Scope and Application’.
2. http://www.chemspider.com/Structures of Paracetamol and Aspirin.
3. Chaudhary et al. IRJP 2011, 2 (12), 81-83 ‘Simultaneous Estimation of Multicomponent Formulations by UV-Visible Spectroscopy: An Overview’.
4. Behera et al., J Anal Bioanal Techniques 2012, 3:6, ‘UV-Visible Spectrophotometric Method Development and Validation of Assay of Paracetamol Tablet Formulation’.
5. http://www.pharmacopeia.cn/v29240/usp29nf24s0_m200.html.
Figure 6. Overlaid standard and multicomponent sample spectra.
Table 2. Calculated Paracetamol and Aspirin component concentrations.
SampleExpected Ratio (Paracetamol:
Aspirin)
Calculated Paracetamol
Concentration (mg/L)
Calculated Aspirin Concentration
(mg/L)1 7.5 : 2.5 7.25 2.58
2 5.0 : 5.0 4.82 5.03
3 2.5 : 7.5 2.42 7.33

Introduction Mid-infrared (MIR) microscopy, based on a Fourier Transform infrared (FT-IR) spectrometer, has been the infrared micro spectroscopy technique most readily available up to now. It is a broadly employed chemical identification tool that is used to complement traditional light microscopy. Since the first description
of the coupling of an infrared (IR) spectrometer to a microscope, the method has enjoyed widespread use in a variety of research and industrial applications. In practice, the method couples light microscopy and chemical identification of a spatially defined area. Typically the light microscope is used to locate the region of interest, and then it is non-invasively and non-destructively sampled with infrared radiation to provide chemical identification of the desired microscopic area within the sample. Infrared mapping techniques provided the first step toward bringing the methodology closer to imaging by translating the sample under the microscope while simultaneously recording infrared spectra.
FT-IR Imaging Capabilities in Pharmaceutical and Biopharmaceutical Segment for Impurity Characterization Studies
FT-IR Imaging
A P P L I C A T I O N N O T E
Author:
Sushant Jadav
PerkinElmer, Inc. India
7

2
In recent years we have seen an explosive growth in the applications of the FT-IR Imaging Microscope and the data resulting from these imaging systems. From materials research to the imaging of cancer cells and disease as well as uses as a quality control tool for polymers and pharmaceuticals. FT-IR imaging microscopes are now used in many different laboratories around the globe. As new challenges emerge for the analysis of samples, the FT-IR imaging system must provide a solution for these types of analyses. The FT-IR imaging system with a linear array (LA) detector provides a rapid, powerful tool for the examination of a wide array of samples and combining this flexible imaging system with advanced image processing software can easily provide visually relevant data. Imaging studies have been performed on Pharmaceutical products for the detection of solid materials (foreign material) observed in Injectibles. FT-IR Imaging has been found to be useful for the rootsource of such impurities.1-3
Experimental 1
Solid Materials (Foreign Material) Observed in Injectibles:Samples were filtered on to Whatman filter papers and dried in an oven. Small particles (Black, White and shiny) were spotted onto a filter paper and analyzed through ATR imaging.
Figure 1. Spotlight 400 with Frontier.
Figure 2. ATR imaging accessory.
Instrument Parameters:• Accessory used: ATR imaging
• Scan range: 4000 cm-1 – 750 cm-1
• No. of scans: 16 per pixel
• Resolution: 4 cm-1
• Area :200 um x 200 um / 150 um x 150 um
• Pixel: 6.25 um
Figure 4. Graph 1 – Overlay spectra of green and red area in chemical image.
Figure 3. Visible and chemical Image of foreign particle 1.
8

3
Figure 6. Graph 2- Overlay spectra of blue, red and green area.
Figure 5. Visible and chemical image of foreign particle 2.
The spectrum of the solid foreign particle is cleary indicative of its different functionality, found to be an amide based compound probably added as impurity while in production.
Experimental 2
Needle shaped particles observed in Parental formulations:Parental formulations showed some particles visible to the human eye. Samples were filtered (Vacuum filter) through 0.22 micron pore size filter papers and dried in an oven. Needle shaped particles were spotted onto filter paper and analyzed through ATR imaging.
Figure 7. Visible and chemical images of needle shaped material.
Figure 8. Graph 3- Spectra of green area.
Instrument Parameters:• Accessory used: ATR imaging
• Scan range: 4000 cm-1 – 750 cm-11
• No. of scans: 16 per pixel
• Resolution: 4 cm-1
• Area :200 um x 200 um / 150 um x 150 um
• Pixel: 6.25 um
9

For a complete listing of our global offices, visit www.perkinelmer.com/ContactUs
Copyright ©2018, PerkinElmer, Inc. All rights reserved. PerkinElmer® is a registered trademark of PerkinElmer, Inc. All other trademarks are the property of their respective owners. 014167_01 PKI
PerkinElmer, Inc. 940 Winter Street Waltham, MA 02451 USA P: (800) 762-4000 or (+1) 203-925-4602www.perkinelmer.com
Name Value
Resultin HQI 97.59
Database Abbreviation BWX
Database Title ATR-IR - Polymers and Monomers (Basic) 1 - Bio-Rad Sadtler
Record ID 303
Name Cellulose (100 micron)
CAS Registry Number 9004-34-6
Catalog Number 659
Comments White Powder
Instrument Name Bio-Rad FTS
Lot Number 290501005
Refractive Intex 1.54
Source of Sample Scientific Polymer Products, Inc.
Source of Spectrum Forensic Spectral Research
Technique ATR-Neat (DuraSampleIIR) II
Table 1. Interpretation of Green spectra through KnowItAll BIORAD software.
Figure 9. Interpretation of green area.
Interpretation of the Needle shaped particle spectra predicts the presence of cellulosic material. The company R&D team suspected the cellulosic material been added in Injectibles during the filtration process while the active solution passes through the series of filters.
Spotlight 400 FT-IR Microscope
PerkinElmer provides a full line of innovative IR Microscopy and Imaging Systems, software, sampling accessories and services to laboratories worldwide, improving product quality, productivity and analytical processes. Our spotlight 400 is capable of achieving very high spatial resolution down to within the accepted diffraction limit. Our instruments feature optics designed specifically for infrared applications and, because minimal manual adjustment is required, ease-of-use is greatly increased.
Very high sensitivity providing high quality data down to the accepted diffraction limits.
Rapid-scan IR imaging• Spatial Spotlight 400 connected to frontier FT-IR is capable of
operating in MIR, NIR or dual range as per spectral range desired from the sample analysis.
• Thus FT-IR microscope is capable of achieving resolution up to either of 3 pixel resolutions.
• Option of using microATR improved the spatial resolution by down to 1.56 microns.
Conclusion
One of the key advantages of ATR-FT-IR imaging is that it requires minimal or no sample preparation prior to spectral measurements. In this case the sample just needs to be filtered. This is due to the fact that the penetration depth of IR light in the sample for ATR measurements is independent of sample thickness.
FT-IR Imaging has excellent potential in sample characterization within the Injectibles segment of Pharma and Biopharma sector for impurity identification.
References
1. Applications of ATR-FT-IR spectroscopic imaging to biomedical samples http://www.sciencedirect.com/science/article/pii/S0005273606000630.
2. Lewis, E.N.; Schoppelrei, W.; Lee, E.; Kidder, L.; in ‘ProcessAnalytical Technology’ Blackwell, 2005. ISBN-10 1-4051-2103-3.
3. Canas, A.; Carter, R.; Hoult, R.; Sellors, J.; Williams, S.;‘ Spatial resolution in mid-IR ATR Imaging: Measurement and Meaning’ FACCS conference, 2006.

11
IntroductionThe United States Pharmacopeia (USP) has announced that its new standards for elemental impurities in drug products will be implemented on January 1, 2018. General Chapters <232> and <2232> specify the list of elements and their permissible daily exposure (PDE) limits based on
the route of administration1. USP has now harmonized the list of elemental impurities, as well as their PDEs, with the International Conference on Harmonization (ICH) Q3D Step 4 document2. In June 2016, the FDA issued guidance on elemental impurities covering ICH Q3D in drug products3.
As the deadline for assessing and monitoring elemental impurities approaches, pharmaceutical manufacturers and their service laboratories need to act now or risk not being in compliance with the new regulations. Compliance requires that the analytical methodology be capable of accurately measuring low concentrations of elemental impurities in drug products or its components, as necessary, to ensure patient safety.
Testing and Validation of Various Antacids for Class 1 and 2A Elemental Impurities in Pharmaceutical Products Following ICH Q3D and USP <232>/<233> Using the NexION 2000 ICP-MS
A P P L I C A T I O N N O T E
Author:
Aaron Hineman
PerkinElmer Inc. Shelton, CT
ICP - Mass Spectrometry

122
A list of Class 1 and 2A impurities4 and their PDEs appears in Table 1. USP General Chapter <232> outlines two analytical procedures for the determination of elemental impurities in finished drug products: inductively coupled plasma mass spectrometry (ICP-MS) or inductively coupled plasma optical emission spectroscopy (ICP-OES), along with associated sample preparation steps. The analytical capabilities of ICP-MS make it the most suitable technique for performing determinations of the Class 1 elements at these low levels on a routine basis – especially with drug products for which there is a large daily dosage (>10 g/day). Among this category of medications and supplements, antacids present a unique set of analytical challenges due to their extremely high calcium content. However, as shown in this work, these challenges can easily be overcome with correct sample preparation and instrumental design considerations.
In this paper, we present data to illustrate the successful validation of the NexION® 2000 ICP Mass Spectrometer for the determination of Class 1 and 2A elemental impurities in antacids according to USP General Chapter <233>.
Element Class Oral Daily Dose PDE (µg/day)
Cd 1 5
Pb 1 5
As 1 15
Hg 1 30
Co 2A 50
V 2A 100
Ni 2A 200
Table 1. ICH Class 1 and 2A PDEs.
StepTemperature
(°C)Pressure Max (bar)
Ramp (min)
Hold (min)
Power (%)
1 190 20 10 0 90
2 170 20 0 15 90
Cooling 50 20 1 15 0
Table 3. Titan MPS digestion program.
Type Quantity Description
Calcium based 2Over-the-counter antacid tablet, containing only calcium
Magnesium based 1Over-the-counter antacid tablet, containing only magnesium
Calcium and Magnesium based
2Over-the-counter antacid tablet, containing both calcium and magnesium
Other 3
Over-the-counter antacid tablets, containing other combinations of calcium, magnesium, sodium, or aluminum
Table 2. Antacids used in this study.
Experimental Sample Preparation The eight different antacids chosen for the evaluation represent a typical cross section of antacids available over-the-counter and are presented in Table 2.
Most antacids require digestion in order to solubilize all of the material. A typical digestion uses nitric and hydrochloric acids, but, since silica (SiO2) is present in some of the samples, a source of fluoride is required to completely solubilize the sample. Typically hydrofluoric acid or tetraethylfluoroboric acid is used.
All samples were digested using PerkinElmer’s Titan MPSTM Microwave Sample Preparation System with standard 75 mL TFM vessels.
With the exception of the powdered antacid, approximately 3-5 grams of material was crushed and homogenized. Then 0.30 ± 0.01 g of each sample was added to a digestion cup and dropped into a digestion vessel. Next, 5 mL of nitric acid (70%), 1 mL of hydrochloric acid (35%), 1 mL of hydrogen peroxide (30%), and 0.5 mL of HF (49%) were added to the digestion vessel. The vessels were allowed to sit uncapped for ten minutes to allow for any pre-reactions to occur safely before being capped and digested following the program in Table 3. When the digestion was complete, all samples were diluted with deionized water to a final volume of 50 mL, resulting in a total dilution factor of 167x with a reagent matrix of 10% HNO3, 2% HCl, and 1% HF. Calibration standards were prepared in this same matrix. To stabilize mercury, 200 ppb Au was added to each sample, standard and blank.
Instrumentation
A NexION 2000 ICP-MS (PerkinElmer Inc., Shelton, CT) was validated in this work for the analysis of antacid tablets in accordance with USP <232> and ICH Q3D. The NexION technology has been described previously5, so only a brief description will be given here. The NexION is a quadrupole-based ICP-MS system that offers the simplicity and convenience of a traditional collision cell together with the exceptional detection limits of a true reaction cell. Using the patented Universal Cell TechnologyTM (UCT), the most appropriate collision or reaction cell technique can be chosen for a specific application. By virtue of NexION’s Triple Cone Interface (TCI), Quadrupole Ion Deflector (QID) technology, and All Matrix Solution (AMS) system, productivity and ease-of-use result from minimized drift, reduced contamination of the interface region, and an absolute minimum of routine maintenance and cleaning.
133
Parameter Value
RF Power 1600 W
Plasma Flow 15 L/min
Aux Flow 1.2 L/min
Nebulizer Gas Flow 0.9 L/min
AMS Dilution 3x
Table 4. NexION 2000 ICP-MS Conditions.
Element Mass Universal Cell Mode
Internal Standard
Na 23 Collision - Helium 71Ga
Mg 24 Collision - Helium 71Ga
Al 27 Collision - Helium 71Ga
Ca 43 Collision - Helium 71Ga
V 51 Collision - Helium 71Ga
Co 59 Collision - Helium 71Ga
Ni 60 Collision - Helium 71Ga
As 75 Collision - Helium 72Ge
Cd 111 Collision - Helium 115In
Hg 202 Collision - Helium 159Tb
Pb 206 + 207 + 208 Collision - Helium 159Tb
Table 5. Elements and Masses.
For this validation, all analyses were performed on a PerkinElmer NexION 2000 ICP-MS Productivity configuration, utilizing the SMARTintro™ High Throughput/High Matrix sample introduction system in its standard operating conditions. This configuration of the NexION 2000 offers enhanced speed of analysis through the use of an in-line flow-switching valve and superior matrix tolerance using the AMS sample introduction system. The NexION’s Universal Cell was operated in helium Collision mode for all analytes and samples, demonstrating simple method setup for this analysis. The instrument conditions are shown in Table 4, and the elements and masses appear in Table 5.
Calibration
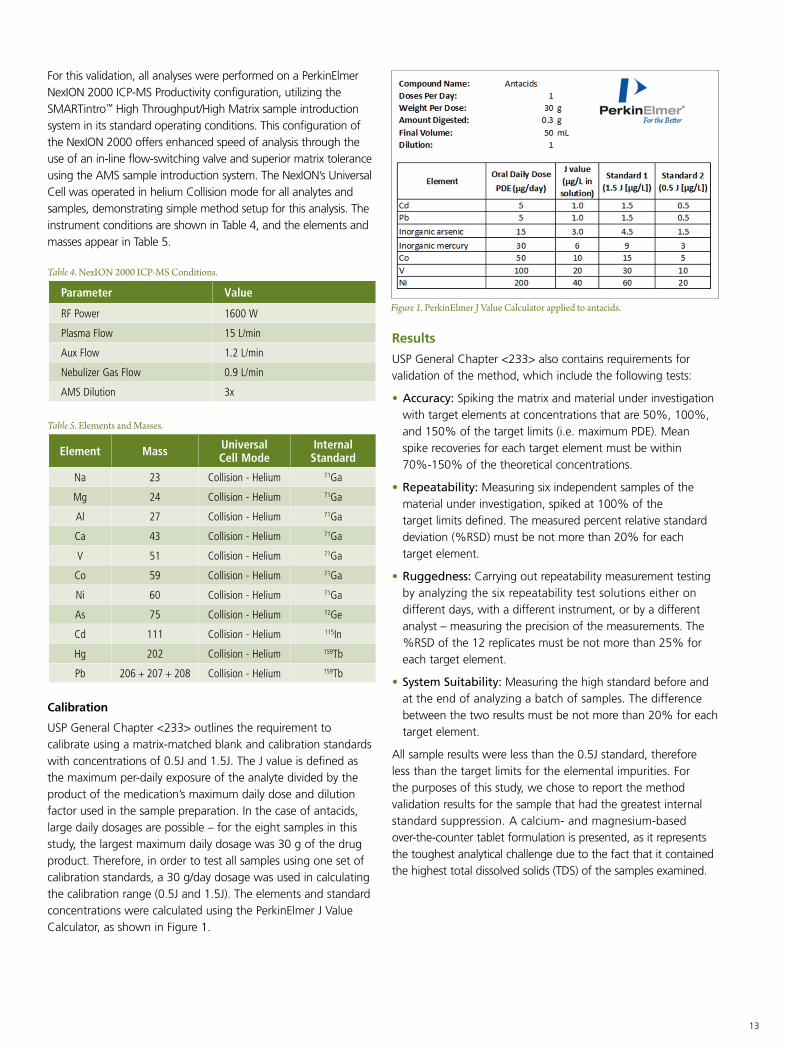
USP General Chapter <233> outlines the requirement to calibrate using a matrix-matched blank and calibration standards with concentrations of 0.5J and 1.5J. The J value is defined as the maximum per-daily exposure of the analyte divided by the product of the medication’s maximum daily dose and dilution factor used in the sample preparation. In the case of antacids, large daily dosages are possible – for the eight samples in this study, the largest maximum daily dosage was 30 g of the drug product. Therefore, in order to test all samples using one set of calibration standards, a 30 g/day dosage was used in calculating the calibration range (0.5J and 1.5J). The elements and standard concentrations were calculated using the PerkinElmer J Value Calculator, as shown in Figure 1.
Figure 1. PerkinElmer J Value Calculator applied to antacids.
Results
USP General Chapter <233> also contains requirements for validation of the method, which include the following tests:
• Accuracy: Spiking the matrix and material under investigation with target elements at concentrations that are 50%, 100%, and 150% of the target limits (i.e. maximum PDE). Mean spike recoveries for each target element must be within 70%-150% of the theoretical concentrations.
• Repeatability: Measuring six independent samples of the material under investigation, spiked at 100% of the target limits defined. The measured percent relative standard deviation (%RSD) must be not more than 20% for each target element.
• Ruggedness: Carrying out repeatability measurement testing by analyzing the six repeatability test solutions either on different days, with a different instrument, or by a different analyst – measuring the precision of the measurements. The %RSD of the 12 replicates must be not more than 25% for each target element.
• System Suitability: Measuring the high standard before and at the end of analyzing a batch of samples. The difference between the two results must be not more than 20% for each target element.
All sample results were less than the 0.5J standard, therefore less than the target limits for the elemental impurities. For the purposes of this study, we chose to report the method validation results for the sample that had the greatest internal standard suppression. A calcium- and magnesium-based over-the-counter tablet formulation is presented, as it represents the toughest analytical challenge due to the fact that it contained the highest total dissolved solids (TDS) of the samples examined.
144
Accuracy
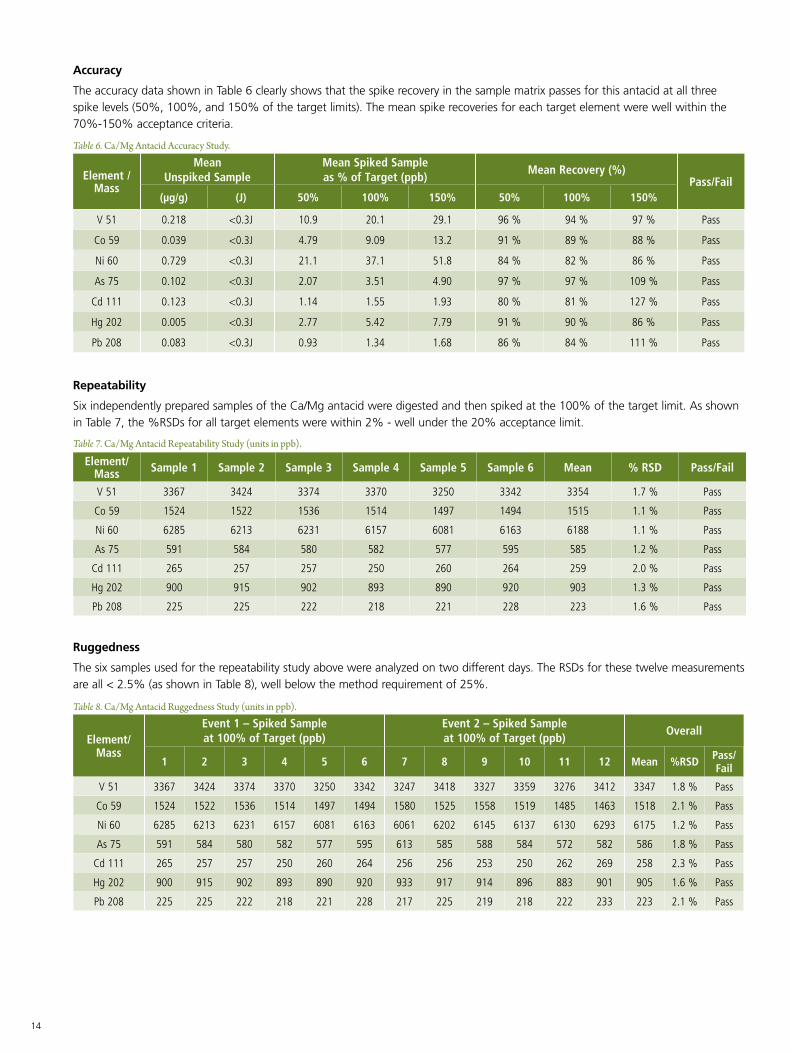
The accuracy data shown in Table 6 clearly shows that the spike recovery in the sample matrix passes for this antacid at all three spike levels (50%, 100%, and 150% of the target limits). The mean spike recoveries for each target element were well within the 70%-150% acceptance criteria.
Element / Mass
Mean Unspiked Sample
Mean Spiked Sample as % of Target (ppb)
Mean Recovery (%)Pass/Fail
(µg/g) (J) 50% 100% 150% 50% 100% 150%
V 51 0.218 <0.3J 10.9 20.1 29.1 96 % 94 % 97 % Pass
Co 59 0.039 <0.3J 4.79 9.09 13.2 91 % 89 % 88 % Pass
Ni 60 0.729 <0.3J 21.1 37.1 51.8 84 % 82 % 86 % Pass
As 75 0.102 <0.3J 2.07 3.51 4.90 97 % 97 % 109 % Pass
Cd 111 0.123 <0.3J 1.14 1.55 1.93 80 % 81 % 127 % Pass
Hg 202 0.005 <0.3J 2.77 5.42 7.79 91 % 90 % 86 % Pass
Pb 208 0.083 <0.3J 0.93 1.34 1.68 86 % 84 % 111 % Pass
Table 6. Ca/Mg Antacid Accuracy Study.
Repeatability
Six independently prepared samples of the Ca/Mg antacid were digested and then spiked at the 100% of the target limit. As shown in Table 7, the %RSDs for all target elements were within 2% - well under the 20% acceptance limit.
Element/Mass Sample 1 Sample 2 Sample 3 Sample 4 Sample 5 Sample 6 Mean % RSD Pass/Fail
V 51 3367 3424 3374 3370 3250 3342 3354 1.7 % Pass
Co 59 1524 1522 1536 1514 1497 1494 1515 1.1 % Pass
Ni 60 6285 6213 6231 6157 6081 6163 6188 1.1 % Pass
As 75 591 584 580 582 577 595 585 1.2 % Pass
Cd 111 265 257 257 250 260 264 259 2.0 % Pass
Hg 202 900 915 902 893 890 920 903 1.3 % Pass
Pb 208 225 225 222 218 221 228 223 1.6 % Pass
Table 7. Ca/Mg Antacid Repeatability Study (units in ppb).
Ruggedness
The six samples used for the repeatability study above were analyzed on two different days. The RSDs for these twelve measurements are all < 2.5% (as shown in Table 8), well below the method requirement of 25%.
Element/ Mass
Event 1 – Spiked Sample at 100% of Target (ppb)
Event 2 – Spiked Sample at 100% of Target (ppb)
Overall
1 2 3 4 5 6 7 8 9 10 11 12 Mean %RSD Pass/Fail
V 51 3367 3424 3374 3370 3250 3342 3247 3418 3327 3359 3276 3412 3347 1.8 % Pass
Co 59 1524 1522 1536 1514 1497 1494 1580 1525 1558 1519 1485 1463 1518 2.1 % Pass
Ni 60 6285 6213 6231 6157 6081 6163 6061 6202 6145 6137 6130 6293 6175 1.2 % Pass
As 75 591 584 580 582 577 595 613 585 588 584 572 582 586 1.8 % Pass
Cd 111 265 257 257 250 260 264 256 256 253 250 262 269 258 2.3 % Pass
Hg 202 900 915 902 893 890 920 933 917 914 896 883 901 905 1.6 % Pass
Pb 208 225 225 222 218 221 228 217 225 219 218 222 233 223 2.1 % Pass
Table 8. Ca/Mg Antacid Ruggedness Study (units in ppb).

For a complete listing of our global offices, visit www.perkinelmer.com/ContactUs
Copyright ©2017, PerkinElmer, Inc. All rights reserved. PerkinElmer® is a registered trademark of PerkinElmer, Inc. All other trademarks are the property of their respective owners. 013264A_01 PKI
PerkinElmer, Inc. 940 Winter Street Waltham, MA 02451 USA P: (800) 762-4000 or (+1) 203-925-4602www.perkinelmer.com
System Suitability
In order to accept the sample validation data, instrument drift is determined by measuring the high standard at the beginning and at the end of the analyses. The difference between the two results for each target element was not more than 6% for each which is below the acceptance limit of 20%, as shown in Table 9.
Element/ Mass
Event 1 Event 2
Initial Standardization
Solution 1
Final Standardization
Solution 1
Percentage Drift
Pass/ Fail
Initial Standardization
Solution 1
Final Standardization
Solution 1
Percentage Drift
Pass/ Fail
V 51 29.8 29.6 0.6 % Pass 30.4 30.2 0.5 % Pass
Co 59 14.9 15.4 -3.2 % Pass 15.1 14.6 2.9 % Pass
Ni 60 60.0 62.2 -3.5 % Pass 59.8 57.5 3.9 % Pass
As 75 4.44 4.68 -5.6 % Pass 4.53 4.59 -1.2 % Pass
Cd 111 1.47 1.48 -0.2 % Pass 1.53 1.57 -2.6 % Pass
Hg 202 9.17 9.19 -0.2 % Pass 8.87 8.86 0.0 % Pass
Pb 208 1.55 1.59 -2.2 % Pass 1.48 1.51 -2.2 % Pass
Table 9. Ca/Mg Antacid Validation Drift Study (units in ppb).
Conclusion
The PerkinElmer NexION 2000 ICP-MS with AMS was easily able to handle some of the highest-matrix drug products that will be encountered for testing. The AMS aerosol-dilution technology helps generate robust and accurate ICP-MS analysis of complex drug products such as the antacids described in this paper. The simple use of AMS reduces the total sample loading introduced to the plasma by accurately and reproducibly controlling aerosol dilution, eliminating reruns and reducing system maintenance. For the validation of the antacids, the most difficult sample material was chosen and all validation tests as per USP General Chapter <233> passed the acceptance criteria without any problems.
References
1. http://www.usp.org/usp-nf/key-issues/elemental-impurities
2. https://www.ich.org/fileadmin/Public_Web_Site/ICH_Products/Guidelines/Quality/Q3D/Q3D_Step_4.pdf.
3. http://www.fda.gov/downloads/Drugs/GuidanceComplianceRegulatoryInformation/Guidances/UCM509432.pdf.
4. “Implementation of USP New Chapters <232> and <233> on Elemental Impurities in Pharmaceutical Products”, PerkinElmer white paper, 2013.
5. “30-Minute Guide to ICP-MS”, PerkinElmer technical note.

Introduction Statins are the class of drug used to lower cholesterol in patients by inhibiting the
enzyme HMG-CoA reductase. Approved in 1996 under the brand name Lipitor®, atorvastatin was the most sold prescription drug in the US from 2007 to 2011 translating to annual revenue generation in excess of $7 billion.1 In 2011, generic forms of the drug began to emerge due to expiration of the patent held by Pfizer®.2
The statins investigated in this study were from a wide variety of geographical locations in which the prevalence of pharmaceutical counterfeiting will vary due to differing economical and regulatory conditions.
Identification of Counterfeit Statins by Near-Infrared Spectroscopy
FT-NIR Spectrometry
A P P L I C A T I O N N O T E
Authors:
Kieran Evans Kathryn Lawson-Wood
PerkinElmer, Inc. Seer Green, UK
Dr. Sulaf AssiDepartment of Archaeology, Anthropology and Forensic Science, Bournemouth University Poole, UK
16

2
Experimental
A total of 388 near-infrared spectra were collected, consisting of 196 branded authentic, 148 generic authentic and 44 counterfeit atorvastatin tablet spectra. Sample spectra were collected using a PerkinElmer Spectrum Two N™ FT-NIR spectrometer (Figure 1) with the Near-Infrared Reflectance Module (NIRM) using the experimental parameters shown in Table 1. The tablets were measured as received on both sides, such that the tablet was rotated after each measurement.
The PerkinElmer AssureID™ software package was used to develop a SIMCA (Soft Independent Modelling of Class Analogy) model using 329 of the authentic atorvastatin samples, covering all six of the geographic regions. A 13-point second order derivative baseline correction, MSC normalization, and noise weighting filter were used for spectral pre-processing. The SIMCA algorithm uses Principal Component Analysis (PCA) to model variation within a sample set or class. The resulting PCA model is used to set statistical boundaries describing the multi-dimensional space occupied by the material class. If more than one class of material is inputted into the SIMCA algorithm, a PCA model is generated for each specified material class. If the unknown sample does not belong to any of the material classes in the SIMCA model then it is not assigned to a material class. Figure 3 shows the SIMCA model created using authentic atorvastatin.
It can be clearly seen from Figure 3 that the points cluster into two distinct groups. These groups are branded (right) and generic (left). The reason for this is likely due to the difference in the excipients present in branded and generic versions of the drug (Table 2).3
Parameter Value
Spectral Resolution 8 cm-1
Number of Scans 32
Scan Range 10000 – 4000 cm-1
Table 1. Experimental parameters for sample measurements.
Figure 1. Spectrum Two N with Near-Infrared Reflectance Module (NIRM).
Figure 2. Geographic origins of atorvastatin samples.
The samples measured in this study were obtained from various geographical locations in order to provide a comprehensive representation of atorvastatin worldwide (Figure 2).
Figure 3. SIMCA model of authentic atorvastatin tablets.
Branded Generic
Calcium carbonate, microcrystalline cellulose, lactose monohydrate, croscarmellose sodium, polysorbate 80, hydroxypropyl cellulose and magnesium stearate, hypromellose, macrogol 8000, titanium dioxide (E171), talc, simethicone emulsion containing simethicone, stearate emulsifiers (polyethylene glycol sorbitan tristearate, polyethoxylate stearate, glycerides), thickeners (methylcellulose, xanthan gum), benzoic acid, sorbic acid
Microcrystalline cellulose (E460), Lactose monohydrate, Colloidal anhydrous silica, Croscarmellose sodium (E468), Sodium hydrogen carbonate, Sodium carbonate, anhydrous, Hyproxypropylcellulose (E463), Magnesium stearate (E470b), Butylhydroxyanisole, Butylhydroxytoluene, Opadry White YS-1-7040 (Hypromellose (E464), macrogol 8000, titanium dioxide (E171), talc (E553b)
Table 2. Comparison of excipients present in branded and generic atorvastatin.
17

3
Results
To validate this model, the Verify command in the Spectrum 10 software was used to categorize 15 authentic and 44 counterfeit tablet spectra. The Verify command allows methods developed in the AssureID Software to be run with the Spectrum software. The Verify algorithm was successful in identifying 100% of validation samples correctly (Table 3).
The distance ratio is the total distance from the model against the critical distance (or threshold value) with the pass/fail limit in this case being 1.0000. This limit may be raised or lowered in AssureID to reduce the occurrence of false negatives or false positives given by the model.
Categorization of Suspect Atorvastatin Tablets
In addition to verifying the identity of a drug, SIMCA models can be used as an initial screening for tablets of unknown authenticity. To test this, 80 spectra of ‘suspect’ tablets were measured using the same parameters as those shown in Table 1 and have been placed into groups based on sample location. The details of the origins of these tablets are shown in Table 4.
In a scenario where the samples being analysed have completely unknown authenticity, it would be useful to have a simple method in which the sample may be classified as ‘Authentic’, ‘Counterfeit’ or ‘Suspect’. In this study, a sample is categorized as ‘Suspect’ when the distance ratio falls between 0.9000 and 1.5000. The results found by using this method are shown in Table 5.
It is likely that sample E is from a low quality batch and thus has been placed in multiple categories. A key application of this method would be as an initial screen for counterfeit drugs, largely reducing the number of samples needing to be analysed by a technique such as GC-MS. Sample E provides an excellent example of a batch which would need to undergo further analysis.
With the Spectrum Touch software, a method may be implemented to give fast and accurate results regarding the authenticity of the atorvastatin sample, classifying it as ‘Authentic’, ‘Counterfeit’ or ‘Suspect’. Figure 4 shows an example result from a touch method in which the sample is identified as counterfeit.
% Samples Identified Correctly
Average Distance Ratio (Range)
Authentic Counterfeit Authentic Counterfeit
100 100 0.8222 (0.6948 - 0.8962)
5.3753 (3.2367 - 7.4023)
Table 3. Average distance ratios of the validation samples from the authentic atorvastatin model.
Sample Group
Location Branded/Generic
A Egypt Generic
B Egypt Generic
C Jordan Generic
D Lebanon Generic
E Lebanon Branded
F Saudi Arabia Generic
Table 4. Characteristics of suspect atorvastatin samples.
Sample% Identified as Authentic
% Identified as Counterfeit
% Identified as Suspect
A - 100 -
B - 100 -
C - 100 -
D - 100 -
E 60 - 40
F - 100 -
Table 5. % of each sample characterized as authentic, counterfeit and suspect.
Figure 4. Verify results from a counterfeit atorvastatin spectrum imported to Spectrum Touch.
18

For a complete listing of our global offices, visit www.perkinelmer.com/ContactUs
Copyright ©2018, PerkinElmer, Inc. All rights reserved. PerkinElmer® is a registered trademark of PerkinElmer, Inc. All other trademarks are the property of their respective owners. 014112_01 PKI
PerkinElmer, Inc. 940 Winter Street Waltham, MA 02451 USA P: (800) 762-4000 or (+1) 203-925-4602www.perkinelmer.com
Conclusion
The PerkinElmer Spectrum Two N with the Spectrum 10 and AssureID software packages provides a fast and non-destructive method for the determination of the authenticity of atorvastatin tablets. Furthermore, Spectrum Touch may be used to implement a simple, workflow based approach to the identification of suspect and counterfeit atorvastatin.
References
1. C. W. Lindsley, The Top Prescription Drugs of 2012 Globally: Biologics Dominate, But Small Molecule CNS Drugs Hold on to Top Spots, ACS Chem. Neurosci., 2013, 4(6), 905-7.
2. J. Luo, J. D. Seeger, M. Donneyong, J. J. Gagne, J. Avorn, A. S. Kesselheim, Effect of Generic Competition on Atorvastatin Prescribing and Patients’ Out-of-Pocket Spending, JAMA Intern Med., 2016, 176(9), 1317-1323.
3. The Electronic Medicine Compendium eMC, https://www.medicines.org.uk/emc/ (Accessed 03/09/18).
‘Verify Details’ may be used in order to see parameters such as the distance ratio limit (in this case set to 1.0000), model distance and residual distance from the SIMCA model of authentic atorvastatin (Figure 5).
Figure 5. Verify details from identification of counterfeit atorvastatin.
Introduction The counterfeiting of pharmaceuticals for economic gain is a growing problem in a modern society within which medicines play a major role. There are four main types of pharmaceutical counterfeits:
• Incorrect or no Active Pharmaceutical Ingredient (API)
• Incorrect concentration of the API
• Illegitimate excipients
• Falsified expiry dates
The exact number of counterfeit medicines produced/consumed each year is difficult to determine due to the usually illegitimate methods by which they are distributed. However, the scale of the problem can be represented by the fact that 20 million pills, bottles, and sachets of counterfeit medicines were seized in a five-month operation conducted by the International Criminal Police Organization in China and South-East Asia in 2009.1
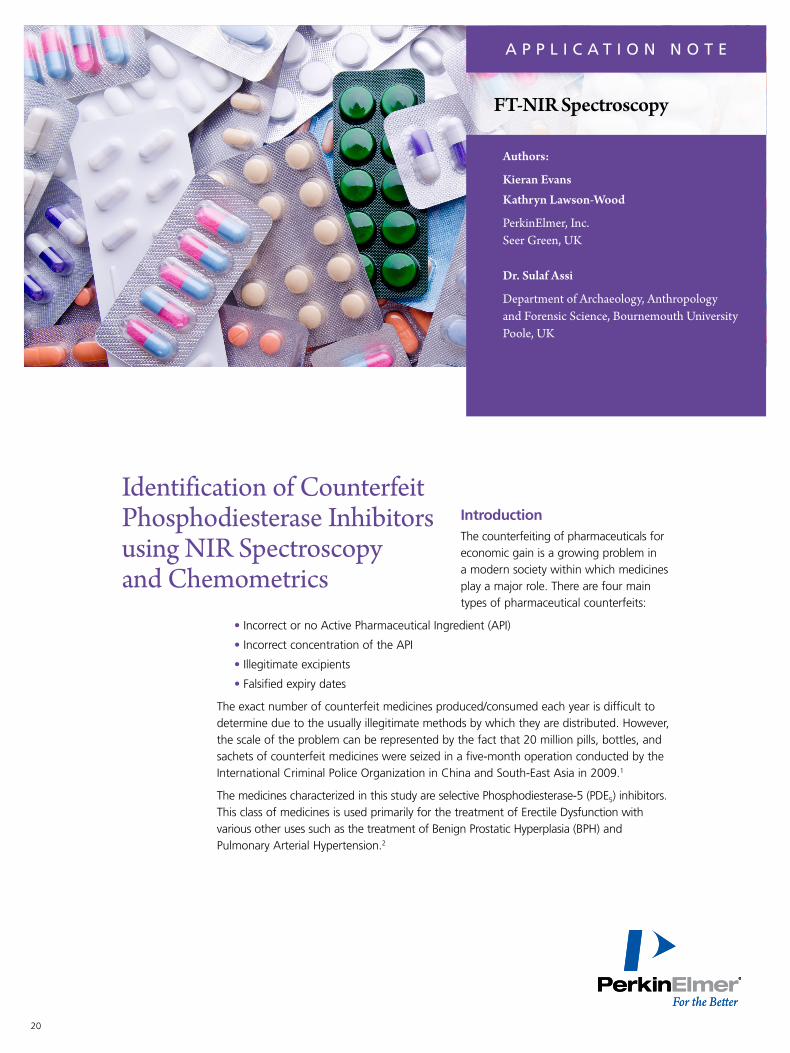
The medicines characterized in this study are selective Phosphodiesterase-5 (PDE5) inhibitors. This class of medicines is used primarily for the treatment of Erectile Dysfunction with various other uses such as the treatment of Benign Prostatic Hyperplasia (BPH) and Pulmonary Arterial Hypertension.2
Identification of Counterfeit Phosphodiesterase Inhibitors using NIR Spectroscopy and Chemometrics
A P P L I C A T I O N N O T E
Authors:
Kieran EvansKathryn Lawson-Wood
PerkinElmer, Inc. Seer Green, UK
Dr. Sulaf Assi
Department of Archaeology, Anthropology and Forensic Science, Bournemouth University Poole, UK
FT-NIR Spectroscopy
20
2
More specifically, counterfeiting of the most widely used of these three drugs (sildenafil) is a large scale problem, with nearly 80% of online sources that are claiming to sell Viagra® actually selling counterfeits. In the aforementioned study by Pfizer, materials found in the counterfeits included amphetamines, metronidazole, and illegitimate binding ingredients.3
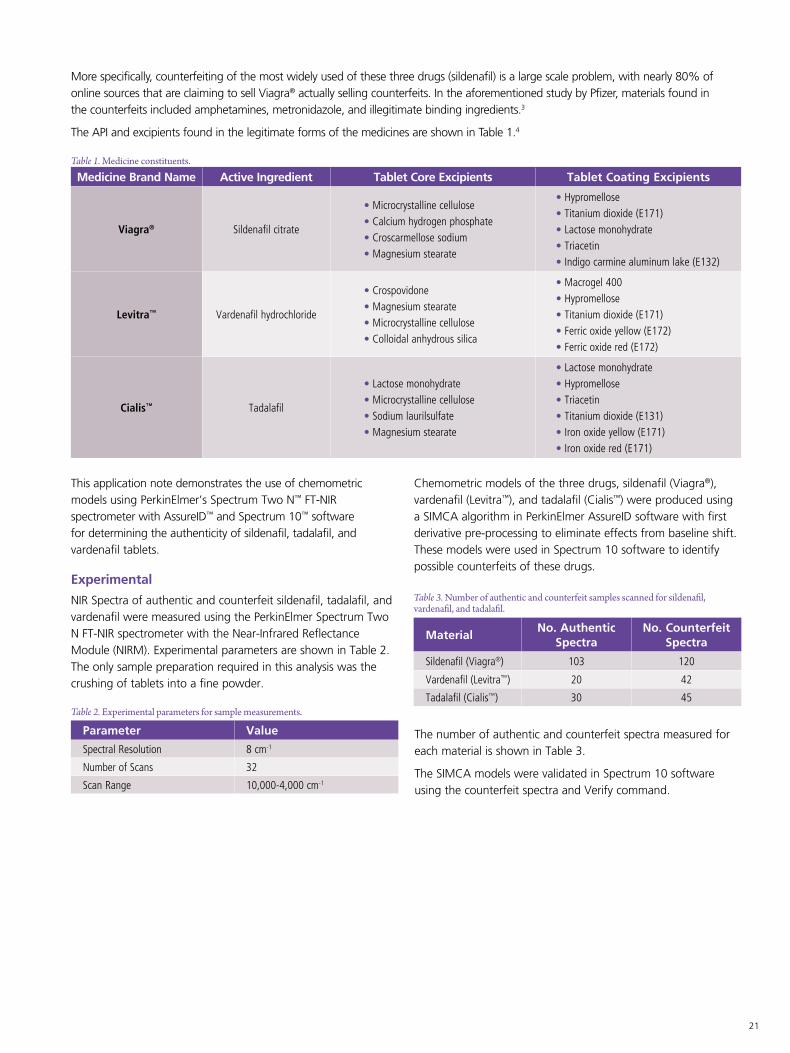
The API and excipients found in the legitimate forms of the medicines are shown in Table 1.4
Medicine Brand Name Active Ingredient Tablet Core Excipients Tablet Coating Excipients
Viagra® Sildenafil citrate
• Microcrystalline cellulose• Calcium hydrogen phosphate• Croscarmellose sodium• Magnesium stearate
• Hypromellose• Titanium dioxide (E171)• Lactose monohydrate • Triacetin• Indigo carmine aluminum lake (E132)
Levitra™ Vardenafil hydrochloride
• Crospovidone• Magnesium stearate• Microcrystalline cellulose• Colloidal anhydrous silica
• Macrogel 400• Hypromellose• Titanium dioxide (E171)• Ferric oxide yellow (E172)• Ferric oxide red (E172)
Cialis™ Tadalafil
• Lactose monohydrate • Microcrystalline cellulose• Sodium laurilsulfate• Magnesium stearate
• Lactose monohydrate• Hypromellose• Triacetin• Titanium dioxide (E131)• Iron oxide yellow (E171)• Iron oxide red (E171)
Table 1. Medicine constituents.
This application note demonstrates the use of chemometric models using PerkinElmer’s Spectrum Two N™ FT-NIR spectrometer with AssureID™ and Spectrum 10™ software for determining the authenticity of sildenafil, tadalafil, and vardenafil tablets.
Experimental
NIR Spectra of authentic and counterfeit sildenafil, tadalafil, and vardenafil were measured using the PerkinElmer Spectrum Two N FT-NIR spectrometer with the Near-Infrared Reflectance Module (NIRM). Experimental parameters are shown in Table 2. The only sample preparation required in this analysis was the crushing of tablets into a fine powder.
Parameter Value
Spectral Resolution 8 cm-1
Number of Scans 32
Scan Range 10,000-4,000 cm-1
Table 2. Experimental parameters for sample measurements.
MaterialNo. Authentic
SpectraNo. Counterfeit
Spectra
Sildenafil (Viagra®) 103 120
Vardenafil (Levitra™) 20 42
Tadalafil (Cialis™) 30 45
Table 3. Number of authentic and counterfeit samples scanned for sildenafil, vardenafil, and tadalafil.
Chemometric models of the three drugs, sildenafil (Viagra®), vardenafil (Levitra™), and tadalafil (Cialis™) were produced using a SIMCA algorithm in PerkinElmer AssureID software with first derivative pre-processing to eliminate effects from baseline shift. These models were used in Spectrum 10 software to identify possible counterfeits of these drugs.
The number of authentic and counterfeit spectra measured for each material is shown in Table 3.
The SIMCA models were validated in Spectrum 10 software using the counterfeit spectra and Verify command.
21
3
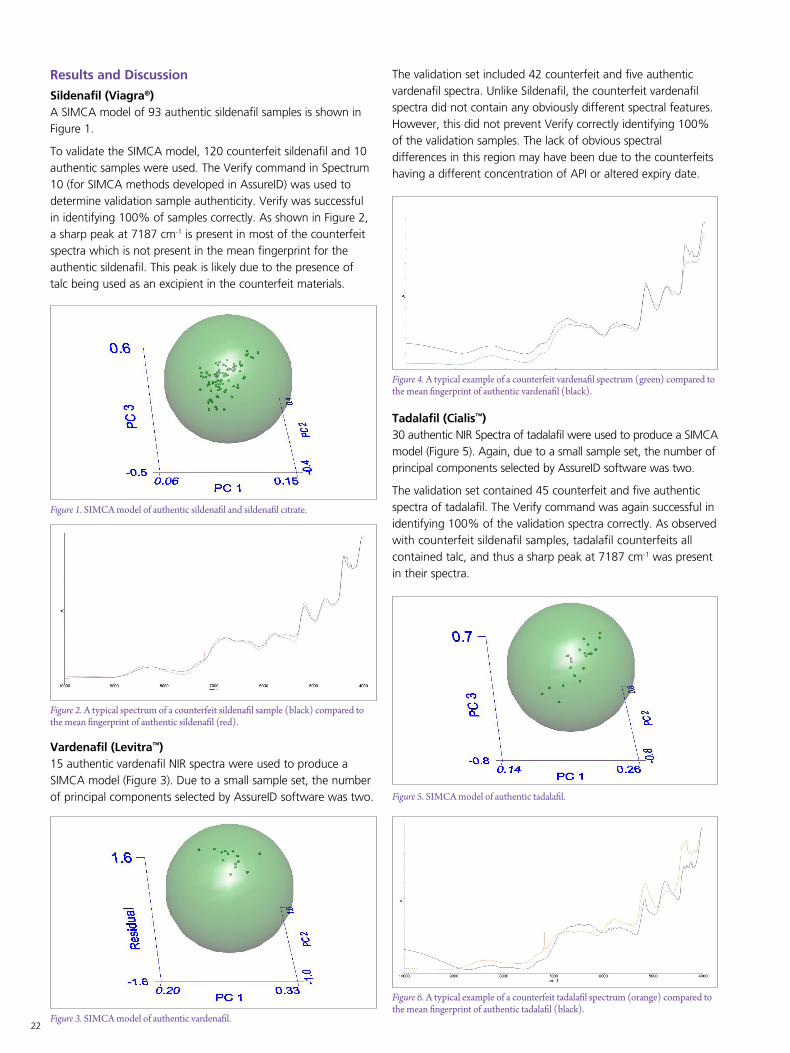
Figure 1. SIMCA model of authentic sildenafil and sildenafil citrate.
Figure 4. A typical example of a counterfeit vardenafil spectrum (green) compared to the mean fingerprint of authentic vardenafil (black).
Figure 6. A typical example of a counterfeit tadalafil spectrum (orange) compared to the mean fingerprint of authentic tadalafil (black).
Results and Discussion
Sildenafil (Viagra®)A SIMCA model of 93 authentic sildenafil samples is shown in Figure 1.
To validate the SIMCA model, 120 counterfeit sildenafil and 10 authentic samples were used. The Verify command in Spectrum 10 (for SIMCA methods developed in AssureID) was used to determine validation sample authenticity. Verify was successful in identifying 100% of samples correctly. As shown in Figure 2, a sharp peak at 7187 cm-1 is present in most of the counterfeit spectra which is not present in the mean fingerprint for the authentic sildenafil. This peak is likely due to the presence of talc being used as an excipient in the counterfeit materials.
Figure 2. A typical spectrum of a counterfeit sildenafil sample (black) compared to the mean fingerprint of authentic sildenafil (red).
Figure 3. SIMCA model of authentic vardenafil.
Figure 5. SIMCA model of authentic tadalafil.
Vardenafil (Levitra™)15 authentic vardenafil NIR spectra were used to produce a SIMCA model (Figure 3). Due to a small sample set, the number of principal components selected by AssureID software was two.
Tadalafil (Cialis™)30 authentic NIR Spectra of tadalafil were used to produce a SIMCA model (Figure 5). Again, due to a small sample set, the number of principal components selected by AssureID software was two.
The validation set contained 45 counterfeit and five authentic spectra of tadalafil. The Verify command was again successful in identifying 100% of the validation spectra correctly. As observed with counterfeit sildenafil samples, tadalafil counterfeits all contained talc, and thus a sharp peak at 7187 cm-1 was present in their spectra.
The validation set included 42 counterfeit and five authentic vardenafil spectra. Unlike Sildenafil, the counterfeit vardenafil spectra did not contain any obviously different spectral features. However, this did not prevent Verify correctly identifying 100% of the validation samples. The lack of obvious spectral differences in this region may have been due to the counterfeits having a different concentration of API or altered expiry date.
22

For a complete listing of our global offices, visit www.perkinelmer.com/ContactUs
Copyright ©2017, PerkinElmer, Inc. All rights reserved. PerkinElmer® is a registered trademark of PerkinElmer, Inc. All other trademarks are the property of their respective owners. 013874A_01 PKI
PerkinElmer, Inc. 940 Winter Street Waltham, MA 02451 USA P: (800) 762-4000 or (+1) 203-925-4602www.perkinelmer.com
Model DistancesA more quantitative depiction of the validity of the models can be shown by the distance ratio of the validation samples. This value is the ratio of the total distance from the model against the critical distance, or threshold value, with a sample only being classified within the model if the ratio is less than 1.0000. Table 4 shows the mean model distances for the validation samples of each drug.
Medicine Brand Name
% Authentic Validation Samples Identified Correctly
% Counterfeit Validation Samples Identified Correctly
Average Authentic Distance Ratio (Range)
Average Counterfeit Distance Ratio (Range)
Sildenafil 100 100 0.8328 (0.75–0.92) 11.2338 (2.63–26.11)
Vardenafil 100 100 0.5374 (0.50–0.57) 3.6330 (3.19–4.70)
Tadalafil 100 100 0.6862 (0.61–0.84) 11.5445 (8.89–18.95)
Table 4. Average distance ratios for the medicines of interest.
The Verify command can be incorporated into Spectrum Touch™ methods, allowing a workflow approach and simple routine operation. To provide a more user-friendly interface, Spectrum Touch software enables users to access methods from a menu and run them with detailed step-by-step instructions. This eliminates the need for costly and time-consuming training. An example of the output created from a Spectrum Touch workflow for the analysis of a sample using the sildenafil model is shown in Figure 7. The results page shows an easy-to-read pass/fail result, with further details such as model distance. In this example, a counterfeit sample of sildenafil is correctly identified with the interface clearly displaying various detailed results from the Verify algorithm. Alternatively, the ‘Scanalyze’ function in Spectrum 10 allows a sample to be scanned and identified using the Verify algorithm in one click.
Figure 7. Example Verify Result from a Spectrum Touch method.
Conclusion
The PerkinElmer Spectrum Two N™ FT-NIR Spectrometer allows for quick analysis of pharmaceutical materials with minimal sample preparation. PerkinElmer AssureID and Spectrum 10 software with the Verify command allow for simple yet accurate characterization of counterfeit pharmaceutical products. Additionally, for increased simplicity and a workflow-based approach, Verify can be incorporated into Spectrum Touch methods, allowing quick and simple screening of counterfeit medicines.
References
1. http://www.who.int/bulletin/volumes/88/4/10-020410/en/ (Accessed 10/06/17).
2. Huang SA, Lie JD. Phosphodiesterase-5 (PDE5) Inhibitors in the Management of Erectile Dysfunction. Pharmacy and Therapeutics. 2013; 38(7):407-419.
3. https://www.viagra.com/getting/avoid-counterfeits (Accessed 10/09/17).
4. The electronics Medicine Compendium (eMC), https://www.medicines.org.uk/emc/, (Accessed 10/20/17).

24
Introduction For certain analyses, fluorescence is the method of choice due to its superior sensitivity compared to UV/Visible
absorption spectrophotometry. Fluorescence has the potential to be more sensitive – provide that the material under investigation has a high quantum efficiency at the wavelengths being used. It is also more selective as each molecule is defined in terms of the excitation and emission wavelengths and so the instrument can be “tuned” to detect that compound.
Fluorescence is a relative technique – this means that a quantitative measurement requires a comparative measurement against a material of known concentration. This can be a single standard or it may be a series of standards. The advantage of using multiple standards is that it is possible to verify that the analysis is being conducted over the linear range and that inner filtering (self-absorption by the sample) is not occurring. The observed fluorescence intensity (often expressed as RFU – relative fluorescence units) will also depend on how the instrument is set up in terms of slits, detector gain (voltage), lamp power and so on. Different instruments (even built by the same manufacturer and using a seemingly identical optical system) will give different results and the absolute RFU values between models from different manufacturers are no indication of the quality of the instrument as each manufacturer divides up the ordinate scale differently.
Validation of the Performance of the PerkinElmer FL 6500 and FL 8500 Fluorescence Spectrometers for Pharmaceutical and Industrial Analysis
Fluorescence Spectroscopy
A P P L I C A T I O N N O T E
Author:
Steve Upstone
PerkinElmer, Inc. Seer Green, UK

252
Validation of Fluorescence Spectrometers
In the light of the considerations of the technique as previously discussed, this makes validation of the performance more challenging compared to other, more absolute, techniques such as absorption spectroscopy. Laboratories – particularly those involved in contract analysis – are working to get accreditation (eg UKAS or ISO 17025) and so need to be able to demonstrate that their instruments have been validated and are fully working for the analysis in question. Unfortunately, the pharmaceutical market (one of the biggest drivers for validation) is a small subset of a relatively (compared to absorption) market and so the range of materials and methods for testing instruments is more limited. There is a good and obvious reason why this should be the case. The sample under investigation must either fluoresce natively or be reacted (derivatized) with something that will produce a fluorescent species (eg the reaction of non-fluorescent histamine with OPA to produce a highly fluorescent complex). There also needs to be consideration of any absorbing compounds that would mask or quench the fluorescence. This, therefore, restricts the applicability of fluorescence for general QA/QC analysis.
The US Pharmacopoeia method USP<853> (which is part of USP 40)1 gives some guidelines for measuring performance of fluorescence spectrometers. The Spectrum FL software used for the FL6500 and FL8500 has a validation module which can be used to test key specifications.
Spectrum FL Validation Module
Spectrum FL is supplied with a validation module to enable key specifications to be tested. These are:
• Raman band peak position
• Raman band sensitivity
• Emission wavelength accuracy
• Emission wavelength reproducibility
• Excitation wavelength accuracy
• Excitation wavelength reproducibility
• Stray Light
The module is very intuitive and guides the user through the process. Individual tests can be selected so that there is no requirement to run all the checks each time
The validation module is shown in Figure 1.
Measuring Sensitivity
Sensitivity is determined by measuring the signal to noise of a sample of pure water by measuring the Raman Peak by fixing the excitation at 350 nm and scanning the peak at around 397 nm using 10 nm slits and then measuring the noise at the peak wavelengths.
For convenience, the water standards are sold in sealed cuvettes (in order to help prevent microbiological growth inside the cuvette over time) and the quality of the water (in terms of the electrical conductivity) may or may not be certified. Similarly, some standards carry a serial number whilst others do no not.
Figure 1. Spectrum FL Validation Module.

For a complete listing of our global offices, visit www.perkinelmer.com/ContactUs
Copyright ©2018, PerkinElmer, Inc. All rights reserved. PerkinElmer® is a registered trademark of PerkinElmer, Inc. All other trademarks are the property of their respective owners. 014185_01 PKI
PerkinElmer, Inc. 940 Winter Street Waltham, MA 02451 USA P: (800) 762-4000 or (+1) 203-925-4602www.perkinelmer.com
Measuring Stray Light
Stray light can be broadly defined as light which is present in the beam of wavelengths other than those chosen by the user. One of the biggest potential sources of stray light is white light which is generated by the intense xenon source (either pulsed or continuous) which “seeps” past the excitation monochromator and manifests itself as stray light. This can cause spectral artefacts such as small shoulders or similar features on spectra.
A triangular cell (Part Number L2251366) filled with concentrated Rhodamine 101 is used as a stray light filter and the stray light is measured at 240 nm and 300 nm.
Set of Fluorescent Blocks
We offer a set of fluorescent materials. These are not standards, as such, and are not certificated but can still be useful in terms of checking that the instrument is working correctly.
The blocks are referenced in USP<853> and so their use is ermitted as part of a validation regime in pharmaceutical labs that fall under the aegis of the USP. These blocks are made from polished PMMA and are doped with low levels of various compounds such as anthracene, p-terphenyl, ovalene, rhodamine and europium (the latter being useful for time-resolved delayed fluorescence and phosphorescence measurements).
Future Trends
Several groups are investigating alternative materials for calibrating fluorescence spectrophotometers. The German BAM Laboratory2 is investigating the use of quantum dots (nanoparticles of materials such as cadmium telluride, CdTe, which are engineered to a specific size and so will, therefore, have a precise emission wavelength).
References
1. US Pharmacopoeia, USP<853> (Part of USP 40).
2. Resch-Genger, Ute (ed.) Standardization and Quality Assurance in Fluorescence Measurements 1: Techniques, Springer Science and Business Media (2008).
Measuring Emission Wavelength Accuracy and Reproducibility
The most common way to measure instrument sensitivity is to use a sealed water cell and check the position of Rayleigh-Tyndall and Raman Peak positions. This is a very simple approach but it is the least rigorous as the observed peak positions depend on the positions of both monochromators and it is possible that they are both incorrect. Nevertheless it does serve as a useful quick check in any diagnosis of instrument wavelength accuracy.
The best approach is to use a calibrated lamp with a line emission (such as mercury (Hg) or the Hg/argon lamp) The Hg/Argon lamp gives additional lines at the red end of the range. The main advantages here are that the line sources are inviolate (ie they never move) and, as they are line sources, they are not affected by any errors due to poor emission correction – particularly at wavelengths above 650 nm which can result in apparent peak shifts of non-line emissions due to the detector cutting off the peak and causing an apparent peak shift. For a broad peak, this could cause a shift of 50 nm or more.
The main drawback of using a lamp is one of cost relative to calibrated standards but it is the best methodology available for the purpose.
Measuring Excitation Wavelength Accuracy and Reproducibility
Once the emission wavelength has been calibrated successfully, it is a relatively simple matter to calibrate the excitation wavelength. This is done by inserting a PTFE diffuser (supplied with the instrument) into the sample position and driving the emission monochromator to a series of wavelengths and scanning the excitation monochromator through each of these.
The point where the two monochromators are equal should result in a strong Rayleigh-Tindall scatter peak. This position should correspond with the fixed emission wavelength (allowing for the specified wavelength accuracy of the monochromators).
Figure 2. Sealed Water Standard(L2251293).
Figure 3. Set of Six Fluorescent Blocks (Part Number 52019600).

Introduction
Many pharmaceutical materials exhibit polymorphism, which means that, depending upon the given processing conditions, the crystalline form may exist in two or more states. The crystalline states or forms exhibit different levels of thermodynamic stabilities and an unstable form can melt at a temperature significantly less than the melting point of the thermodynamically stable form. Depending upon the conditions used to generate the crystalline form(s), the drug may exhibit one or more unstable, polymorphic crystalline states. In addition, as one state undergoes melting, it may be followed by crystallization and then melting at increasingly higher temperatures, due to the formation of a more stable state. The existence of these polymorphic crystalline states is important for many pharmaceutical materials, as they can have a major effect upon:
• Theuptakeoftheactivedrugintothebloodstreamonceingested
• Theshelflifeofthedrug.
One polymorphic form of a given drug may be more easily dissolvable or ingestible than another form and the time release of the material can sometimes by controlled by the given type and level of a particular polymorphic form. Additionally, one crystalline form may exhibit a longer shelf life than another form. It is also possible that an easily dissolvable crystalline form can convert, over time, to a less dissolvable form thus changing the pharmaceutically active properties of the drug formulation.
Thermal Analysis
a p p l i c a t i o n n o t e
High Resolution Characterization of Pharmaceutical Polymorphs Using Power Compensation DSC
DSC 8500
27

2
Experimental
The following table provides the experimental conditions used to characterize the pharmaceutical sample.
Experimental Procedure
Instrument Power Compensation DSC
Heating rates 10 ˚C/min 3 ˚C/min
Sample mass 3 mg
Sample pan Standard crimped aluminum pan
Purge gas nitrogen
Temperature range 90 to 170 ˚C
Results
Displayed in Figure 1 are the DSC results generated on the pharmaceuticalmaterialatthetypicalheatingrateof10˚C/min. The sample appears to yield a single melting endothermic peakwithanonsettemperatureof107.4˚C.Thereisnoapparent indication of polymorphic behavior.
However, a closer examination of the data reveals the presence of a small shoulder on the higher temperature end ofthemeltingpeak.ThismaybeseeninFigure2,whichpresents an enlarged view of the melting transition.
These results now show the definite presence of a shoulder at111˚Cassociatedwiththepharmaceuticalsample.Thisis a strong indicator of polymorphic behavior. The identifi-cationofapossiblepolymorphcanbeexaminedbytakingadvantage of the time dependent nature of the polymorphic transitions. Altering the DSC heating rate, which contains time dependency or velocity, can be used to help identify a possible polymorphic state.
In addition, there are financial considerations tied into the characterization and identification of different polymorphic forms of a given drug, as the different forms are patentable.
For these reasons, it is desirable to have a means of assessing the polymorphic forms exhibited by a pharmaceutical substance. Differential scanning calorimetry (DSC), particularly power compensated DSC, has proven to be an extremely valuable technique for the characterization of polymorphism in pharmaceutical materials.
Power Compensation DSC
DSC measures heat flow into or from a sample under heating, cooling or isothermal conditions. The most advanced DSC onthemarketisthePyrisDiamondDSCfromPerkinElmer.The Diamond DSC is designed using the unique power compensation approach, which yields true heat flow measurements. Because of the very low mass (<1 g) and independent furnace design of the power compensation approach,thePyrisDiamondDSCprovidesboththe required very high sensitivity and unsurpassed resolution necessary for the measurement of polymorphism exhibited by pharmaceuticals.
ThePyrisDiamondDSCofferthefollowingkeyfeatures:
• Veryhighsensitivityforthedetectionofweaktransitionsor small polymorphic forms
• Outstandingandunsurpassedresolutionforbetter separationofpolymorphicmeltingpeaks
• Thefastestheatingandcooling(upto500˚C/min)to betterstudykineticortimedependenteffects
• Useofplatinumresistancethermometer(PRT)forthemeasurement of sample temperature which provides better accuracy and reproducibility than thermocouples
• Verystablebaselineperformance
• StepScan DSC for straightforward separation of reversible and irreversible thermal processes or transitions
• Mostextensivecompliancewith21CFR, Section 11
In this study, the thermal properties of a pharmaceutical material thought to exhibit polymorphic behavior were characterizedusingthePowerCompensationDSC.
Figure 1. DSC results obtained on pharmaceutical material at a heating rate of 10 ˚C/min.
28

This particular pharmaceutical polymorphic sample was also analyzed on a high performance, competitive, heat flux DSC instrument (which features heat flow correction equations). The heat flux DSC was unable to detect the presence of the three transitions (unstable melt, crystallization and stable melt) even at slower heating rates. The heat flux DSC deviceshaveaveryhighfurnacemass(150g),whichyieldsmuchslowerresponsetimesascomparedtothePowerCompensation DSC. As the results in this study show, a DSC instrument with extremely high resolution is necessary for the successful and complete detection of polymorphism associated with many pharmaceutical materials.
Summary
ThePerkinElmerPyrisPowerCompensationDSCprovideshigh sensitivity and unsurpassed resolution necessary to detect polymorphism exhibited by many pharmaceutical materials. The observation of the polymorphic forms is important for the pharmaceutical and drug discovery industries as polymorphism can have a major effect on the release of the active drug into the bloodstream and on its shelflifetime.ThelowmassfurnacedesignofthePowerCompensation DSC provides extremely fast response times to ensure that thermal transitions are detected and well resolved.Inthisstudy,thePowerCompensationDSCwasable to pull out the polymorphic nature of a particular pharmaceutical substance. A high performance, competitive heat flux DSC instrument was unable to detect the poly-morphism (crystallization) of this particular sample.
This particular sample was analyzed using a slower heating rateof3˚C/min.TheDSCresultsobtainedattheslowerheatingratearedisplayedinFigure3.Atarateof3˚C/min,thepharmaceuticalsamplenowyieldsunmistakableevidenceof polymorphism. The material undergoes a melting trans-formationat107.2˚Cimmediatelyfollowedbyacrystallizationevent,asreflectedbytheexothermicpeakat109˚C.ADSCinstrument with extraordinarily high resolution is required to beabletodetectandresolvethecrystallizationpeak,whichoccurs so closely to the polymorphic melting transition.
Figure 2. Enlarged view of melting peak showing shoulder at 111 ˚C.
Figure 3. DSC results on pharmaceutical material at heating rate of 3 ˚C/min.
For a complete listing of our global offices, visit www.perkinelmer.com/ContactUs
Copyright ©2011, PerkinElmer, Inc. All rights reserved. PerkinElmer® is a registered trademark of PerkinElmer, Inc. All other trademarks are the property of their respective owners. 010031_01
PerkinElmer, Inc. 940 Winter Street Waltham, MA 02451 USA P: (800) 762-4000 or (+1) 203-925-4602www.perkinelmer.com

30
Introduction All medicinal products need to be protected and packaged in containers which conform to prescribed standards. The quality of pharmaceutical packaging
can have a significant impact on the performance of pharmaceutical products and can reduce shelf-life if the improper packaging is used. Packaging must:1
• Protect against all adverse external influences (e.g. moisture, light, oxygen and temperature variation) which may affect quality or potency of the product
• Protect against biological contamination
• Protect against physical damage
• Carry the correct product identification and information
The USP chapter, <671>, “Containers – Performance Testing” provides standards for the functional properties of packaging systems used for solid and liquid oral dosage forms for pharmaceuticals and dietary supplements. The test methods detailed in this chapter determine the water vapor permeation rate and spectral transmission of plastic containers.2
Spectral Transmission of Pharmaceutical Containers in Accordance with USP <671>
A P P L I C A T I O N N O T E
Authors:
Kathryn Lawson-Wood
Steve Upstone
PerkinElmer, Inc. Seer Green, UK
UV-Vis

312
The previously proposed changes to USP <671> involved moving the Spectral Transmission section into Plastic Packaging Systems for Pharmaceutical Use <661.2> in Pharmacopeial Forum (PF) 42(4) [July-Aug. 2016]. However, this change was not introduced and may be postponed until chapters <661.1> and <661.2> fully apply (May 1, 2020).3,4
This application note demonstrates the determination of spectral transmission of plastic pharmaceutical containers using the LAMBDA™ 1050 UV/Vis/NIR spectrophotometer, in accordance with USP <671>.
Method
Sections, representing the average wall thickness, were cut from three areas of an oral tablet medicine container obtained from a pharmacy. Each specimen was washed using a soft cloth dampened with methanol and the surfaces left to dry.
Samples were individually mounted, after wiping with lens tissue, in a LAMBDA 1050 UV/Vis/NIR spectrophotometer with a 150 mm InGaAs integrating sphere accessory (Figure 1). The LAMBDA 1050 was used because it allows other applications to be performed in the NIR region. However, if there is no NIR requirement, the LAMBDA 850 UV/Vis spectrophotometer is highly suited to this application. Additionally, this method allows for the use of different integrating sphere sizes. The 150 mm integrating sphere meets all international measurement guidelines, such as those set by ASTM, DIN and CIE, offering flexibility for other applications such as haze (ASTM D 1003) and high accuracy color measurements (ASTM D 308).
Figure 1. LAMBDA 1050 UV/Vis/NIR spectrophotometer with 150 mm integrating sphere accessory.
The sample section was clamped on the external port of the integrating sphere such that its cylindrical axis was parallel to the plane of the slit and approximately centred with respect to the slit (Figure 2). If the specimen is too small to cover the opening of the integrating sphere, the uncovered portion can be masked with opaque paper or masking tape, providing the length of the specimen is greater than the slit in the spectrophotometer. Alternatively, a small spot kit can be used to reduce the beam size.
UVWinLab™ software was used to take the measurements in transmission, with the instrument parameter settings shown in Figure 3. The software allows the users to set limits. In this case, a 10 % transmittance limit was set in accordance with USP <671>.
Figure 2. Integrating sphere accessory with (right) and without (left) pharmaceutical container sample mounted.
Figure 3. UVWinLab instrument parameter settings.

For a complete listing of our global offices, visit www.perkinelmer.com/ContactUs
Copyright ©2018, PerkinElmer, Inc. All rights reserved. PerkinElmer® is a registered trademark of PerkinElmer, Inc. All other trademarks are the property of their respective owners. 014421_01 PKI
PerkinElmer, Inc. 940 Winter Street Waltham, MA 02451 USA P: (800) 762-4000 or (+1) 203-925-4602www.perkinelmer.com
Conclusion
The determination of spectral transmission of plastic pharmaceutical containers was performed using the LAMBDA 1050 UV/Vis/NIR spectrophotometer and UVWinLab software, in accordance with USP <671>. The LAMBDA 850 UV/Vis spectrophotometer, however, is highly suited for this method when the user does not require the NIR region for other applications. Analysis was simple and the ability to set up limits and calculations for maximum transmittance within the software allows for rapid results to be obtained.
References
1. World Health Organization, Guidelines on packaging for pharmaceutical products (Annex 9), WHO Technical Report Series, No. 902, 2002.
2. United States Pharmacopeia and National Formulary (USP 41-NF 36), General Chapter <671>, Containers – Performance Testing.
3. https://www.gmp-compliance.org/gmp-news/revised-usp-chapter-671-containers-performance-testing-adopted. Date accessed: September 2018.
4. https://www.gmp-compliance.org/gmp-news/draft-usp-chapter-671-containers-performance-testing. Date accessed: September 2018.
Nominal Size (in mL)
Maximum Percentage of Spectral Transmission at Any Wavelength
Between 290 and 450 nm (%)
1 50
2 45
5 40
10 35
20 30
50 15
Note: For containers larger than 50 mL, the limits for 50 mL apply.
Table 1. Spectral transmission limits for plastic containers, as stated in USP <671>.
Results
As stated in USP <671>, the observed spectral transmission should not exceed the limits given in Table 1 for containers intended for parenteral use. Plastic containers intended for oral or topical administration, on the other hand, should not exceed 10 % spectral transmission at any wavelength in the range 290 – 450 nm.
In this application, the medicine container used was designed for oral administration and, therefore, the 10 % limit applies. The spectra of the three sections of the medicine container are shown in Figure 4. The maximum transmittance for all three sections was under 10 % (Table 2), and thus within the spectral transmission limit specified in USP <671>.
Figure 4. Overlaid scans of 3 sections of a medicine container.
Sample IDLimit (%T)
Max Transmittance (290 - 450 nm)
Sample 1 10 3.1
Sample 2 10 3.3
Sample 3 10 3.5
Table 2. Maximum transmittance, between 290 – 450 nm, of three sections of a pharmaceutical container.

Introduction Near-infrared (NIR) spectroscopy is an important technique for materials checking at various stages of the manufacturing process, but is particularly
useful at the raw materials inspection stage. Raw materials come in a variety of physical forms including liquids, gels, and solids, requiring a versatile instrument with convenient, interchangeable sampling modules to cater to the entire range of raw materials encountered.
Rapid identification of a material by its NIR spectrum can be achieved by comparison against a series of reference spectra for that specific material, requiring the material to be both identified and discriminated from similar materials.
Verification of Pharmaceutical Raw Materials Using the Spectrum Two N FT-NIR Spectrometer
FT-NIR Spectroscopy
A P P L I C A T I O N N O T E
Authors:
Ian Robertson
Jerry Sellors
PerkinElmer, Inc. Seer Green, UK
33

2
This application note describes how the Spectrum Two N™ FT-NIR spectrometer can be deployed using a workflow approach, suitable for a regulated environment, to overcome a range of different challenges in raw material identification while also meeting the stringent requirements of 21 CFR Part 11 compliance. NIR spectroscopy is a good technique for raw material identification of solids, allowing faster and easier sample measurements than other analytical techniques such as Raman. No sample preparation or dilution is required, and the measurements can be performed directly through glass vials or Petri dishes using a Near Infrared Reflectance accessory, such as the NIR Reflectance Module (NIRM) on the Spectrum Two N, shown in Figure 1.
The NIRM has significant performance advantages over alternative integrating sphere accessories:
• Mirror-based collection gives tight control of optical geometry, high collection efficiency, large depth of field, and can be manufactured very consistently, improving method transferability to other instruments
• Illumination beam optics provide excellent spectral uniformity across the beam
• Tighter control of (and thus lower) stray light from window and sample containers
• Stable and protected internal reference material
• Stray light and reference correction to ensure that the spectrum obtained contains only spectral features from the sample
The NIR spectral bands of materials are due to the combination and overtone bands derived from the fundamental vibrations in the mid-infrared region of the spectrum, and are still unique fingerprints for that material. Spectra of three of the raw materials are shown in Figure 2. These fingerprints allow for identification of the material by comparison against a series of reference spectra using an appropriate algorithm.
Figure 1. Spectrum Two N with NIR Reflectance Module.
Figure 2. Example NIR spectra of raw materials. Top to bottom: diclofenac (black), poloxamer (red), talc (blue).
The Spectrum software has a range of algorithms that can be deployed, the decision typically based on the complexity of the analysis. Most standard raw material identification methods use the Compare™ algorithm. Compare will measure the correlation of an unknown spectrum against a series of reference spectra and report the closest material to the unknown (a score of one is a perfect match, a score of 0 shows no correlation between the sample and reference spectra). When analyzing materials, it is important that the analysis is focussing on the spectral features of the materials. Problems arise when calculating the similarity of spectra due to:
- Reproducibility of sampling, e.g. sample repack errors with solid sampling
- Varying baselines
- Non-uniform noise distribution
These effects can be decreased by using a number of mathematical filters that reduce the contribution where the information tends to be unreliable. The net result of these filters is to enhance material-specific spectral features while minimizing spectral contributions related to instrument, sampling, and atmospheric conditions.
Compare allows Pass/Fail thresholds based on both correlation with the reference materials and discrimination from the second- best matches in the reference materials, ensuring the correct material is identified and no false positives are obtained from other reference materials.
Soft Independent Modeling Class Analogies (SIMCA) is a chemometric approach which models the variation within the collection of reference spectra for a given material, as well as the difference between spectra of different materials. This allows SIMCA to be sensitive to small spectral differences, for example impurities, even in the presence of normal batch-to-batch or sampling variations.
For ease of implementation, either of these algorithms can be deployed using a workflow approach, an example shown in Figure 3.
cm-1
34
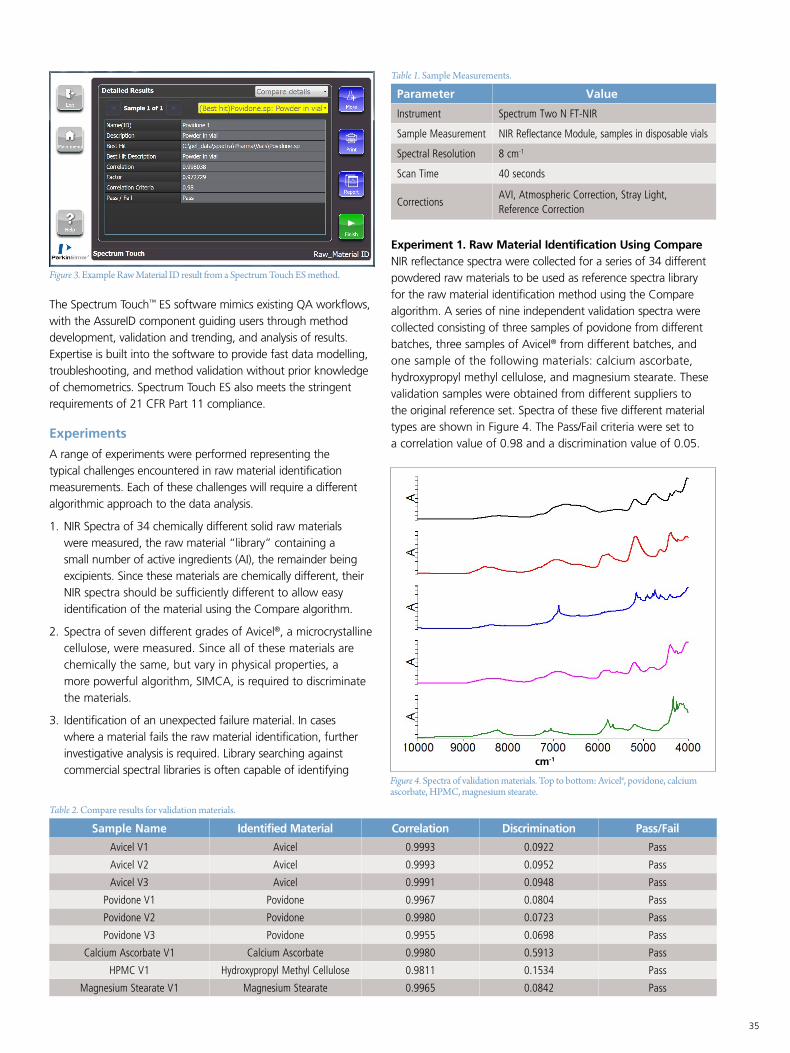
3
The Spectrum Touch™ ES software mimics existing QA workflows, with the AssureID component guiding users through method development, validation and trending, and analysis of results. Expertise is built into the software to provide fast data modelling, troubleshooting, and method validation without prior knowledge of chemometrics. Spectrum Touch ES also meets the stringent requirements of 21 CFR Part 11 compliance.
Experiments
A range of experiments were performed representing the typical challenges encountered in raw material identification measurements. Each of these challenges will require a different algorithmic approach to the data analysis.
1. NIR Spectra of 34 chemically different solid raw materials were measured, the raw material “library” containing a small number of active ingredients (AI), the remainder being excipients. Since these materials are chemically different, their NIR spectra should be sufficiently different to allow easy identification of the material using the Compare algorithm.
2. Spectra of seven different grades of Avicel®, a microcrystalline cellulose, were measured. Since all of these materials are chemically the same, but vary in physical properties, a more powerful algorithm, SIMCA, is required to discriminate the materials.
3. Identification of an unexpected failure material. In cases where a material fails the raw material identification, further investigative analysis is required. Library searching against commercial spectral libraries is often capable of identifying
Figure 3. Example Raw Material ID result from a Spectrum Touch ES method.
Figure 4. Spectra of validation materials. Top to bottom: Avicel®, povidone, calcium ascorbate, HPMC, magnesium stearate.
Sample Name Identified Material Correlation Discrimination Pass/Fail
Avicel V1 Avicel 0.9993 0.0922 Pass
Avicel V2 Avicel 0.9993 0.0952 Pass
Avicel V3 Avicel 0.9991 0.0948 Pass
Povidone V1 Povidone 0.9967 0.0804 Pass
Povidone V2 Povidone 0.9980 0.0723 Pass
Povidone V3 Povidone 0.9955 0.0698 Pass
Calcium Ascorbate V1 Calcium Ascorbate 0.9980 0.5913 Pass
HPMC V1 Hydroxypropyl Methyl Cellulose 0.9811 0.1534 Pass
Magnesium Stearate V1 Magnesium Stearate 0.9965 0.0842 Pass
Table 2. Compare results for validation materials.
Experiment 1. Raw Material Identification Using CompareNIR reflectance spectra were collected for a series of 34 different powdered raw materials to be used as reference spectra library for the raw material identification method using the Compare algorithm. A series of nine independent validation spectra were collected consisting of three samples of povidone from different batches, three samples of Avicel® from different batches, and one sample of the following materials: calcium ascorbate, hydroxypropyl methyl cellulose, and magnesium stearate. These validation samples were obtained from different suppliers to the original reference set. Spectra of these five different material types are shown in Figure 4. The Pass/Fail criteria were set to a correlation value of 0.98 and a discrimination value of 0.05.
Parameter Value
Instrument Spectrum Two N FT-NIR
Sample Measurement NIR Reflectance Module, samples in disposable vials
Spectral Resolution 8 cm-1
Scan Time 40 seconds
CorrectionsAVI, Atmospheric Correction, Stray Light, Reference Correction
Table 1. Sample Measurements.
cm-1
35

4
Figure 6. Principal Component scores plot showing separation of Avicel® grades.
Figure 5. Spectra of Avicel® samples.cm-1
Each of the spheres in the plot represents the data from each of the Avicel® grades; the further apart the spheres (larger intermaterial distance), the better the chance of discrimination. A Coomans plot, as shown in Figure 7, shows the model distances between two classes of material – in this case, Avicel® PH101 and PH102 exhibit clear separation. In this model, there are no overlaps between the grades, meaning there is less chance of misclassification.
Figure 7. Coomans plot showing separation of classes of materials.
PH10
1
Coomans
PH102
a failed material.SAMPLEAvicel
1Avicel
2Avicel
3Avicel
4Avicel
5 Avicel
6 Avicel
7 Avicel
8 Avicel
9 MEAN STD DEV
Correlation 0.99837 0.99843 0.99826 0.99836 0.99825 0.99826 0.99817 0.99819 0.99837 0.99829 9.1206E-05
Table 3. Compare results for repeat runs of Avicel.
The Compare algorithm correctly identified all of the materials as Avicel®. However, it was not able to discriminate between the different grades with all grades exceeding the Pass/Fail correlation limit. SIMCA uses a chemometric approach to spectral modelling and is capable of accounting not only for the differences between different materials, but also for the variability within the same material due to batch differences. The 63 spectra of the Avicel® samples were input into a SIMCA method to try to separate out the different grades of materials, the resultant score plot shown in Figure 6.
All of the materials exceeded the correlation and discrimination thresholds and were therefore classed as Pass materials. Since the raw materials are chemically different, their NIR spectra and Compare are easily capable of identifying the materials.
Further method validation was performed for the material Avicel® using three batches of the same grade of Avicel® PH103. A sample from each batch was placed in a glass vial. Each glass vial was then measured in triplicate shaking the sample in the vial and replacing it on the NIRM. This represents a total of nine measurements with the results shown in Table 3.
The results show excellent repeatability with minimal variation in the results.
Experiment 2. Discrimination of Closely Related MaterialsAvicel® PH is a microcrystalline cellulose product with the PH designating that it is suitable for pharmaceutical use. It has excellent compressibility and is used for tablet compression and also for wet granulation. There are several different grades of Avicel® PH – for example PH101, PH102, PH103, PH301, PH302 – that differ mainly in particle size and moisture content. Correct choice of the right grade is essential to achieve the compressibility required for tabletting or low moisture content for use with moisture-sensitive active ingredients. Since the Avicel® materials are all of the same chemical nature, their NIR spectra are almost identical making it difficult to easily discriminate the different grades. However, NIR spectra are affected by particle size and spectral features due to moisture observed.
The NIR spectra of a series of samples with different Avicel® PH grades were used to develop a SIMCA model to allow confirmation of the grade of Avicel® raw materials. Three samples were taken for each of the following grades of Avicel®: PH101, PH102, PH103, PH105, PH113, PH301, and PH302. For each of the three samples, triplicate measurements were made on the NIRM, representing nine spectra per grade and a total of 63 spectra total for the seven grades. The spectra of all of the samples are shown as Figure 5.
results sh
36
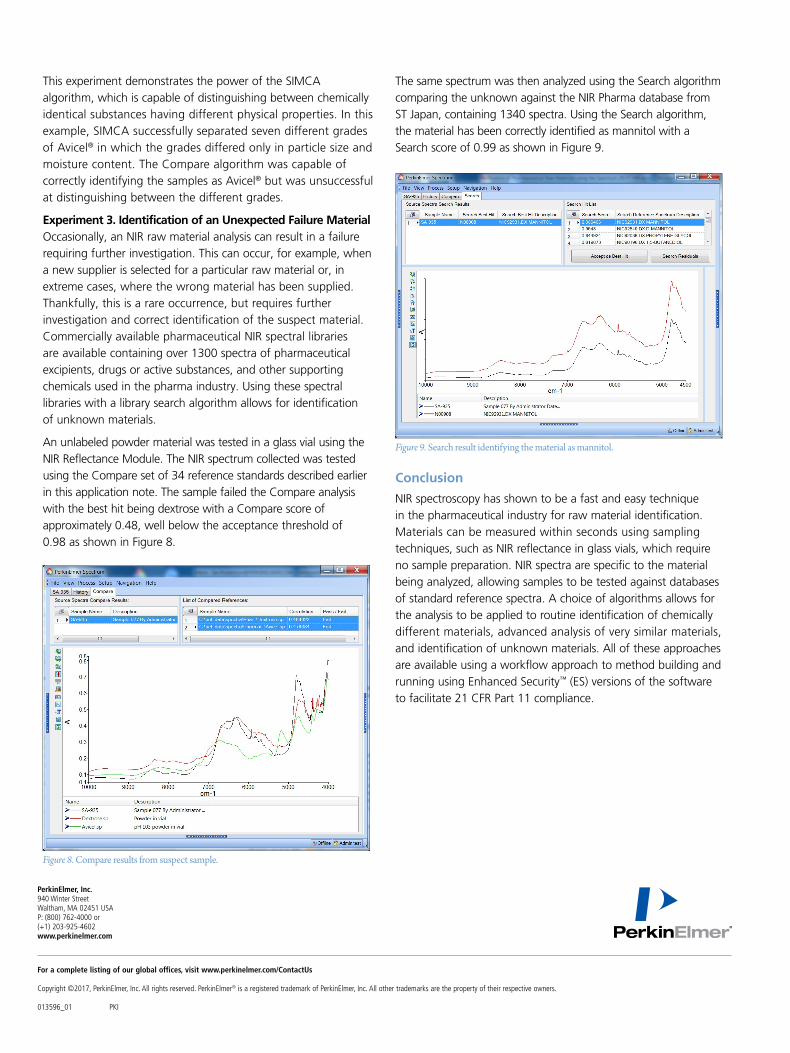
For a complete listing of our global offices, visit www.perkinelmer.com/ContactUs
Copyright ©2017, PerkinElmer, Inc. All rights reserved. PerkinElmer® is a registered trademark of PerkinElmer, Inc. All other trademarks are the property of their respective owners. 013596_01 PKI
PerkinElmer, Inc. 940 Winter Street Waltham, MA 02451 USA P: (800) 762-4000 or (+1) 203-925-4602www.perkinelmer.com
The same spectrum was then analyzed using the Search algorithm comparing the unknown against the NIR Pharma database from ST Japan, containing 1340 spectra. Using the Search algorithm, the material has been correctly identified as mannitol with a Search score of 0.99 as shown in Figure 9.
Figure 8. Compare results from suspect sample.
Figure 9. Search result identifying the material as mannitol.
Conclusion
NIR spectroscopy has shown to be a fast and easy technique in the pharmaceutical industry for raw material identification. Materials can be measured within seconds using sampling techniques, such as NIR reflectance in glass vials, which require no sample preparation. NIR spectra are specific to the material being analyzed, allowing samples to be tested against databases of standard reference spectra. A choice of algorithms allows for the analysis to be applied to routine identification of chemically different materials, advanced analysis of very similar materials, and identification of unknown materials. All of these approaches are available using a workflow approach to method building and running using Enhanced Security™ (ES) versions of the software to facilitate 21 CFR Part 11 compliance.
This experiment demonstrates the power of the SIMCA algorithm, which is capable of distinguishing between chemically identical substances having different physical properties. In this example, SIMCA successfully separated seven different grades of Avicel® in which the grades differed only in particle size and moisture content. The Compare algorithm was capable of correctly identifying the samples as Avicel® but was unsuccessful at distinguishing between the different grades.
Experiment 3. Identification of an Unexpected Failure MaterialOccasionally, an NIR raw material analysis can result in a failure requiring further investigation. This can occur, for example, when a new supplier is selected for a particular raw material or, in extreme cases, where the wrong material has been supplied. Thankfully, this is a rare occurrence, but requires further investigation and correct identification of the suspect material. Commercially available pharmaceutical NIR spectral libraries are available containing over 1300 spectra of pharmaceutical excipients, drugs or active substances, and other supporting chemicals used in the pharma industry. Using these spectral libraries with a library search algorithm allows for identification of unknown materials.
An unlabeled powder material was tested in a glass vial using the NIR Reflectance Module. The NIR spectrum collected was tested using the Compare set of 34 reference standards described earlier in this application note. The sample failed the Compare analysis with the best hit being dextrose with a Compare score of approximately 0.48, well below the acceptance threshold of 0.98 as shown in Figure 8.

Introduction The analysis of all incoming pharmaceutical raw materials is a key part of 21CFR compliance (section 211.84).1 It is therefore important to have a high-throughput method by which raw materials may be analysed in a loading bay or warehouse, while also preventing sample exposure.
The PerkinElmer Spectrum Two N™ Remote Sampling Module, also referred to as the Fiber Optic Probe, provides a means by which raw materials may be analyzed through different thicknesses and types of packaging, allowing a rapid and non-destructive method.
In this application, various commonplace pharmaceutical raw materials have been analyzed and identified through both one and two layers of clear polyethylene (PE) bags using the Spectrum Two N Remote Sampling Module and Spectrum Touch™ software.
Analysis of Pharmaceutical Raw Materials Through Packaging Using an FT-NIR Fiber Optic Probe
FT-NIR Spectroscopy
A P P L I C A T I O N N O T E
Authors:
Kieran Evans
Kathryn Lawson-Wood
PerkinElmer, Inc. Seer Green
38

2
Experimental
42 spectra were collected while pressing the fiber probe tip against either one or two layers of clear PE bag containing the raw material. Prior to sample collection, a background was taken using the probe holder containing a NIR reference material (Spectralon®). Measurements were carried out using the scan parameters shown in Table 1 with the PerkinElmer Spectrum Two N FT-NIR and Remote Sampling Module (Figure 1).
Scan Range 10000 – 4000 cm-1
Accumulations 64
Resolution 16 cm-1
Table 1. Experimental parameters used for scanning of raw material spectra with Remote Sampling Module.
Figure 1. PerkinElmer Spectrum Two N with Remote Sampling Module.
Figure 2. NIR Spectra of a) D-Mannitol though single PE layer. b) Single layer of polyethylene. c) Result when spectrum of single PE layer is subtracted from spectrum of D-Mannitol through single PE layer.
This method allows for pharmaceutical raw materials to be analyzed inside their packaging and thus requires no sample preparation or handling. Sample integrity is protected as there is no requirement to open packaging and, therefore, no exposure to airborne contaminants and moisture.
Results and Discussion
As with the raw materials, polyethylene (PE) absorbs in the near-infrared region (10,000 – 4,000 cm-1), therefore a method must be developed which incorporates the removal of this interference. Spectrum™ 10 software is capable of performing this with the ‘Arithmetic’ function with which the user may add, subtract, multiply and divide spectra using a constant value or spectrum as the operand. In this case, a spectrum of either one or two layers of the PE bag (measured against Spectralon® 99% diffuse reflectance standard) is subtracted in order to leave a spectrum of the pharmaceutical raw material. An example showing spectra of D-Mannitol, a single layer of PE and the resulting spectrum is shown in Figure 2.
This method allows for all spectral information relating to the raw material itself to be retained while removing interference from the PE bag (especially at the lower wavenumber region around 4000 cm-1).
By removing the polyethylene interference, the spectra may be used with the variety of identification tools available in Spectrum 10 including COMPARE, Search, MultiSearch and Verify.
After the appropriate PE spectrum is subtracted, the resulting spectrum is analyzed using a COMPARE algorithm with a library of pharmaceutical raw materials with correlation coefficient for a material to pass set at 0.9800. The COMPARE algorithm determines the correlation between the sample spectrum and spectra from a library, producing a ‘best hit’.
Touch Method ValidationThe method was validated using 14 spectra of seven different raw materials in the two thicknesses of PE packaging (30 µm and 60 µm), the results of which are shown in Table 3. In each case, the raw material was correctly identified with a high correlation.
SamplePackaging Thickness
(µm)
Compare Result
Correlation
Avicel30 Pass 0.9978
60 Pass 0.9995
Calcium Phosphate
30 Pass 0.9977
60 Pass 0.9989
Dextrin from Corn
30 Pass 0.9975
60 Pass 0.9980
Dextrin from Maize
30 Pass 0.9999
60 Pass 0.9998
Dextrin from Potato
30 Pass 0.9998
60 Pass 0.9988
D-Mannitol30 Pass 0.9997
60 Pass 0.9998
Talc30 Pass 0.9969
60 Pass 0.9911
Table 2. Validation results from 14 raw materials in packaging.
39

For a complete listing of our global offices, visit www.perkinelmer.com/ContactUs
Copyright ©2018, PerkinElmer, Inc. All rights reserved. PerkinElmer® is a registered trademark of PerkinElmer, Inc. All other trademarks are the property of their respective owners. 014259_01 PKI
PerkinElmer, Inc. 940 Winter Street Waltham, MA 02451 USA P: (800) 762-4000 or (+1) 203-925-4602www.perkinelmer.com
Figure 3. Touch method result from the analysis of D-Mannitol in a double layer PE bag.
Spectrum Touch software enables users to access methods from a menu and run them with detailed step-by-step instructions, thus eliminating the need for costly and time-consuming training. An example result from a Touch method successfully identifying D-Mannitol in a double layer PE bag is shown in Figure 3.
This method may also be implemented into a QA/QC pharmaceutical environment using Spectrum Touch, with the enhanced security (ES) version of the software ensuring 21CFR part 11 compliance.
Conclusion
The PerkinElmer Spectrum Two N FT-NIR spectrometer with Remote Sampling Module ensures rapid and non-destructive identification of raw materials through multiple layers of PE packaging. Analysis can be conducted anywhere, including loading bays without concern for potential contamination. Additionally, when used in conjunction with Spectrum Touch, a workflow-oriented method is implemented allowing users of any background to analyze materials.
Reference
1. https://www.accessdata.fda.gov/scripts/cdrh/cfdocs/cfcfr/CFRSearch.cfm (Accessed 14/02/18)
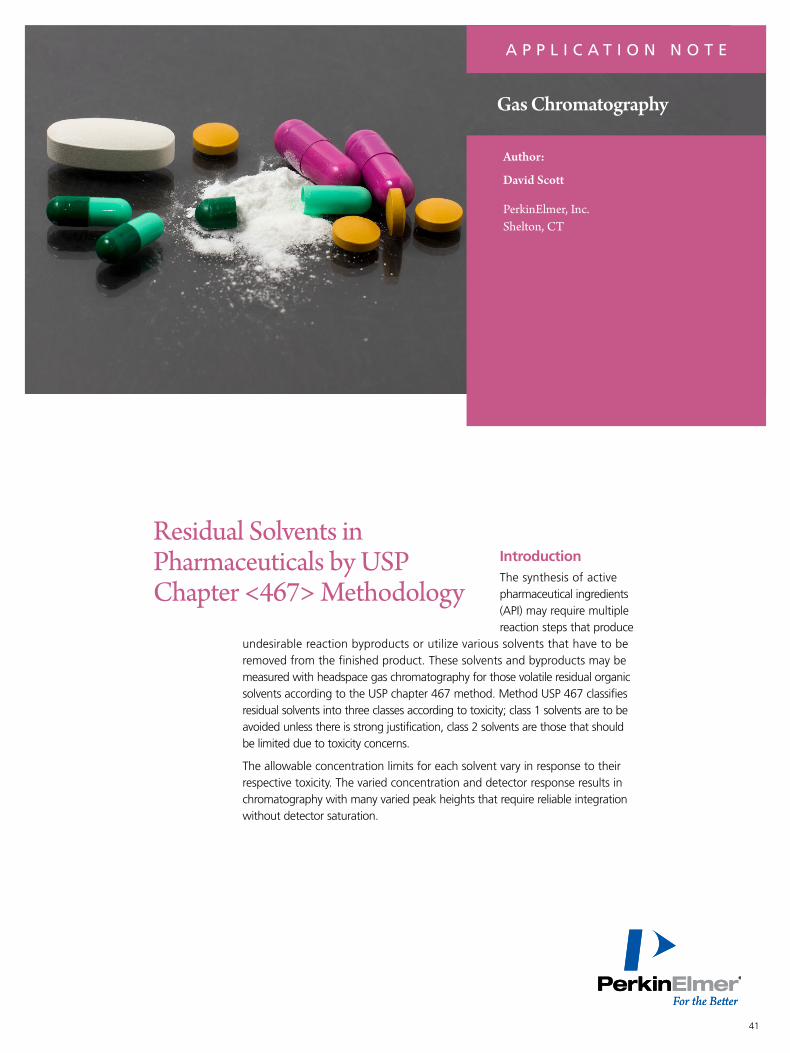
Introduction The synthesis of active pharmaceutical ingredients (API) may require multiple reaction steps that produce
undesirable reaction byproducts or utilize various solvents that have to be removed from the finished product. These solvents and byproducts may be measured with headspace gas chromatography for those volatile residual organic solvents according to the USP chapter 467 method. Method USP 467 classifies residual solvents into three classes according to toxicity; class 1 solvents are to be avoided unless there is strong justification, class 2 solvents are those that should be limited due to toxicity concerns.
The allowable concentration limits for each solvent vary in response to their respective toxicity. The varied concentration and detector response results in chromatography with many varied peak heights that require reliable integration without detector saturation.
Residual Solvents in Pharmaceuticals by USP Chapter <467> Methodology
A P P L I C A T I O N N O T E
Author:
David Scott
PerkinElmer, Inc. Shelton, CT
Gas Chromatography
41

2
Experimental A PerkinElmer Clarus® 690 gas chromatograph and TurboMatrix™ headspace sampler was used for the separation of residual solvents according to USP 467. Instrument control and data analysis was through Waters® Empower® 3 software. The headspace conditions described in Table 1 were taken from the USP method. The TurboMatrix HS is a pressure-balanced headspace sampler; the basis of sample collection in this system is a calculation of sample volume, allowing gas at a known flow rate to enter the analytical column for a specific time.
Experimental Conditions The experimental conditions for the headspace method are described in Table 1 with the new Flame Ionization Detector (FID) conditions shown in Figure 1. The new narrow jet uses less hydrogen than previous designs and the increased maximum attenuation to 64 enables the wider analytical range of the 690 series. The GC conditions are taken from the USP 467 method and are shown in Table 2.
Results Procedure A was used to identify the residual solvents in a pharmaceutical sample. In this, all solvents are initially analyzed using the G43 column and associated GC conditions. The class two solvents are subdivided into class 2A and class 2B. Class 1 analytes are prepared following procedure A in method USP 467 with sequential dilutions with a 1 mL volume of the final dilution then added to 5 mL of water in the vial as described in the method. The concern with class 1 solvents is toxicity and a S/N of greater than five is required for 1,1,1-trichloroethane with the remaining analytes having a S/N greater than three. Such calculations are achieved through the software from a selected region of noise close to the analyte of interest. The analytes are identified in Figure 2 and all exceed the SN required by the method demonstrating the new FID performance.
The additional system suitability for the method requires a resolution of greater than 1 between acetonitrile and methylene chloride. The dilutions for the class 1 solvent under USP 467 describe a dilution of 1:1000 between dilution 1 and 3. The wide range FID allows for quantification of these analytes using the maximum signal attenuation. The analysis of the class 1 standards is shown with attenuation 1 in Figure 2 and 3 and attenuation 64 in Figure 4.
Headspace Unit PerkinElmer TurboMatrix HS-40
Headspace Mode Constant
Needle Temperature 105 ̊C
Transfer Line Temperature 110 ̊C
Oven Temperature 80 ̊C
Thermostat Time 20 min
Vial Pressurization Time 1.0 min
Withdraw Time 0.1 min
Injection Time 0.04 min
Column Pressure 12 psig
Injection Pressure 15 psig
Vial Pressure 15 psig
Vial Vent On
Transfer Line Fused Silica (0.320 mm)
Table 1. Detailed Headspace Analytical Conditions.
Column 624 phase 30 M x 0.32 mm X 1.8 µm
Carrier Helium at 35 cm sec-1 split at 1:5
Capillary Injector 140 °C
FID 250 °C
GC Oven Program Initial Ramp Final
40 °C (20 min) 20 °C/min 240 °C (20 min)
Table 2. Gas Chromatograph Analytical Conditions taken from the USP 467 method.
Figure 1. New wide range Flame Ionization Detector showing air hydrogen mix and wide range attenuation.
Figure 2. Class 1 solvents with FID at attenuation 1, the analytes are present at the system suitability limit demonstrating that the S/N exceeds the method requirements.
42

3
Figure 3. Class 1 solvents with FID at attenuation 1, the first of the three dilutions is shown to demonstrate that the operational range of the FID is not easily saturated, 1,1-dichloroethene is at a concentration of 400 ppm.
Figure 4. Class 1 solvents with FID at attenuation 64 the first of the three dilutions is shown to demonstrate that the operational range of the FID is not easily saturated, 1,1-dichloroethene is at a concentration of 400 ppm.
Figure 5. Class 2A solvents at attenuation 1.
Figure 6. Class 2A solvents at attenuation 64.
The class 2A solvents are shown in Figure 5 and Figure 6 with class 2B solvents shown in Figure 8 and Figure 9.
43
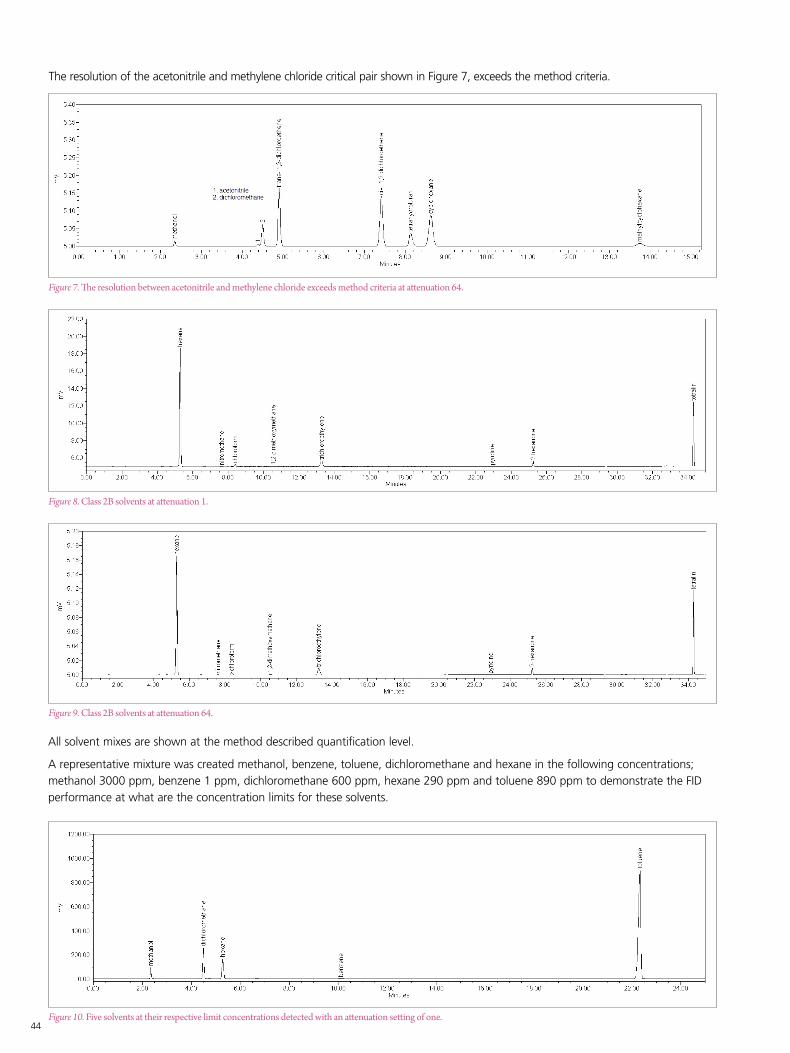
4
The resolution of the acetonitrile and methylene chloride critical pair shown in Figure 7, exceeds the method criteria.
All solvent mixes are shown at the method described quantification level.
A representative mixture was created methanol, benzene, toluene, dichloromethane and hexane in the following concentrations; methanol 3000 ppm, benzene 1 ppm, dichloromethane 600 ppm, hexane 290 ppm and toluene 890 ppm to demonstrate the FID performance at what are the concentration limits for these solvents.
Figure 7. The resolution between acetonitrile and methylene chloride exceeds method criteria at attenuation 64.
Figure 8. Class 2B solvents at attenuation 1.
Figure 9. Class 2B solvents at attenuation 64.
Figure 10. Five solvents at their respective limit concentrations detected with an attenuation setting of one.44
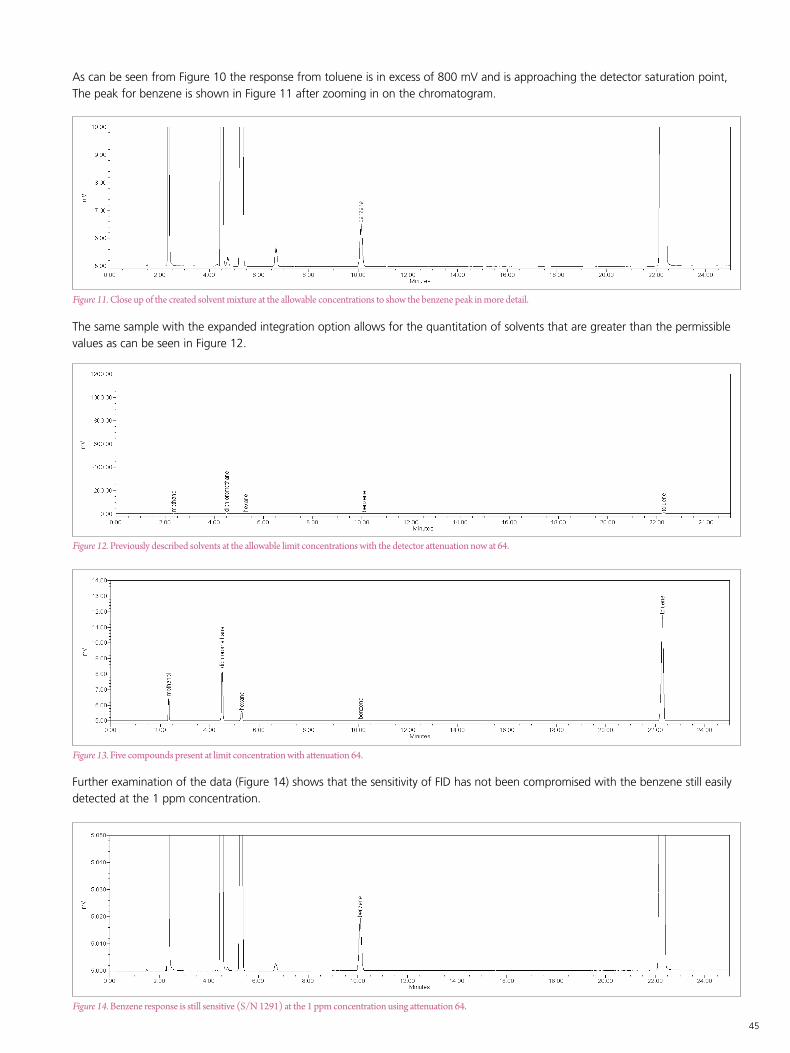
5
As can be seen from Figure 10 the response from toluene is in excess of 800 mV and is approaching the detector saturation point, The peak for benzene is shown in Figure 11 after zooming in on the chromatogram.
The same sample with the expanded integration option allows for the quantitation of solvents that are greater than the permissible values as can be seen in Figure 12.
Further examination of the data (Figure 14) shows that the sensitivity of FID has not been compromised with the benzene still easily detected at the 1 ppm concentration.
Figure 11. Close up of the created solvent mixture at the allowable concentrations to show the benzene peak in more detail.
Figure 12. Previously described solvents at the allowable limit concentrations with the detector attenuation now at 64.
Figure 13. Five compounds present at limit concentration with attenuation 64.
Figure 14. Benzene response is still sensitive (S/N 1291) at the 1 ppm concentration using attenuation 64.
45
For a complete listing of our global offices, visit www.perkinelmer.com/ContactUs
Copyright ©2017, PerkinElmer, Inc. All rights reserved. PerkinElmer® is a registered trademark of PerkinElmer, Inc. All other trademarks are the property of their respective owners. 013617A_01 PKI
PerkinElmer, Inc. 940 Winter Street Waltham, MA 02451 USA P: (800) 762-4000 or (+1) 203-925-4602www.perkinelmer.com
Conclusions
The Clarus 690 and TurboMatrix headspace autosampler exceed the requirements for USP 467 and can be fully utilized through the Waters® Empower® 3 software. The new wide range amplifier has sufficient sensitivity to satisfy the S/N requirements and a large dynamic range that reduces the need for repeat analysis of solvents of unknown concentration that could potentially saturate other detector options.

For a complete listing of our global offices, visit www.perkinelmer.com/ContactUs
Copyright ©2018-2019, PerkinElmer, Inc. All rights reserved. PerkinElmer® is a registered trademark of PerkinElmer, Inc. All other trademarks are the property of their respective owners. 014407A_01 PKI
PerkinElmer, Inc. 940 Winter Street Waltham, MA 02451 USA P: (800) 762-4000 or (+1) 203-925-4602www.perkinelmer.com